Honduran vs Macedonian 3 or more Vehicles in Household
COMPARE
Honduran
Macedonian
3 or more Vehicles in Household
3 or more Vehicles in Household Comparison
Hondurans
Macedonians
18.4%
3 OR MORE VEHICLES IN HOUSEHOLD
4.6/ 100
METRIC RATING
233rd/ 347
METRIC RANK
17.7%
3 OR MORE VEHICLES IN HOUSEHOLD
0.8/ 100
METRIC RATING
266th/ 347
METRIC RANK
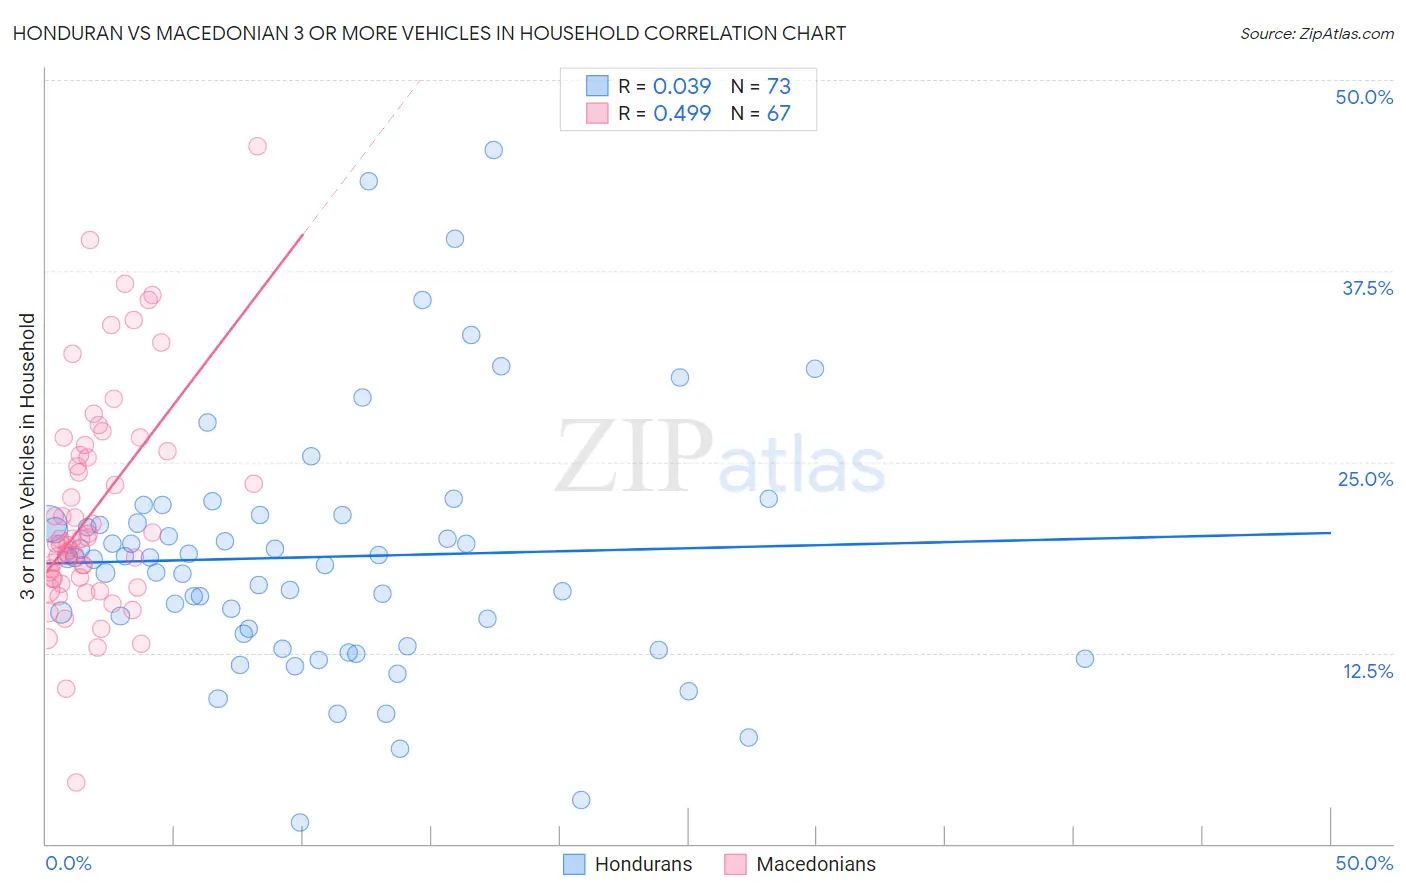
Honduran vs Macedonian 3 or more Vehicles in Household Correlation Chart
The statistical analysis conducted on geographies consisting of 357,545,810 people shows no correlation between the proportion of Hondurans and percentage of households with 3 or more vehicles available in the United States with a correlation coefficient (R) of 0.039 and weighted average of 18.4%. Similarly, the statistical analysis conducted on geographies consisting of 132,563,114 people shows a moderate positive correlation between the proportion of Macedonians and percentage of households with 3 or more vehicles available in the United States with a correlation coefficient (R) of 0.499 and weighted average of 17.7%, a difference of 3.7%.
3 or more Vehicles in Household Correlation Summary
| Measurement | Honduran | Macedonian |
| Minimum | 1.4% | 4.0% |
| Maximum | 45.5% | 45.7% |
| Range | 44.0% | 41.6% |
| Mean | 18.8% | 21.8% |
| Median | 18.7% | 19.9% |
| Interquartile 25% (IQ1) | 13.3% | 17.3% |
| Interquartile 75% (IQ3) | 21.2% | 25.7% |
| Interquartile Range (IQR) | 7.9% | 8.4% |
| Standard Deviation (Sample) | 8.2% | 7.4% |
| Standard Deviation (Population) | 8.1% | 7.3% |
Similar Demographics by 3 or more Vehicles in Household
Demographics Similar to Hondurans by 3 or more Vehicles in Household
In terms of 3 or more vehicles in household, the demographic groups most similar to Hondurans are Immigrants from Uganda (18.4%, a difference of 0.020%), Immigrants from North Macedonia (18.4%, a difference of 0.070%), Immigrants from Belgium (18.4%, a difference of 0.080%), Immigrants from Western Asia (18.4%, a difference of 0.11%), and Immigrants from Switzerland (18.4%, a difference of 0.16%).
| Demographics | Rating | Rank | 3 or more Vehicles in Household |
| Immigrants | Hungary | 5.5 /100 | #226 | Tragic 18.5% |
| Immigrants | Singapore | 5.4 /100 | #227 | Tragic 18.4% |
| Turks | 5.4 /100 | #228 | Tragic 18.4% |
| Immigrants | Switzerland | 5.0 /100 | #229 | Tragic 18.4% |
| Immigrants | Western Asia | 4.8 /100 | #230 | Tragic 18.4% |
| Immigrants | Belgium | 4.8 /100 | #231 | Tragic 18.4% |
| Immigrants | Uganda | 4.6 /100 | #232 | Tragic 18.4% |
| Hondurans | 4.6 /100 | #233 | Tragic 18.4% |
| Immigrants | North Macedonia | 4.4 /100 | #234 | Tragic 18.4% |
| Sierra Leoneans | 3.9 /100 | #235 | Tragic 18.3% |
| Immigrants | Malaysia | 3.6 /100 | #236 | Tragic 18.3% |
| Indonesians | 3.5 /100 | #237 | Tragic 18.3% |
| Immigrants | Honduras | 3.1 /100 | #238 | Tragic 18.2% |
| Immigrants | Middle Africa | 3.1 /100 | #239 | Tragic 18.2% |
| Immigrants | China | 2.9 /100 | #240 | Tragic 18.2% |
Demographics Similar to Macedonians by 3 or more Vehicles in Household
In terms of 3 or more vehicles in household, the demographic groups most similar to Macedonians are Immigrants from Panama (17.7%, a difference of 0.020%), Immigrants from Venezuela (17.7%, a difference of 0.050%), Immigrants from Bulgaria (17.7%, a difference of 0.070%), Cambodian (17.8%, a difference of 0.16%), and Bermudan (17.8%, a difference of 0.19%).
| Demographics | Rating | Rank | 3 or more Vehicles in Household |
| Uruguayans | 1.0 /100 | #259 | Tragic 17.8% |
| Ugandans | 0.9 /100 | #260 | Tragic 17.8% |
| Immigrants | Northern Africa | 0.9 /100 | #261 | Tragic 17.8% |
| Colombians | 0.9 /100 | #262 | Tragic 17.8% |
| Bermudans | 0.9 /100 | #263 | Tragic 17.8% |
| Cambodians | 0.9 /100 | #264 | Tragic 17.8% |
| Immigrants | Panama | 0.8 /100 | #265 | Tragic 17.7% |
| Macedonians | 0.8 /100 | #266 | Tragic 17.7% |
| Immigrants | Venezuela | 0.8 /100 | #267 | Tragic 17.7% |
| Immigrants | Bulgaria | 0.8 /100 | #268 | Tragic 17.7% |
| Immigrants | France | 0.6 /100 | #269 | Tragic 17.6% |
| Immigrants | Nepal | 0.6 /100 | #270 | Tragic 17.6% |
| South Americans | 0.6 /100 | #271 | Tragic 17.6% |
| Immigrants | Africa | 0.5 /100 | #272 | Tragic 17.6% |
| Immigrants | Sudan | 0.5 /100 | #273 | Tragic 17.6% |