Honduran Disability
COMPARE
Honduran
Select to Compare
Disability
Honduran Disability
11.8%
DISABILITY
31.2/ 100
METRIC RATING
183rd/ 347
METRIC RANK
Honduran Disability Correlation Chart
The statistical analysis conducted on geographies consisting of 357,777,033 people shows a slight positive correlation between the proportion of Hondurans and percentage of population with a disability in the United States with a correlation coefficient (R) of 0.086 and weighted average of 11.8%. On average, for every 1% (one percent) increase in Hondurans within a typical geography, there is an increase of 0.039% in percentage of population with a disability.
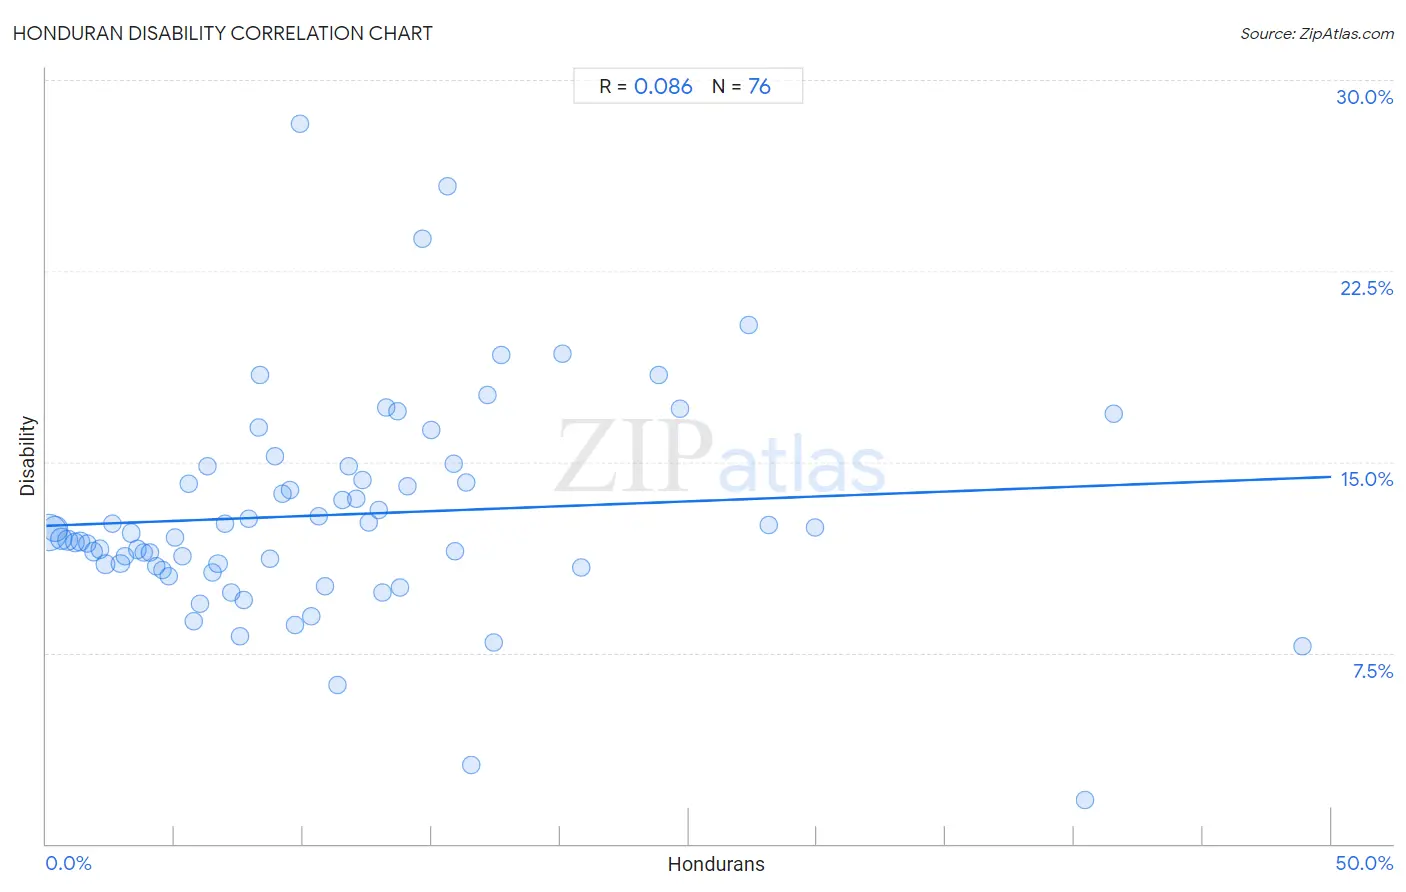
It is essential to understand that the correlation between the percentage of Hondurans and percentage of population with a disability does not imply a direct cause-and-effect relationship. It remains uncertain whether the presence of Hondurans influences an upward or downward trend in the level of percentage of population with a disability within an area, or if Hondurans simply ended up residing in those areas with higher or lower levels of percentage of population with a disability due to other factors.
Demographics Similar to Hondurans by Disability
In terms of disability, the demographic groups most similar to Hondurans are Iraqi (11.8%, a difference of 0.060%), Icelander (11.8%, a difference of 0.14%), Immigrants from Burma/Myanmar (11.8%, a difference of 0.14%), Immigrants from Oceania (11.8%, a difference of 0.15%), and Immigrants from Scotland (11.8%, a difference of 0.16%).
| Demographics | Rating | Rank | Disability |
| Immigrants from Western Africa | 47.5 /100 | #176 | Average 11.7% |
| Immigrants from Central America | 46.6 /100 | #177 | Average 11.7% |
| Greeks | 46.2 /100 | #178 | Average 11.7% |
| Immigrants from Armenia | 41.9 /100 | #179 | Average 11.7% |
| Immigrants from Honduras | 37.8 /100 | #180 | Fair 11.8% |
| Immigrants from Oceania | 34.3 /100 | #181 | Fair 11.8% |
| Icelanders | 34.0 /100 | #182 | Fair 11.8% |
| Hondurans | 31.2 /100 | #183 | Fair 11.8% |
| Iraqis | 30.0 /100 | #184 | Fair 11.8% |
| Immigrants from Burma/Myanmar | 28.5 /100 | #185 | Fair 11.8% |
| Immigrants from Scotland | 28.2 /100 | #186 | Fair 11.8% |
| Lebanese | 27.9 /100 | #187 | Fair 11.8% |
| Immigrants from Mexico | 23.8 /100 | #188 | Fair 11.9% |
| Immigrants from Zaire | 21.8 /100 | #189 | Fair 11.9% |
| Immigrants from West Indies | 21.1 /100 | #190 | Fair 11.9% |
Honduran Disability Correlation Summary
| Measurement | Honduran Data | Disability Data |
| Minimum | 0.10% | 1.7% |
| Maximum | 48.9% | 28.3% |
| Range | 48.8% | 26.6% |
| Mean | 11.3% | 12.9% |
| Median | 9.4% | 12.1% |
| Interquartile 25% (IQ1) | 4.7% | 10.9% |
| Interquartile 75% (IQ3) | 14.8% | 14.6% |
| Interquartile Range (IQR) | 10.2% | 3.7% |
| Standard Deviation (Sample) | 9.5% | 4.3% |
| Standard Deviation (Population) | 9.5% | 4.2% |
Correlation Details
| Honduran Percentile | Sample Size | Disability |
[ 0.0% - 0.5% ] 0.10% | 181,192,973 | 12.2% |
[ 0.0% - 0.5% ] 0.36% | 69,855,302 | 12.4% |
[ 0.5% - 1.0% ] 0.59% | 35,559,538 | 12.0% |
[ 0.5% - 1.0% ] 0.83% | 20,440,816 | 11.9% |
[ 1.0% - 1.5% ] 1.10% | 13,110,979 | 11.9% |
[ 1.0% - 1.5% ] 1.33% | 8,003,208 | 11.9% |
[ 1.5% - 2.0% ] 1.58% | 4,135,231 | 11.8% |
[ 1.5% - 2.0% ] 1.83% | 3,817,619 | 11.5% |
[ 2.0% - 2.5% ] 2.09% | 2,631,827 | 11.6% |
[ 2.0% - 2.5% ] 2.30% | 3,354,880 | 11.0% |
[ 2.5% - 3.0% ] 2.57% | 1,994,322 | 12.6% |
[ 2.5% - 3.0% ] 2.88% | 4,250,046 | 11.0% |
[ 3.0% - 3.5% ] 3.05% | 1,544,951 | 11.3% |
[ 3.0% - 3.5% ] 3.32% | 750,024 | 12.2% |
[ 3.5% - 4.0% ] 3.54% | 918,583 | 11.6% |
[ 3.5% - 4.0% ] 3.78% | 718,797 | 11.4% |
[ 4.0% - 4.5% ] 4.02% | 615,093 | 11.4% |
[ 4.0% - 4.5% ] 4.27% | 524,093 | 10.9% |
[ 4.5% - 5.0% ] 4.53% | 661,083 | 10.8% |
[ 4.5% - 5.0% ] 4.78% | 333,675 | 10.5% |
[ 5.0% - 5.5% ] 5.01% | 463,437 | 12.0% |
[ 5.0% - 5.5% ] 5.29% | 425,284 | 11.3% |
[ 5.5% - 6.0% ] 5.53% | 76,160 | 14.2% |
[ 5.5% - 6.0% ] 5.74% | 202,669 | 8.7% |
[ 5.5% - 6.0% ] 5.96% | 190,727 | 9.4% |
[ 6.0% - 6.5% ] 6.30% | 77,005 | 14.8% |
[ 6.0% - 6.5% ] 6.48% | 39,773 | 10.6% |
[ 6.5% - 7.0% ] 6.69% | 607,938 | 11.0% |
[ 6.5% - 7.0% ] 6.97% | 156,736 | 12.6% |
[ 7.0% - 7.5% ] 7.19% | 93,374 | 9.9% |
[ 7.5% - 8.0% ] 7.52% | 48,198 | 8.1% |
[ 7.5% - 8.0% ] 7.66% | 67,559 | 9.6% |
[ 7.5% - 8.0% ] 7.88% | 84,865 | 12.8% |
[ 8.0% - 8.5% ] 8.26% | 3,390 | 16.4% |
[ 8.0% - 8.5% ] 8.34% | 10,431 | 18.4% |
[ 8.5% - 9.0% ] 8.70% | 161 | 11.2% |
[ 8.5% - 9.0% ] 8.91% | 29,797 | 15.2% |
[ 9.0% - 9.5% ] 9.20% | 133,997 | 13.7% |
[ 9.5% - 10.0% ] 9.50% | 69,781 | 13.9% |
[ 9.5% - 10.0% ] 9.67% | 11,924 | 8.6% |
[ 9.5% - 10.0% ] 9.87% | 152 | 28.3% |
[ 10.0% - 10.5% ] 10.29% | 35,189 | 8.9% |
[ 10.5% - 11.0% ] 10.62% | 70,778 | 12.9% |
[ 10.5% - 11.0% ] 10.85% | 60,388 | 10.1% |
[ 11.0% - 11.5% ] 11.32% | 74,024 | 6.3% |
[ 11.5% - 12.0% ] 11.54% | 61,156 | 13.5% |
[ 11.5% - 12.0% ] 11.76% | 8,750 | 14.8% |
[ 12.0% - 12.5% ] 12.06% | 2,247 | 13.6% |
[ 12.0% - 12.5% ] 12.32% | 406 | 14.3% |
[ 12.5% - 13.0% ] 12.54% | 1,699 | 12.6% |
[ 12.5% - 13.0% ] 12.92% | 9,070 | 13.1% |
[ 13.0% - 13.5% ] 13.08% | 36,334 | 9.9% |
[ 13.0% - 13.5% ] 13.21% | 18,496 | 17.1% |
[ 13.5% - 14.0% ] 13.67% | 18,017 | 17.0% |
[ 13.5% - 14.0% ] 13.79% | 28,306 | 10.0% |
[ 14.0% - 14.5% ] 14.04% | 62,599 | 14.1% |
[ 14.5% - 15.0% ] 14.64% | 1,762 | 23.8% |
[ 15.0% - 15.5% ] 15.00% | 80 | 16.3% |
[ 15.5% - 16.0% ] 15.62% | 1,088 | 25.8% |
[ 15.5% - 16.0% ] 15.86% | 3,392 | 14.9% |
[ 15.5% - 16.0% ] 15.92% | 2,581 | 11.5% |
[ 16.0% - 16.5% ] 16.37% | 28,120 | 14.2% |
[ 16.5% - 17.0% ] 16.54% | 6,947 | 3.1% |
[ 17.0% - 17.5% ] 17.16% | 16,930 | 17.6% |
[ 17.0% - 17.5% ] 17.42% | 999 | 7.9% |
[ 17.5% - 18.0% ] 17.69% | 944 | 19.2% |
[ 20.0% - 20.5% ] 20.10% | 2,304 | 19.2% |
[ 20.5% - 21.0% ] 20.80% | 8,989 | 10.8% |
[ 23.5% - 24.0% ] 23.86% | 2,712 | 18.4% |
[ 24.5% - 25.0% ] 24.67% | 3,559 | 17.1% |
[ 27.0% - 27.5% ] 27.34% | 673 | 20.4% |
[ 28.0% - 28.5% ] 28.12% | 64 | 12.5% |
[ 29.5% - 30.0% ] 29.94% | 1,540 | 12.4% |
[ 40.0% - 40.5% ] 40.43% | 235 | 1.7% |
[ 41.5% - 42.0% ] 41.56% | 77 | 16.9% |
[ 48.5% - 49.0% ] 48.89% | 180 | 7.8% |