Honduran 4 or more Vehicles in Household
COMPARE
Honduran
Select to Compare
4 or more Vehicles in Household
Honduran 4 or more Vehicles in Household
6.1%
4+ VEHICLES AVAILABLE
19.3/ 100
METRIC RATING
205th/ 347
METRIC RANK
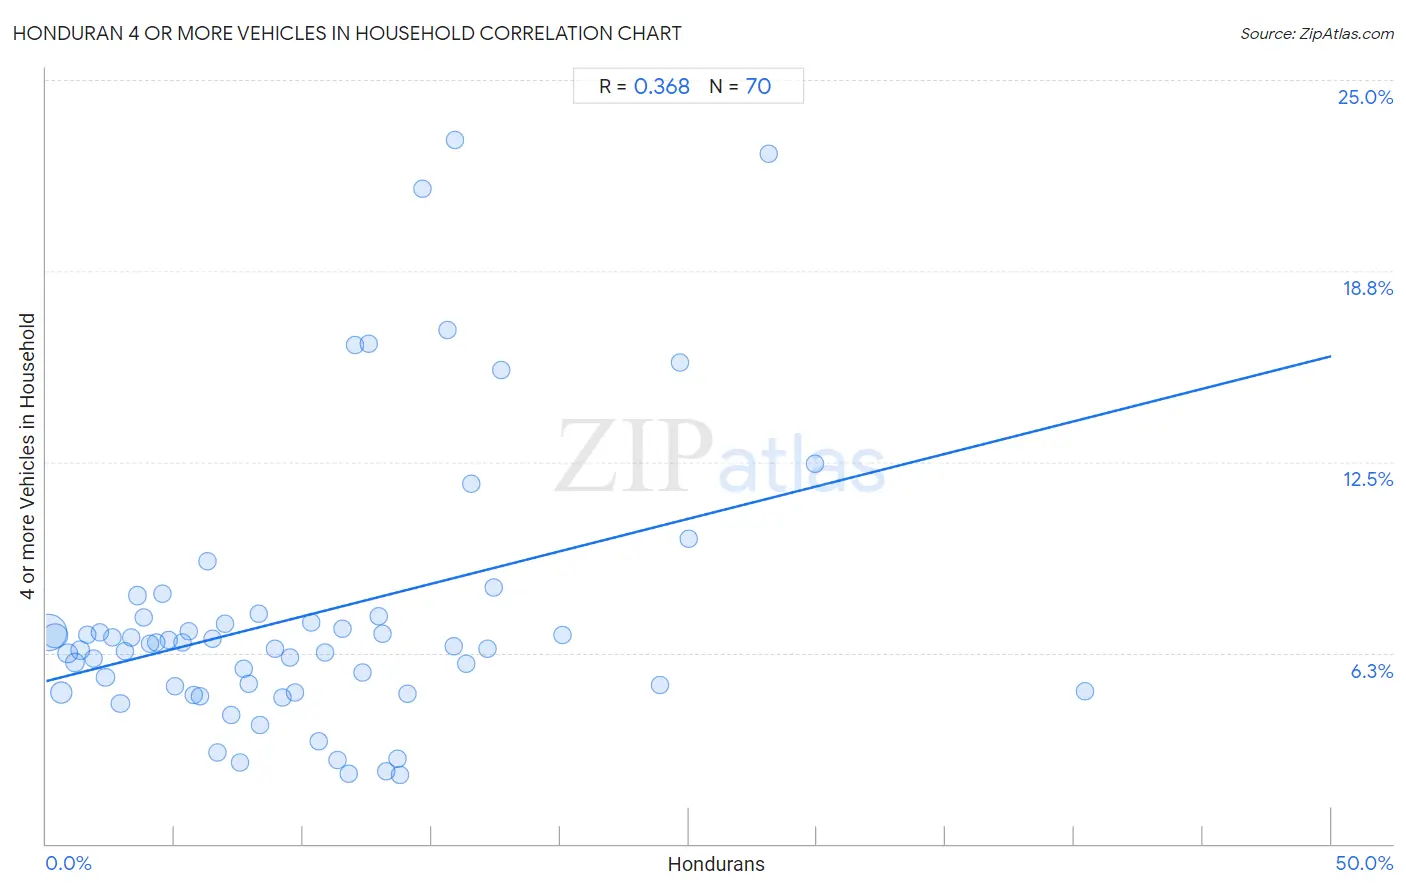
Honduran 4 or more Vehicles in Household Correlation Chart
The statistical analysis conducted on geographies consisting of 356,171,114 people shows a mild positive correlation between the proportion of Hondurans and percentage of households with 4 or more vehicles available in the United States with a correlation coefficient (R) of 0.368 and weighted average of 6.1%. On average, for every 1% (one percent) increase in Hondurans within a typical geography, there is an increase of 0.21% in percentage of households with 4 or more vehicles available.
It is essential to understand that the correlation between the percentage of Hondurans and percentage of households with 4 or more vehicles available does not imply a direct cause-and-effect relationship. It remains uncertain whether the presence of Hondurans influences an upward or downward trend in the level of percentage of households with 4 or more vehicles available within an area, or if Hondurans simply ended up residing in those areas with higher or lower levels of percentage of households with 4 or more vehicles available due to other factors.
Demographics Similar to Hondurans by 4 or more Vehicles in Household
In terms of 4 or more vehicles in household, the demographic groups most similar to Hondurans are Immigrants from Belize (6.1%, a difference of 0.090%), Kenyan (6.1%, a difference of 0.14%), Immigrants from Sierra Leone (6.1%, a difference of 0.19%), Immigrants from South Central Asia (6.1%, a difference of 0.33%), and Egyptian (6.1%, a difference of 0.34%).
| Demographics | Rating | Rank | 4 or more Vehicles in Household |
| Immigrants from Portugal | 22.3 /100 | #198 | Fair 6.1% |
| Immigrants from Norway | 21.8 /100 | #199 | Fair 6.1% |
| Latvians | 21.7 /100 | #200 | Fair 6.1% |
| Egyptians | 21.4 /100 | #201 | Fair 6.1% |
| Immigrants from South Central Asia | 21.3 /100 | #202 | Fair 6.1% |
| Immigrants from Sierra Leone | 20.5 /100 | #203 | Fair 6.1% |
| Immigrants from Belize | 19.8 /100 | #204 | Poor 6.1% |
| Hondurans | 19.3 /100 | #205 | Poor 6.1% |
| Kenyans | 18.5 /100 | #206 | Poor 6.1% |
| Immigrants from Chile | 16.9 /100 | #207 | Poor 6.1% |
| Immigrants from Nigeria | 15.6 /100 | #208 | Poor 6.1% |
| Immigrants from Honduras | 15.4 /100 | #209 | Poor 6.1% |
| Immigrants from Zimbabwe | 15.1 /100 | #210 | Poor 6.0% |
| Panamanians | 14.8 /100 | #211 | Poor 6.0% |
| Immigrants from Egypt | 14.7 /100 | #212 | Poor 6.0% |
Honduran 4 or more Vehicles in Household Correlation Summary
| Measurement | Honduran Data | 4 or more Vehicles in Household Data |
| Minimum | 0.10% | 2.2% |
| Maximum | 40.4% | 23.0% |
| Range | 40.3% | 20.8% |
| Mean | 10.1% | 7.5% |
| Median | 8.6% | 6.5% |
| Interquartile 25% (IQ1) | 4.3% | 5.0% |
| Interquartile 75% (IQ3) | 13.8% | 7.4% |
| Interquartile Range (IQR) | 9.5% | 2.4% |
| Standard Deviation (Sample) | 7.8% | 4.5% |
| Standard Deviation (Population) | 7.8% | 4.5% |
Correlation Details
| Honduran Percentile | Sample Size | 4 or more Vehicles in Household |
[ 0.0% - 0.5% ] 0.10% | 180,613,796 | 6.9% |
[ 0.0% - 0.5% ] 0.36% | 69,451,000 | 6.8% |
[ 0.5% - 1.0% ] 0.59% | 35,350,598 | 5.0% |
[ 0.5% - 1.0% ] 0.83% | 20,296,849 | 6.2% |
[ 1.0% - 1.5% ] 1.10% | 13,096,259 | 5.9% |
[ 1.0% - 1.5% ] 1.33% | 7,970,472 | 6.3% |
[ 1.5% - 2.0% ] 1.58% | 4,130,323 | 6.8% |
[ 1.5% - 2.0% ] 1.83% | 3,810,962 | 6.1% |
[ 2.0% - 2.5% ] 2.09% | 2,627,604 | 6.9% |
[ 2.0% - 2.5% ] 2.30% | 3,351,972 | 5.4% |
[ 2.5% - 3.0% ] 2.57% | 1,943,011 | 6.8% |
[ 2.5% - 3.0% ] 2.88% | 4,197,083 | 4.6% |
[ 3.0% - 3.5% ] 3.05% | 1,542,141 | 6.3% |
[ 3.0% - 3.5% ] 3.32% | 750,024 | 6.8% |
[ 3.5% - 4.0% ] 3.54% | 873,419 | 8.1% |
[ 3.5% - 4.0% ] 3.78% | 718,313 | 7.4% |
[ 4.0% - 4.5% ] 4.02% | 614,231 | 6.5% |
[ 4.0% - 4.5% ] 4.27% | 524,093 | 6.6% |
[ 4.5% - 5.0% ] 4.53% | 652,861 | 8.2% |
[ 4.5% - 5.0% ] 4.78% | 332,664 | 6.7% |
[ 5.0% - 5.5% ] 5.01% | 459,493 | 5.2% |
[ 5.0% - 5.5% ] 5.29% | 424,579 | 6.6% |
[ 5.5% - 6.0% ] 5.53% | 75,900 | 6.9% |
[ 5.5% - 6.0% ] 5.74% | 202,669 | 4.9% |
[ 5.5% - 6.0% ] 5.96% | 190,727 | 4.8% |
[ 6.0% - 6.5% ] 6.30% | 77,005 | 9.2% |
[ 6.0% - 6.5% ] 6.48% | 39,601 | 6.7% |
[ 6.5% - 7.0% ] 6.68% | 596,245 | 3.0% |
[ 6.5% - 7.0% ] 6.97% | 152,792 | 7.2% |
[ 7.0% - 7.5% ] 7.19% | 93,374 | 4.2% |
[ 7.5% - 8.0% ] 7.52% | 47,577 | 2.7% |
[ 7.5% - 8.0% ] 7.66% | 64,713 | 5.7% |
[ 7.5% - 8.0% ] 7.88% | 84,865 | 5.2% |
[ 8.0% - 8.5% ] 8.26% | 3,305 | 7.5% |
[ 8.0% - 8.5% ] 8.34% | 10,431 | 3.9% |
[ 8.5% - 9.0% ] 8.91% | 28,839 | 6.4% |
[ 9.0% - 9.5% ] 9.20% | 133,331 | 4.8% |
[ 9.5% - 10.0% ] 9.51% | 68,158 | 6.1% |
[ 9.5% - 10.0% ] 9.67% | 11,924 | 4.9% |
[ 10.0% - 10.5% ] 10.29% | 34,918 | 7.2% |
[ 10.5% - 11.0% ] 10.63% | 70,474 | 3.4% |
[ 10.5% - 11.0% ] 10.85% | 60,388 | 6.3% |
[ 11.0% - 11.5% ] 11.32% | 74,024 | 2.7% |
[ 11.5% - 12.0% ] 11.54% | 61,156 | 7.0% |
[ 11.5% - 12.0% ] 11.76% | 8,750 | 2.3% |
[ 11.5% - 12.0% ] 12.00% | 842 | 16.3% |
[ 12.0% - 12.5% ] 12.32% | 406 | 5.6% |
[ 12.5% - 13.0% ] 12.54% | 1,699 | 16.4% |
[ 12.5% - 13.0% ] 12.92% | 9,070 | 7.5% |
[ 13.0% - 13.5% ] 13.08% | 36,642 | 6.9% |
[ 13.0% - 13.5% ] 13.21% | 17,640 | 2.4% |
[ 13.5% - 14.0% ] 13.67% | 18,017 | 2.8% |
[ 13.5% - 14.0% ] 13.79% | 28,306 | 2.2% |
[ 14.0% - 14.5% ] 14.04% | 62,599 | 4.9% |
[ 14.5% - 15.0% ] 14.64% | 1,714 | 21.5% |
[ 15.5% - 16.0% ] 15.62% | 1,088 | 16.8% |
[ 15.5% - 16.0% ] 15.86% | 3,392 | 6.5% |
[ 15.5% - 16.0% ] 15.92% | 2,581 | 23.0% |
[ 16.0% - 16.5% ] 16.37% | 28,120 | 5.9% |
[ 16.5% - 17.0% ] 16.53% | 7,556 | 11.8% |
[ 17.0% - 17.5% ] 17.16% | 16,930 | 6.4% |
[ 17.0% - 17.5% ] 17.42% | 999 | 8.4% |
[ 17.5% - 18.0% ] 17.69% | 944 | 15.5% |
[ 20.0% - 20.5% ] 20.10% | 2,304 | 6.8% |
[ 23.5% - 24.0% ] 23.89% | 1,938 | 5.2% |
[ 24.5% - 25.0% ] 24.67% | 3,559 | 15.7% |
[ 25.0% - 25.5% ] 25.00% | 16 | 10.0% |
[ 28.0% - 28.5% ] 28.12% | 64 | 22.6% |
[ 29.5% - 30.0% ] 29.94% | 1,540 | 12.4% |
[ 40.0% - 40.5% ] 40.43% | 235 | 5.0% |