Honduran Married-couple Households
COMPARE
Honduran
Select to Compare
Married-couple Households
Honduran Married-couple Households
42.1%
MARRIED-COUPLE HOUSEHOLDS
0.0/ 100
METRIC RATING
290th/ 347
METRIC RANK
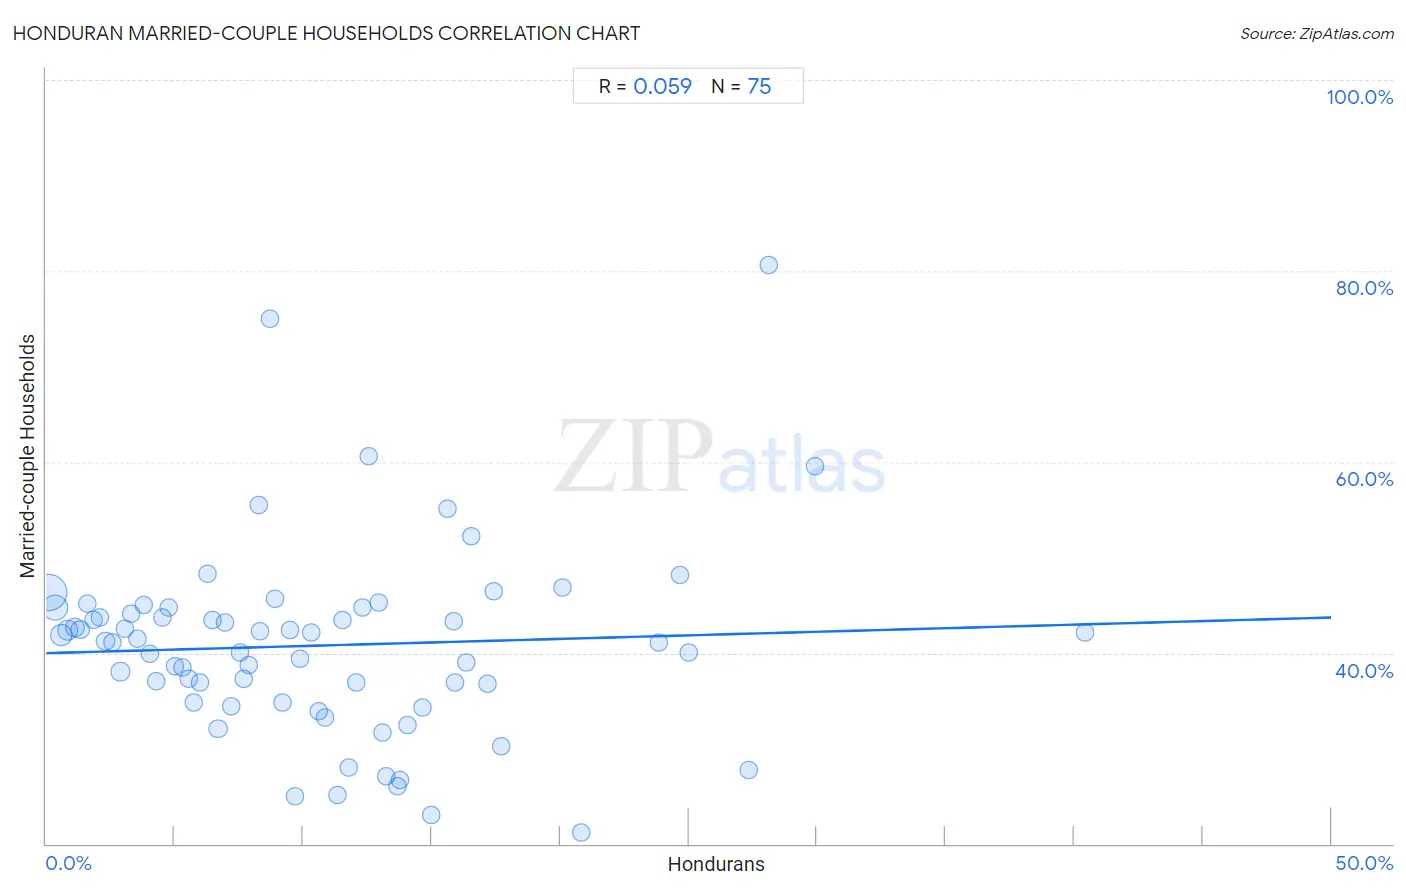
Honduran Married-couple Households Correlation Chart
The statistical analysis conducted on geographies consisting of 357,594,784 people shows a slight positive correlation between the proportion of Hondurans and percentage of married-couple family households in the United States with a correlation coefficient (R) of 0.059 and weighted average of 42.1%. On average, for every 1% (one percent) increase in Hondurans within a typical geography, there is an increase of 0.075% in percentage of married-couple family households.
It is essential to understand that the correlation between the percentage of Hondurans and percentage of married-couple family households does not imply a direct cause-and-effect relationship. It remains uncertain whether the presence of Hondurans influences an upward or downward trend in the level of percentage of married-couple family households within an area, or if Hondurans simply ended up residing in those areas with higher or lower levels of percentage of married-couple family households due to other factors.
Demographics Similar to Hondurans by Married-couple Households
In terms of married-couple households, the demographic groups most similar to Hondurans are Paiute (42.1%, a difference of 0.010%), Sudanese (42.1%, a difference of 0.050%), Indonesian (42.0%, a difference of 0.060%), Immigrants from Eritrea (42.1%, a difference of 0.11%), and Menominee (42.0%, a difference of 0.17%).
| Demographics | Rating | Rank | Married-couple Households |
| Inupiat | 0.0 /100 | #283 | Tragic 42.4% |
| Cheyenne | 0.0 /100 | #284 | Tragic 42.3% |
| Ghanaians | 0.0 /100 | #285 | Tragic 42.2% |
| Belizeans | 0.0 /100 | #286 | Tragic 42.2% |
| Chippewa | 0.0 /100 | #287 | Tragic 42.1% |
| Immigrants from Eritrea | 0.0 /100 | #288 | Tragic 42.1% |
| Sudanese | 0.0 /100 | #289 | Tragic 42.1% |
| Hondurans | 0.0 /100 | #290 | Tragic 42.1% |
| Paiute | 0.0 /100 | #291 | Tragic 42.1% |
| Indonesians | 0.0 /100 | #292 | Tragic 42.0% |
| Menominee | 0.0 /100 | #293 | Tragic 42.0% |
| Immigrants from Yemen | 0.0 /100 | #294 | Tragic 42.0% |
| Kiowa | 0.0 /100 | #295 | Tragic 42.0% |
| Immigrants from Sudan | 0.0 /100 | #296 | Tragic 41.9% |
| Arapaho | 0.0 /100 | #297 | Tragic 41.8% |
Honduran Married-couple Households Correlation Summary
| Measurement | Honduran Data | Married-couple Households Data |
| Minimum | 0.10% | 21.2% |
| Maximum | 40.4% | 80.6% |
| Range | 40.3% | 59.5% |
| Mean | 10.6% | 40.8% |
| Median | 9.2% | 41.3% |
| Interquartile 25% (IQ1) | 4.5% | 34.9% |
| Interquartile 75% (IQ3) | 14.6% | 44.7% |
| Interquartile Range (IQR) | 10.1% | 9.9% |
| Standard Deviation (Sample) | 7.9% | 10.0% |
| Standard Deviation (Population) | 7.9% | 9.9% |
Correlation Details
| Honduran Percentile | Sample Size | Married-couple Households |
[ 0.0% - 0.5% ] 0.10% | 181,102,729 | 46.3% |
[ 0.0% - 0.5% ] 0.36% | 69,804,240 | 44.8% |
[ 0.5% - 1.0% ] 0.59% | 35,539,866 | 41.8% |
[ 0.5% - 1.0% ] 0.83% | 20,428,355 | 42.3% |
[ 1.0% - 1.5% ] 1.10% | 13,108,839 | 42.7% |
[ 1.0% - 1.5% ] 1.33% | 8,001,147 | 42.4% |
[ 1.5% - 2.0% ] 1.58% | 4,130,968 | 45.2% |
[ 1.5% - 2.0% ] 1.83% | 3,816,861 | 43.5% |
[ 2.0% - 2.5% ] 2.09% | 2,631,827 | 43.7% |
[ 2.0% - 2.5% ] 2.30% | 3,354,880 | 41.3% |
[ 2.5% - 3.0% ] 2.57% | 1,994,322 | 41.1% |
[ 2.5% - 3.0% ] 2.88% | 4,250,046 | 38.0% |
[ 3.0% - 3.5% ] 3.05% | 1,544,687 | 42.6% |
[ 3.0% - 3.5% ] 3.32% | 750,024 | 44.1% |
[ 3.5% - 4.0% ] 3.54% | 918,583 | 41.5% |
[ 3.5% - 4.0% ] 3.78% | 718,797 | 45.0% |
[ 4.0% - 4.5% ] 4.02% | 615,093 | 39.9% |
[ 4.0% - 4.5% ] 4.27% | 524,093 | 37.0% |
[ 4.5% - 5.0% ] 4.53% | 661,083 | 43.7% |
[ 4.5% - 5.0% ] 4.78% | 333,675 | 44.7% |
[ 5.0% - 5.5% ] 5.01% | 463,437 | 38.6% |
[ 5.0% - 5.5% ] 5.29% | 425,284 | 38.5% |
[ 5.5% - 6.0% ] 5.53% | 76,160 | 37.2% |
[ 5.5% - 6.0% ] 5.74% | 202,669 | 34.8% |
[ 5.5% - 6.0% ] 5.96% | 190,727 | 37.0% |
[ 6.0% - 6.5% ] 6.30% | 77,005 | 48.2% |
[ 6.0% - 6.5% ] 6.48% | 39,773 | 43.4% |
[ 6.5% - 7.0% ] 6.69% | 607,938 | 32.1% |
[ 6.5% - 7.0% ] 6.97% | 156,736 | 43.1% |
[ 7.0% - 7.5% ] 7.19% | 93,374 | 34.5% |
[ 7.5% - 8.0% ] 7.52% | 48,198 | 40.0% |
[ 7.5% - 8.0% ] 7.66% | 67,559 | 37.3% |
[ 7.5% - 8.0% ] 7.88% | 84,865 | 38.8% |
[ 8.0% - 8.5% ] 8.26% | 3,390 | 55.5% |
[ 8.0% - 8.5% ] 8.34% | 10,431 | 42.3% |
[ 8.5% - 9.0% ] 8.70% | 161 | 75.0% |
[ 8.5% - 9.0% ] 8.91% | 29,797 | 45.7% |
[ 9.0% - 9.5% ] 9.20% | 133,997 | 34.9% |
[ 9.5% - 10.0% ] 9.50% | 69,781 | 42.4% |
[ 9.5% - 10.0% ] 9.67% | 11,924 | 25.0% |
[ 9.5% - 10.0% ] 9.87% | 152 | 39.4% |
[ 10.0% - 10.5% ] 10.29% | 35,189 | 42.1% |
[ 10.5% - 11.0% ] 10.62% | 70,778 | 33.9% |
[ 10.5% - 11.0% ] 10.85% | 60,388 | 33.3% |
[ 11.0% - 11.5% ] 11.32% | 74,024 | 25.2% |
[ 11.5% - 12.0% ] 11.54% | 61,156 | 43.5% |
[ 11.5% - 12.0% ] 11.76% | 8,750 | 28.0% |
[ 12.0% - 12.5% ] 12.06% | 2,247 | 36.8% |
[ 12.0% - 12.5% ] 12.32% | 406 | 44.7% |
[ 12.5% - 13.0% ] 12.54% | 1,699 | 60.5% |
[ 12.5% - 13.0% ] 12.92% | 9,070 | 45.3% |
[ 13.0% - 13.5% ] 13.08% | 36,642 | 31.7% |
[ 13.0% - 13.5% ] 13.21% | 18,496 | 27.1% |
[ 13.5% - 14.0% ] 13.67% | 18,017 | 26.0% |
[ 13.5% - 14.0% ] 13.79% | 28,306 | 26.6% |
[ 14.0% - 14.5% ] 14.04% | 62,599 | 32.4% |
[ 14.5% - 15.0% ] 14.64% | 1,762 | 34.3% |
[ 15.0% - 15.5% ] 15.00% | 80 | 23.1% |
[ 15.5% - 16.0% ] 15.62% | 1,088 | 55.1% |
[ 15.5% - 16.0% ] 15.86% | 3,392 | 43.3% |
[ 15.5% - 16.0% ] 15.92% | 2,581 | 36.8% |
[ 16.0% - 16.5% ] 16.37% | 28,120 | 39.0% |
[ 16.5% - 17.0% ] 16.53% | 7,556 | 52.2% |
[ 17.0% - 17.5% ] 17.16% | 16,930 | 36.8% |
[ 17.0% - 17.5% ] 17.42% | 999 | 46.4% |
[ 17.5% - 18.0% ] 17.69% | 944 | 30.2% |
[ 20.0% - 20.5% ] 20.10% | 2,304 | 46.9% |
[ 20.5% - 21.0% ] 20.80% | 8,989 | 21.2% |
[ 23.5% - 24.0% ] 23.86% | 2,712 | 41.1% |
[ 24.5% - 25.0% ] 24.67% | 3,559 | 48.1% |
[ 25.0% - 25.5% ] 25.00% | 16 | 40.0% |
[ 27.0% - 27.5% ] 27.34% | 673 | 27.7% |
[ 28.0% - 28.5% ] 28.12% | 64 | 80.6% |
[ 29.5% - 30.0% ] 29.94% | 1,540 | 59.5% |
[ 40.0% - 40.5% ] 40.43% | 235 | 42.1% |