Honduran 1 or more Vehicles in Household
COMPARE
Honduran
Select to Compare
1 or more Vehicles in Household
Honduran 1 or more Vehicles in Household
88.1%
1+ VEHICLES AVAILABLE
1.0/ 100
METRIC RATING
253rd/ 347
METRIC RANK
Honduran 1 or more Vehicles in Household Correlation Chart
The statistical analysis conducted on geographies consisting of 357,633,161 people shows a slight negative correlation between the proportion of Hondurans and percentage of households with 1 or more vehicles available in the United States with a correlation coefficient (R) of -0.077 and weighted average of 88.1%. On average, for every 1% (one percent) increase in Hondurans within a typical geography, there is a decrease of 0.059% in percentage of households with 1 or more vehicles available.
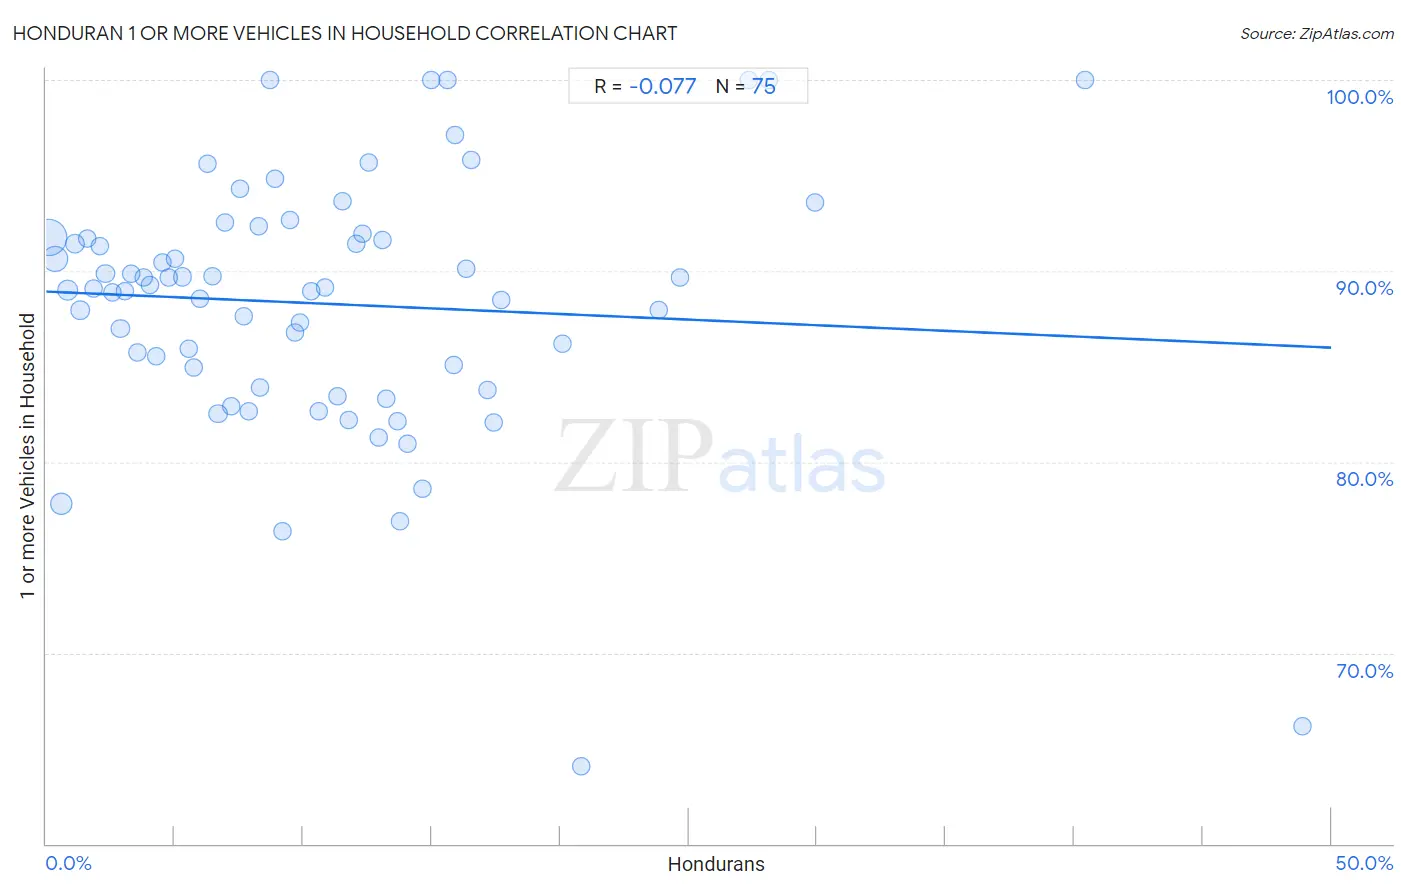
It is essential to understand that the correlation between the percentage of Hondurans and percentage of households with 1 or more vehicles available does not imply a direct cause-and-effect relationship. It remains uncertain whether the presence of Hondurans influences an upward or downward trend in the level of percentage of households with 1 or more vehicles available within an area, or if Hondurans simply ended up residing in those areas with higher or lower levels of percentage of households with 1 or more vehicles available due to other factors.
Demographics Similar to Hondurans by 1 or more Vehicles in Household
In terms of 1 or more vehicles in household, the demographic groups most similar to Hondurans are Haitian (88.1%, a difference of 0.010%), Immigrants from Uruguay (88.1%, a difference of 0.030%), Immigrants from Latvia (88.1%, a difference of 0.030%), Colombian (88.0%, a difference of 0.040%), and Liberian (88.0%, a difference of 0.040%).
| Demographics | Rating | Rank | 1 or more Vehicles in Household |
| Menominee | 1.9 /100 | #246 | Tragic 88.3% |
| Immigrants from Honduras | 1.7 /100 | #247 | Tragic 88.3% |
| Immigrants from Nigeria | 1.5 /100 | #248 | Tragic 88.2% |
| Blacks/African Americans | 1.4 /100 | #249 | Tragic 88.2% |
| Egyptians | 1.2 /100 | #250 | Tragic 88.2% |
| Immigrants from Serbia | 1.2 /100 | #251 | Tragic 88.2% |
| Immigrants from Uruguay | 1.1 /100 | #252 | Tragic 88.1% |
| Hondurans | 1.0 /100 | #253 | Tragic 88.1% |
| Haitians | 0.9 /100 | #254 | Tragic 88.1% |
| Immigrants from Latvia | 0.9 /100 | #255 | Tragic 88.1% |
| Colombians | 0.9 /100 | #256 | Tragic 88.0% |
| Liberians | 0.9 /100 | #257 | Tragic 88.0% |
| South American Indians | 0.9 /100 | #258 | Tragic 88.0% |
| Nigerians | 0.8 /100 | #259 | Tragic 88.0% |
| Macedonians | 0.6 /100 | #260 | Tragic 87.9% |
Honduran 1 or more Vehicles in Household Correlation Summary
| Measurement | Honduran Data | 1 or more Vehicles in Household Data |
| Minimum | 0.10% | 64.1% |
| Maximum | 48.9% | 100.0% |
| Range | 48.8% | 35.9% |
| Mean | 10.9% | 88.3% |
| Median | 9.2% | 89.1% |
| Interquartile 25% (IQ1) | 4.5% | 83.9% |
| Interquartile 75% (IQ3) | 14.6% | 91.7% |
| Interquartile Range (IQR) | 10.1% | 7.8% |
| Standard Deviation (Sample) | 8.9% | 6.8% |
| Standard Deviation (Population) | 8.9% | 6.7% |
Correlation Details
| Honduran Percentile | Sample Size | 1 or more Vehicles in Household |
[ 0.0% - 0.5% ] 0.10% | 181,109,324 | 91.7% |
[ 0.0% - 0.5% ] 0.36% | 69,816,302 | 90.7% |
[ 0.5% - 1.0% ] 0.59% | 35,548,476 | 77.8% |
[ 0.5% - 1.0% ] 0.83% | 20,438,318 | 89.0% |
[ 1.0% - 1.5% ] 1.10% | 13,108,839 | 91.4% |
[ 1.0% - 1.5% ] 1.33% | 8,001,224 | 88.0% |
[ 1.5% - 2.0% ] 1.58% | 4,130,968 | 91.7% |
[ 1.5% - 2.0% ] 1.83% | 3,816,861 | 89.1% |
[ 2.0% - 2.5% ] 2.09% | 2,631,827 | 91.3% |
[ 2.0% - 2.5% ] 2.30% | 3,354,880 | 89.9% |
[ 2.5% - 3.0% ] 2.57% | 1,994,322 | 88.9% |
[ 2.5% - 3.0% ] 2.88% | 4,250,046 | 87.0% |
[ 3.0% - 3.5% ] 3.05% | 1,544,951 | 88.9% |
[ 3.0% - 3.5% ] 3.32% | 750,024 | 89.9% |
[ 3.5% - 4.0% ] 3.54% | 919,225 | 85.7% |
[ 3.5% - 4.0% ] 3.78% | 718,797 | 89.6% |
[ 4.0% - 4.5% ] 4.02% | 615,093 | 89.2% |
[ 4.0% - 4.5% ] 4.27% | 524,093 | 85.6% |
[ 4.5% - 5.0% ] 4.53% | 661,083 | 90.4% |
[ 4.5% - 5.0% ] 4.78% | 333,675 | 89.6% |
[ 5.0% - 5.5% ] 5.01% | 463,437 | 90.6% |
[ 5.0% - 5.5% ] 5.29% | 425,284 | 89.7% |
[ 5.5% - 6.0% ] 5.53% | 76,160 | 85.9% |
[ 5.5% - 6.0% ] 5.74% | 202,669 | 85.0% |
[ 5.5% - 6.0% ] 5.96% | 190,727 | 88.6% |
[ 6.0% - 6.5% ] 6.30% | 77,005 | 95.6% |
[ 6.0% - 6.5% ] 6.48% | 39,773 | 89.7% |
[ 6.5% - 7.0% ] 6.69% | 607,938 | 82.5% |
[ 6.5% - 7.0% ] 6.97% | 156,736 | 92.5% |
[ 7.0% - 7.5% ] 7.19% | 93,374 | 82.9% |
[ 7.5% - 8.0% ] 7.52% | 48,198 | 94.3% |
[ 7.5% - 8.0% ] 7.66% | 67,559 | 87.7% |
[ 7.5% - 8.0% ] 7.88% | 84,865 | 82.6% |
[ 8.0% - 8.5% ] 8.26% | 3,390 | 92.3% |
[ 8.0% - 8.5% ] 8.34% | 10,431 | 83.9% |
[ 8.5% - 9.0% ] 8.70% | 161 | 100.0% |
[ 8.5% - 9.0% ] 8.91% | 29,797 | 94.8% |
[ 9.0% - 9.5% ] 9.20% | 133,997 | 76.4% |
[ 9.5% - 10.0% ] 9.50% | 69,781 | 92.7% |
[ 9.5% - 10.0% ] 9.67% | 11,924 | 86.7% |
[ 9.5% - 10.0% ] 9.87% | 152 | 87.3% |
[ 10.0% - 10.5% ] 10.29% | 35,189 | 88.9% |
[ 10.5% - 11.0% ] 10.62% | 70,778 | 82.7% |
[ 10.5% - 11.0% ] 10.85% | 60,388 | 89.1% |
[ 11.0% - 11.5% ] 11.32% | 74,024 | 83.4% |
[ 11.5% - 12.0% ] 11.54% | 61,156 | 93.6% |
[ 11.5% - 12.0% ] 11.76% | 8,750 | 82.2% |
[ 12.0% - 12.5% ] 12.06% | 2,247 | 91.4% |
[ 12.0% - 12.5% ] 12.32% | 406 | 91.9% |
[ 12.5% - 13.0% ] 12.54% | 1,699 | 95.7% |
[ 12.5% - 13.0% ] 12.92% | 9,070 | 81.3% |
[ 13.0% - 13.5% ] 13.08% | 36,642 | 91.6% |
[ 13.0% - 13.5% ] 13.21% | 18,496 | 83.3% |
[ 13.5% - 14.0% ] 13.67% | 18,017 | 82.1% |
[ 13.5% - 14.0% ] 13.79% | 28,306 | 76.9% |
[ 14.0% - 14.5% ] 14.04% | 62,599 | 81.0% |
[ 14.5% - 15.0% ] 14.64% | 1,762 | 78.6% |
[ 15.0% - 15.5% ] 15.00% | 80 | 100.0% |
[ 15.5% - 16.0% ] 15.62% | 1,088 | 100.0% |
[ 15.5% - 16.0% ] 15.86% | 3,392 | 85.0% |
[ 15.5% - 16.0% ] 15.92% | 2,581 | 97.1% |
[ 16.0% - 16.5% ] 16.37% | 28,120 | 90.1% |
[ 16.5% - 17.0% ] 16.53% | 7,556 | 95.8% |
[ 17.0% - 17.5% ] 17.16% | 16,930 | 83.8% |
[ 17.0% - 17.5% ] 17.42% | 999 | 82.1% |
[ 17.5% - 18.0% ] 17.69% | 944 | 88.5% |
[ 20.0% - 20.5% ] 20.10% | 2,304 | 86.2% |
[ 20.5% - 21.0% ] 20.80% | 8,989 | 64.1% |
[ 23.5% - 24.0% ] 23.86% | 2,712 | 88.0% |
[ 24.5% - 25.0% ] 24.67% | 3,559 | 89.6% |
[ 27.0% - 27.5% ] 27.34% | 673 | 100.0% |
[ 28.0% - 28.5% ] 28.12% | 64 | 100.0% |
[ 29.5% - 30.0% ] 29.94% | 1,540 | 93.6% |
[ 40.0% - 40.5% ] 40.43% | 235 | 100.0% |
[ 48.5% - 49.0% ] 48.89% | 180 | 66.2% |