Honduran vs Pima 3 or more Vehicles in Household
COMPARE
Honduran
Pima
3 or more Vehicles in Household
3 or more Vehicles in Household Comparison
Hondurans
Pima
18.4%
3 OR MORE VEHICLES IN HOUSEHOLD
4.6/ 100
METRIC RATING
233rd/ 347
METRIC RANK
22.0%
3 OR MORE VEHICLES IN HOUSEHOLD
99.9/ 100
METRIC RATING
65th/ 347
METRIC RANK
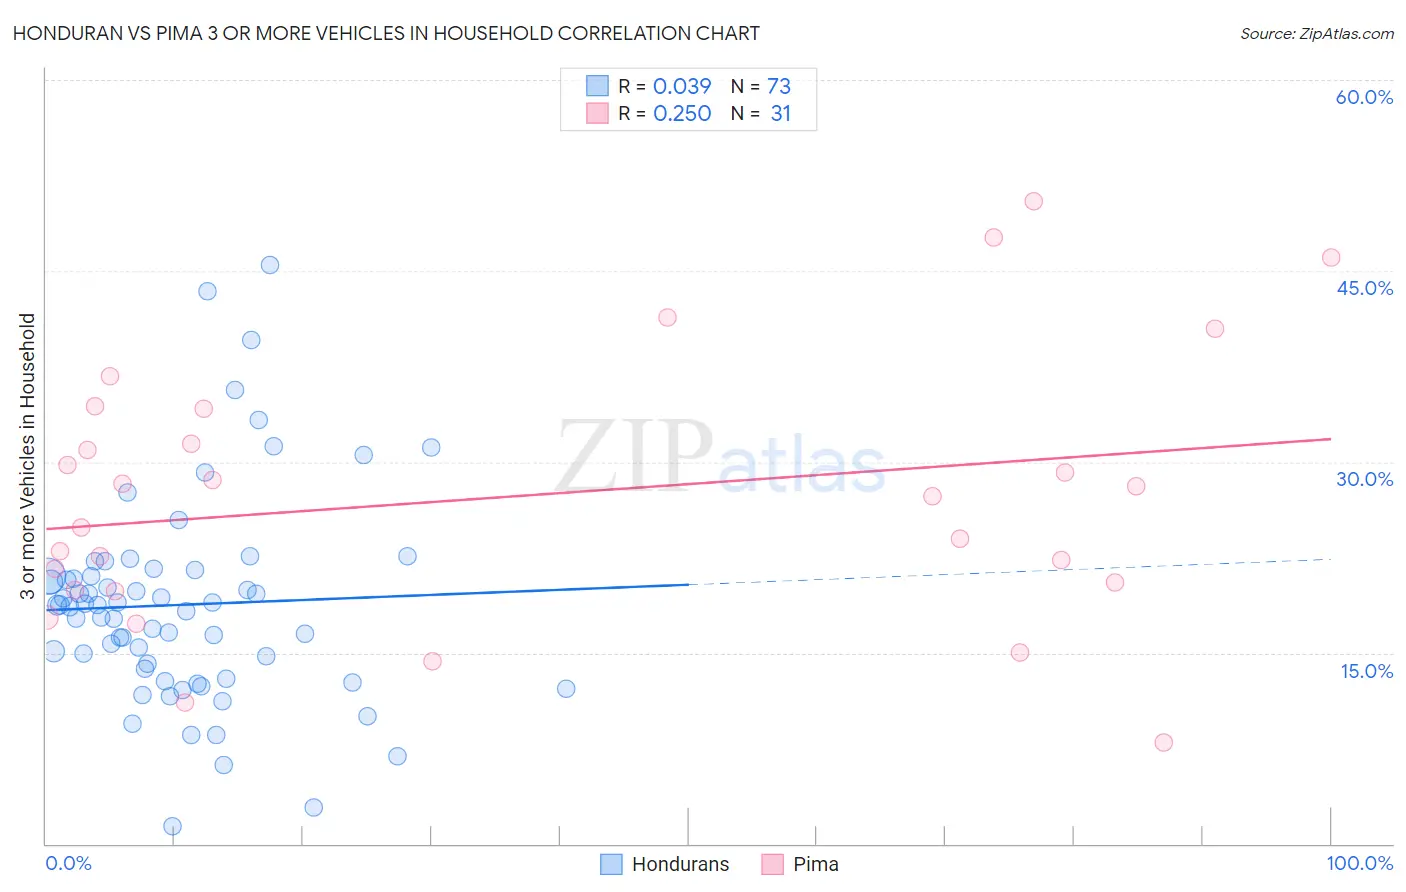
Honduran vs Pima 3 or more Vehicles in Household Correlation Chart
The statistical analysis conducted on geographies consisting of 357,545,810 people shows no correlation between the proportion of Hondurans and percentage of households with 3 or more vehicles available in the United States with a correlation coefficient (R) of 0.039 and weighted average of 18.4%. Similarly, the statistical analysis conducted on geographies consisting of 61,538,722 people shows a weak positive correlation between the proportion of Pima and percentage of households with 3 or more vehicles available in the United States with a correlation coefficient (R) of 0.250 and weighted average of 22.0%, a difference of 19.9%.
3 or more Vehicles in Household Correlation Summary
| Measurement | Honduran | Pima |
| Minimum | 1.4% | 8.0% |
| Maximum | 45.5% | 50.5% |
| Range | 44.0% | 42.6% |
| Mean | 18.8% | 27.3% |
| Median | 18.7% | 27.3% |
| Interquartile 25% (IQ1) | 13.3% | 20.0% |
| Interquartile 75% (IQ3) | 21.2% | 34.1% |
| Interquartile Range (IQR) | 7.9% | 14.2% |
| Standard Deviation (Sample) | 8.2% | 10.5% |
| Standard Deviation (Population) | 8.1% | 10.3% |
Similar Demographics by 3 or more Vehicles in Household
Demographics Similar to Hondurans by 3 or more Vehicles in Household
In terms of 3 or more vehicles in household, the demographic groups most similar to Hondurans are Immigrants from Uganda (18.4%, a difference of 0.020%), Immigrants from North Macedonia (18.4%, a difference of 0.070%), Immigrants from Belgium (18.4%, a difference of 0.080%), Immigrants from Western Asia (18.4%, a difference of 0.11%), and Immigrants from Switzerland (18.4%, a difference of 0.16%).
| Demographics | Rating | Rank | 3 or more Vehicles in Household |
| Immigrants | Hungary | 5.5 /100 | #226 | Tragic 18.5% |
| Immigrants | Singapore | 5.4 /100 | #227 | Tragic 18.4% |
| Turks | 5.4 /100 | #228 | Tragic 18.4% |
| Immigrants | Switzerland | 5.0 /100 | #229 | Tragic 18.4% |
| Immigrants | Western Asia | 4.8 /100 | #230 | Tragic 18.4% |
| Immigrants | Belgium | 4.8 /100 | #231 | Tragic 18.4% |
| Immigrants | Uganda | 4.6 /100 | #232 | Tragic 18.4% |
| Hondurans | 4.6 /100 | #233 | Tragic 18.4% |
| Immigrants | North Macedonia | 4.4 /100 | #234 | Tragic 18.4% |
| Sierra Leoneans | 3.9 /100 | #235 | Tragic 18.3% |
| Immigrants | Malaysia | 3.6 /100 | #236 | Tragic 18.3% |
| Indonesians | 3.5 /100 | #237 | Tragic 18.3% |
| Immigrants | Honduras | 3.1 /100 | #238 | Tragic 18.2% |
| Immigrants | Middle Africa | 3.1 /100 | #239 | Tragic 18.2% |
| Immigrants | China | 2.9 /100 | #240 | Tragic 18.2% |
Demographics Similar to Pima by 3 or more Vehicles in Household
In terms of 3 or more vehicles in household, the demographic groups most similar to Pima are Northern European (22.0%, a difference of 0.14%), Alaskan Athabascan (21.9%, a difference of 0.40%), Immigrants from Taiwan (22.1%, a difference of 0.42%), British (21.9%, a difference of 0.55%), and Creek (21.9%, a difference of 0.58%).
| Demographics | Rating | Rank | 3 or more Vehicles in Household |
| Spaniards | 100.0 /100 | #58 | Exceptional 22.3% |
| Navajo | 100.0 /100 | #59 | Exceptional 22.3% |
| Finns | 99.9 /100 | #60 | Exceptional 22.3% |
| Bhutanese | 99.9 /100 | #61 | Exceptional 22.2% |
| Fijians | 99.9 /100 | #62 | Exceptional 22.2% |
| Chickasaw | 99.9 /100 | #63 | Exceptional 22.2% |
| Immigrants | Taiwan | 99.9 /100 | #64 | Exceptional 22.1% |
| Pima | 99.9 /100 | #65 | Exceptional 22.0% |
| Northern Europeans | 99.9 /100 | #66 | Exceptional 22.0% |
| Alaskan Athabascans | 99.9 /100 | #67 | Exceptional 21.9% |
| British | 99.9 /100 | #68 | Exceptional 21.9% |
| Creek | 99.9 /100 | #69 | Exceptional 21.9% |
| Bangladeshis | 99.8 /100 | #70 | Exceptional 21.9% |
| Potawatomi | 99.8 /100 | #71 | Exceptional 21.9% |
| Portuguese | 99.8 /100 | #72 | Exceptional 21.8% |