Honduran Disability Age 5 to 17
COMPARE
Honduran
Select to Compare
Disability Age 5 to 17
Honduran Disability Age 5 to 17
5.9%
DISABILITY | AGE 5 TO 17
1.5/ 100
METRIC RATING
252nd/ 347
METRIC RANK
Honduran Disability Age 5 to 17 Correlation Chart
The statistical analysis conducted on geographies consisting of 355,946,713 people shows a mild positive correlation between the proportion of Hondurans and percentage of population with a disability between the ages 5 and 17 in the United States with a correlation coefficient (R) of 0.393 and weighted average of 5.9%. On average, for every 1% (one percent) increase in Hondurans within a typical geography, there is an increase of 0.31% in percentage of population with a disability between the ages 5 and 17.
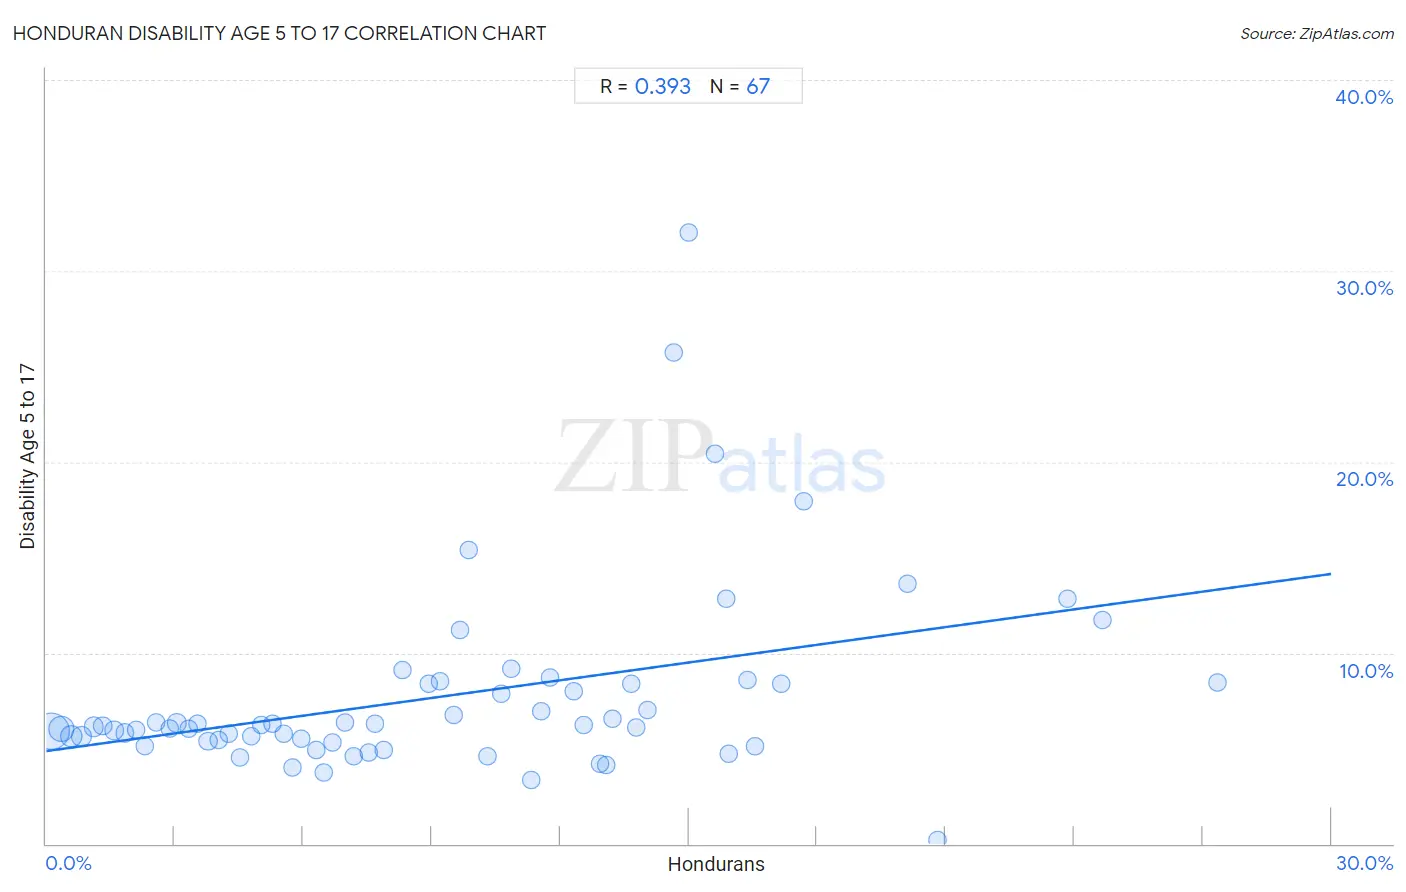
It is essential to understand that the correlation between the percentage of Hondurans and percentage of population with a disability between the ages 5 and 17 does not imply a direct cause-and-effect relationship. It remains uncertain whether the presence of Hondurans influences an upward or downward trend in the level of percentage of population with a disability between the ages 5 and 17 within an area, or if Hondurans simply ended up residing in those areas with higher or lower levels of percentage of population with a disability between the ages 5 and 17 due to other factors.
Demographics Similar to Hondurans by Disability Age 5 to 17
In terms of disability age 5 to 17, the demographic groups most similar to Hondurans are Immigrants from Cambodia (5.9%, a difference of 0.020%), Polish (5.9%, a difference of 0.040%), Scandinavian (5.9%, a difference of 0.070%), Immigrants from Ghana (5.9%, a difference of 0.16%), and Barbadian (5.9%, a difference of 0.17%).
| Demographics | Rating | Rank | Disability Age 5 to 17 |
| Immigrants from Micronesia | 1.9 /100 | #245 | Tragic 5.9% |
| Tlingit-Haida | 1.9 /100 | #246 | Tragic 5.9% |
| Immigrants from Honduras | 1.8 /100 | #247 | Tragic 5.9% |
| British | 1.7 /100 | #248 | Tragic 5.9% |
| Immigrants from Ghana | 1.7 /100 | #249 | Tragic 5.9% |
| Poles | 1.5 /100 | #250 | Tragic 5.9% |
| Immigrants from Cambodia | 1.5 /100 | #251 | Tragic 5.9% |
| Hondurans | 1.5 /100 | #252 | Tragic 5.9% |
| Scandinavians | 1.4 /100 | #253 | Tragic 5.9% |
| Barbadians | 1.3 /100 | #254 | Tragic 5.9% |
| Italians | 1.2 /100 | #255 | Tragic 5.9% |
| Hopi | 1.0 /100 | #256 | Tragic 5.9% |
| Hispanics or Latinos | 1.0 /100 | #257 | Tragic 5.9% |
| Brazilians | 0.9 /100 | #258 | Tragic 5.9% |
| Slavs | 0.9 /100 | #259 | Tragic 5.9% |
Honduran Disability Age 5 to 17 Correlation Summary
| Measurement | Honduran Data | Disability Age 5 to 17 Data |
| Minimum | 0.10% | 0.17% |
| Maximum | 27.3% | 32.0% |
| Range | 27.2% | 31.8% |
| Mean | 9.3% | 7.7% |
| Median | 8.3% | 6.2% |
| Interquartile 25% (IQ1) | 4.0% | 5.4% |
| Interquartile 75% (IQ3) | 13.7% | 8.4% |
| Interquartile Range (IQR) | 9.7% | 3.0% |
| Standard Deviation (Sample) | 6.4% | 5.0% |
| Standard Deviation (Population) | 6.3% | 5.0% |
Correlation Details
| Honduran Percentile | Sample Size | Disability Age 5 to 17 |
[ 0.0% - 0.5% ] 0.10% | 180,543,163 | 5.9% |
[ 0.0% - 0.5% ] 0.36% | 69,504,643 | 6.0% |
[ 0.5% - 1.0% ] 0.59% | 35,326,937 | 5.6% |
[ 0.5% - 1.0% ] 0.83% | 20,282,797 | 5.6% |
[ 1.0% - 1.5% ] 1.10% | 13,040,559 | 6.1% |
[ 1.0% - 1.5% ] 1.33% | 7,914,964 | 6.2% |
[ 1.5% - 2.0% ] 1.58% | 4,059,202 | 5.9% |
[ 1.5% - 2.0% ] 1.83% | 3,782,137 | 5.8% |
[ 2.0% - 2.5% ] 2.09% | 2,612,315 | 6.0% |
[ 2.0% - 2.5% ] 2.30% | 3,343,110 | 5.1% |
[ 2.5% - 3.0% ] 2.57% | 1,975,249 | 6.4% |
[ 2.5% - 3.0% ] 2.88% | 4,232,120 | 6.0% |
[ 3.0% - 3.5% ] 3.05% | 1,533,472 | 6.3% |
[ 3.0% - 3.5% ] 3.32% | 747,332 | 6.0% |
[ 3.5% - 4.0% ] 3.54% | 913,413 | 6.3% |
[ 3.5% - 4.0% ] 3.78% | 713,240 | 5.4% |
[ 4.0% - 4.5% ] 4.02% | 607,831 | 5.4% |
[ 4.0% - 4.5% ] 4.27% | 523,065 | 5.8% |
[ 4.5% - 5.0% ] 4.53% | 652,317 | 4.5% |
[ 4.5% - 5.0% ] 4.78% | 324,381 | 5.6% |
[ 5.0% - 5.5% ] 5.01% | 458,163 | 6.2% |
[ 5.0% - 5.5% ] 5.29% | 422,747 | 6.3% |
[ 5.5% - 6.0% ] 5.54% | 72,007 | 5.8% |
[ 5.5% - 6.0% ] 5.74% | 201,600 | 4.0% |
[ 5.5% - 6.0% ] 5.96% | 185,449 | 5.5% |
[ 6.0% - 6.5% ] 6.30% | 76,258 | 4.9% |
[ 6.0% - 6.5% ] 6.48% | 39,601 | 3.7% |
[ 6.5% - 7.0% ] 6.69% | 607,938 | 5.3% |
[ 6.5% - 7.0% ] 6.96% | 153,315 | 6.4% |
[ 7.0% - 7.5% ] 7.19% | 92,437 | 4.6% |
[ 7.5% - 8.0% ] 7.52% | 47,577 | 4.8% |
[ 7.5% - 8.0% ] 7.66% | 67,559 | 6.3% |
[ 7.5% - 8.0% ] 7.88% | 81,421 | 4.9% |
[ 8.0% - 8.5% ] 8.32% | 9,311 | 9.1% |
[ 8.5% - 9.0% ] 8.92% | 25,980 | 8.4% |
[ 9.0% - 9.5% ] 9.20% | 133,846 | 8.5% |
[ 9.5% - 10.0% ] 9.50% | 69,162 | 6.7% |
[ 9.5% - 10.0% ] 9.67% | 11,565 | 11.2% |
[ 9.5% - 10.0% ] 9.87% | 152 | 15.4% |
[ 10.0% - 10.5% ] 10.29% | 33,529 | 4.6% |
[ 10.5% - 11.0% ] 10.62% | 70,083 | 7.9% |
[ 10.5% - 11.0% ] 10.86% | 59,136 | 9.2% |
[ 11.0% - 11.5% ] 11.32% | 73,620 | 3.3% |
[ 11.5% - 12.0% ] 11.54% | 61,156 | 6.9% |
[ 11.5% - 12.0% ] 11.76% | 8,750 | 8.7% |
[ 12.0% - 12.5% ] 12.32% | 406 | 8.0% |
[ 12.5% - 13.0% ] 12.54% | 1,699 | 6.2% |
[ 12.5% - 13.0% ] 12.92% | 9,070 | 4.2% |
[ 13.0% - 13.5% ] 13.07% | 35,787 | 4.1% |
[ 13.0% - 13.5% ] 13.21% | 18,496 | 6.5% |
[ 13.5% - 14.0% ] 13.67% | 18,017 | 8.4% |
[ 13.5% - 14.0% ] 13.79% | 28,306 | 6.1% |
[ 14.0% - 14.5% ] 14.04% | 62,599 | 7.0% |
[ 14.5% - 15.0% ] 14.64% | 1,714 | 25.7% |
[ 15.0% - 15.5% ] 15.00% | 80 | 32.0% |
[ 15.5% - 16.0% ] 15.62% | 1,088 | 20.4% |
[ 15.5% - 16.0% ] 15.88% | 3,098 | 12.8% |
[ 15.5% - 16.0% ] 15.92% | 2,581 | 4.7% |
[ 16.0% - 16.5% ] 16.36% | 26,105 | 8.6% |
[ 16.5% - 17.0% ] 16.54% | 6,947 | 5.1% |
[ 17.0% - 17.5% ] 17.16% | 16,930 | 8.4% |
[ 17.5% - 18.0% ] 17.69% | 944 | 17.9% |
[ 20.0% - 20.5% ] 20.10% | 2,304 | 13.6% |
[ 20.5% - 21.0% ] 20.80% | 8,989 | 0.17% |
[ 23.5% - 24.0% ] 23.86% | 2,712 | 12.8% |
[ 24.5% - 25.0% ] 24.67% | 3,559 | 11.7% |
[ 27.0% - 27.5% ] 27.34% | 673 | 8.5% |