Honduran Self-Care Disability
COMPARE
Honduran
Select to Compare
Self-Care Disability
Honduran Self-Care Disability
2.6%
SELF-CARE DISABILITY
3.8/ 100
METRIC RATING
221st/ 347
METRIC RANK
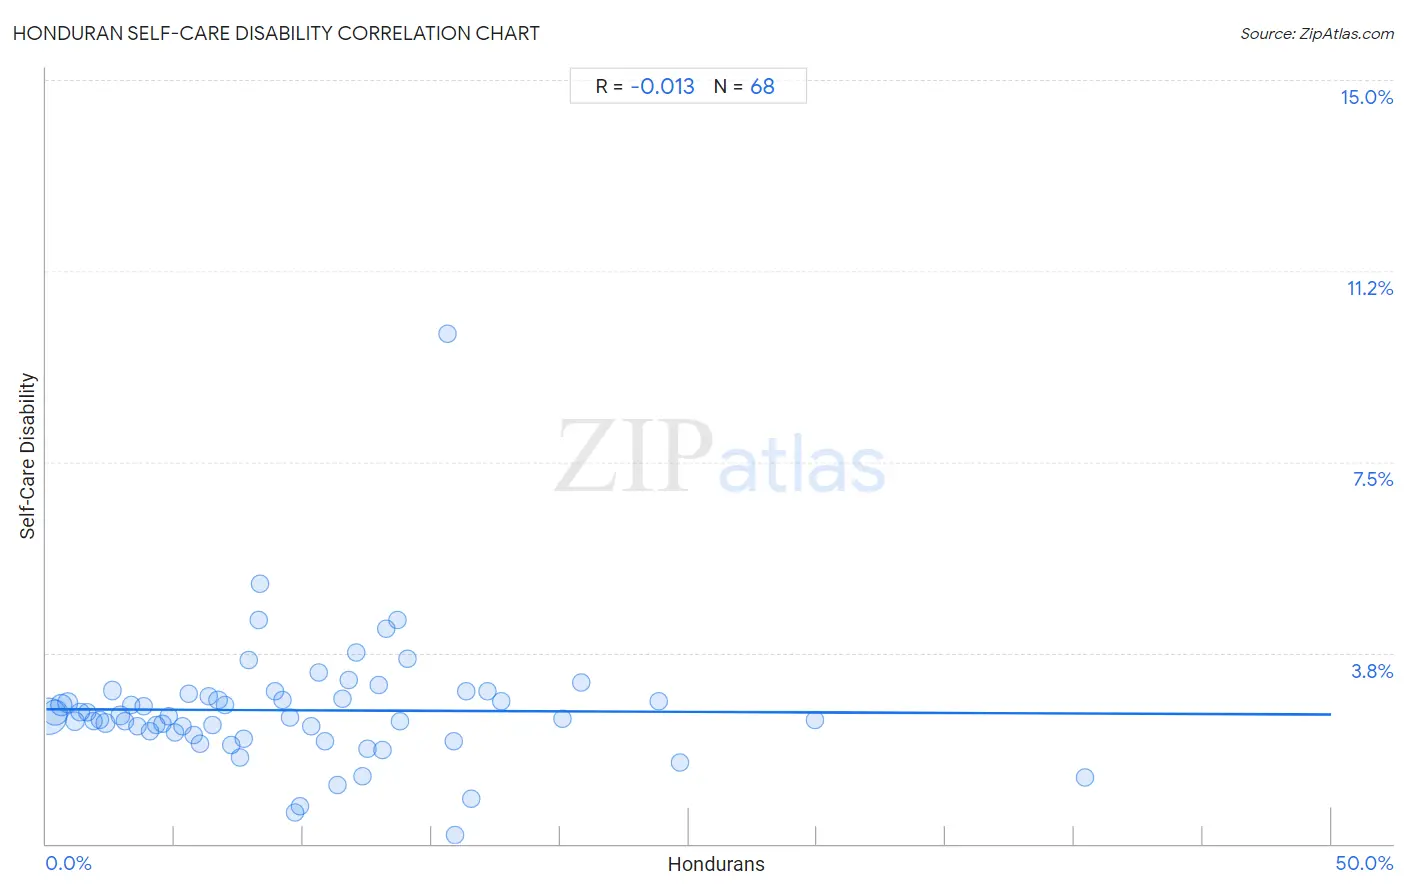
Honduran Self-Care Disability Correlation Chart
The statistical analysis conducted on geographies consisting of 357,432,362 people shows no correlation between the proportion of Hondurans and percentage of population with self-care disability in the United States with a correlation coefficient (R) of -0.013 and weighted average of 2.6%. On average, for every 1% (one percent) increase in Hondurans within a typical geography, there is a decrease of 0.0021% in percentage of population with self-care disability.
It is essential to understand that the correlation between the percentage of Hondurans and percentage of population with self-care disability does not imply a direct cause-and-effect relationship. It remains uncertain whether the presence of Hondurans influences an upward or downward trend in the level of percentage of population with self-care disability within an area, or if Hondurans simply ended up residing in those areas with higher or lower levels of percentage of population with self-care disability due to other factors.
Demographics Similar to Hondurans by Self-Care Disability
In terms of self-care disability, the demographic groups most similar to Hondurans are Spaniard (2.6%, a difference of 0.010%), French Canadian (2.6%, a difference of 0.020%), Subsaharan African (2.6%, a difference of 0.040%), Immigrants from Moldova (2.6%, a difference of 0.050%), and Osage (2.6%, a difference of 0.070%).
| Demographics | Rating | Rank | Self-Care Disability |
| Immigrants from Honduras | 4.7 /100 | #214 | Tragic 2.6% |
| Immigrants from Thailand | 4.5 /100 | #215 | Tragic 2.6% |
| Whites/Caucasians | 4.4 /100 | #216 | Tragic 2.6% |
| Celtics | 4.4 /100 | #217 | Tragic 2.6% |
| Scotch-Irish | 4.1 /100 | #218 | Tragic 2.6% |
| Immigrants from Moldova | 4.0 /100 | #219 | Tragic 2.6% |
| Sub-Saharan Africans | 4.0 /100 | #220 | Tragic 2.6% |
| Hondurans | 3.8 /100 | #221 | Tragic 2.6% |
| Spaniards | 3.8 /100 | #222 | Tragic 2.6% |
| French Canadians | 3.8 /100 | #223 | Tragic 2.6% |
| Osage | 3.6 /100 | #224 | Tragic 2.6% |
| Iraqis | 3.2 /100 | #225 | Tragic 2.6% |
| Chinese | 2.9 /100 | #226 | Tragic 2.6% |
| Immigrants from Philippines | 2.7 /100 | #227 | Tragic 2.6% |
| Guatemalans | 2.7 /100 | #228 | Tragic 2.6% |
Honduran Self-Care Disability Correlation Summary
| Measurement | Honduran Data | Self-Care Disability Data |
| Minimum | 0.10% | 0.18% |
| Maximum | 40.4% | 10.0% |
| Range | 40.3% | 9.9% |
| Mean | 9.6% | 2.6% |
| Median | 8.3% | 2.5% |
| Interquartile 25% (IQ1) | 4.1% | 2.2% |
| Interquartile 75% (IQ3) | 13.1% | 2.9% |
| Interquartile Range (IQR) | 9.0% | 0.75% |
| Standard Deviation (Sample) | 7.4% | 1.2% |
| Standard Deviation (Population) | 7.4% | 1.2% |
Correlation Details
| Honduran Percentile | Sample Size | Self-Care Disability |
[ 0.0% - 0.5% ] 0.10% | 181,050,765 | 2.5% |
[ 0.0% - 0.5% ] 0.36% | 69,757,749 | 2.6% |
[ 0.5% - 1.0% ] 0.59% | 35,530,972 | 2.7% |
[ 0.5% - 1.0% ] 0.83% | 20,423,611 | 2.8% |
[ 1.0% - 1.5% ] 1.10% | 13,096,410 | 2.4% |
[ 1.0% - 1.5% ] 1.33% | 8,000,015 | 2.6% |
[ 1.5% - 2.0% ] 1.58% | 4,134,697 | 2.6% |
[ 1.5% - 2.0% ] 1.83% | 3,813,866 | 2.4% |
[ 2.0% - 2.5% ] 2.09% | 2,631,827 | 2.4% |
[ 2.0% - 2.5% ] 2.30% | 3,353,988 | 2.4% |
[ 2.5% - 3.0% ] 2.57% | 1,991,705 | 3.0% |
[ 2.5% - 3.0% ] 2.88% | 4,244,734 | 2.5% |
[ 3.0% - 3.5% ] 3.05% | 1,544,167 | 2.4% |
[ 3.0% - 3.5% ] 3.32% | 750,024 | 2.7% |
[ 3.5% - 4.0% ] 3.54% | 917,417 | 2.3% |
[ 3.5% - 4.0% ] 3.78% | 718,797 | 2.7% |
[ 4.0% - 4.5% ] 4.02% | 614,231 | 2.2% |
[ 4.0% - 4.5% ] 4.27% | 522,658 | 2.3% |
[ 4.5% - 5.0% ] 4.53% | 653,291 | 2.4% |
[ 4.5% - 5.0% ] 4.78% | 332,824 | 2.5% |
[ 5.0% - 5.5% ] 5.01% | 461,687 | 2.2% |
[ 5.0% - 5.5% ] 5.29% | 425,284 | 2.3% |
[ 5.5% - 6.0% ] 5.53% | 73,583 | 3.0% |
[ 5.5% - 6.0% ] 5.74% | 202,669 | 2.1% |
[ 5.5% - 6.0% ] 5.96% | 190,727 | 2.0% |
[ 6.0% - 6.5% ] 6.30% | 75,947 | 2.9% |
[ 6.0% - 6.5% ] 6.48% | 39,601 | 2.3% |
[ 6.5% - 7.0% ] 6.69% | 607,938 | 2.8% |
[ 6.5% - 7.0% ] 6.97% | 156,382 | 2.7% |
[ 7.0% - 7.5% ] 7.19% | 93,152 | 1.9% |
[ 7.5% - 8.0% ] 7.52% | 48,198 | 1.7% |
[ 7.5% - 8.0% ] 7.66% | 67,559 | 2.1% |
[ 7.5% - 8.0% ] 7.88% | 84,865 | 3.6% |
[ 8.0% - 8.5% ] 8.26% | 3,305 | 4.4% |
[ 8.0% - 8.5% ] 8.34% | 10,431 | 5.1% |
[ 8.5% - 9.0% ] 8.91% | 29,797 | 3.0% |
[ 9.0% - 9.5% ] 9.20% | 133,414 | 2.8% |
[ 9.5% - 10.0% ] 9.50% | 69,162 | 2.5% |
[ 9.5% - 10.0% ] 9.67% | 11,924 | 0.62% |
[ 9.5% - 10.0% ] 9.87% | 152 | 0.73% |
[ 10.0% - 10.5% ] 10.29% | 34,918 | 2.3% |
[ 10.5% - 11.0% ] 10.63% | 70,474 | 3.4% |
[ 10.5% - 11.0% ] 10.86% | 59,136 | 2.0% |
[ 11.0% - 11.5% ] 11.32% | 74,024 | 1.2% |
[ 11.5% - 12.0% ] 11.54% | 61,156 | 2.8% |
[ 11.5% - 12.0% ] 11.76% | 8,750 | 3.2% |
[ 12.0% - 12.5% ] 12.06% | 2,247 | 3.8% |
[ 12.0% - 12.5% ] 12.32% | 406 | 1.3% |
[ 12.0% - 12.5% ] 12.50% | 1,384 | 1.9% |
[ 12.5% - 13.0% ] 12.92% | 9,070 | 3.1% |
[ 13.0% - 13.5% ] 13.07% | 35,787 | 1.9% |
[ 13.0% - 13.5% ] 13.21% | 18,496 | 4.2% |
[ 13.5% - 14.0% ] 13.67% | 16,743 | 4.4% |
[ 13.5% - 14.0% ] 13.79% | 28,306 | 2.4% |
[ 14.0% - 14.5% ] 14.04% | 62,599 | 3.6% |
[ 15.5% - 16.0% ] 15.62% | 1,088 | 10.0% |
[ 15.5% - 16.0% ] 15.86% | 3,392 | 2.0% |
[ 15.5% - 16.0% ] 15.92% | 2,581 | 0.18% |
[ 16.0% - 16.5% ] 16.37% | 28,120 | 3.0% |
[ 16.5% - 17.0% ] 16.54% | 6,947 | 0.89% |
[ 17.0% - 17.5% ] 17.16% | 16,930 | 3.0% |
[ 17.5% - 18.0% ] 17.69% | 944 | 2.8% |
[ 20.0% - 20.5% ] 20.10% | 2,304 | 2.4% |
[ 20.5% - 21.0% ] 20.80% | 8,989 | 3.2% |
[ 23.5% - 24.0% ] 23.86% | 2,712 | 2.8% |
[ 24.5% - 25.0% ] 24.67% | 3,559 | 1.6% |
[ 29.5% - 30.0% ] 29.94% | 1,540 | 2.4% |
[ 40.0% - 40.5% ] 40.43% | 235 | 1.3% |