Honduran Unemployment Among Women with Children Ages 6 to 17 years
COMPARE
Honduran
Select to Compare
Unemployment Among Women with Children Ages 6 to 17 years
Honduran Unemployment Among Women with Children Ages 6 to 17 years
10.0%
UNEMPLOYMENT | WOMEN W/ CHILDREN 6 TO 17
0.0/ 100
METRIC RATING
289th/ 347
METRIC RANK
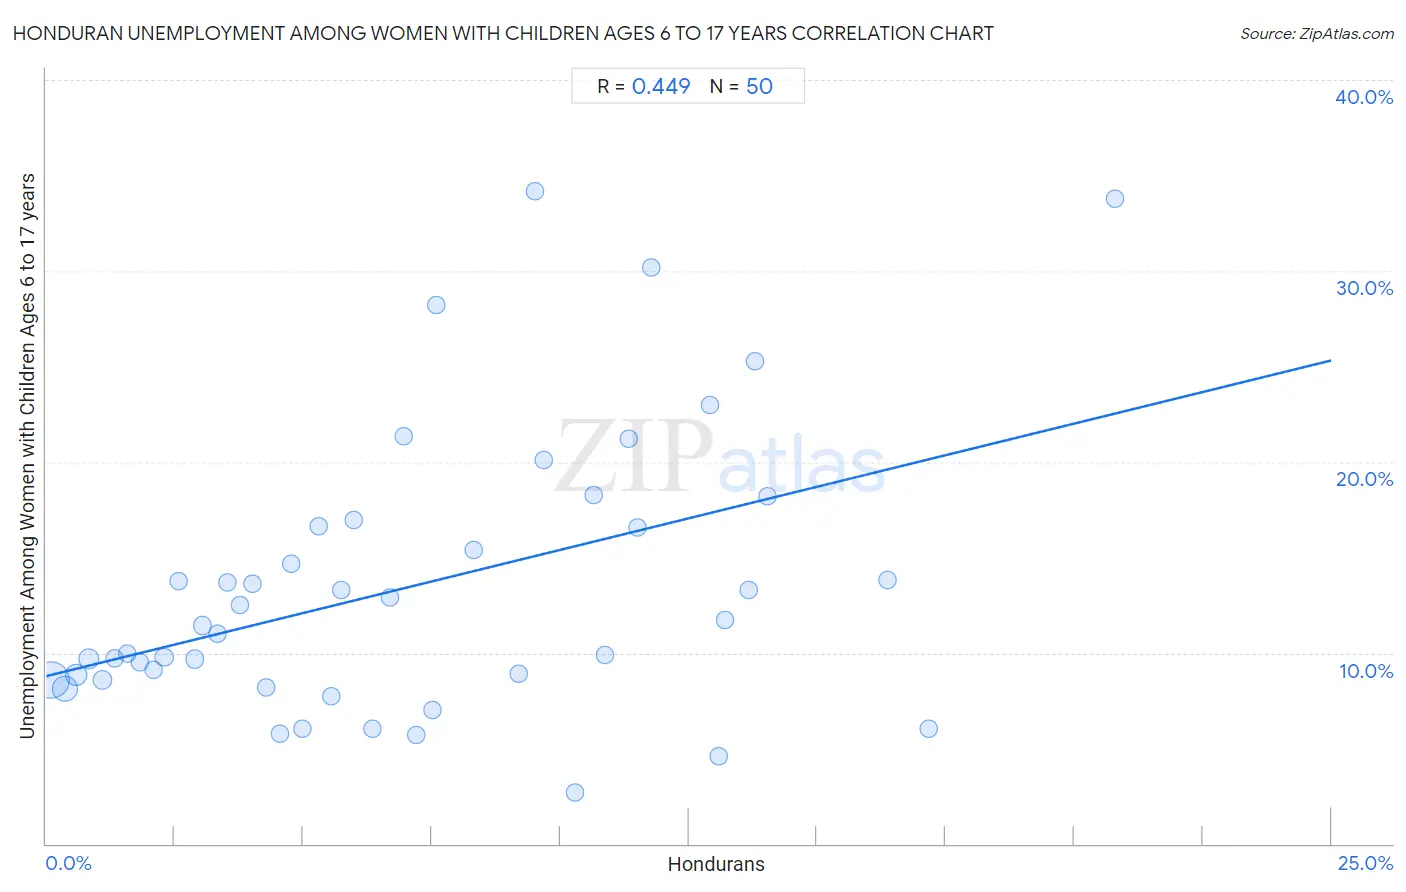
Honduran Unemployment Among Women with Children Ages 6 to 17 years Correlation Chart
The statistical analysis conducted on geographies consisting of 273,347,918 people shows a moderate positive correlation between the proportion of Hondurans and unemployment rate among women with children between the ages 6 and 17 in the United States with a correlation coefficient (R) of 0.449 and weighted average of 10.0%. On average, for every 1% (one percent) increase in Hondurans within a typical geography, there is an increase of 0.66% in unemployment rate among women with children between the ages 6 and 17.
It is essential to understand that the correlation between the percentage of Hondurans and unemployment rate among women with children between the ages 6 and 17 does not imply a direct cause-and-effect relationship. It remains uncertain whether the presence of Hondurans influences an upward or downward trend in the level of unemployment rate among women with children between the ages 6 and 17 within an area, or if Hondurans simply ended up residing in those areas with higher or lower levels of unemployment rate among women with children between the ages 6 and 17 due to other factors.
Demographics Similar to Hondurans by Unemployment Among Women with Children Ages 6 to 17 years
In terms of unemployment among women with children ages 6 to 17 years, the demographic groups most similar to Hondurans are Subsaharan African (10.0%, a difference of 0.010%), Nonimmigrants (10.0%, a difference of 0.040%), Carpatho Rusyn (10.0%, a difference of 0.050%), Haitian (10.0%, a difference of 0.14%), and Ecuadorian (10.0%, a difference of 0.23%).
| Demographics | Rating | Rank | Unemployment Among Women with Children Ages 6 to 17 years |
| Slovaks | 0.0 /100 | #282 | Tragic 9.8% |
| Central American Indians | 0.0 /100 | #283 | Tragic 9.9% |
| Yakama | 0.0 /100 | #284 | Tragic 9.9% |
| Hispanics or Latinos | 0.0 /100 | #285 | Tragic 9.9% |
| Choctaw | 0.0 /100 | #286 | Tragic 9.9% |
| Sierra Leoneans | 0.0 /100 | #287 | Tragic 9.9% |
| Shoshone | 0.0 /100 | #288 | Tragic 10.0% |
| Hondurans | 0.0 /100 | #289 | Tragic 10.0% |
| Sub-Saharan Africans | 0.0 /100 | #290 | Tragic 10.0% |
| Nonimmigrants | 0.0 /100 | #291 | Tragic 10.0% |
| Carpatho Rusyns | 0.0 /100 | #292 | Tragic 10.0% |
| Haitians | 0.0 /100 | #293 | Tragic 10.0% |
| Ecuadorians | 0.0 /100 | #294 | Tragic 10.0% |
| Cherokee | 0.0 /100 | #295 | Tragic 10.0% |
| Immigrants from Western Africa | 0.0 /100 | #296 | Tragic 10.1% |
Honduran Unemployment Among Women with Children Ages 6 to 17 years Correlation Summary
| Measurement | Honduran Data | Unemployment Among Women with Children Ages 6 to 17 years Data |
| Minimum | 0.10% | 2.7% |
| Maximum | 20.8% | 34.2% |
| Range | 20.7% | 31.5% |
| Mean | 7.1% | 13.5% |
| Median | 6.2% | 11.6% |
| Interquartile 25% (IQ1) | 3.0% | 8.6% |
| Interquartile 75% (IQ3) | 10.9% | 16.6% |
| Interquartile Range (IQR) | 7.8% | 8.0% |
| Standard Deviation (Sample) | 5.0% | 7.4% |
| Standard Deviation (Population) | 4.9% | 7.3% |
Correlation Details
| Honduran Percentile | Sample Size | Unemployment Among Women with Children Ages 6 to 17 years |
[ 0.0% - 0.5% ] 0.10% | 136,113,970 | 8.5% |
[ 0.0% - 0.5% ] 0.36% | 54,948,396 | 8.1% |
[ 0.5% - 1.0% ] 0.59% | 28,258,101 | 8.8% |
[ 0.5% - 1.0% ] 0.82% | 16,377,434 | 9.7% |
[ 1.0% - 1.5% ] 1.10% | 10,069,759 | 8.6% |
[ 1.0% - 1.5% ] 1.33% | 6,059,462 | 9.7% |
[ 1.5% - 2.0% ] 1.58% | 2,774,661 | 9.9% |
[ 1.5% - 2.0% ] 1.82% | 2,631,300 | 9.5% |
[ 2.0% - 2.5% ] 2.09% | 1,917,591 | 9.1% |
[ 2.0% - 2.5% ] 2.30% | 2,708,358 | 9.8% |
[ 2.5% - 3.0% ] 2.57% | 1,326,703 | 13.8% |
[ 2.5% - 3.0% ] 2.88% | 3,879,001 | 9.7% |
[ 3.0% - 3.5% ] 3.04% | 1,078,114 | 11.4% |
[ 3.0% - 3.5% ] 3.32% | 451,210 | 11.0% |
[ 3.5% - 4.0% ] 3.53% | 483,357 | 13.7% |
[ 3.5% - 4.0% ] 3.77% | 499,631 | 12.5% |
[ 4.0% - 4.5% ] 4.01% | 493,991 | 13.6% |
[ 4.0% - 4.5% ] 4.28% | 309,228 | 8.2% |
[ 4.5% - 5.0% ] 4.54% | 380,350 | 5.8% |
[ 4.5% - 5.0% ] 4.78% | 199,684 | 14.7% |
[ 4.5% - 5.0% ] 5.00% | 361,115 | 6.0% |
[ 5.0% - 5.5% ] 5.30% | 157,735 | 16.6% |
[ 5.5% - 6.0% ] 5.54% | 44,194 | 7.7% |
[ 5.5% - 6.0% ] 5.73% | 118,832 | 13.3% |
[ 5.5% - 6.0% ] 5.98% | 139,419 | 16.9% |
[ 6.0% - 6.5% ] 6.34% | 52,324 | 6.0% |
[ 6.5% - 7.0% ] 6.68% | 565,884 | 12.9% |
[ 6.5% - 7.0% ] 6.96% | 147,008 | 21.4% |
[ 7.0% - 7.5% ] 7.19% | 31,807 | 5.7% |
[ 7.5% - 8.0% ] 7.52% | 46,811 | 7.0% |
[ 7.5% - 8.0% ] 7.59% | 38,624 | 28.2% |
[ 8.0% - 8.5% ] 8.32% | 7,800 | 15.4% |
[ 9.0% - 9.5% ] 9.20% | 132,899 | 8.9% |
[ 9.5% - 10.0% ] 9.51% | 65,785 | 34.2% |
[ 9.5% - 10.0% ] 9.67% | 11,565 | 20.1% |
[ 10.0% - 10.5% ] 10.29% | 33,529 | 2.7% |
[ 10.5% - 11.0% ] 10.66% | 51,458 | 18.2% |
[ 10.5% - 11.0% ] 10.86% | 46,266 | 9.9% |
[ 11.0% - 11.5% ] 11.32% | 70,177 | 21.2% |
[ 11.5% - 12.0% ] 11.50% | 45,015 | 16.6% |
[ 11.5% - 12.0% ] 11.76% | 8,750 | 30.2% |
[ 12.5% - 13.0% ] 12.90% | 5,030 | 23.0% |
[ 13.0% - 13.5% ] 13.09% | 31,756 | 4.6% |
[ 13.0% - 13.5% ] 13.21% | 17,640 | 11.7% |
[ 13.5% - 14.0% ] 13.67% | 16,743 | 13.3% |
[ 13.5% - 14.0% ] 13.79% | 28,306 | 25.3% |
[ 14.0% - 14.5% ] 14.04% | 59,121 | 18.2% |
[ 16.0% - 16.5% ] 16.36% | 26,105 | 13.8% |
[ 17.0% - 17.5% ] 17.16% | 16,930 | 6.0% |
[ 20.5% - 21.0% ] 20.80% | 8,989 | 33.8% |