Afghan vs Turkish 3 or more Vehicles in Household
COMPARE
Afghan
Turkish
3 or more Vehicles in Household
3 or more Vehicles in Household Comparison
Afghans
Turks
21.7%
3 OR MORE VEHICLES IN HOUSEHOLD
99.7/ 100
METRIC RATING
80th/ 347
METRIC RANK
18.4%
3 OR MORE VEHICLES IN HOUSEHOLD
5.4/ 100
METRIC RATING
228th/ 347
METRIC RANK
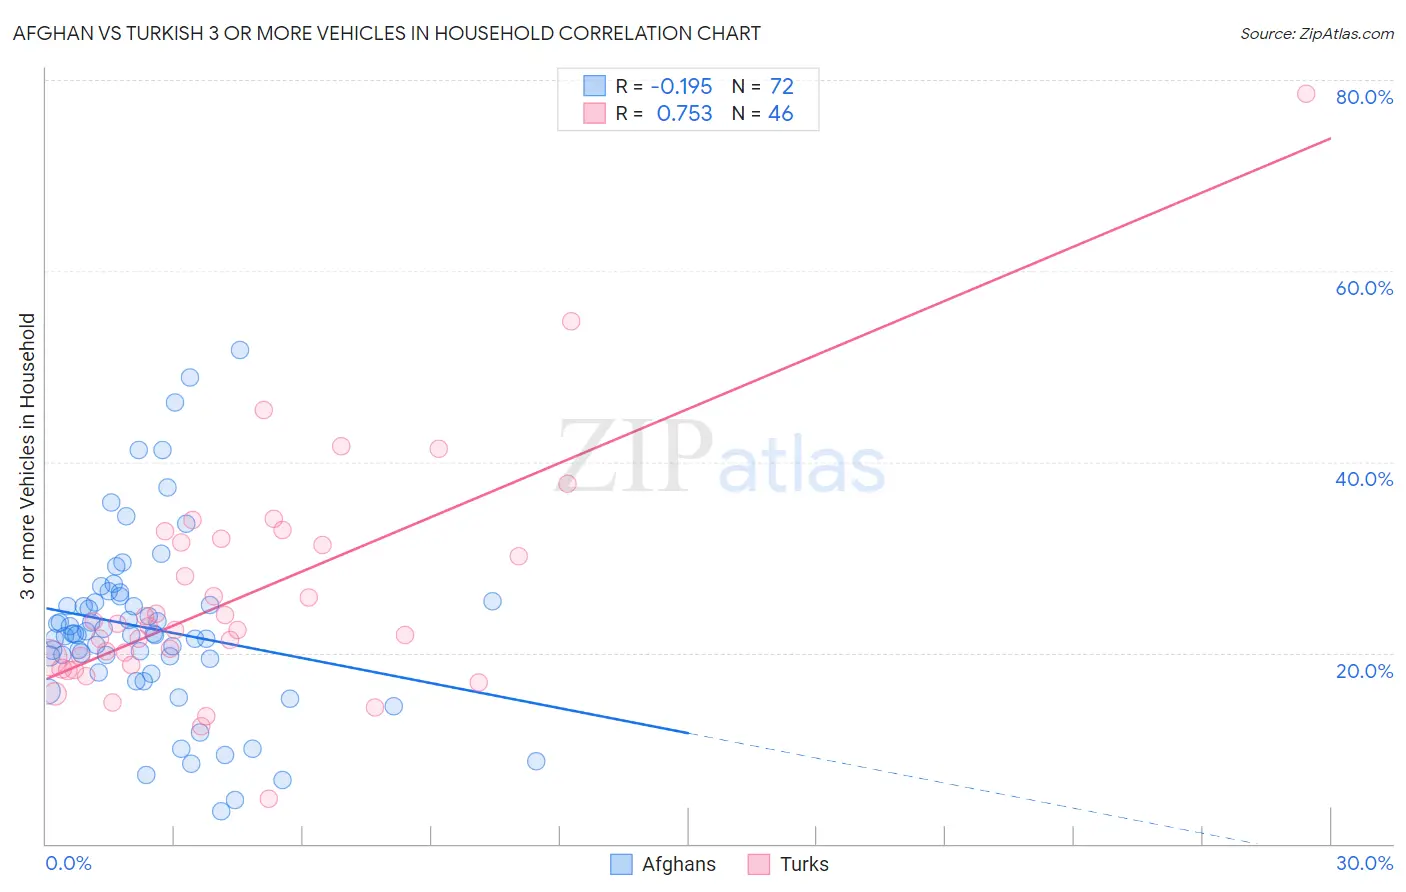
Afghan vs Turkish 3 or more Vehicles in Household Correlation Chart
The statistical analysis conducted on geographies consisting of 148,806,002 people shows a poor negative correlation between the proportion of Afghans and percentage of households with 3 or more vehicles available in the United States with a correlation coefficient (R) of -0.195 and weighted average of 21.7%. Similarly, the statistical analysis conducted on geographies consisting of 271,619,794 people shows a strong positive correlation between the proportion of Turks and percentage of households with 3 or more vehicles available in the United States with a correlation coefficient (R) of 0.753 and weighted average of 18.4%, a difference of 17.6%.
3 or more Vehicles in Household Correlation Summary
| Measurement | Afghan | Turkish |
| Minimum | 3.4% | 4.7% |
| Maximum | 51.7% | 78.6% |
| Range | 48.3% | 73.9% |
| Mean | 22.5% | 25.9% |
| Median | 21.9% | 22.6% |
| Interquartile 25% (IQ1) | 18.6% | 18.7% |
| Interquartile 75% (IQ3) | 25.3% | 31.6% |
| Interquartile Range (IQR) | 6.7% | 12.8% |
| Standard Deviation (Sample) | 9.4% | 12.3% |
| Standard Deviation (Population) | 9.4% | 12.2% |
Similar Demographics by 3 or more Vehicles in Household
Demographics Similar to Afghans by 3 or more Vehicles in Household
In terms of 3 or more vehicles in household, the demographic groups most similar to Afghans are Celtic (21.7%, a difference of 0.070%), Assyrian/Chaldean/Syriac (21.7%, a difference of 0.20%), Czechoslovakian (21.7%, a difference of 0.21%), Irish (21.8%, a difference of 0.34%), and Nonimmigrants (21.8%, a difference of 0.41%).
| Demographics | Rating | Rank | 3 or more Vehicles in Household |
| Salvadorans | 99.8 /100 | #73 | Exceptional 21.8% |
| Immigrants | Oceania | 99.8 /100 | #74 | Exceptional 21.8% |
| Japanese | 99.8 /100 | #75 | Exceptional 21.8% |
| Immigrants | Nonimmigrants | 99.8 /100 | #76 | Exceptional 21.8% |
| Irish | 99.8 /100 | #77 | Exceptional 21.8% |
| Czechoslovakians | 99.8 /100 | #78 | Exceptional 21.7% |
| Assyrians/Chaldeans/Syriacs | 99.8 /100 | #79 | Exceptional 21.7% |
| Afghans | 99.7 /100 | #80 | Exceptional 21.7% |
| Celtics | 99.7 /100 | #81 | Exceptional 21.7% |
| Immigrants | El Salvador | 99.6 /100 | #82 | Exceptional 21.5% |
| Chippewa | 99.6 /100 | #83 | Exceptional 21.5% |
| Icelanders | 99.6 /100 | #84 | Exceptional 21.5% |
| Laotians | 99.6 /100 | #85 | Exceptional 21.5% |
| Delaware | 99.6 /100 | #86 | Exceptional 21.5% |
| Immigrants | Azores | 99.5 /100 | #87 | Exceptional 21.5% |
Demographics Similar to Turks by 3 or more Vehicles in Household
In terms of 3 or more vehicles in household, the demographic groups most similar to Turks are Immigrants from Singapore (18.4%, a difference of 0.020%), Immigrants from Hungary (18.5%, a difference of 0.050%), Immigrants from Lithuania (18.5%, a difference of 0.080%), Immigrants from Argentina (18.5%, a difference of 0.090%), and Immigrants from Switzerland (18.4%, a difference of 0.17%).
| Demographics | Rating | Rank | 3 or more Vehicles in Household |
| Immigrants | Poland | 7.5 /100 | #221 | Tragic 18.6% |
| Belizeans | 7.3 /100 | #222 | Tragic 18.6% |
| Immigrants | Czechoslovakia | 5.9 /100 | #223 | Tragic 18.5% |
| Immigrants | Argentina | 5.6 /100 | #224 | Tragic 18.5% |
| Immigrants | Lithuania | 5.6 /100 | #225 | Tragic 18.5% |
| Immigrants | Hungary | 5.5 /100 | #226 | Tragic 18.5% |
| Immigrants | Singapore | 5.4 /100 | #227 | Tragic 18.4% |
| Turks | 5.4 /100 | #228 | Tragic 18.4% |
| Immigrants | Switzerland | 5.0 /100 | #229 | Tragic 18.4% |
| Immigrants | Western Asia | 4.8 /100 | #230 | Tragic 18.4% |
| Immigrants | Belgium | 4.8 /100 | #231 | Tragic 18.4% |
| Immigrants | Uganda | 4.6 /100 | #232 | Tragic 18.4% |
| Hondurans | 4.6 /100 | #233 | Tragic 18.4% |
| Immigrants | North Macedonia | 4.4 /100 | #234 | Tragic 18.4% |
| Sierra Leoneans | 3.9 /100 | #235 | Tragic 18.3% |