Afghan vs Subsaharan African 3 or more Vehicles in Household
COMPARE
Afghan
Subsaharan African
3 or more Vehicles in Household
3 or more Vehicles in Household Comparison
Afghans
Sub-Saharan Africans
21.7%
3 OR MORE VEHICLES IN HOUSEHOLD
99.7/ 100
METRIC RATING
80th/ 347
METRIC RANK
17.9%
3 OR MORE VEHICLES IN HOUSEHOLD
1.1/ 100
METRIC RATING
256th/ 347
METRIC RANK
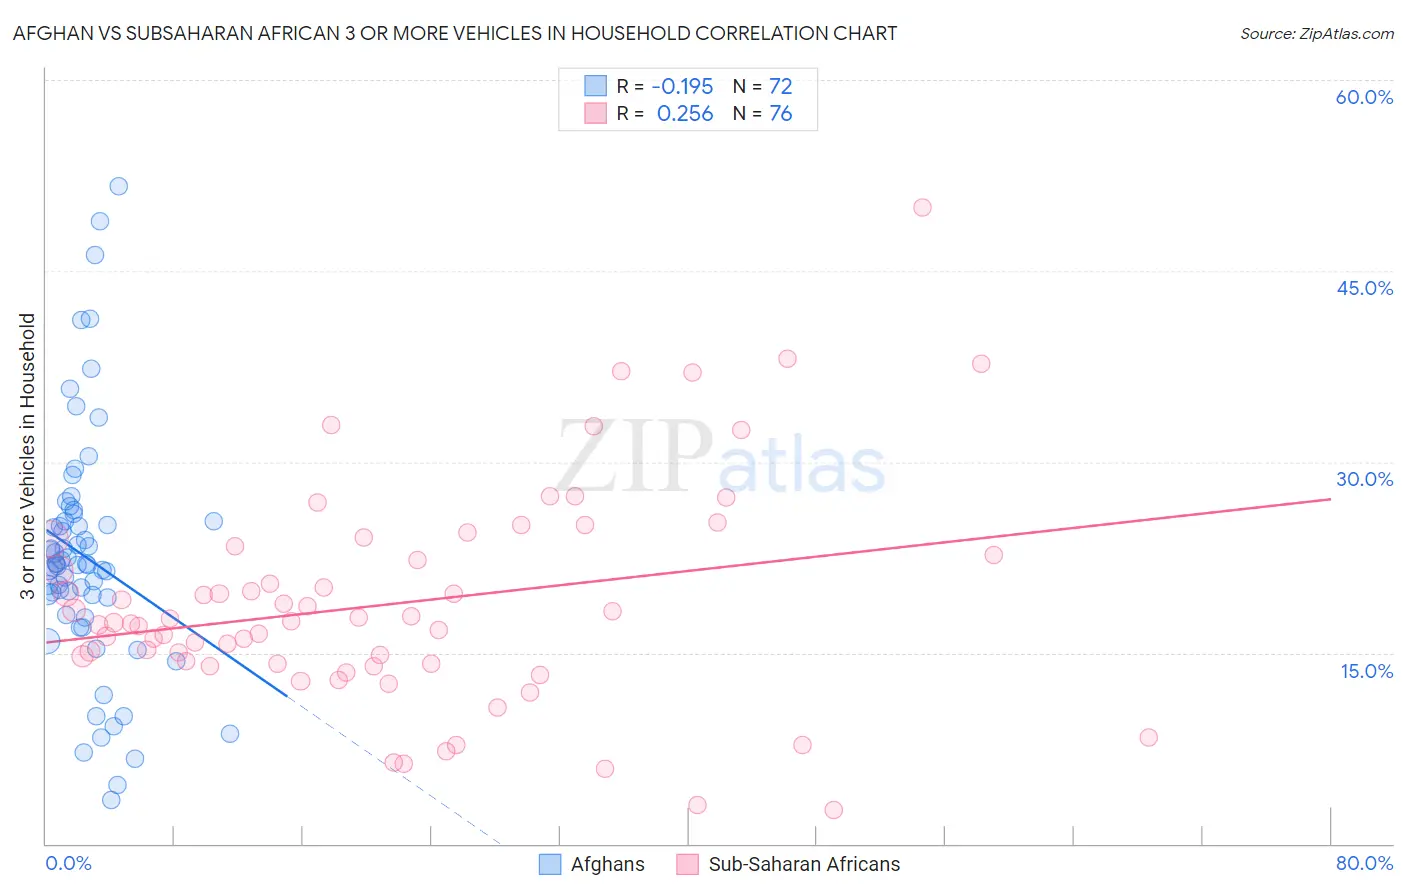
Afghan vs Subsaharan African 3 or more Vehicles in Household Correlation Chart
The statistical analysis conducted on geographies consisting of 148,806,002 people shows a poor negative correlation between the proportion of Afghans and percentage of households with 3 or more vehicles available in the United States with a correlation coefficient (R) of -0.195 and weighted average of 21.7%. Similarly, the statistical analysis conducted on geographies consisting of 507,393,924 people shows a weak positive correlation between the proportion of Sub-Saharan Africans and percentage of households with 3 or more vehicles available in the United States with a correlation coefficient (R) of 0.256 and weighted average of 17.9%, a difference of 21.4%.
3 or more Vehicles in Household Correlation Summary
| Measurement | Afghan | Subsaharan African |
| Minimum | 3.4% | 2.7% |
| Maximum | 51.7% | 50.0% |
| Range | 48.3% | 47.3% |
| Mean | 22.5% | 18.9% |
| Median | 21.9% | 17.4% |
| Interquartile 25% (IQ1) | 18.6% | 14.2% |
| Interquartile 75% (IQ3) | 25.3% | 23.0% |
| Interquartile Range (IQR) | 6.7% | 8.9% |
| Standard Deviation (Sample) | 9.4% | 8.6% |
| Standard Deviation (Population) | 9.4% | 8.5% |
Similar Demographics by 3 or more Vehicles in Household
Demographics Similar to Afghans by 3 or more Vehicles in Household
In terms of 3 or more vehicles in household, the demographic groups most similar to Afghans are Celtic (21.7%, a difference of 0.070%), Assyrian/Chaldean/Syriac (21.7%, a difference of 0.20%), Czechoslovakian (21.7%, a difference of 0.21%), Irish (21.8%, a difference of 0.34%), and Nonimmigrants (21.8%, a difference of 0.41%).
| Demographics | Rating | Rank | 3 or more Vehicles in Household |
| Salvadorans | 99.8 /100 | #73 | Exceptional 21.8% |
| Immigrants | Oceania | 99.8 /100 | #74 | Exceptional 21.8% |
| Japanese | 99.8 /100 | #75 | Exceptional 21.8% |
| Immigrants | Nonimmigrants | 99.8 /100 | #76 | Exceptional 21.8% |
| Irish | 99.8 /100 | #77 | Exceptional 21.8% |
| Czechoslovakians | 99.8 /100 | #78 | Exceptional 21.7% |
| Assyrians/Chaldeans/Syriacs | 99.8 /100 | #79 | Exceptional 21.7% |
| Afghans | 99.7 /100 | #80 | Exceptional 21.7% |
| Celtics | 99.7 /100 | #81 | Exceptional 21.7% |
| Immigrants | El Salvador | 99.6 /100 | #82 | Exceptional 21.5% |
| Chippewa | 99.6 /100 | #83 | Exceptional 21.5% |
| Icelanders | 99.6 /100 | #84 | Exceptional 21.5% |
| Laotians | 99.6 /100 | #85 | Exceptional 21.5% |
| Delaware | 99.6 /100 | #86 | Exceptional 21.5% |
| Immigrants | Azores | 99.5 /100 | #87 | Exceptional 21.5% |
Demographics Similar to Sub-Saharan Africans by 3 or more Vehicles in Household
In terms of 3 or more vehicles in household, the demographic groups most similar to Sub-Saharan Africans are Immigrants from Eritrea (17.8%, a difference of 0.050%), Sudanese (17.8%, a difference of 0.050%), Immigrants from Turkey (17.9%, a difference of 0.15%), Ethiopian (17.9%, a difference of 0.18%), and Immigrants from Ethiopia (17.9%, a difference of 0.19%).
| Demographics | Rating | Rank | 3 or more Vehicles in Household |
| Immigrants | Saudi Arabia | 1.7 /100 | #249 | Tragic 18.0% |
| Venezuelans | 1.7 /100 | #250 | Tragic 18.0% |
| Alsatians | 1.5 /100 | #251 | Tragic 18.0% |
| Immigrants | Southern Europe | 1.4 /100 | #252 | Tragic 17.9% |
| Immigrants | Ethiopia | 1.3 /100 | #253 | Tragic 17.9% |
| Ethiopians | 1.2 /100 | #254 | Tragic 17.9% |
| Immigrants | Turkey | 1.2 /100 | #255 | Tragic 17.9% |
| Sub-Saharan Africans | 1.1 /100 | #256 | Tragic 17.9% |
| Immigrants | Eritrea | 1.1 /100 | #257 | Tragic 17.8% |
| Sudanese | 1.1 /100 | #258 | Tragic 17.8% |
| Uruguayans | 1.0 /100 | #259 | Tragic 17.8% |
| Ugandans | 0.9 /100 | #260 | Tragic 17.8% |
| Immigrants | Northern Africa | 0.9 /100 | #261 | Tragic 17.8% |
| Colombians | 0.9 /100 | #262 | Tragic 17.8% |
| Bermudans | 0.9 /100 | #263 | Tragic 17.8% |