Zip Codes with the Highest Percentage of Population Employed in Utilities in Crossville, TN
RELATED REPORTS & OPTIONS
Utilities
Crossville
Compare Zip Codes
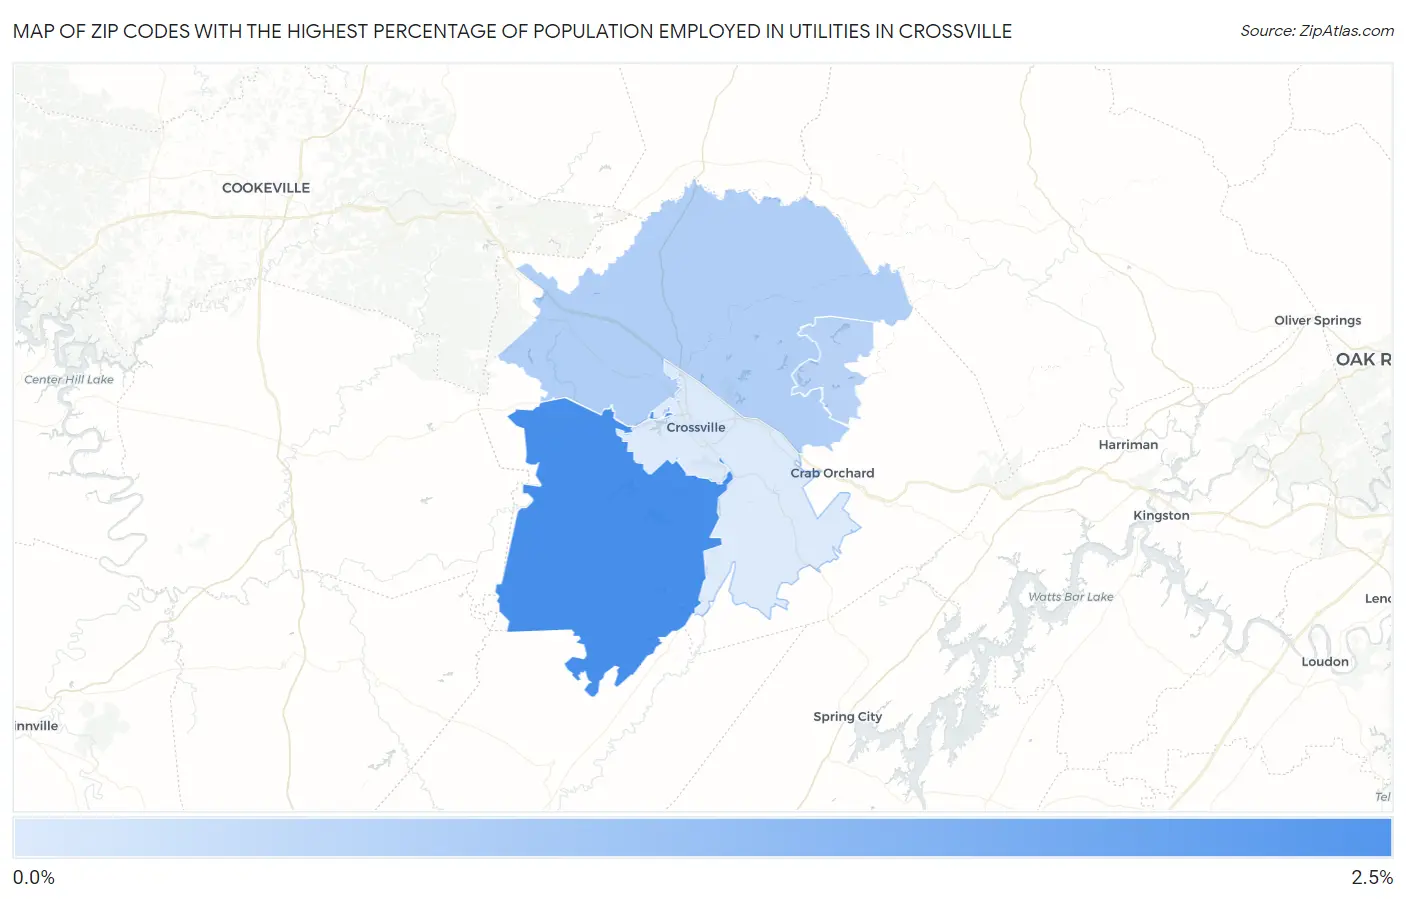
Map of Zip Codes with the Highest Percentage of Population Employed in Utilities in Crossville
0.28%
2.4%
Zip Codes with the Highest Percentage of Population Employed in Utilities in Crossville, TN
| Zip Code | % Employed | vs State | vs National | |
| 1. | 38572 | 2.4% | 0.91%(+1.50)#88 | 0.84%(+1.57)#3,776 |
| 2. | 38571 | 0.89% | 0.91%(-0.023)#252 | 0.84%(+0.052)#11,402 |
| 3. | 38558 | 0.80% | 0.91%(-0.112)#270 | 0.84%(-0.037)#12,369 |
| 4. | 38555 | 0.28% | 0.91%(-0.634)#395 | 0.84%(-0.559)#19,274 |
1
Common Questions
What are the Top 3 Zip Codes with the Highest Percentage of Population Employed in Utilities in Crossville, TN?
Top 3 Zip Codes with the Highest Percentage of Population Employed in Utilities in Crossville, TN are:
What zip code has the Highest Percentage of Population Employed in Utilities in Crossville, TN?
38572 has the Highest Percentage of Population Employed in Utilities in Crossville, TN with 2.4%.
What is the Percentage of Population Employed in Utilities in Tennessee?
Percentage of Population Employed in Utilities in Tennessee is 0.91%.
What is the Percentage of Population Employed in Utilities in the United States?
Percentage of Population Employed in Utilities in the United States is 0.84%.