Cities with the Highest Percentage of Hawaiian / Pacific Population in South Carolina
RELATED REPORTS & OPTIONS
Hawaiian / Pacific
South Carolina
Compare Cities
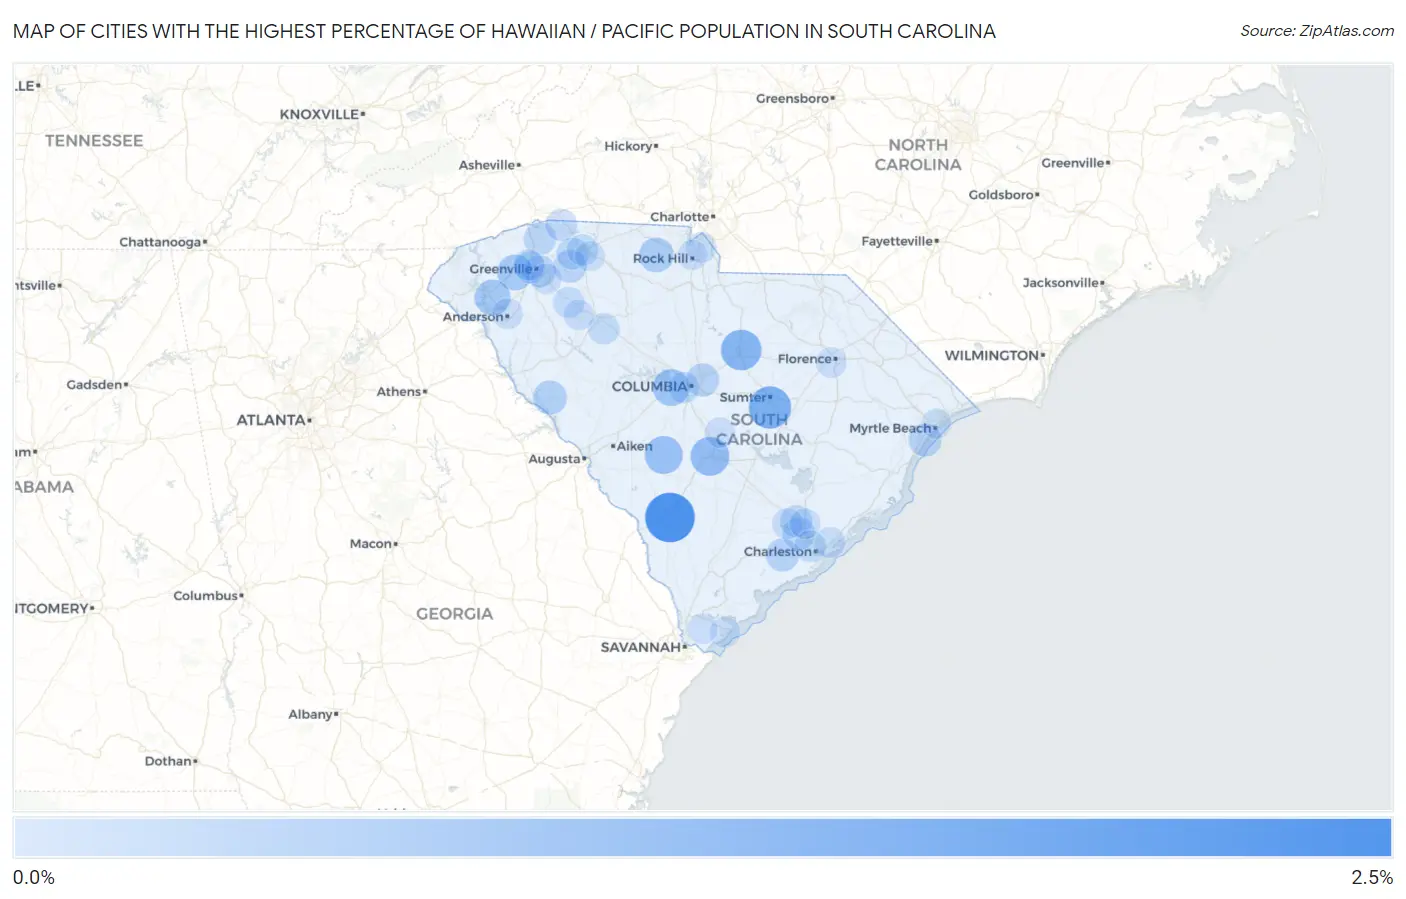
Map of Cities with the Highest Percentage of Hawaiian / Pacific Population in South Carolina
0.0%
2.5%
Cities with the Highest Percentage of Hawaiian / Pacific Population in South Carolina
| City | Hawaiian / Pacific | vs State | vs National | |
| 1. | Sycamore | 2.1% | 0.053%(+2.07)#1 | 0.19%(+1.94)#406 |
| 2. | Lakewood | 1.3% | 0.053%(+1.25)#2 | 0.19%(+1.12)#621 |
| 3. | Camden | 1.1% | 0.053%(+1.07)#3 | 0.19%(+0.935)#687 |
| 4. | Orangeburg | 0.93% | 0.053%(+0.877)#4 | 0.19%(+0.742)#785 |
| 5. | Springfield | 0.83% | 0.053%(+0.777)#5 | 0.19%(+0.641)#861 |
| 6. | Lexington | 0.70% | 0.053%(+0.649)#6 | 0.19%(+0.513)#998 |
| 7. | Easley | 0.60% | 0.053%(+0.548)#7 | 0.19%(+0.412)#1,117 |
| 8. | Pendleton | 0.60% | 0.053%(+0.547)#8 | 0.19%(+0.412)#1,118 |
| 9. | Sharon | 0.49% | 0.053%(+0.434)#9 | 0.19%(+0.298)#1,277 |
| 10. | Mccormick | 0.40% | 0.053%(+0.346)#10 | 0.19%(+0.210)#1,446 |
| 11. | Columbia | 0.32% | 0.053%(+0.272)#11 | 0.19%(+0.136)#1,650 |
| 12. | Hollywood | 0.31% | 0.053%(+0.262)#12 | 0.19%(+0.126)#1,674 |
| 13. | Surfside Beach | 0.31% | 0.053%(+0.258)#13 | 0.19%(+0.122)#1,688 |
| 14. | Reidville | 0.29% | 0.053%(+0.235)#14 | 0.19%(+0.100)#1,770 |
| 15. | North Charleston | 0.25% | 0.053%(+0.201)#15 | 0.19%(+0.065)#1,910 |
| 16. | Tigerville | 0.24% | 0.053%(+0.183)#16 | 0.19%(+0.047)#1,987 |
| 17. | Greenville | 0.21% | 0.053%(+0.160)#17 | 0.19%(+0.024)#2,074 |
| 18. | Landrum | 0.20% | 0.053%(+0.147)#18 | 0.19%(+0.011)#2,130 |
| 19. | Ladson | 0.18% | 0.053%(+0.130)#19 | 0.19%(-0.006)#2,211 |
| 20. | Wellford | 0.18% | 0.053%(+0.127)#20 | 0.19%(-0.009)#2,226 |
| 21. | Parker | 0.18% | 0.053%(+0.124)#21 | 0.19%(-0.012)#2,246 |
| 22. | West Columbia | 0.14% | 0.053%(+0.090)#22 | 0.19%(-0.046)#2,444 |
| 23. | Joanna | 0.14% | 0.053%(+0.089)#23 | 0.19%(-0.046)#2,448 |
| 24. | Charleston | 0.13% | 0.053%(+0.080)#24 | 0.19%(-0.056)#2,502 |
| 25. | Southern Shops | 0.13% | 0.053%(+0.077)#25 | 0.19%(-0.059)#2,526 |
| 26. | Gray Court | 0.13% | 0.053%(+0.076)#26 | 0.19%(-0.060)#2,535 |
| 27. | Berea | 0.099% | 0.053%(+0.046)#27 | 0.19%(-0.090)#2,742 |
| 28. | Mount Pleasant | 0.064% | 0.053%(+0.011)#28 | 0.19%(-0.125)#3,057 |
| 29. | Summerville | 0.063% | 0.053%(+0.010)#29 | 0.19%(-0.126)#3,067 |
| 30. | Goose Creek | 0.055% | 0.053%(+0.002)#30 | 0.19%(-0.134)#3,160 |
| 31. | Laurens | 0.054% | 0.053%(+0.001)#31 | 0.19%(-0.135)#3,169 |
| 32. | St Matthews | 0.052% | 0.053%(-0.001)#32 | 0.19%(-0.137)#3,185 |
| 33. | Anderson | 0.051% | 0.053%(-0.002)#33 | 0.19%(-0.138)#3,190 |
| 34. | Florence | 0.043% | 0.053%(-0.010)#34 | 0.19%(-0.146)#3,295 |
| 35. | Fort Mill | 0.042% | 0.053%(-0.011)#35 | 0.19%(-0.146)#3,299 |
| 36. | Mauldin | 0.036% | 0.053%(-0.017)#36 | 0.19%(-0.153)#3,370 |
| 37. | Hilton Head Island | 0.019% | 0.053%(-0.034)#37 | 0.19%(-0.170)#3,615 |
| 38. | Bluffton | 0.017% | 0.053%(-0.036)#38 | 0.19%(-0.172)#3,630 |
| 39. | Myrtle Beach | 0.017% | 0.053%(-0.036)#39 | 0.19%(-0.172)#3,637 |
| 40. | Spartanburg | 0.013% | 0.053%(-0.040)#40 | 0.19%(-0.176)#3,676 |
| 41. | Rock Hill | 0.0054% | 0.053%(-0.048)#41 | 0.19%(-0.183)#3,764 |
Common Questions
What are the Top 10 Cities with the Highest Percentage of Hawaiian / Pacific Population in South Carolina?
Top 10 Cities with the Highest Percentage of Hawaiian / Pacific Population in South Carolina are:
#1
2.1%
#2
1.3%
#3
1.1%
#4
0.93%
#5
0.83%
#6
0.70%
#7
0.60%
#8
0.60%
#9
0.49%
#10
0.40%
What city has the Highest Percentage of Hawaiian / Pacific Population in South Carolina?
Sycamore has the Highest Percentage of Hawaiian / Pacific Population in South Carolina with 2.1%.
What is the Percentage of Hawaiian / Pacific Population in the State of South Carolina?
Percentage of Hawaiian / Pacific Population in South Carolina is 0.053%.
What is the Percentage of Hawaiian / Pacific Population in the United States?
Percentage of Hawaiian / Pacific Population in the United States is 0.19%.