Alice, ND Map & Demographics
Alice Map
Alice Overview
$33,239
PER CAPITA INCOME
$118,214
AVG FAMILY INCOME
$117,857
AVG HOUSEHOLD INCOME
54.6%
WAGE / INCOME GAP [ % ]
45.4¢/ $1
WAGE / INCOME GAP [ $ ]
0.26
INEQUALITY / GINI INDEX
44
TOTAL POPULATION
24
MALE POPULATION
20
FEMALE POPULATION
120.00
MALES / 100 FEMALES
83.33
FEMALES / 100 MALES
37.4
MEDIAN AGE
2.9
AVG FAMILY SIZE
2.8
AVG HOUSEHOLD SIZE
22
LABOR FORCE [ PEOPLE ]
81.5%
PERCENT IN LABOR FORCE
Alice Area Codes
Income in Alice
Income Overview in Alice
Per Capita Income in Alice is $33,239, while median incomes of families and households are $118,214 and $117,857 respectively.
| Characteristic | Number | Measure |
| Per Capita Income | 44 | $33,239 |
| Median Family Income | 14 | $118,214 |
| Mean Family Income | 14 | $104,893 |
| Median Household Income | 16 | $117,857 |
| Mean Household Income | 16 | $99,775 |
| Income Deficit | 14 | $0 |
| Wage / Income Gap (%) | 44 | 54.60% |
| Wage / Income Gap ($) | 44 | 45.40¢ per $1 |
| Gini / Inequality Index | 44 | 0.26 |
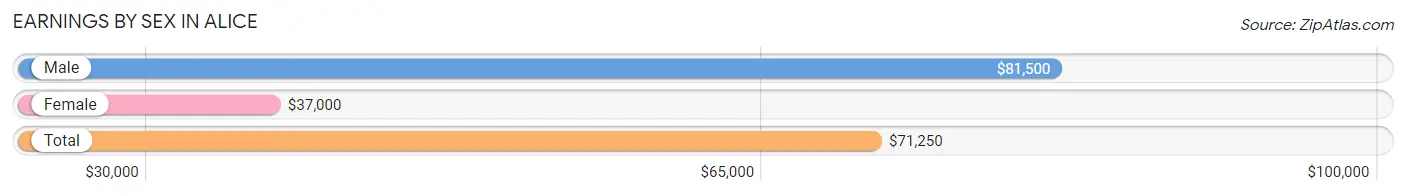
Earnings by Sex in Alice
Average Earnings in Alice are $71,250, $81,500 for men and $37,000 for women, a difference of 54.6%.
| Sex | Number | Average Earnings |
| Male | 10 (45.5%) | $81,500 |
| Female | 12 (54.5%) | $37,000 |
| Total | 22 (100.0%) | $71,250 |
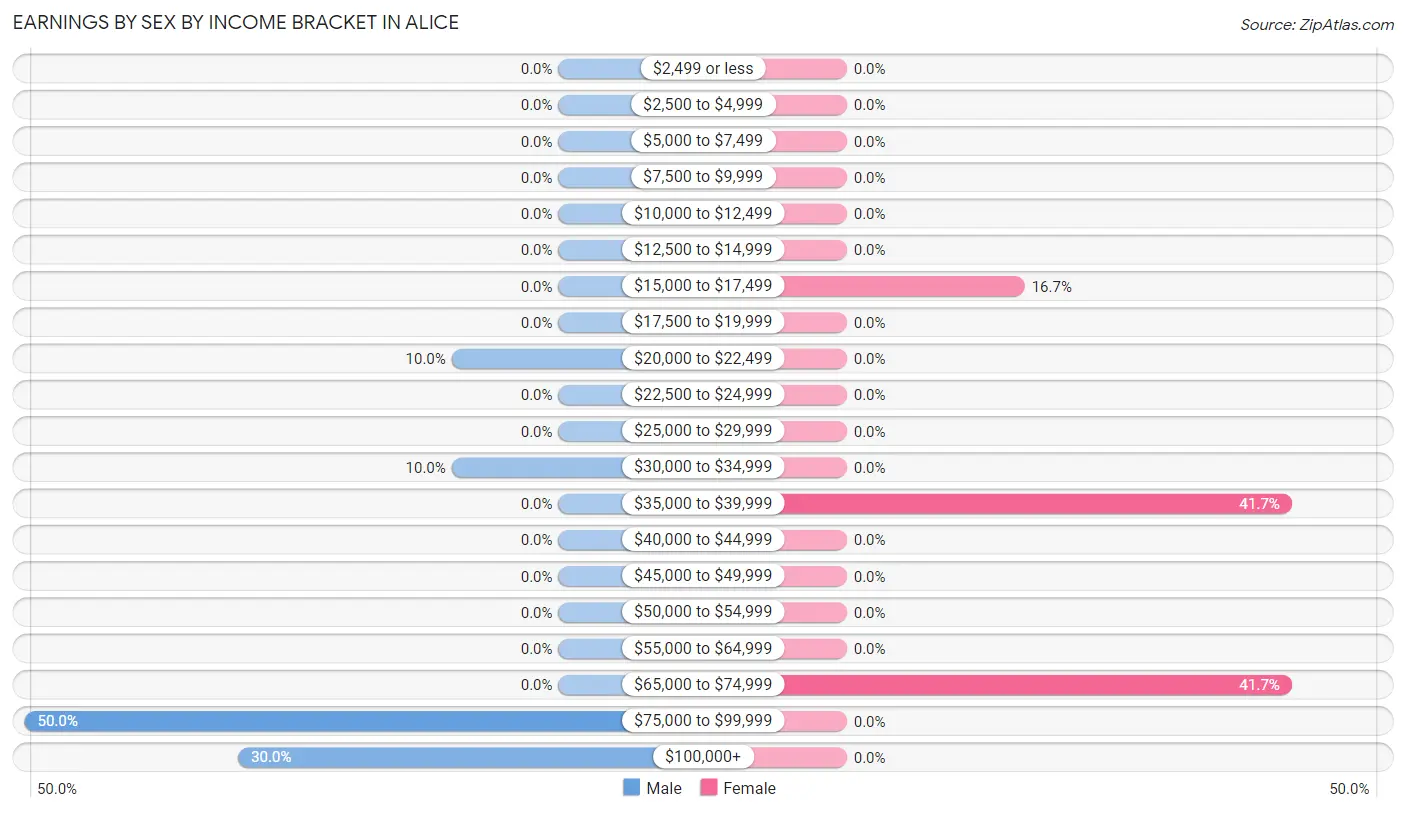
Earnings by Sex by Income Bracket in Alice
The most common earnings brackets in Alice are $75,000 to $99,999 for men (5 | 50.0%) and $35,000 to $39,999 for women (5 | 41.7%).
| Income | Male | Female |
| $2,499 or less | 0 (0.0%) | 0 (0.0%) |
| $2,500 to $4,999 | 0 (0.0%) | 0 (0.0%) |
| $5,000 to $7,499 | 0 (0.0%) | 0 (0.0%) |
| $7,500 to $9,999 | 0 (0.0%) | 0 (0.0%) |
| $10,000 to $12,499 | 0 (0.0%) | 0 (0.0%) |
| $12,500 to $14,999 | 0 (0.0%) | 0 (0.0%) |
| $15,000 to $17,499 | 0 (0.0%) | 2 (16.7%) |
| $17,500 to $19,999 | 0 (0.0%) | 0 (0.0%) |
| $20,000 to $22,499 | 1 (10.0%) | 0 (0.0%) |
| $22,500 to $24,999 | 0 (0.0%) | 0 (0.0%) |
| $25,000 to $29,999 | 0 (0.0%) | 0 (0.0%) |
| $30,000 to $34,999 | 1 (10.0%) | 0 (0.0%) |
| $35,000 to $39,999 | 0 (0.0%) | 5 (41.7%) |
| $40,000 to $44,999 | 0 (0.0%) | 0 (0.0%) |
| $45,000 to $49,999 | 0 (0.0%) | 0 (0.0%) |
| $50,000 to $54,999 | 0 (0.0%) | 0 (0.0%) |
| $55,000 to $64,999 | 0 (0.0%) | 0 (0.0%) |
| $65,000 to $74,999 | 0 (0.0%) | 5 (41.7%) |
| $75,000 to $99,999 | 5 (50.0%) | 0 (0.0%) |
| $100,000+ | 3 (30.0%) | 0 (0.0%) |
| Total | 10 (100.0%) | 12 (100.0%) |
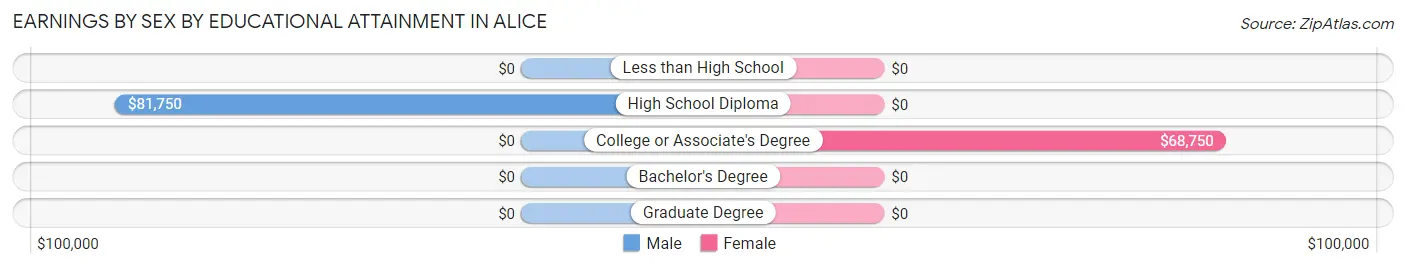
Earnings by Sex by Educational Attainment in Alice
Average earnings in Alice are $81,500 for men and $37,000 for women, a difference of 54.6%. Men with an educational attainment of high school diploma enjoy the highest average annual earnings of $81,750, while those with high school diploma education earn the least with $81,750. Women with an educational attainment of college or associate's degree earn the most with the average annual earnings of $68,750, while those with college or associate's degree education have the smallest earnings of $68,750.
| Educational Attainment | Male Income | Female Income |
| Less than High School | - | - |
| High School Diploma | $81,750 | $0 |
| College or Associate's Degree | - | - |
| Bachelor's Degree | - | - |
| Graduate Degree | - | - |
| Total | $81,500 | $37,000 |
Family Income in Alice
Family Income Brackets in Alice
According to the Alice family income data, there are 7 families falling into the $100,000 to $149,999 income range, which is the most common income bracket and makes up 50.0% of all families.
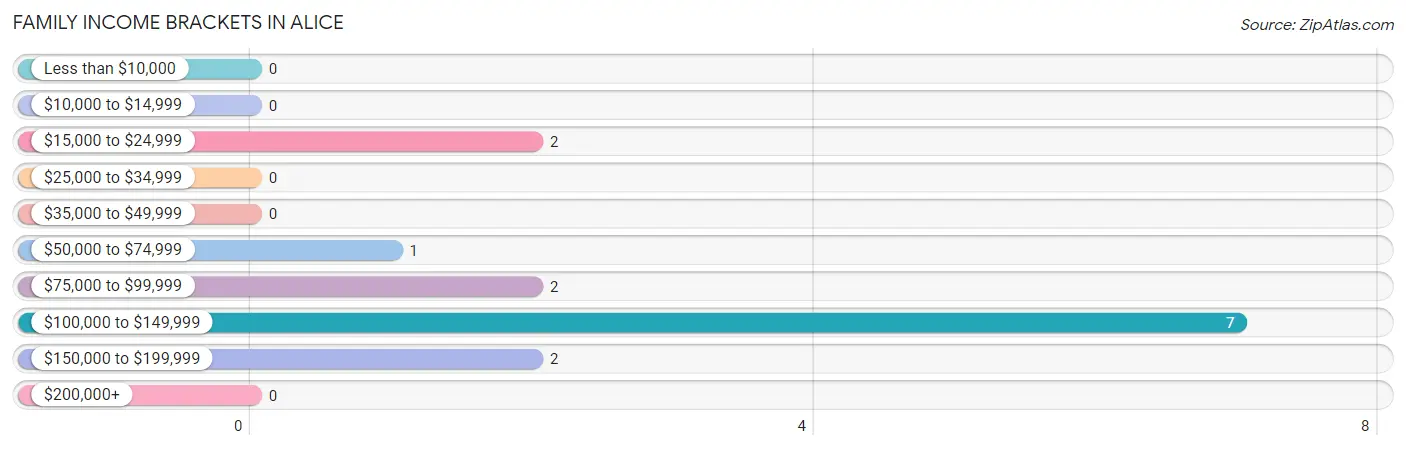
| Income Bracket | # Families | % Families |
| Less than $10,000 | 0 | 0.0% |
| $10,000 to $14,999 | 0 | 0.0% |
| $15,000 to $24,999 | 2 | 14.3% |
| $25,000 to $34,999 | 0 | 0.0% |
| $35,000 to $49,999 | 0 | 0.0% |
| $50,000 to $74,999 | 1 | 7.1% |
| $75,000 to $99,999 | 2 | 14.3% |
| $100,000 to $149,999 | 7 | 50.0% |
| $150,000 to $199,999 | 2 | 14.3% |
| $200,000+ | 0 | 0.0% |
Family Income by Famaliy Size in Alice
2-person families (7 | 50.0%) account for the highest median family income in Alice with $118,125 per family, while 2-person families (7 | 50.0%) have the highest median income of $59,062 per family member.
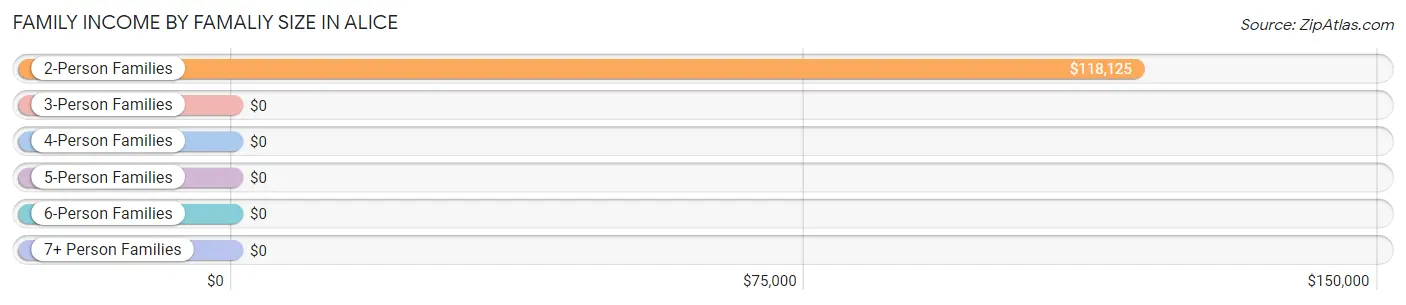
| Income Bracket | # Families | Median Income |
| 2-Person Families | 7 (50.0%) | $118,125 |
| 3-Person Families | 2 (14.3%) | $0 |
| 4-Person Families | 0 (0.0%) | $0 |
| 5-Person Families | 5 (35.7%) | $0 |
| 6-Person Families | 0 (0.0%) | $0 |
| 7+ Person Families | 0 (0.0%) | $0 |
| Total | 14 (100.0%) | $118,214 |
Family Income by Number of Earners in Alice
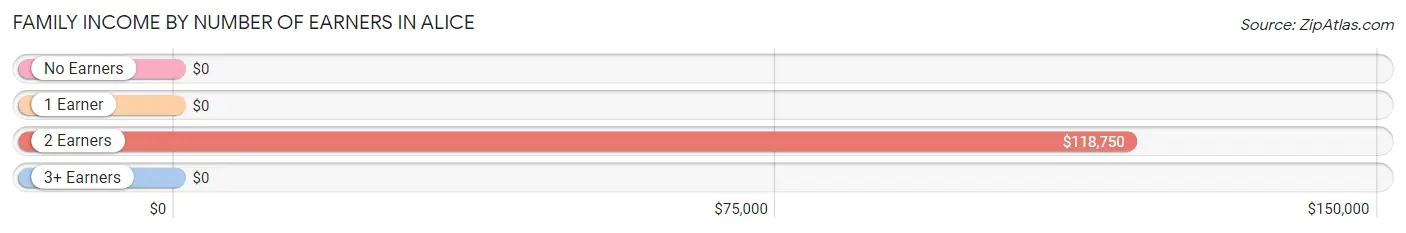
| Number of Earners | # Families | Median Income |
| No Earners | 1 (7.1%) | $0 |
| 1 Earner | 4 (28.6%) | $0 |
| 2 Earners | 9 (64.3%) | $118,750 |
| 3+ Earners | 0 (0.0%) | $0 |
| Total | 14 (100.0%) | $118,214 |
Household Income in Alice
Household Income Brackets in Alice
With 8 households falling in the category, the $100,000 to $149,999 income range is the most frequent in Alice, accounting for 50.0% of all households.
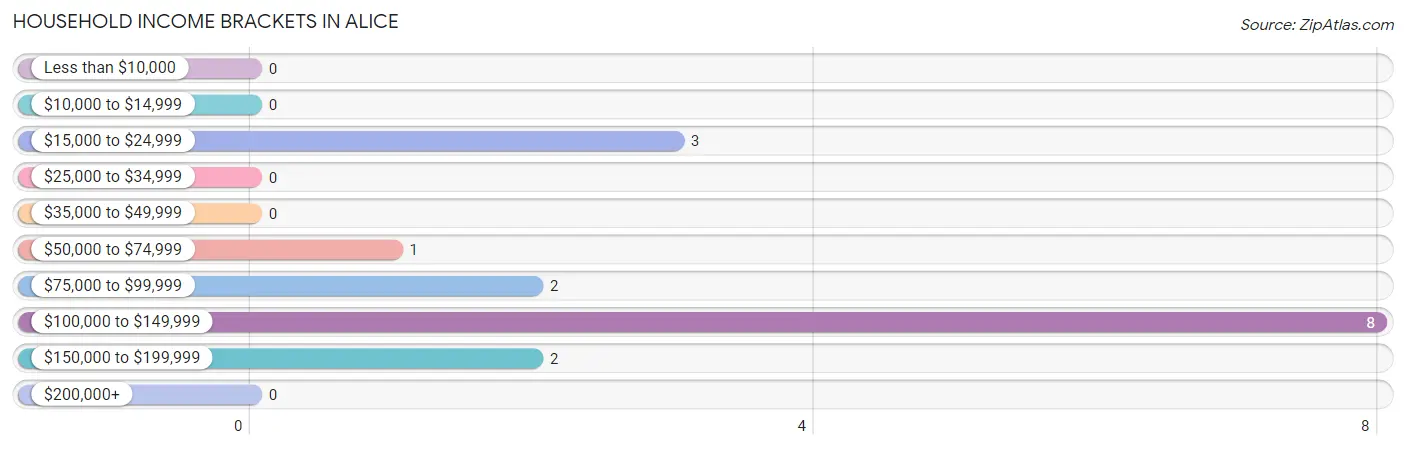
| Income Bracket | # Households | % Households |
| Less than $10,000 | 0 | 0.0% |
| $10,000 to $14,999 | 0 | 0.0% |
| $15,000 to $24,999 | 3 | 18.8% |
| $25,000 to $34,999 | 0 | 0.0% |
| $35,000 to $49,999 | 0 | 0.0% |
| $50,000 to $74,999 | 1 | 6.3% |
| $75,000 to $99,999 | 2 | 12.5% |
| $100,000 to $149,999 | 8 | 50.0% |
| $150,000 to $199,999 | 2 | 12.5% |
| $200,000+ | 0 | 0.0% |
Household Income by Householder Age in Alice
The median household income in Alice is $117,857, with the highest median household income of $108,750 found in the 45 to 64 years age bracket for the primary householder. A total of 5 households (31.2%) fall into this category.
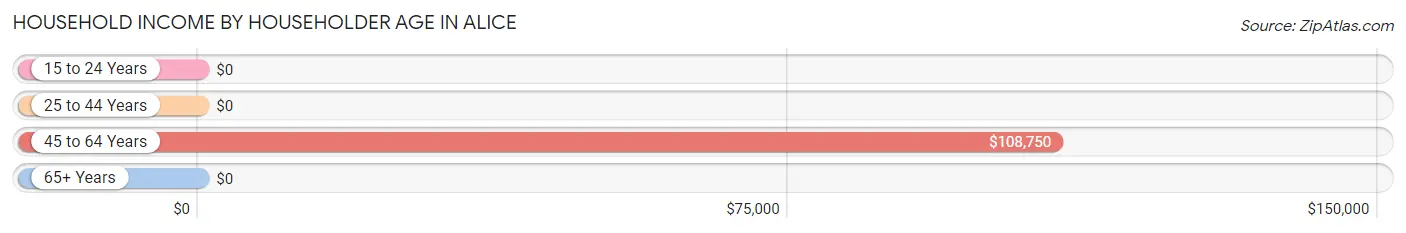
| Income Bracket | # Households | Median Income |
| 15 to 24 Years | 0 (0.0%) | $0 |
| 25 to 44 Years | 7 (43.8%) | $0 |
| 45 to 64 Years | 5 (31.2%) | $108,750 |
| 65+ Years | 4 (25.0%) | $0 |
| Total | 16 (100.0%) | $117,857 |
Poverty in Alice
Income Below Poverty by Sex and Age in Alice
With 4.2% poverty level for males and 15.0% for females among the residents of Alice, 6 to 11 year old males and 6 to 11 year old females are the most vulnerable to poverty, with 1 males (16.7%) and 1 females (100.0%) in their respective age groups living below the poverty level.
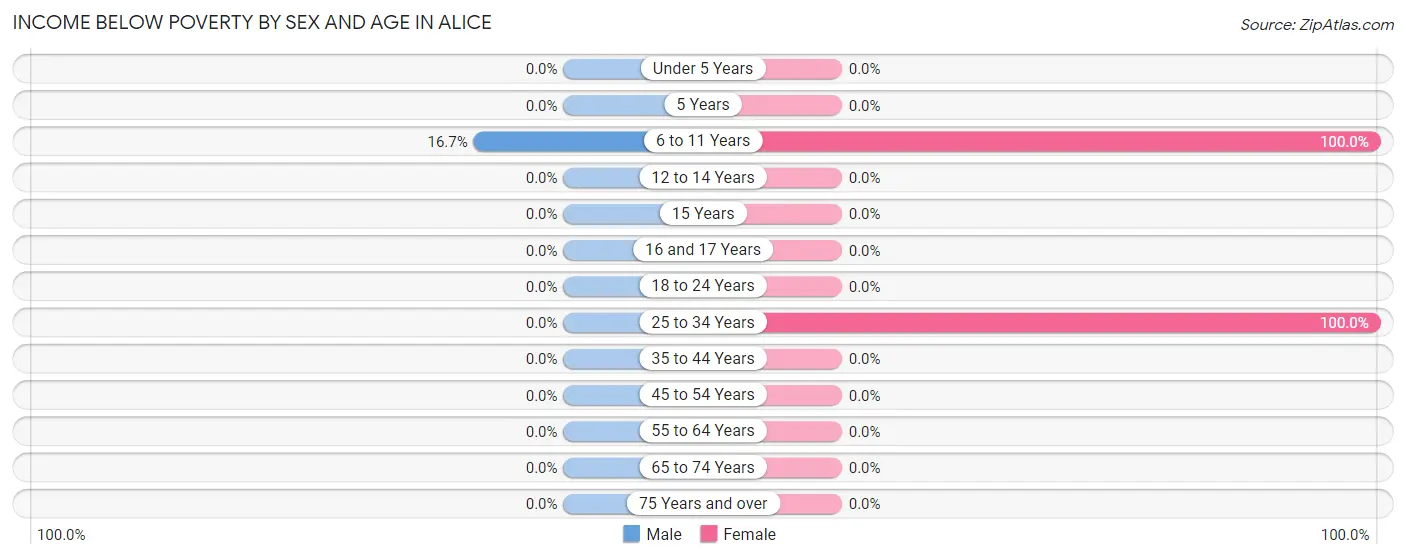
| Age Bracket | Male | Female |
| Under 5 Years | 0 (0.0%) | 0 (0.0%) |
| 5 Years | 0 (0.0%) | 0 (0.0%) |
| 6 to 11 Years | 1 (16.7%) | 1 (100.0%) |
| 12 to 14 Years | 0 (0.0%) | 0 (0.0%) |
| 15 Years | 0 (0.0%) | 0 (0.0%) |
| 16 and 17 Years | 0 (0.0%) | 0 (0.0%) |
| 18 to 24 Years | 0 (0.0%) | 0 (0.0%) |
| 25 to 34 Years | 0 (0.0%) | 2 (100.0%) |
| 35 to 44 Years | 0 (0.0%) | 0 (0.0%) |
| 45 to 54 Years | 0 (0.0%) | 0 (0.0%) |
| 55 to 64 Years | 0 (0.0%) | 0 (0.0%) |
| 65 to 74 Years | 0 (0.0%) | 0 (0.0%) |
| 75 Years and over | 0 (0.0%) | 0 (0.0%) |
| Total | 1 (4.2%) | 3 (15.0%) |
Income Above Poverty by Sex and Age in Alice
According to the poverty statistics in Alice, males aged 15 years and females aged 12 to 14 years are the age groups that are most secure financially, with 100.0% of males and 100.0% of females in these age groups living above the poverty line.
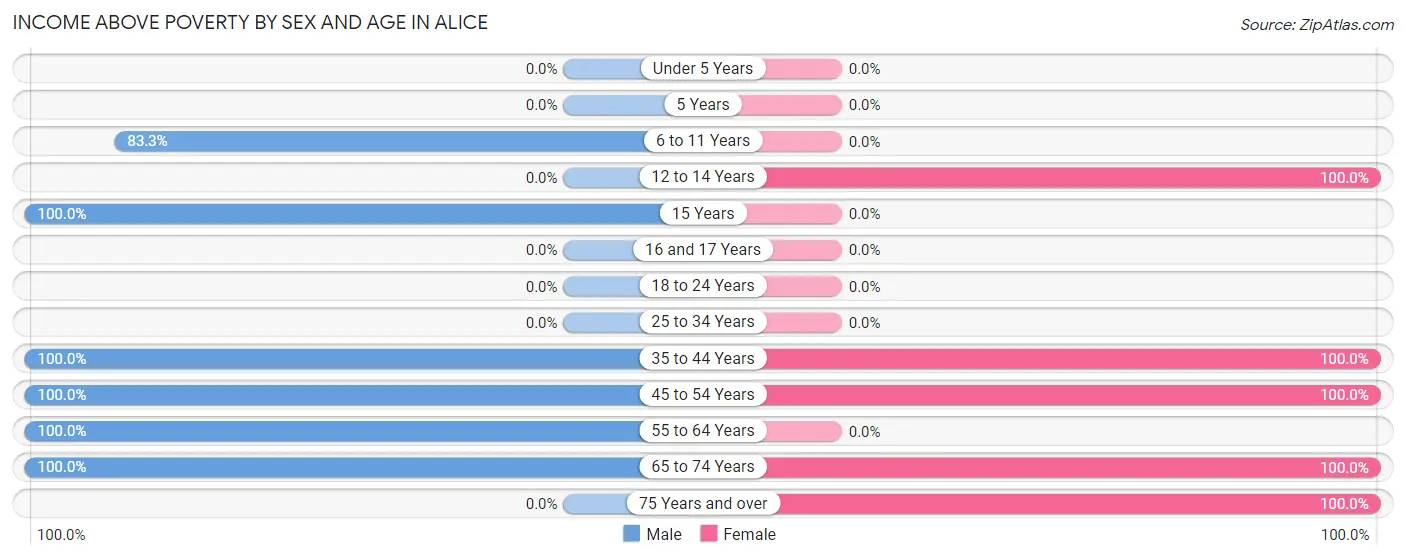
| Age Bracket | Male | Female |
| Under 5 Years | 0 (0.0%) | 0 (0.0%) |
| 5 Years | 0 (0.0%) | 0 (0.0%) |
| 6 to 11 Years | 5 (83.3%) | 0 (0.0%) |
| 12 to 14 Years | 0 (0.0%) | 5 (100.0%) |
| 15 Years | 5 (100.0%) | 0 (0.0%) |
| 16 and 17 Years | 0 (0.0%) | 0 (0.0%) |
| 18 to 24 Years | 0 (0.0%) | 0 (0.0%) |
| 25 to 34 Years | 0 (0.0%) | 0 (0.0%) |
| 35 to 44 Years | 6 (100.0%) | 5 (100.0%) |
| 45 to 54 Years | 3 (100.0%) | 5 (100.0%) |
| 55 to 64 Years | 1 (100.0%) | 0 (0.0%) |
| 65 to 74 Years | 3 (100.0%) | 1 (100.0%) |
| 75 Years and over | 0 (0.0%) | 1 (100.0%) |
| Total | 23 (95.8%) | 17 (85.0%) |
Income Below Poverty Among Married-Couple Families in Alice

| Children | Above Poverty | Below Poverty |
| No Children | 5 (100.0%) | 0 (0.0%) |
| 1 or 2 Children | 0 (0.0%) | 0 (0.0%) |
| 3 or 4 Children | 5 (100.0%) | 0 (0.0%) |
| 5 or more Children | 0 (0.0%) | 0 (0.0%) |
| Total | 10 (100.0%) | 0 (0.0%) |
Income Below Poverty Among Single-Parent Households in Alice
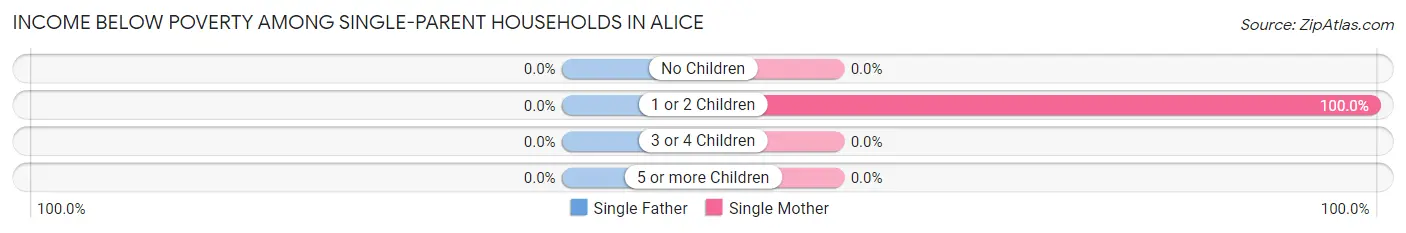
| Children | Single Father | Single Mother |
| No Children | 0 (0.0%) | 0 (0.0%) |
| 1 or 2 Children | 0 (0.0%) | 2 (100.0%) |
| 3 or 4 Children | 0 (0.0%) | 0 (0.0%) |
| 5 or more Children | 0 (0.0%) | 0 (0.0%) |
| Total | 0 (0.0%) | 2 (100.0%) |
Income Below Poverty Among Married-Couple vs Single-Parent Households in Alice
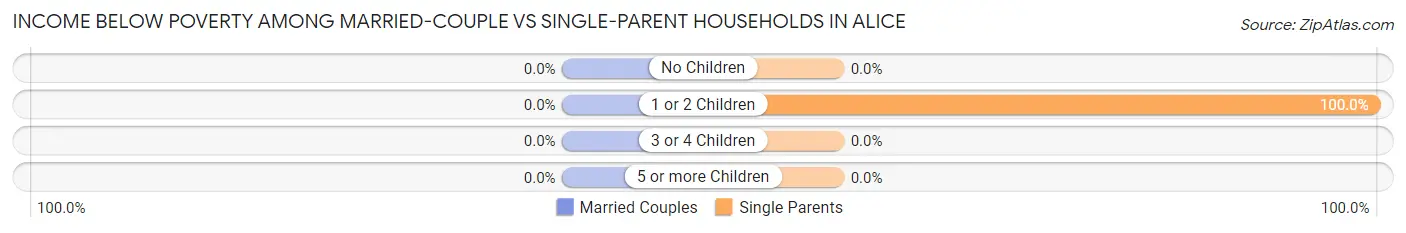
| Children | Married-Couple Families | Single-Parent Households |
| No Children | 0 (0.0%) | 0 (0.0%) |
| 1 or 2 Children | 0 (0.0%) | 2 (100.0%) |
| 3 or 4 Children | 0 (0.0%) | 0 (0.0%) |
| 5 or more Children | 0 (0.0%) | 0 (0.0%) |
| Total | 0 (0.0%) | 2 (50.0%) |
Race in Alice
The most populous races in Alice are , and White / Caucasian (44 | 100.0%).
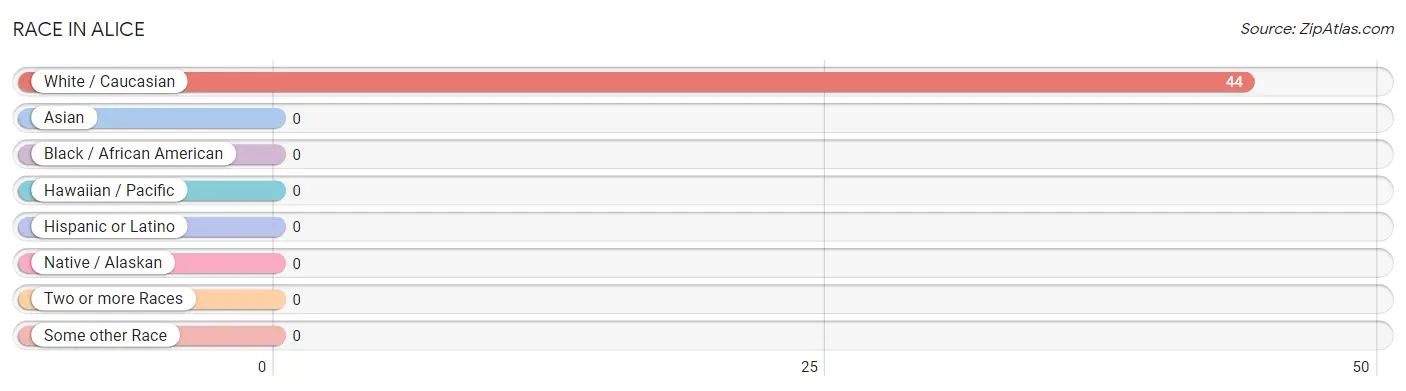
| Race | # Population | % Population |
| Asian | 0 | 0.0% |
| Black / African American | 0 | 0.0% |
| Hawaiian / Pacific | 0 | 0.0% |
| Hispanic or Latino | 0 | 0.0% |
| Native / Alaskan | 0 | 0.0% |
| White / Caucasian | 44 | 100.0% |
| Two or more Races | 0 | 0.0% |
| Some other Race | 0 | 0.0% |
| Total | 44 | 100.0% |
Ancestry in Alice
The most populous ancestries reported in Alice are German (32 | 72.7%), Czech (20 | 45.5%), Norwegian (12 | 27.3%), French (2 | 4.5%), and Icelander (2 | 4.5%), together accounting for 154.6% of all Alice residents.
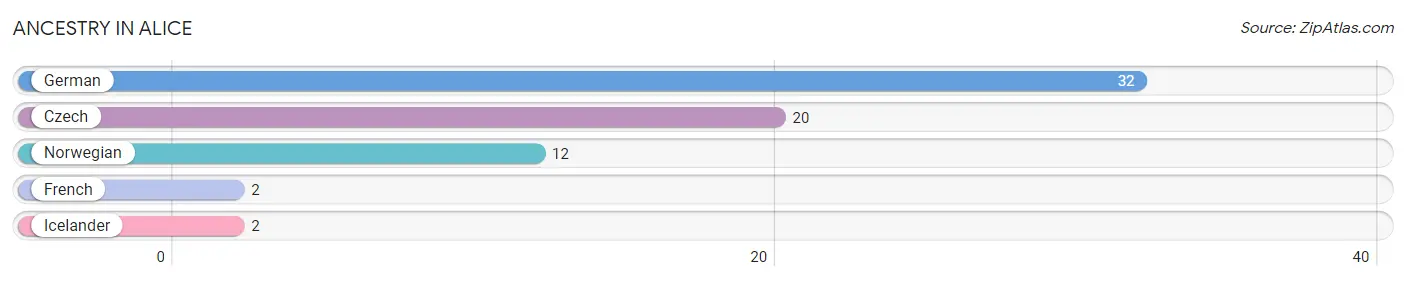
| Ancestry | # Population | % Population |
| Czech | 20 | 45.5% |
| French | 2 | 4.5% |
| German | 32 | 72.7% |
| Icelander | 2 | 4.5% |
| Norwegian | 12 | 27.3% | View All 5 Rows |
Immigrants in Alice

| Immigration Origin | # Population | % Population | View All 0 Rows |
Sex and Age in Alice
Sex and Age in Alice
The most populous age groups in Alice are 35 to 39 Years (6 | 25.0%) for men and 10 to 14 Years (6 | 30.0%) for women.
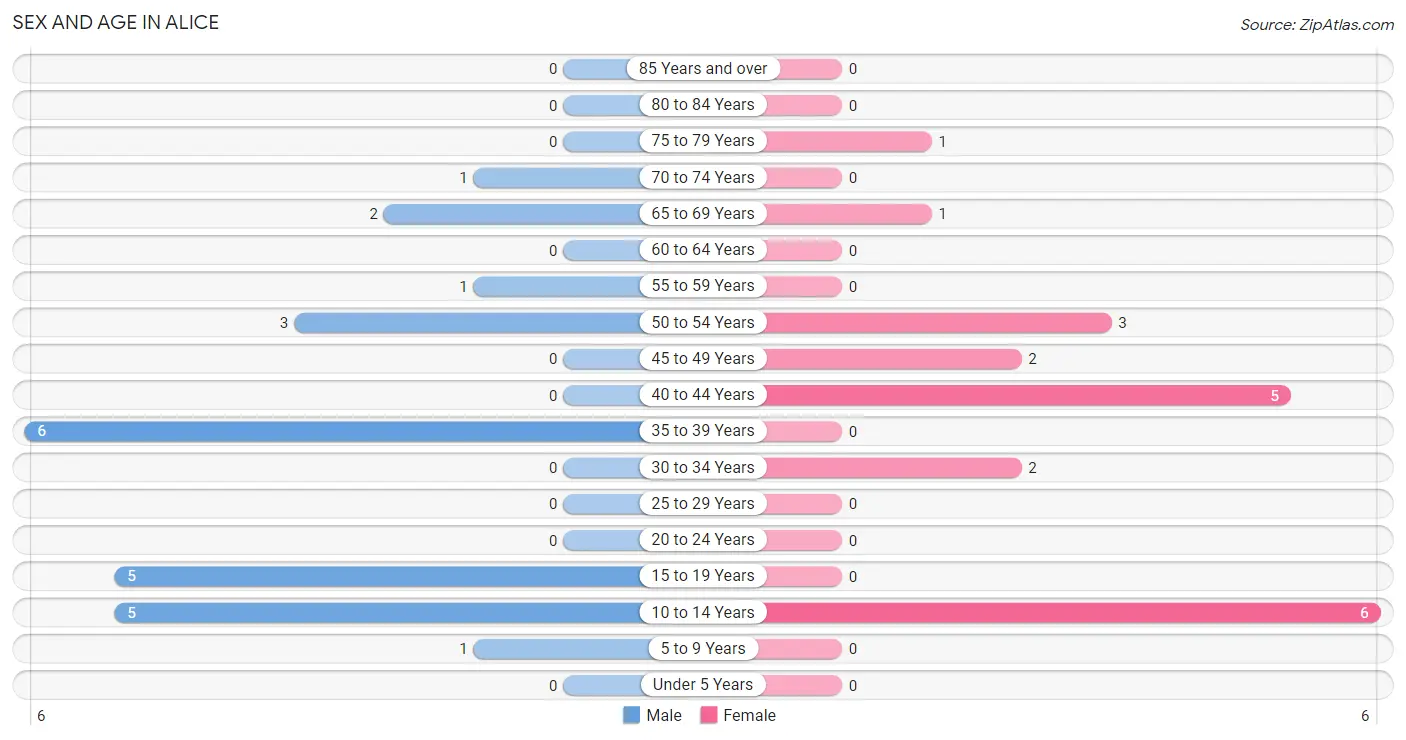
| Age Bracket | Male | Female |
| Under 5 Years | 0 (0.0%) | 0 (0.0%) |
| 5 to 9 Years | 1 (4.2%) | 0 (0.0%) |
| 10 to 14 Years | 5 (20.8%) | 6 (30.0%) |
| 15 to 19 Years | 5 (20.8%) | 0 (0.0%) |
| 20 to 24 Years | 0 (0.0%) | 0 (0.0%) |
| 25 to 29 Years | 0 (0.0%) | 0 (0.0%) |
| 30 to 34 Years | 0 (0.0%) | 2 (10.0%) |
| 35 to 39 Years | 6 (25.0%) | 0 (0.0%) |
| 40 to 44 Years | 0 (0.0%) | 5 (25.0%) |
| 45 to 49 Years | 0 (0.0%) | 2 (10.0%) |
| 50 to 54 Years | 3 (12.5%) | 3 (15.0%) |
| 55 to 59 Years | 1 (4.2%) | 0 (0.0%) |
| 60 to 64 Years | 0 (0.0%) | 0 (0.0%) |
| 65 to 69 Years | 2 (8.3%) | 1 (5.0%) |
| 70 to 74 Years | 1 (4.2%) | 0 (0.0%) |
| 75 to 79 Years | 0 (0.0%) | 1 (5.0%) |
| 80 to 84 Years | 0 (0.0%) | 0 (0.0%) |
| 85 Years and over | 0 (0.0%) | 0 (0.0%) |
| Total | 24 (100.0%) | 20 (100.0%) |
Families and Households in Alice
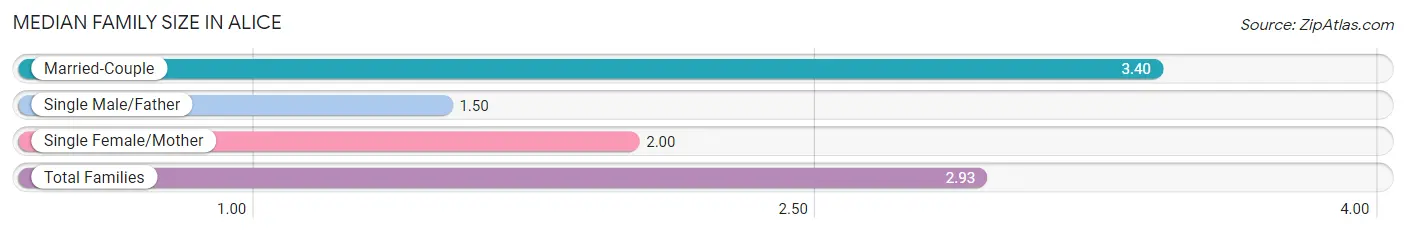
Median Family Size in Alice
The median family size in Alice is 2.93 persons per family, with married-couple families (10 | 71.4%) accounting for the largest median family size of 3.4 persons per family. On the other hand, single male/father families (2 | 14.3%) represent the smallest median family size with 1.50 persons per family.
| Family Type | # Families | Family Size |
| Married-Couple | 10 (71.4%) | 3.40 |
| Single Male/Father | 2 (14.3%) | 1.50 |
| Single Female/Mother | 2 (14.3%) | 2.00 |
| Total Families | 14 (100.0%) | 2.93 |
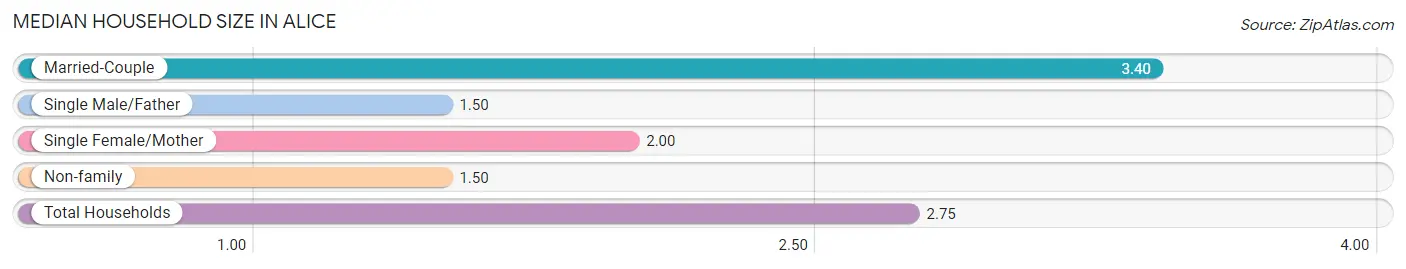
Median Household Size in Alice
The median household size in Alice is 2.75 persons per household, with married-couple households (10 | 62.5%) accounting for the largest median household size of 3.4 persons per household. single male/father households (2 | 12.5%) represent the smallest median household size with 1.50 persons per household.
| Household Type | # Households | Household Size |
| Married-Couple | 10 (62.5%) | 3.40 |
| Single Male/Father | 2 (12.5%) | 1.50 |
| Single Female/Mother | 2 (12.5%) | 2.00 |
| Non-family | 2 (12.5%) | 1.50 |
| Total Households | 16 (100.0%) | 2.75 |
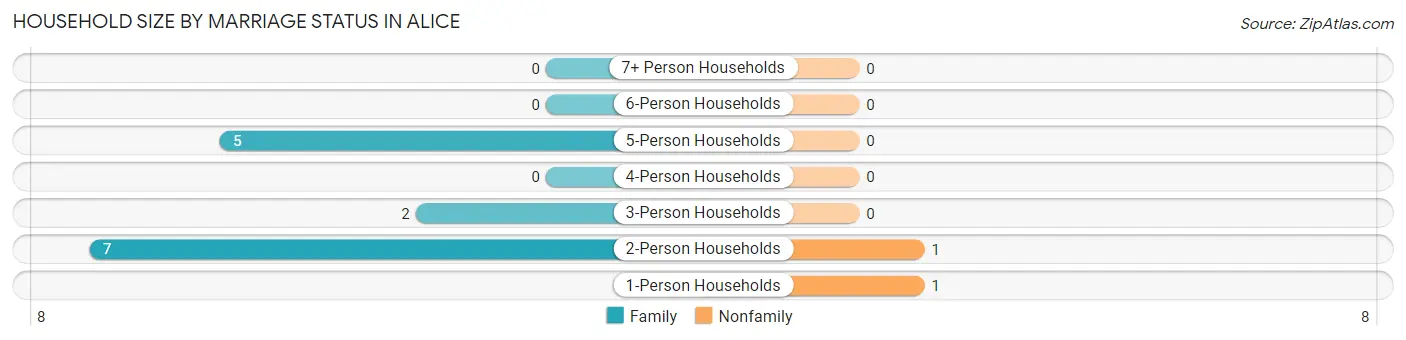
Household Size by Marriage Status in Alice
Out of a total of 16 households in Alice, 14 (87.5%) are family households, while 2 (12.5%) are nonfamily households. The most numerous type of family households are 2-person households, comprising 7, and the most common type of nonfamily households are 1-person households, comprising 1.
| Household Size | Family Households | Nonfamily Households |
| 1-Person Households | - | 1 (6.2%) |
| 2-Person Households | 7 (43.8%) | 1 (6.2%) |
| 3-Person Households | 2 (12.5%) | 0 (0.0%) |
| 4-Person Households | 0 (0.0%) | 0 (0.0%) |
| 5-Person Households | 5 (31.2%) | 0 (0.0%) |
| 6-Person Households | 0 (0.0%) | 0 (0.0%) |
| 7+ Person Households | 0 (0.0%) | 0 (0.0%) |
| Total | 14 (87.5%) | 2 (12.5%) |
Female Fertility in Alice
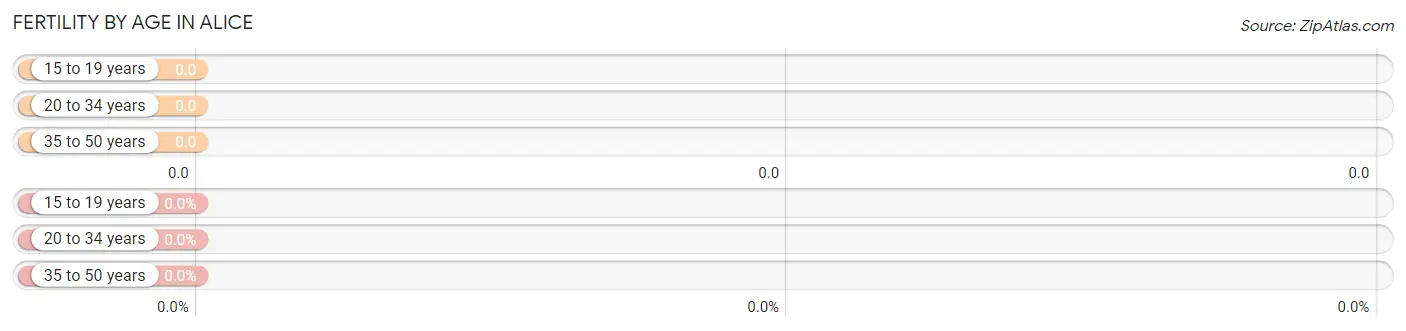
Fertility by Age in Alice
| Age Bracket | Women with Births | Births / 1,000 Women |
| 15 to 19 years | 0 (0.0%) | 0.0 |
| 20 to 34 years | 0 (0.0%) | 0.0 |
| 35 to 50 years | 0 (0.0%) | 0.0 |
| Total | 0 (0.0%) | 0.0 |
Fertility by Age by Marriage Status in Alice
| Age Bracket | Married | Unmarried |
| 15 to 19 years | 0 (0.0%) | 0 (0.0%) |
| 20 to 34 years | 0 (0.0%) | 0 (0.0%) |
| 35 to 50 years | 0 (0.0%) | 0 (0.0%) |
| Total | 0 (0.0%) | 0 (0.0%) |
Fertility by Education in Alice
| Educational Attainment | Women with Births | Births / 1,000 Women |
| Less than High School | 0 (0.0%) | 0.0 |
| High School Diploma | 0 (0.0%) | 0.0 |
| College or Associate's Degree | 0 (0.0%) | 0.0 |
| Bachelor's Degree | 0 (0.0%) | 0.0 |
| Graduate Degree | 0 (0.0%) | 0.0 |
| Total | 0 (0.0%) | 0.0 |
Fertility by Education by Marriage Status in Alice
| Educational Attainment | Married | Unmarried |
| Less than High School | 0 (0.0%) | 0 (0.0%) |
| High School Diploma | 0 (0.0%) | 0 (0.0%) |
| College or Associate's Degree | 0 (0.0%) | 0 (0.0%) |
| Bachelor's Degree | 0 (0.0%) | 0 (0.0%) |
| Graduate Degree | 0 (0.0%) | 0 (0.0%) |
| Total | 0 (0.0%) | 0 (0.0%) |
Employment Characteristics in Alice
Employment by Class of Employer in Alice
Among the 22 employed individuals in Alice, private company employees (18 | 81.8%), not-for-profit organizations (2 | 9.1%), and local government employees (2 | 9.1%) make up the most common classes of employment.
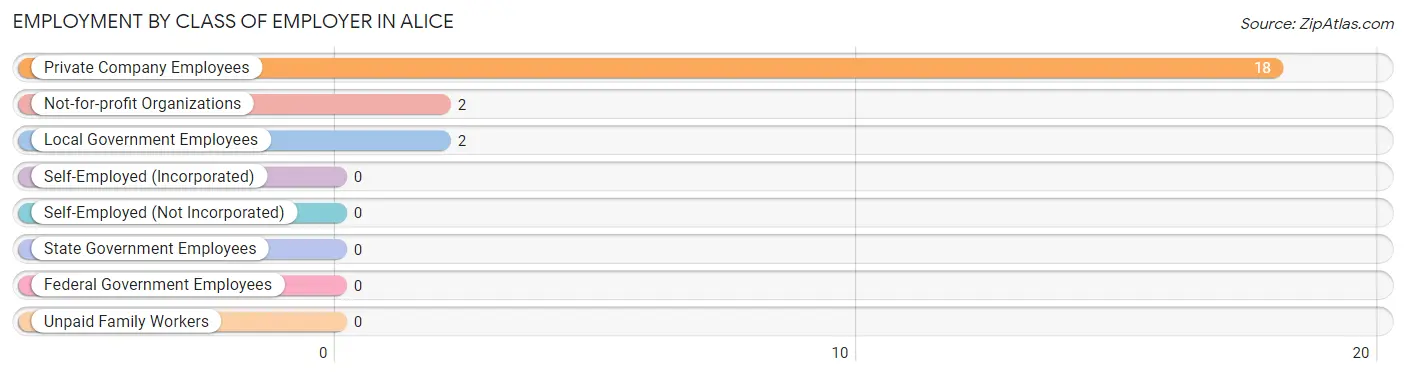
| Employer Class | # Employees | % Employees |
| Private Company Employees | 18 | 81.8% |
| Self-Employed (Incorporated) | 0 | 0.0% |
| Self-Employed (Not Incorporated) | 0 | 0.0% |
| Not-for-profit Organizations | 2 | 9.1% |
| Local Government Employees | 2 | 9.1% |
| State Government Employees | 0 | 0.0% |
| Federal Government Employees | 0 | 0.0% |
| Unpaid Family Workers | 0 | 0.0% |
| Total | 22 | 100.0% |
Employment Status by Age in Alice
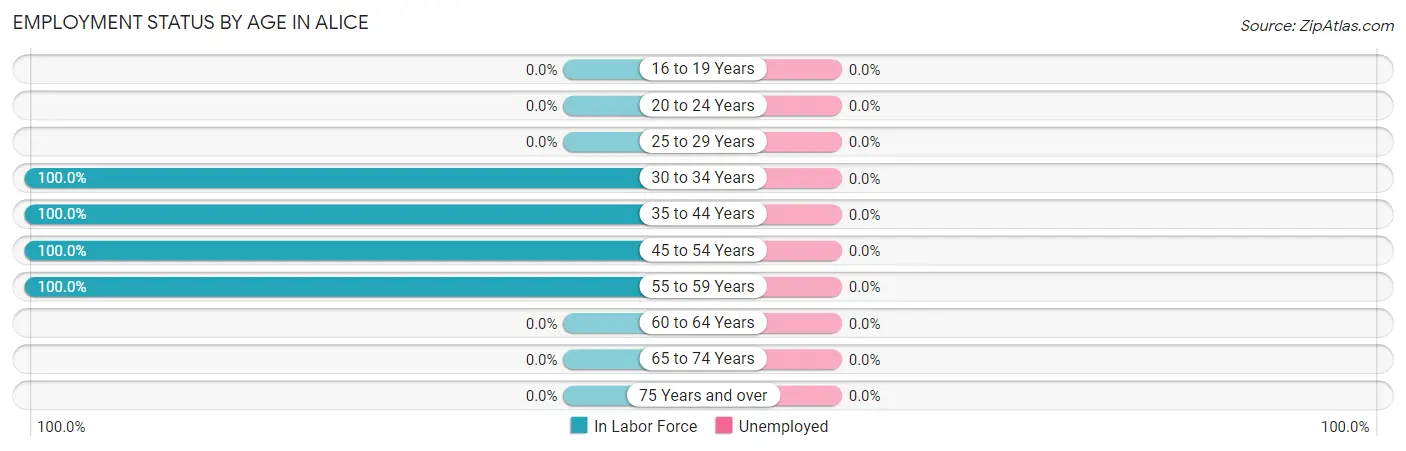
| Age Bracket | In Labor Force | Unemployed |
| 16 to 19 Years | 0 (0.0%) | 0 (0.0%) |
| 20 to 24 Years | 0 (0.0%) | 0 (0.0%) |
| 25 to 29 Years | 0 (0.0%) | 0 (0.0%) |
| 30 to 34 Years | 2 (100.0%) | 0 (0.0%) |
| 35 to 44 Years | 11 (100.0%) | 0 (0.0%) |
| 45 to 54 Years | 8 (100.0%) | 0 (0.0%) |
| 55 to 59 Years | 1 (100.0%) | 0 (0.0%) |
| 60 to 64 Years | 0 (0.0%) | 0 (0.0%) |
| 65 to 74 Years | 0 (0.0%) | 0 (0.0%) |
| 75 Years and over | 0 (0.0%) | 0 (0.0%) |
| Total | 22 (81.5%) | 0 (0.0%) |
Employment Status by Educational Attainment in Alice
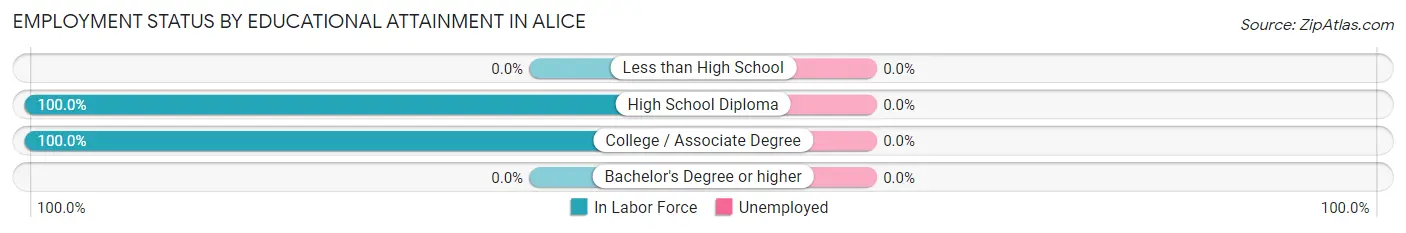
| Educational Attainment | In Labor Force | Unemployed |
| Less than High School | 0 (0.0%) | 0 (0.0%) |
| High School Diploma | 15 (100.0%) | 0 (0.0%) |
| College / Associate Degree | 7 (100.0%) | 0 (0.0%) |
| Bachelor's Degree or higher | 0 (0.0%) | 0 (0.0%) |
| Total | 22 (100.0%) | 0 (0.0%) |
Employment Occupations by Sex in Alice
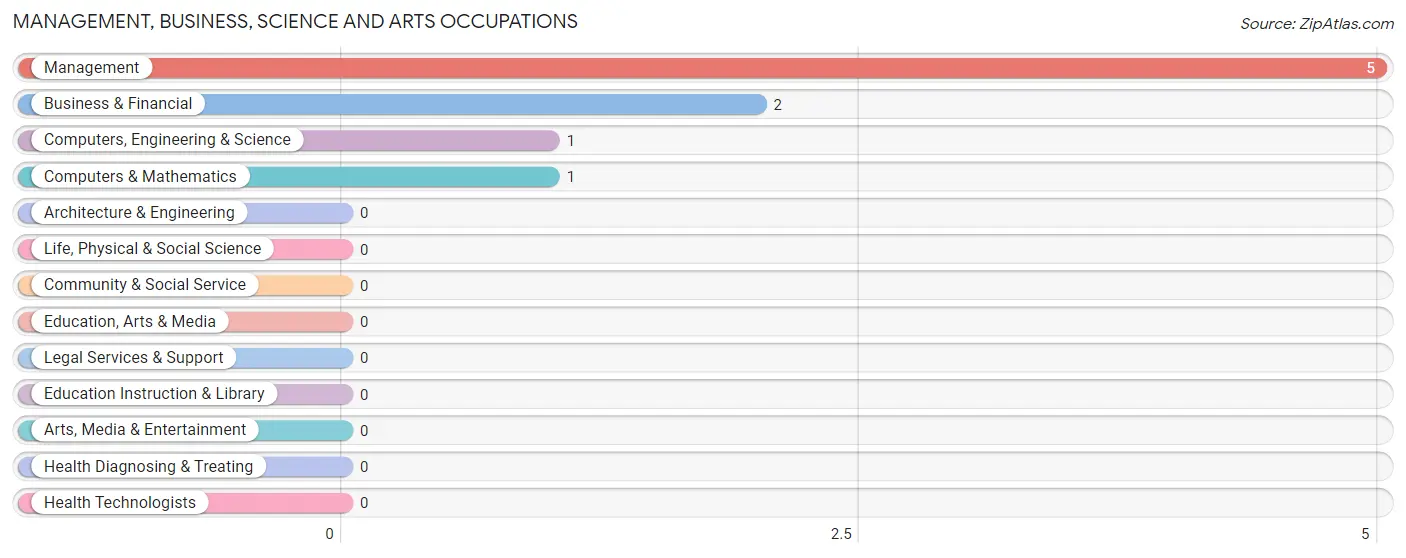
Management, Business, Science and Arts Occupations
The most common Management, Business, Science and Arts occupations in Alice are Management (5 | 22.7%), Business & Financial (2 | 9.1%), Computers, Engineering & Science (1 | 4.5%), and Computers & Mathematics (1 | 4.5%).
Management, Business, Science and Arts Occupations by Sex
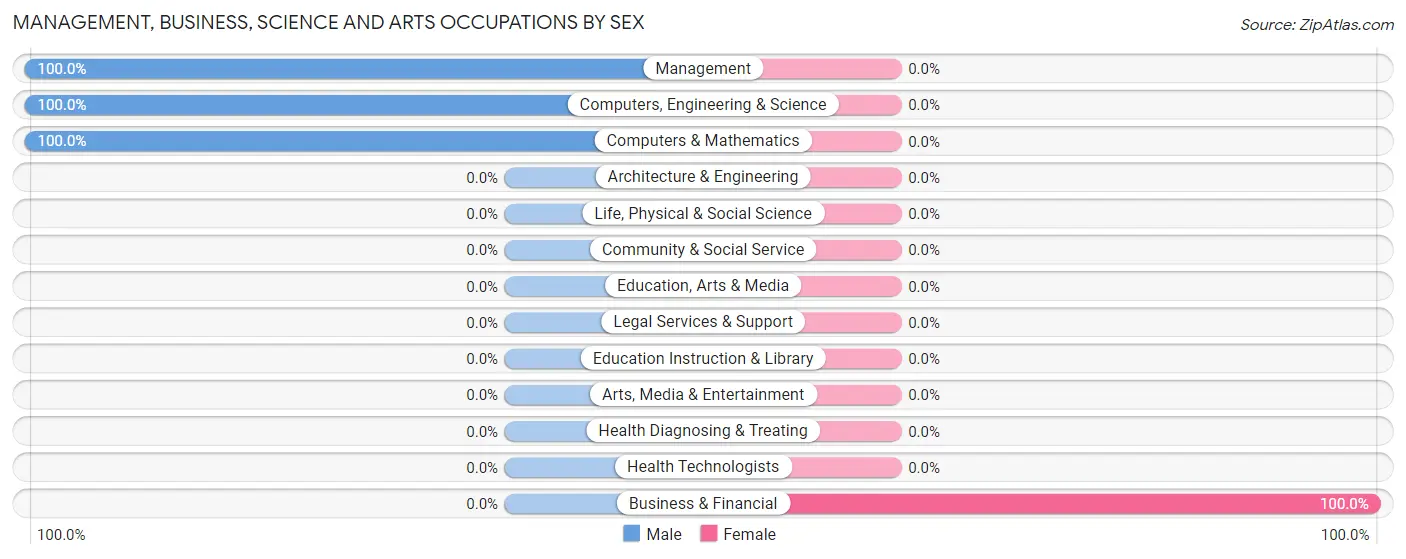
| Occupation | Male | Female |
| Management | 5 (100.0%) | 0 (0.0%) |
| Business & Financial | 0 (0.0%) | 2 (100.0%) |
| Computers, Engineering & Science | 1 (100.0%) | 0 (0.0%) |
| Computers & Mathematics | 1 (100.0%) | 0 (0.0%) |
| Architecture & Engineering | 0 (0.0%) | 0 (0.0%) |
| Life, Physical & Social Science | 0 (0.0%) | 0 (0.0%) |
| Community & Social Service | 0 (0.0%) | 0 (0.0%) |
| Education, Arts & Media | 0 (0.0%) | 0 (0.0%) |
| Legal Services & Support | 0 (0.0%) | 0 (0.0%) |
| Education Instruction & Library | 0 (0.0%) | 0 (0.0%) |
| Arts, Media & Entertainment | 0 (0.0%) | 0 (0.0%) |
| Health Diagnosing & Treating | 0 (0.0%) | 0 (0.0%) |
| Health Technologists | 0 (0.0%) | 0 (0.0%) |
| Total (Category) | 6 (75.0%) | 2 (25.0%) |
| Total (Overall) | 10 (45.5%) | 12 (54.5%) |
Services Occupations
The most common Services occupations in Alice are , and Healthcare Support (7 | 31.8%).
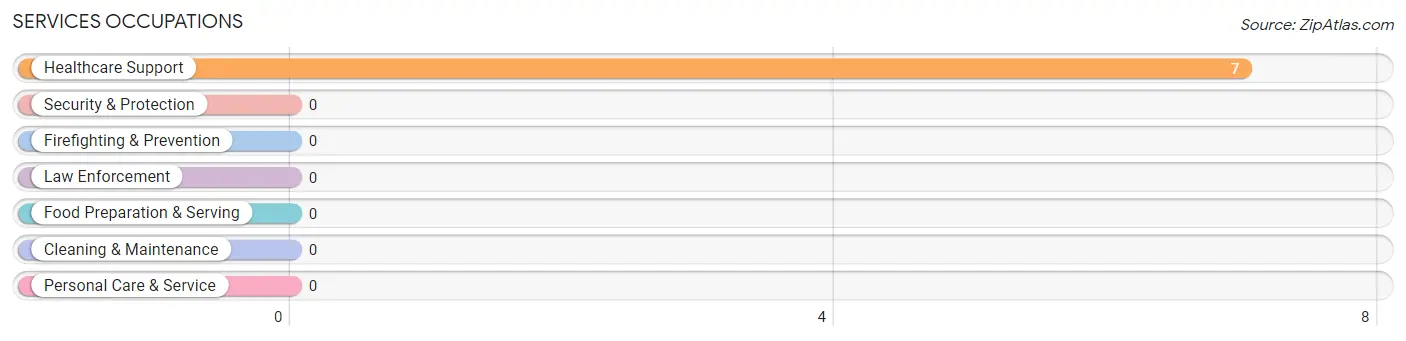
Services Occupations by Sex
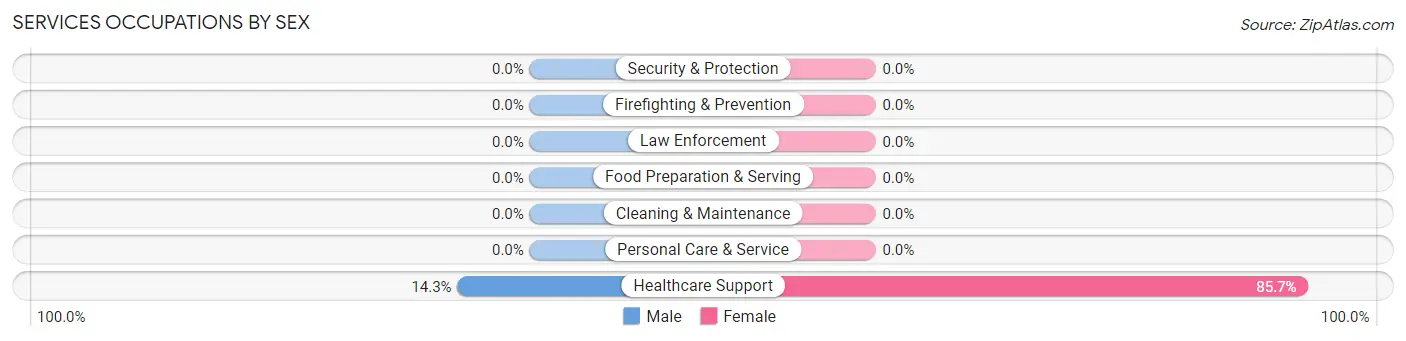
| Occupation | Male | Female |
| Healthcare Support | 1 (14.3%) | 6 (85.7%) |
| Security & Protection | 0 (0.0%) | 0 (0.0%) |
| Firefighting & Prevention | 0 (0.0%) | 0 (0.0%) |
| Law Enforcement | 0 (0.0%) | 0 (0.0%) |
| Food Preparation & Serving | 0 (0.0%) | 0 (0.0%) |
| Cleaning & Maintenance | 0 (0.0%) | 0 (0.0%) |
| Personal Care & Service | 0 (0.0%) | 0 (0.0%) |
| Total (Category) | 1 (14.3%) | 6 (85.7%) |
| Total (Overall) | 10 (45.5%) | 12 (54.5%) |
Sales and Office Occupations
The most common Sales and Office occupations in Alice are , and Sales & Related (4 | 18.2%).
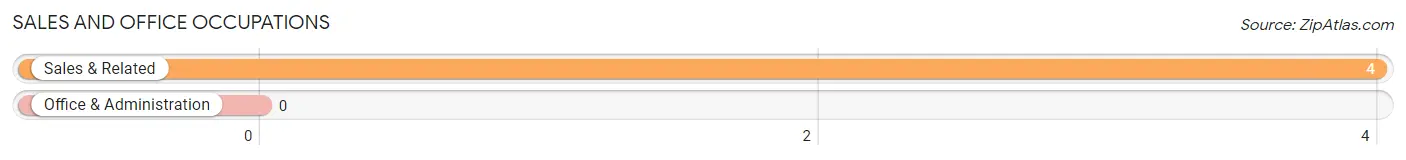
Sales and Office Occupations by Sex
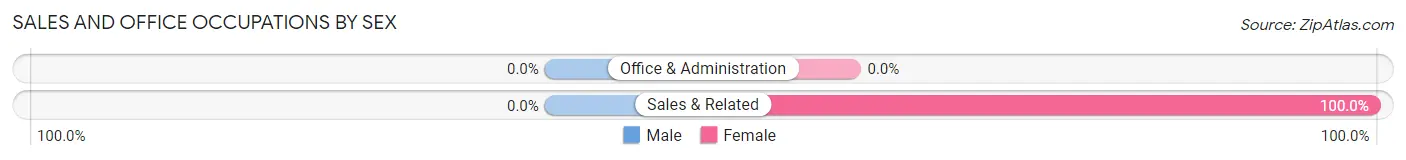
| Occupation | Male | Female |
| Sales & Related | 0 (0.0%) | 4 (100.0%) |
| Office & Administration | 0 (0.0%) | 0 (0.0%) |
| Total (Category) | 0 (0.0%) | 4 (100.0%) |
| Total (Overall) | 10 (45.5%) | 12 (54.5%) |
Natural Resources, Construction and Maintenance Occupations
Natural Resources, Construction and Maintenance Occupations by Sex
| Occupation | Male | Female |
| Farming, Fishing & Forestry | 0 (0.0%) | 0 (0.0%) |
| Construction & Extraction | 0 (0.0%) | 0 (0.0%) |
| Installation, Maintenance & Repair | 0 (0.0%) | 0 (0.0%) |
| Total (Category) | 0 (0.0%) | 0 (0.0%) |
| Total (Overall) | 10 (45.5%) | 12 (54.5%) |
Production, Transportation and Moving Occupations
The most common Production, Transportation and Moving occupations in Alice are , and Production (3 | 13.6%).
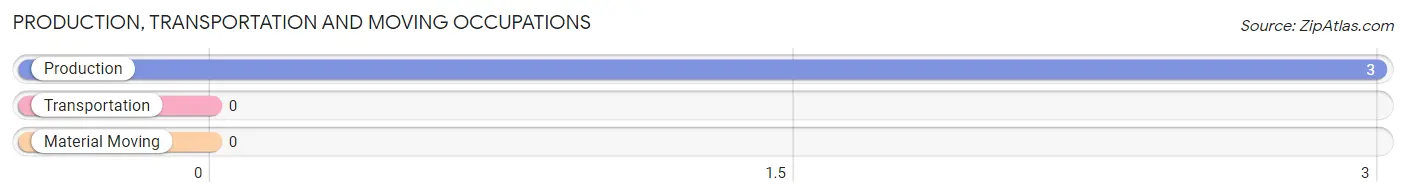
Production, Transportation and Moving Occupations by Sex
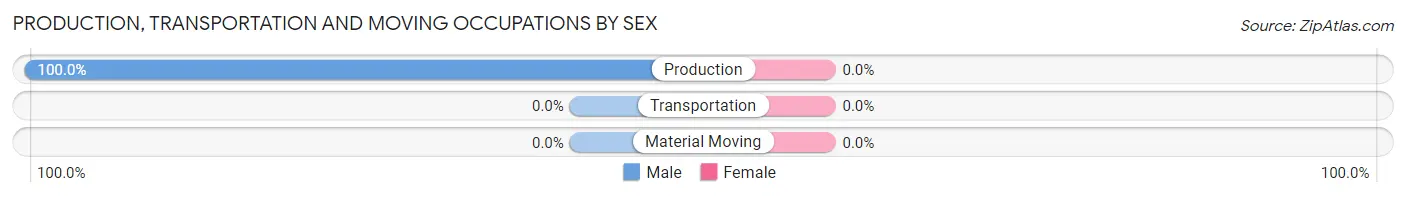
| Occupation | Male | Female |
| Production | 3 (100.0%) | 0 (0.0%) |
| Transportation | 0 (0.0%) | 0 (0.0%) |
| Material Moving | 0 (0.0%) | 0 (0.0%) |
| Total (Category) | 3 (100.0%) | 0 (0.0%) |
| Total (Overall) | 10 (45.5%) | 12 (54.5%) |
Employment Industries by Sex in Alice
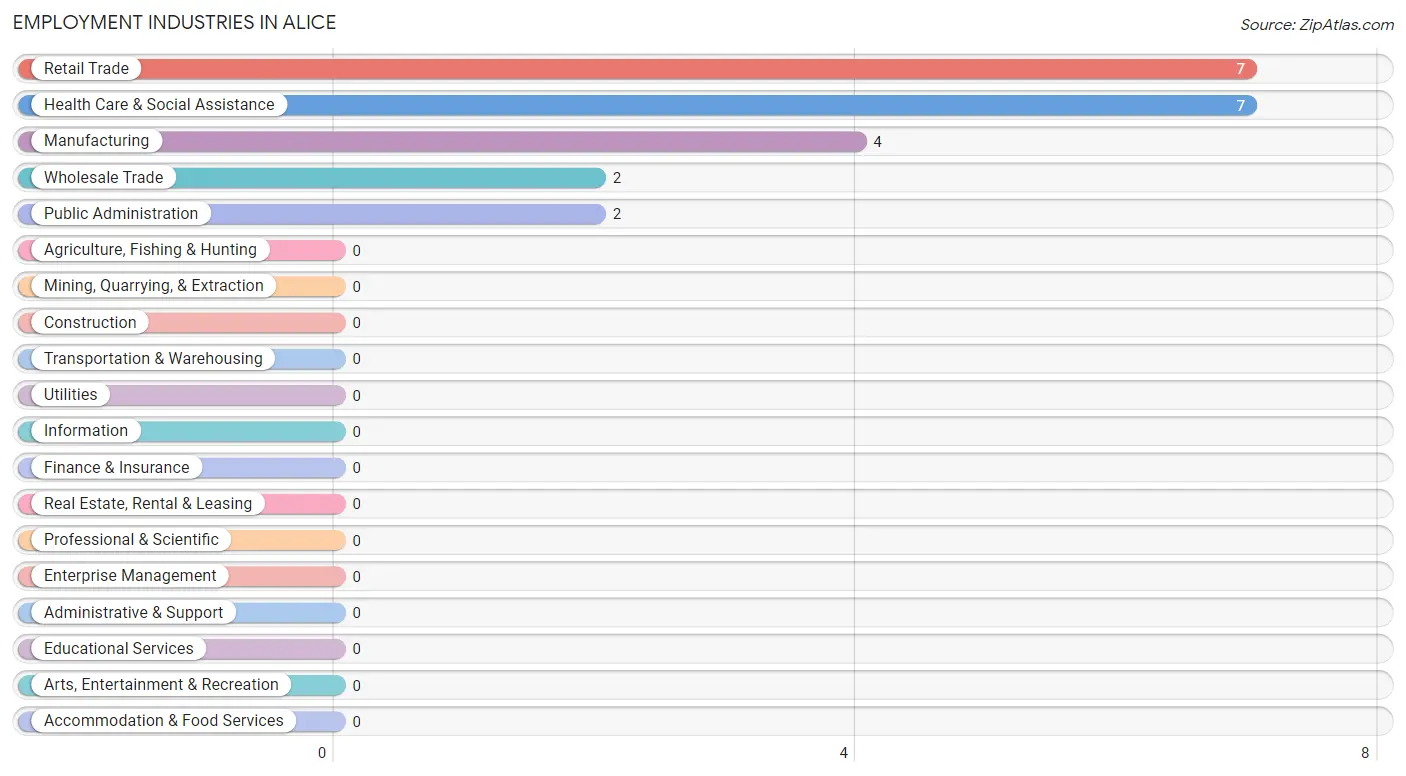
Employment Industries in Alice
The major employment industries in Alice include Retail Trade (7 | 31.8%), Health Care & Social Assistance (7 | 31.8%), Manufacturing (4 | 18.2%), Wholesale Trade (2 | 9.1%), and Public Administration (2 | 9.1%).
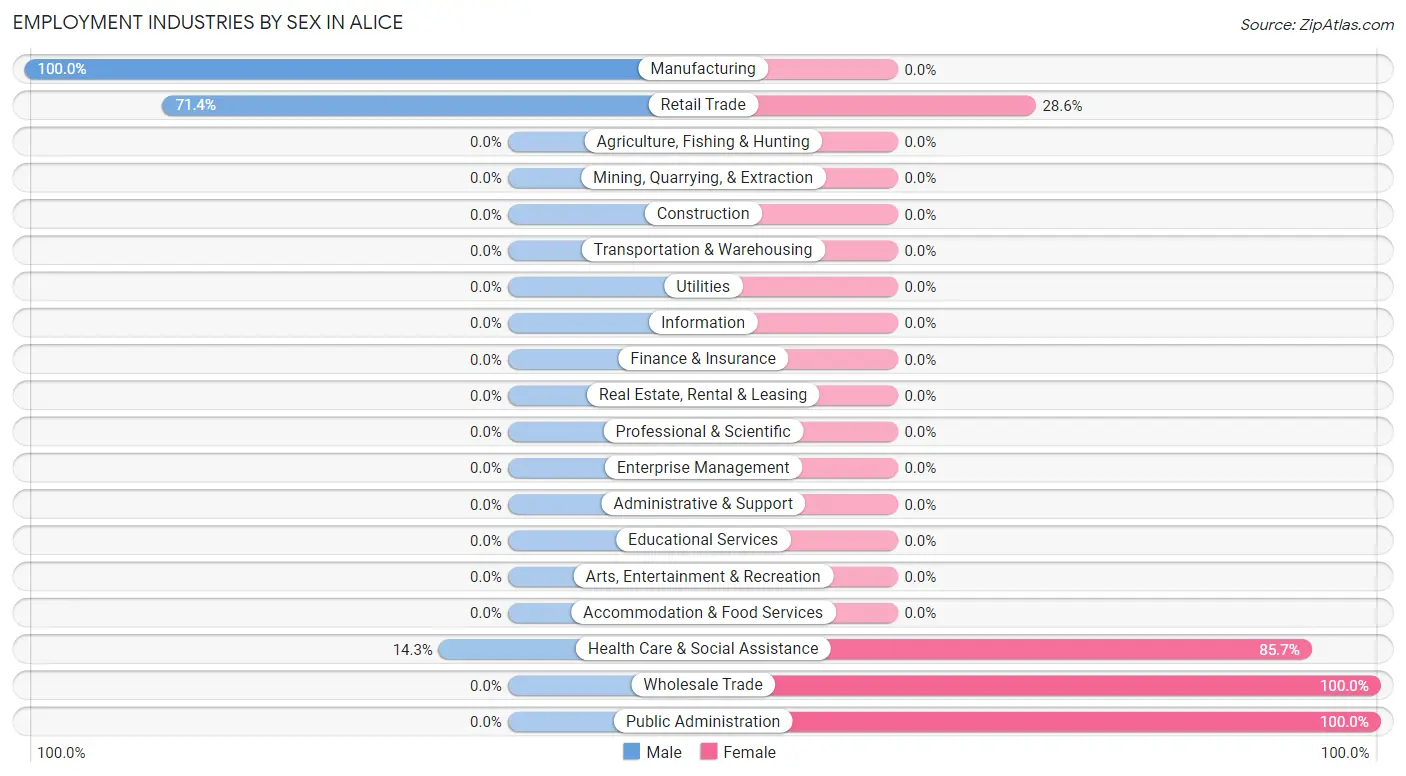
Employment Industries by Sex in Alice
The Alice industries that see more men than women are Manufacturing (100.0%), Retail Trade (71.4%), and Health Care & Social Assistance (14.3%), whereas the industries that tend to have a higher number of women are Wholesale Trade (100.0%), Public Administration (100.0%), and Health Care & Social Assistance (85.7%).
| Industry | Male | Female |
| Agriculture, Fishing & Hunting | 0 (0.0%) | 0 (0.0%) |
| Mining, Quarrying, & Extraction | 0 (0.0%) | 0 (0.0%) |
| Construction | 0 (0.0%) | 0 (0.0%) |
| Manufacturing | 4 (100.0%) | 0 (0.0%) |
| Wholesale Trade | 0 (0.0%) | 2 (100.0%) |
| Retail Trade | 5 (71.4%) | 2 (28.6%) |
| Transportation & Warehousing | 0 (0.0%) | 0 (0.0%) |
| Utilities | 0 (0.0%) | 0 (0.0%) |
| Information | 0 (0.0%) | 0 (0.0%) |
| Finance & Insurance | 0 (0.0%) | 0 (0.0%) |
| Real Estate, Rental & Leasing | 0 (0.0%) | 0 (0.0%) |
| Professional & Scientific | 0 (0.0%) | 0 (0.0%) |
| Enterprise Management | 0 (0.0%) | 0 (0.0%) |
| Administrative & Support | 0 (0.0%) | 0 (0.0%) |
| Educational Services | 0 (0.0%) | 0 (0.0%) |
| Health Care & Social Assistance | 1 (14.3%) | 6 (85.7%) |
| Arts, Entertainment & Recreation | 0 (0.0%) | 0 (0.0%) |
| Accommodation & Food Services | 0 (0.0%) | 0 (0.0%) |
| Public Administration | 0 (0.0%) | 2 (100.0%) |
| Total | 10 (45.5%) | 12 (54.5%) |
Education in Alice
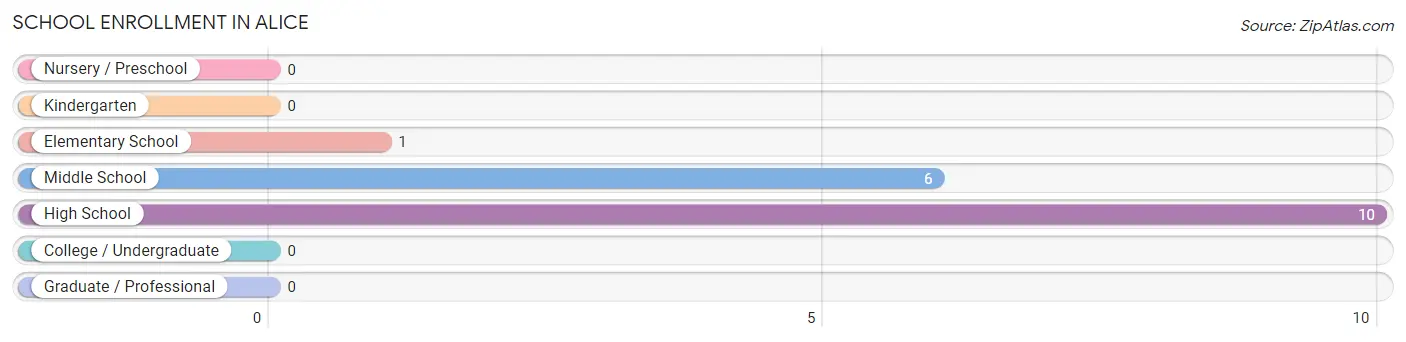
School Enrollment in Alice
The most common levels of schooling among the 17 students in Alice are high school (10 | 58.8%), middle school (6 | 35.3%), and elementary school (1 | 5.9%).
| School Level | # Students | % Students |
| Nursery / Preschool | 0 | 0.0% |
| Kindergarten | 0 | 0.0% |
| Elementary School | 1 | 5.9% |
| Middle School | 6 | 35.3% |
| High School | 10 | 58.8% |
| College / Undergraduate | 0 | 0.0% |
| Graduate / Professional | 0 | 0.0% |
| Total | 17 | 100.0% |
School Enrollment by Age by Funding Source in Alice
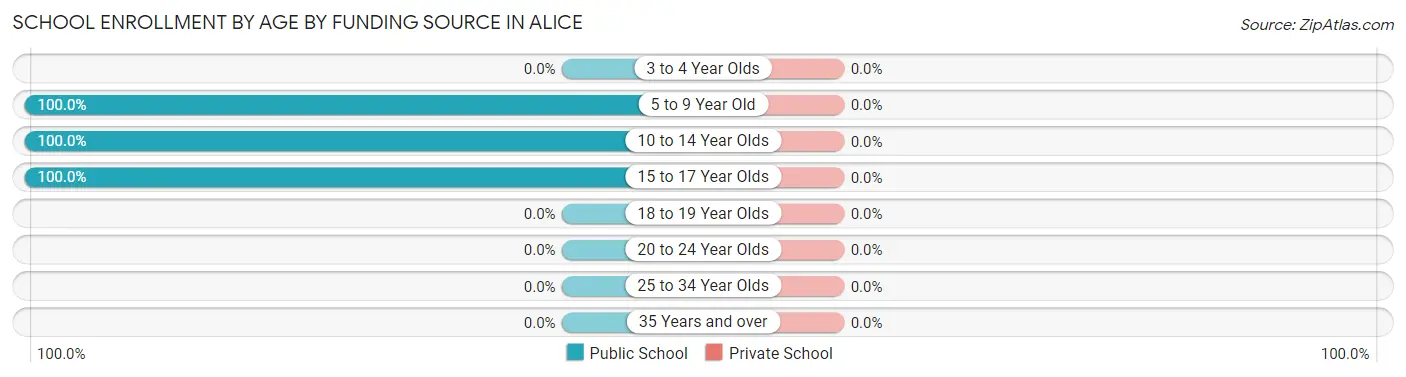
| Age Bracket | Public School | Private School |
| 3 to 4 Year Olds | 0 (0.0%) | 0 (0.0%) |
| 5 to 9 Year Old | 1 (100.0%) | 0 (0.0%) |
| 10 to 14 Year Olds | 11 (100.0%) | 0 (0.0%) |
| 15 to 17 Year Olds | 5 (100.0%) | 0 (0.0%) |
| 18 to 19 Year Olds | 0 (0.0%) | 0 (0.0%) |
| 20 to 24 Year Olds | 0 (0.0%) | 0 (0.0%) |
| 25 to 34 Year Olds | 0 (0.0%) | 0 (0.0%) |
| 35 Years and over | 0 (0.0%) | 0 (0.0%) |
| Total | 17 (100.0%) | 0 (0.0%) |
Educational Attainment by Field of Study in Alice
| Field of Study | # Graduates | % Graduates |
| Computers & Mathematics | 0 | 0.0% |
| Bio, Nature & Agricultural | 0 | 0.0% |
| Physical & Health Sciences | 0 | 0.0% |
| Psychology | 0 | 0.0% |
| Social Sciences | 0 | 0.0% |
| Engineering | 0 | 0.0% |
| Multidisciplinary Studies | 0 | 0.0% |
| Science & Technology | 0 | 0.0% |
| Business | 0 | 0.0% |
| Education | 0 | 0.0% |
| Literature & Languages | 0 | 0.0% |
| Liberal Arts & History | 0 | 0.0% |
| Visual & Performing Arts | 0 | 0.0% |
| Communications | 0 | 0.0% |
| Arts & Humanities | 0 | 0.0% |
| Total | 0 | 0.0% |
Transportation & Commute in Alice
Vehicle Availability by Sex in Alice
The most prevalent vehicle ownership categories in Alice are males with 4 vehicles (8, accounting for 80.0%) and females with 4 vehicles (7, making up 66.7%).
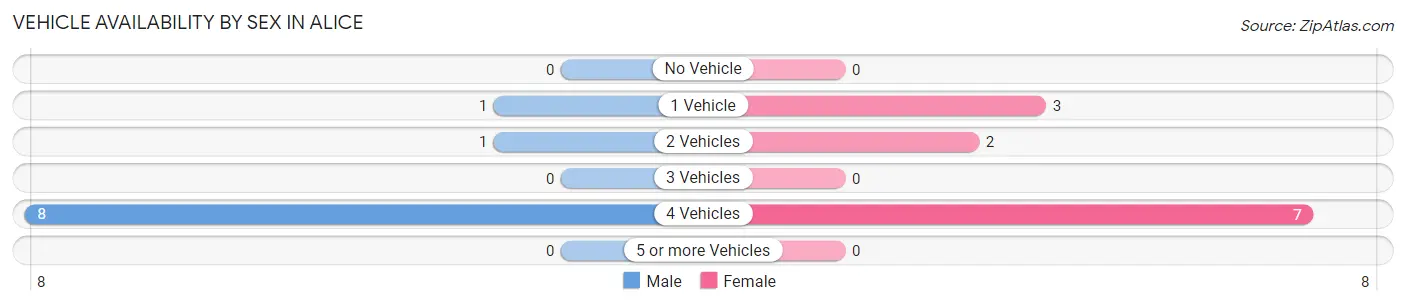
| Vehicles Available | Male | Female |
| No Vehicle | 0 (0.0%) | 0 (0.0%) |
| 1 Vehicle | 1 (10.0%) | 3 (25.0%) |
| 2 Vehicles | 1 (10.0%) | 2 (16.7%) |
| 3 Vehicles | 0 (0.0%) | 0 (0.0%) |
| 4 Vehicles | 8 (80.0%) | 7 (58.3%) |
| 5 or more Vehicles | 0 (0.0%) | 0 (0.0%) |
| Total | 10 (100.0%) | 12 (100.0%) |
Commute Time in Alice
The most frequently occuring commute durations in Alice are 15 to 19 minutes (10 commuters, 45.5%), 20 to 24 minutes (4 commuters, 18.2%), and 25 to 29 minutes (2 commuters, 9.1%).
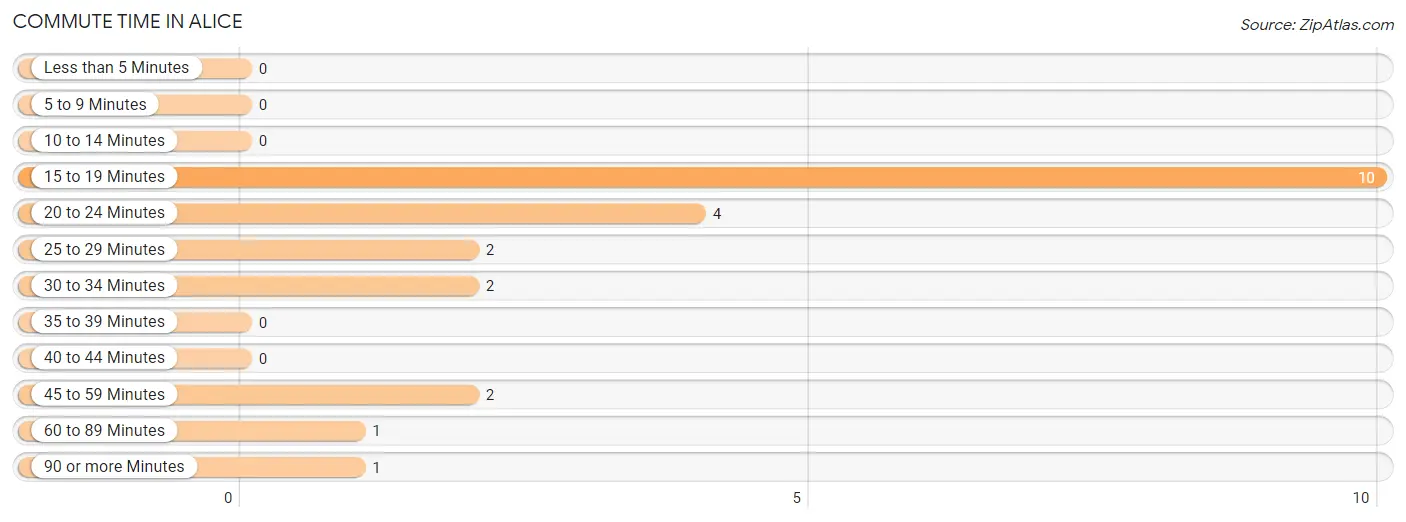
| Commute Time | # Commuters | % Commuters |
| Less than 5 Minutes | 0 | 0.0% |
| 5 to 9 Minutes | 0 | 0.0% |
| 10 to 14 Minutes | 0 | 0.0% |
| 15 to 19 Minutes | 10 | 45.5% |
| 20 to 24 Minutes | 4 | 18.2% |
| 25 to 29 Minutes | 2 | 9.1% |
| 30 to 34 Minutes | 2 | 9.1% |
| 35 to 39 Minutes | 0 | 0.0% |
| 40 to 44 Minutes | 0 | 0.0% |
| 45 to 59 Minutes | 2 | 9.1% |
| 60 to 89 Minutes | 1 | 4.5% |
| 90 or more Minutes | 1 | 4.5% |
Commute Time by Sex in Alice
The most common commute times in Alice are 15 to 19 minutes (5 commuters, 50.0%) for males and 15 to 19 minutes (5 commuters, 41.7%) for females.
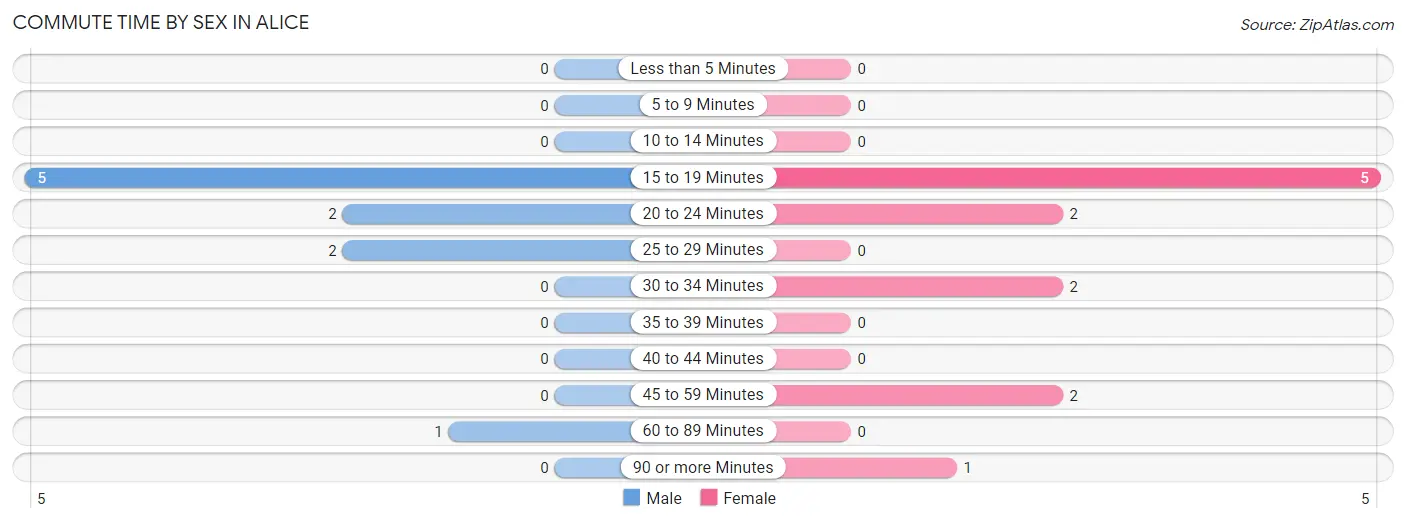
| Commute Time | Male | Female |
| Less than 5 Minutes | 0 (0.0%) | 0 (0.0%) |
| 5 to 9 Minutes | 0 (0.0%) | 0 (0.0%) |
| 10 to 14 Minutes | 0 (0.0%) | 0 (0.0%) |
| 15 to 19 Minutes | 5 (50.0%) | 5 (41.7%) |
| 20 to 24 Minutes | 2 (20.0%) | 2 (16.7%) |
| 25 to 29 Minutes | 2 (20.0%) | 0 (0.0%) |
| 30 to 34 Minutes | 0 (0.0%) | 2 (16.7%) |
| 35 to 39 Minutes | 0 (0.0%) | 0 (0.0%) |
| 40 to 44 Minutes | 0 (0.0%) | 0 (0.0%) |
| 45 to 59 Minutes | 0 (0.0%) | 2 (16.7%) |
| 60 to 89 Minutes | 1 (10.0%) | 0 (0.0%) |
| 90 or more Minutes | 0 (0.0%) | 1 (8.3%) |
Time of Departure to Work by Sex in Alice
The most frequent times of departure to work in Alice are 6:30 AM to 6:59 AM (6, 60.0%) for males and 7:30 AM to 7:59 AM (5, 41.7%) for females.
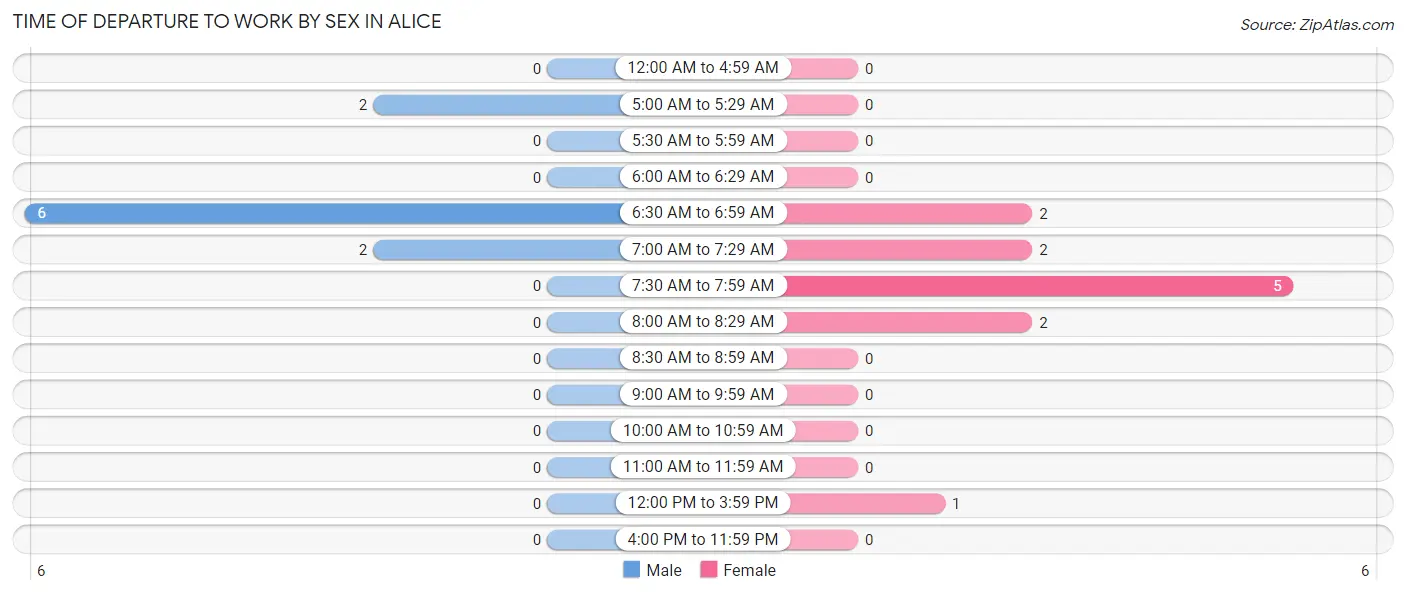
| Time of Departure | Male | Female |
| 12:00 AM to 4:59 AM | 0 (0.0%) | 0 (0.0%) |
| 5:00 AM to 5:29 AM | 2 (20.0%) | 0 (0.0%) |
| 5:30 AM to 5:59 AM | 0 (0.0%) | 0 (0.0%) |
| 6:00 AM to 6:29 AM | 0 (0.0%) | 0 (0.0%) |
| 6:30 AM to 6:59 AM | 6 (60.0%) | 2 (16.7%) |
| 7:00 AM to 7:29 AM | 2 (20.0%) | 2 (16.7%) |
| 7:30 AM to 7:59 AM | 0 (0.0%) | 5 (41.7%) |
| 8:00 AM to 8:29 AM | 0 (0.0%) | 2 (16.7%) |
| 8:30 AM to 8:59 AM | 0 (0.0%) | 0 (0.0%) |
| 9:00 AM to 9:59 AM | 0 (0.0%) | 0 (0.0%) |
| 10:00 AM to 10:59 AM | 0 (0.0%) | 0 (0.0%) |
| 11:00 AM to 11:59 AM | 0 (0.0%) | 0 (0.0%) |
| 12:00 PM to 3:59 PM | 0 (0.0%) | 1 (8.3%) |
| 4:00 PM to 11:59 PM | 0 (0.0%) | 0 (0.0%) |
| Total | 10 (100.0%) | 12 (100.0%) |
Housing Occupancy in Alice
Occupancy by Ownership in Alice
Of the total 16 dwellings in Alice, owner-occupied units account for 16 (100.0%), while renter-occupied units make up 0 (0.0%).
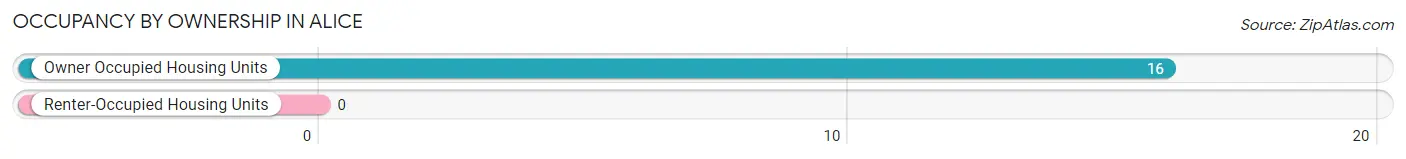
| Occupancy | # Housing Units | % Housing Units |
| Owner Occupied Housing Units | 16 | 100.0% |
| Renter-Occupied Housing Units | 0 | 0.0% |
| Total Occupied Housing Units | 16 | 100.0% |
Occupancy by Household Size in Alice
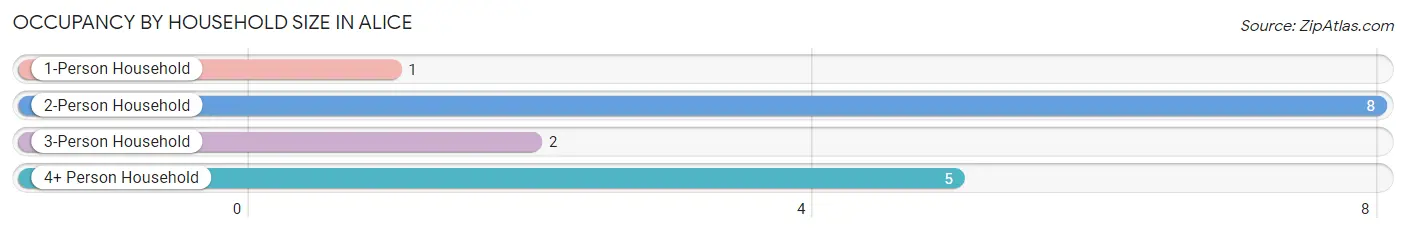
| Household Size | # Housing Units | % Housing Units |
| 1-Person Household | 1 | 6.2% |
| 2-Person Household | 8 | 50.0% |
| 3-Person Household | 2 | 12.5% |
| 4+ Person Household | 5 | 31.2% |
| Total Housing Units | 16 | 100.0% |
Occupancy by Ownership by Household Size in Alice
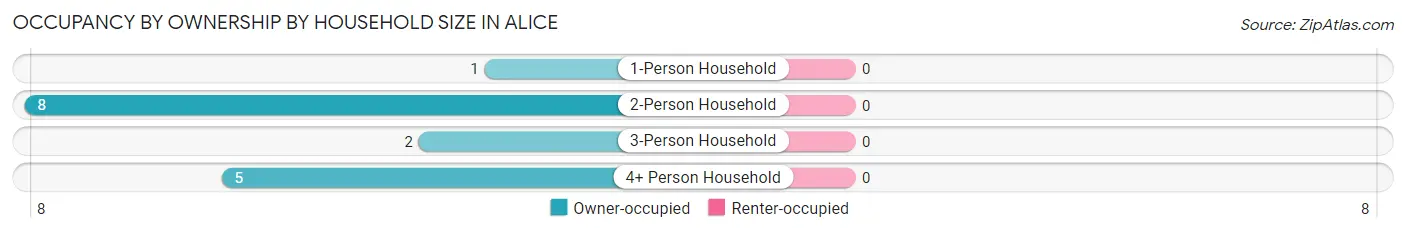
| Household Size | Owner-occupied | Renter-occupied |
| 1-Person Household | 1 (100.0%) | 0 (0.0%) |
| 2-Person Household | 8 (100.0%) | 0 (0.0%) |
| 3-Person Household | 2 (100.0%) | 0 (0.0%) |
| 4+ Person Household | 5 (100.0%) | 0 (0.0%) |
| Total Housing Units | 16 (100.0%) | 0 (0.0%) |
Occupancy by Educational Attainment in Alice
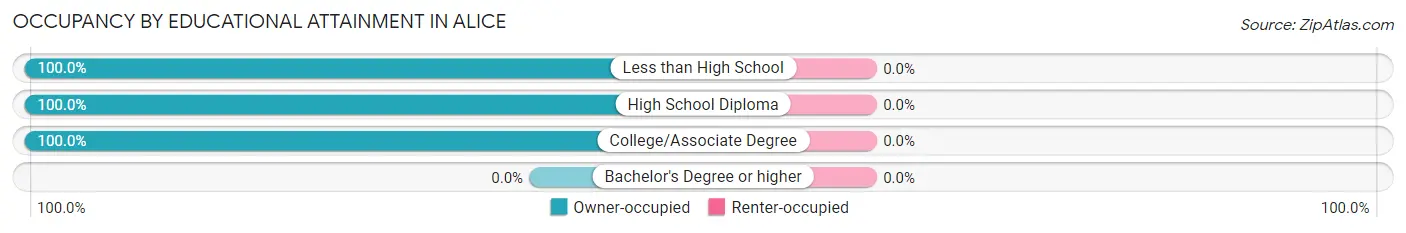
| Household Size | Owner-occupied | Renter-occupied |
| Less than High School | 1 (100.0%) | 0 (0.0%) |
| High School Diploma | 11 (100.0%) | 0 (0.0%) |
| College/Associate Degree | 4 (100.0%) | 0 (0.0%) |
| Bachelor's Degree or higher | 0 (0.0%) | 0 (0.0%) |
Occupancy by Age of Householder in Alice
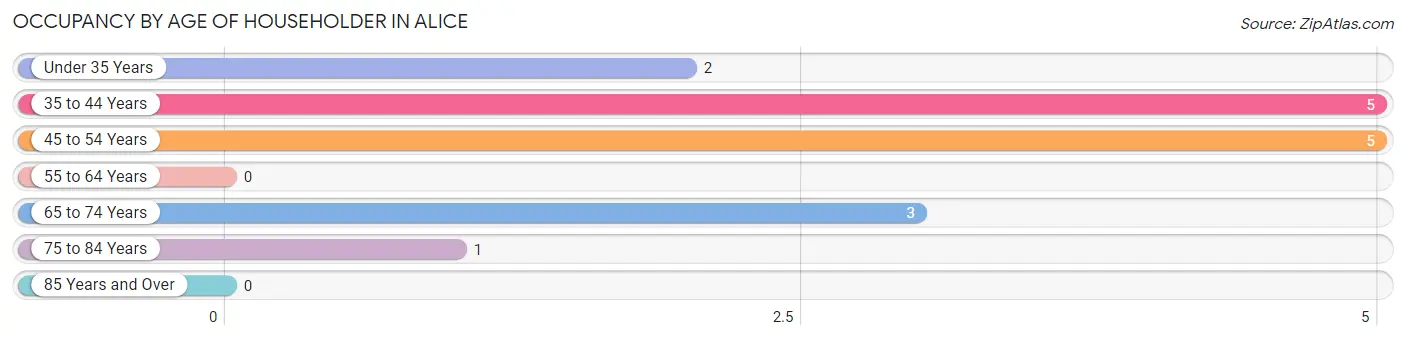
| Age Bracket | # Households | % Households |
| Under 35 Years | 2 | 12.5% |
| 35 to 44 Years | 5 | 31.2% |
| 45 to 54 Years | 5 | 31.2% |
| 55 to 64 Years | 0 | 0.0% |
| 65 to 74 Years | 3 | 18.8% |
| 75 to 84 Years | 1 | 6.2% |
| 85 Years and Over | 0 | 0.0% |
| Total | 16 | 100.0% |
Housing Finances in Alice
Median Income by Occupancy in Alice
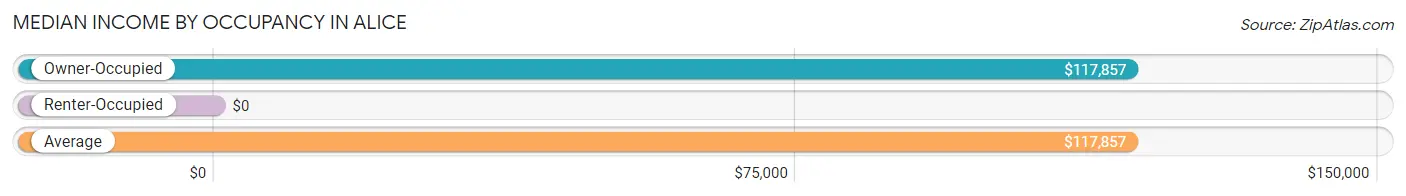
| Occupancy Type | # Households | Median Income |
| Owner-Occupied | 16 (100.0%) | $117,857 |
| Renter-Occupied | 0 (0.0%) | $0 |
| Average | 16 (100.0%) | $117,857 |
Occupancy by Householder Income Bracket in Alice
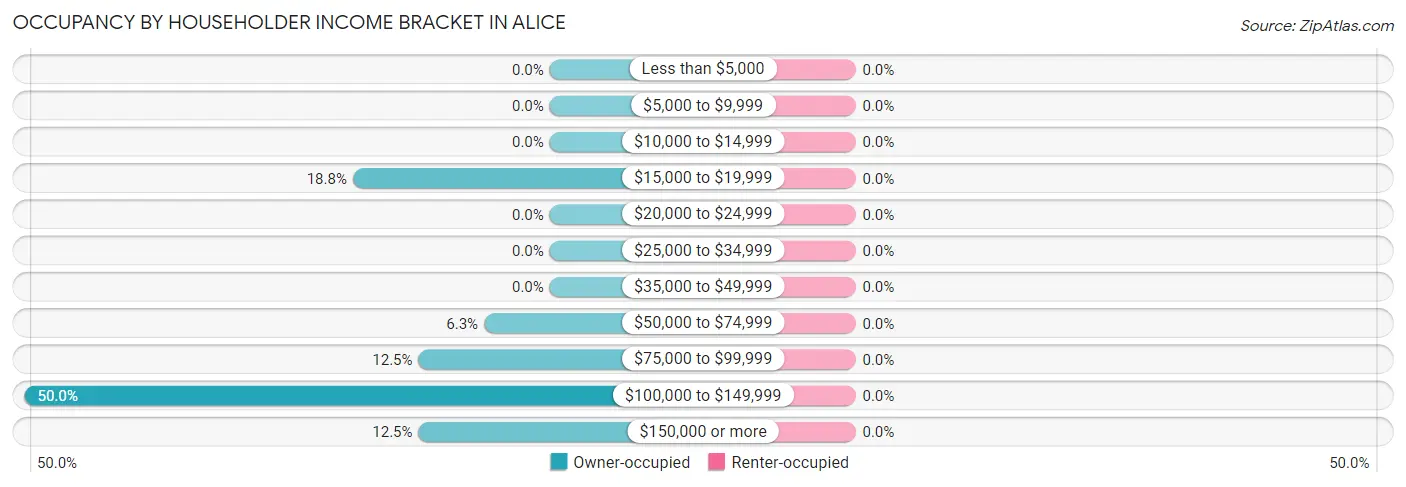
| Income Bracket | Owner-occupied | Renter-occupied |
| Less than $5,000 | 0 (0.0%) | 0 (0.0%) |
| $5,000 to $9,999 | 0 (0.0%) | 0 (0.0%) |
| $10,000 to $14,999 | 0 (0.0%) | 0 (0.0%) |
| $15,000 to $19,999 | 3 (18.8%) | 0 (0.0%) |
| $20,000 to $24,999 | 0 (0.0%) | 0 (0.0%) |
| $25,000 to $34,999 | 0 (0.0%) | 0 (0.0%) |
| $35,000 to $49,999 | 0 (0.0%) | 0 (0.0%) |
| $50,000 to $74,999 | 1 (6.2%) | 0 (0.0%) |
| $75,000 to $99,999 | 2 (12.5%) | 0 (0.0%) |
| $100,000 to $149,999 | 8 (50.0%) | 0 (0.0%) |
| $150,000 or more | 2 (12.5%) | 0 (0.0%) |
| Total | 16 (100.0%) | 0 (0.0%) |
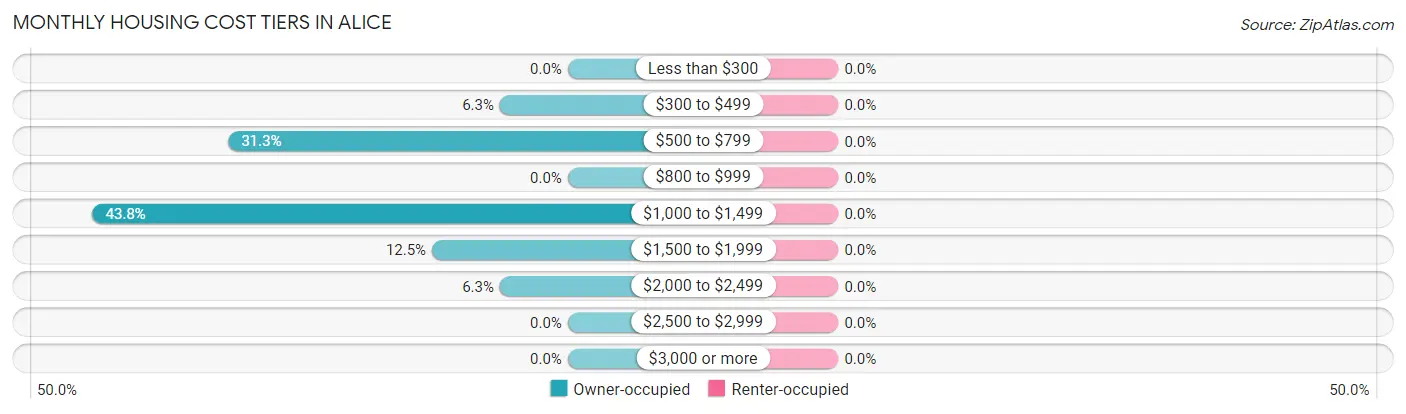
Monthly Housing Cost Tiers in Alice
| Monthly Cost | Owner-occupied | Renter-occupied |
| Less than $300 | 0 (0.0%) | 0 (0.0%) |
| $300 to $499 | 1 (6.2%) | 0 (0.0%) |
| $500 to $799 | 5 (31.2%) | 0 (0.0%) |
| $800 to $999 | 0 (0.0%) | 0 (0.0%) |
| $1,000 to $1,499 | 7 (43.8%) | 0 (0.0%) |
| $1,500 to $1,999 | 2 (12.5%) | 0 (0.0%) |
| $2,000 to $2,499 | 1 (6.2%) | 0 (0.0%) |
| $2,500 to $2,999 | 0 (0.0%) | 0 (0.0%) |
| $3,000 or more | 0 (0.0%) | 0 (0.0%) |
| Total | 16 (100.0%) | 0 (0.0%) |
Physical Housing Characteristics in Alice
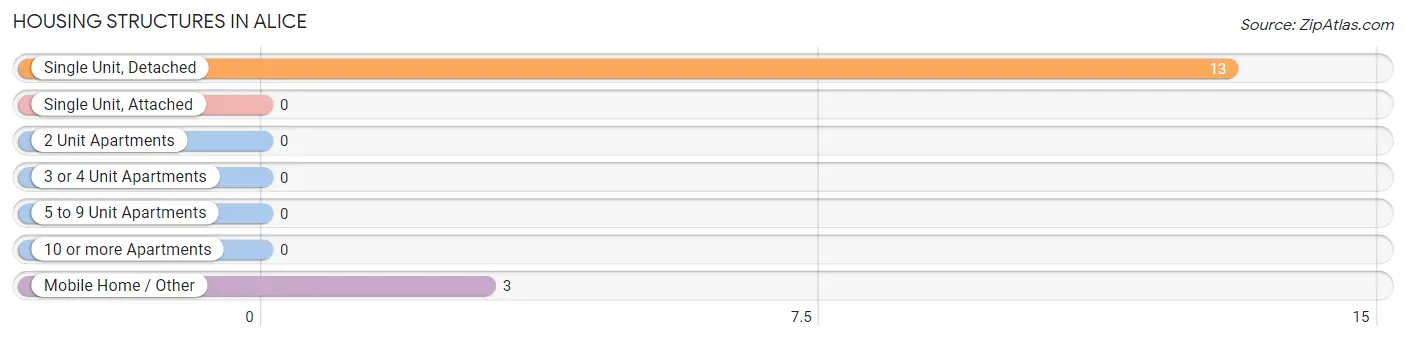
Housing Structures in Alice
| Structure Type | # Housing Units | % Housing Units |
| Single Unit, Detached | 13 | 81.2% |
| Single Unit, Attached | 0 | 0.0% |
| 2 Unit Apartments | 0 | 0.0% |
| 3 or 4 Unit Apartments | 0 | 0.0% |
| 5 to 9 Unit Apartments | 0 | 0.0% |
| 10 or more Apartments | 0 | 0.0% |
| Mobile Home / Other | 3 | 18.8% |
| Total | 16 | 100.0% |
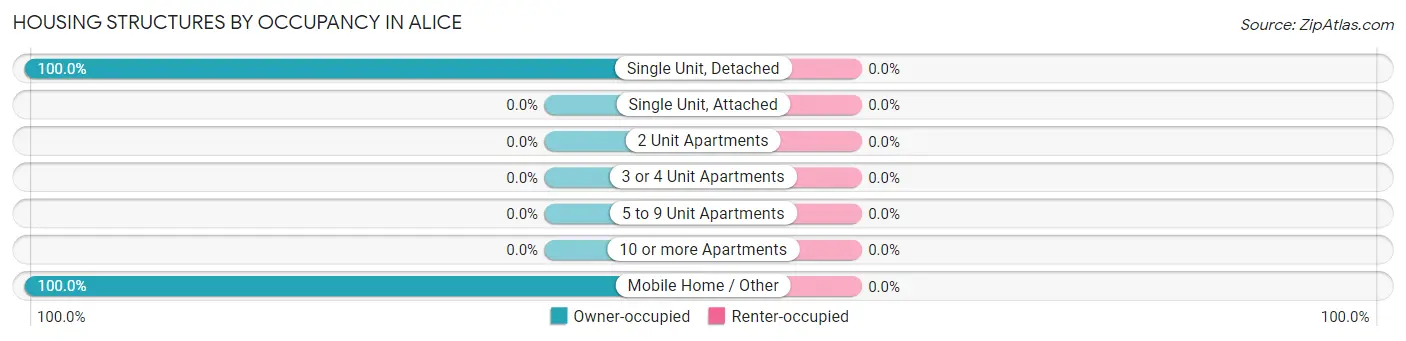
Housing Structures by Occupancy in Alice
| Structure Type | Owner-occupied | Renter-occupied |
| Single Unit, Detached | 13 (100.0%) | 0 (0.0%) |
| Single Unit, Attached | 0 (0.0%) | 0 (0.0%) |
| 2 Unit Apartments | 0 (0.0%) | 0 (0.0%) |
| 3 or 4 Unit Apartments | 0 (0.0%) | 0 (0.0%) |
| 5 to 9 Unit Apartments | 0 (0.0%) | 0 (0.0%) |
| 10 or more Apartments | 0 (0.0%) | 0 (0.0%) |
| Mobile Home / Other | 3 (100.0%) | 0 (0.0%) |
| Total | 16 (100.0%) | 0 (0.0%) |
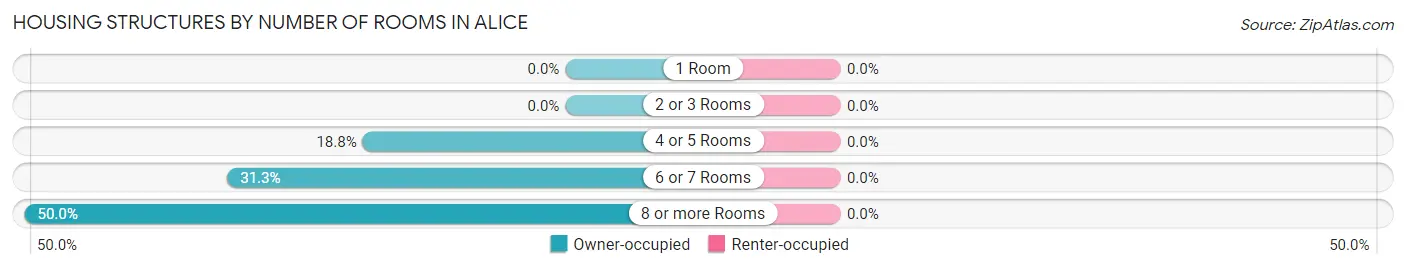
Housing Structures by Number of Rooms in Alice
| Number of Rooms | Owner-occupied | Renter-occupied |
| 1 Room | 0 (0.0%) | 0 (0.0%) |
| 2 or 3 Rooms | 0 (0.0%) | 0 (0.0%) |
| 4 or 5 Rooms | 3 (18.8%) | 0 (0.0%) |
| 6 or 7 Rooms | 5 (31.2%) | 0 (0.0%) |
| 8 or more Rooms | 8 (50.0%) | 0 (0.0%) |
| Total | 16 (100.0%) | 0 (0.0%) |
Housing Structure by Heating Type in Alice
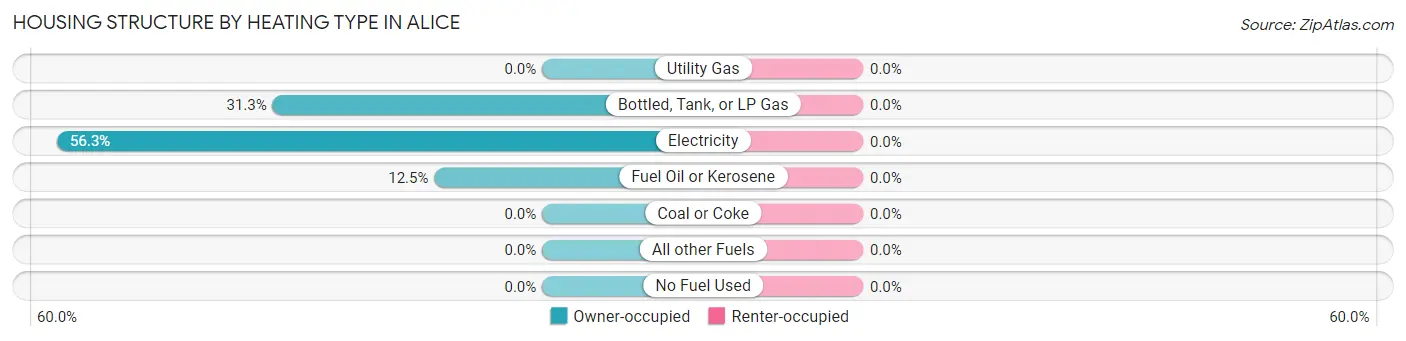
| Heating Type | Owner-occupied | Renter-occupied |
| Utility Gas | 0 (0.0%) | 0 (0.0%) |
| Bottled, Tank, or LP Gas | 5 (31.2%) | 0 (0.0%) |
| Electricity | 9 (56.2%) | 0 (0.0%) |
| Fuel Oil or Kerosene | 2 (12.5%) | 0 (0.0%) |
| Coal or Coke | 0 (0.0%) | 0 (0.0%) |
| All other Fuels | 0 (0.0%) | 0 (0.0%) |
| No Fuel Used | 0 (0.0%) | 0 (0.0%) |
| Total | 16 (100.0%) | 0 (0.0%) |
Household Vehicle Usage in Alice
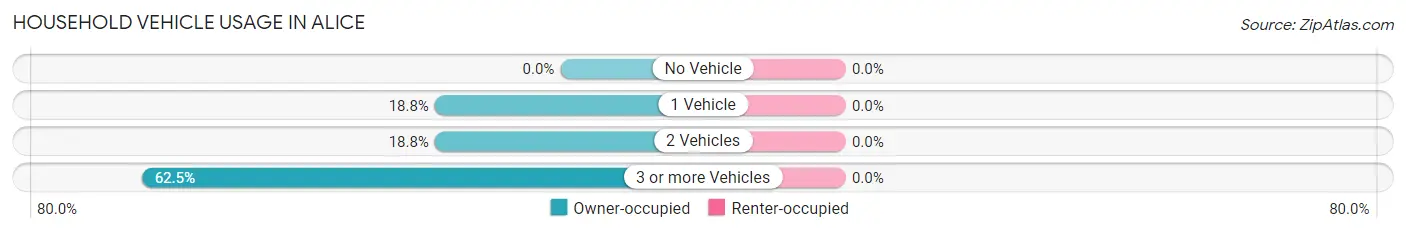
| Vehicles per Household | Owner-occupied | Renter-occupied |
| No Vehicle | 0 (0.0%) | 0 (0.0%) |
| 1 Vehicle | 3 (18.8%) | 0 (0.0%) |
| 2 Vehicles | 3 (18.8%) | 0 (0.0%) |
| 3 or more Vehicles | 10 (62.5%) | 0 (0.0%) |
| Total | 16 (100.0%) | 0 (0.0%) |
Real Estate & Mortgages in Alice
Real Estate and Mortgage Overview in Alice
| Characteristic | Without Mortgage | With Mortgage |
| Housing Units | 3 | 13 |
| Median Property Value | - | - |
| Median Household Income | - | - |
| Monthly Housing Costs | - | - |
| Real Estate Taxes | - | - |
Property Value by Mortgage Status in Alice
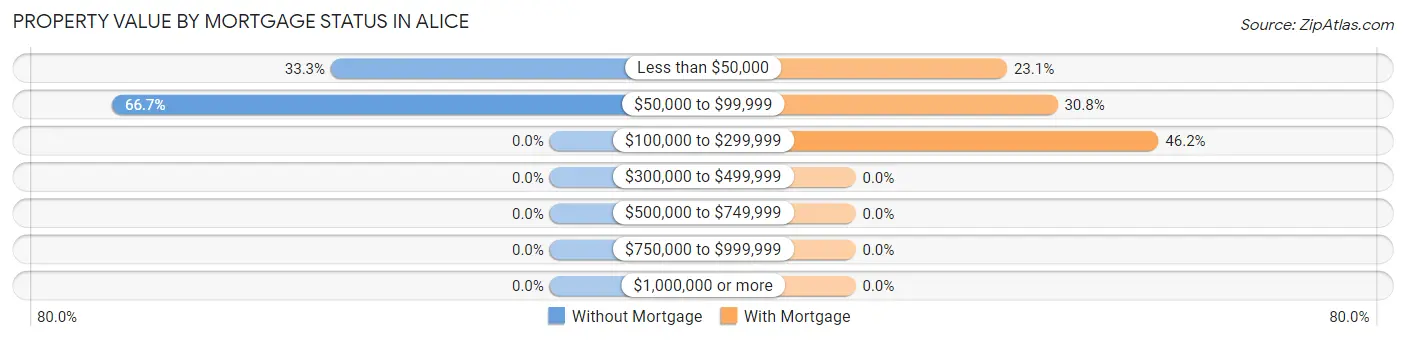
| Property Value | Without Mortgage | With Mortgage |
| Less than $50,000 | 1 (33.3%) | 3 (23.1%) |
| $50,000 to $99,999 | 2 (66.7%) | 4 (30.8%) |
| $100,000 to $299,999 | 0 (0.0%) | 6 (46.2%) |
| $300,000 to $499,999 | 0 (0.0%) | 0 (0.0%) |
| $500,000 to $749,999 | 0 (0.0%) | 0 (0.0%) |
| $750,000 to $999,999 | 0 (0.0%) | 0 (0.0%) |
| $1,000,000 or more | 0 (0.0%) | 0 (0.0%) |
| Total | 3 (100.0%) | 13 (100.0%) |
Household Income by Mortgage Status in Alice
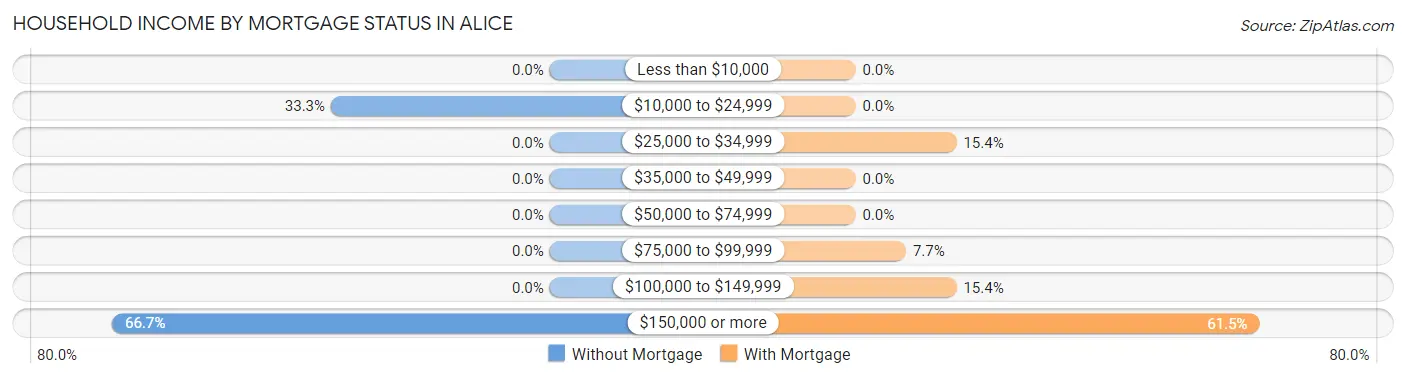
| Household Income | Without Mortgage | With Mortgage |
| Less than $10,000 | 0 (0.0%) | 0 (0.0%) |
| $10,000 to $24,999 | 1 (33.3%) | 0 (0.0%) |
| $25,000 to $34,999 | 0 (0.0%) | 2 (15.4%) |
| $35,000 to $49,999 | 0 (0.0%) | 0 (0.0%) |
| $50,000 to $74,999 | 0 (0.0%) | 0 (0.0%) |
| $75,000 to $99,999 | 0 (0.0%) | 1 (7.7%) |
| $100,000 to $149,999 | 0 (0.0%) | 2 (15.4%) |
| $150,000 or more | 2 (66.7%) | 8 (61.5%) |
| Total | 3 (100.0%) | 13 (100.0%) |
Property Value to Household Income Ratio in Alice
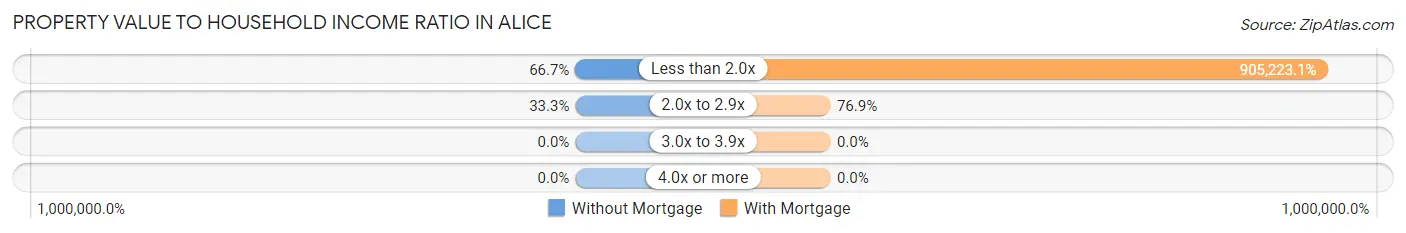
| Value-to-Income Ratio | Without Mortgage | With Mortgage |
| Less than 2.0x | 2 (66.7%) | 117,679 (905,223.1%) |
| 2.0x to 2.9x | 1 (33.3%) | 10 (76.9%) |
| 3.0x to 3.9x | 0 (0.0%) | 0 (0.0%) |
| 4.0x or more | 0 (0.0%) | 0 (0.0%) |
| Total | 3 (100.0%) | 13 (100.0%) |
Real Estate Taxes by Mortgage Status in Alice
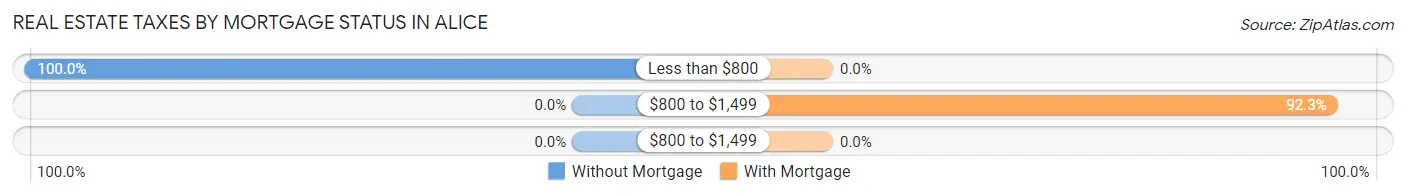
| Property Taxes | Without Mortgage | With Mortgage |
| Less than $800 | 3 (100.0%) | 0 (0.0%) |
| $800 to $1,499 | 0 (0.0%) | 12 (92.3%) |
| $800 to $1,499 | 0 (0.0%) | 0 (0.0%) |
| Total | 3 (100.0%) | 13 (100.0%) |
Health & Disability in Alice
Health Insurance Coverage by Age in Alice
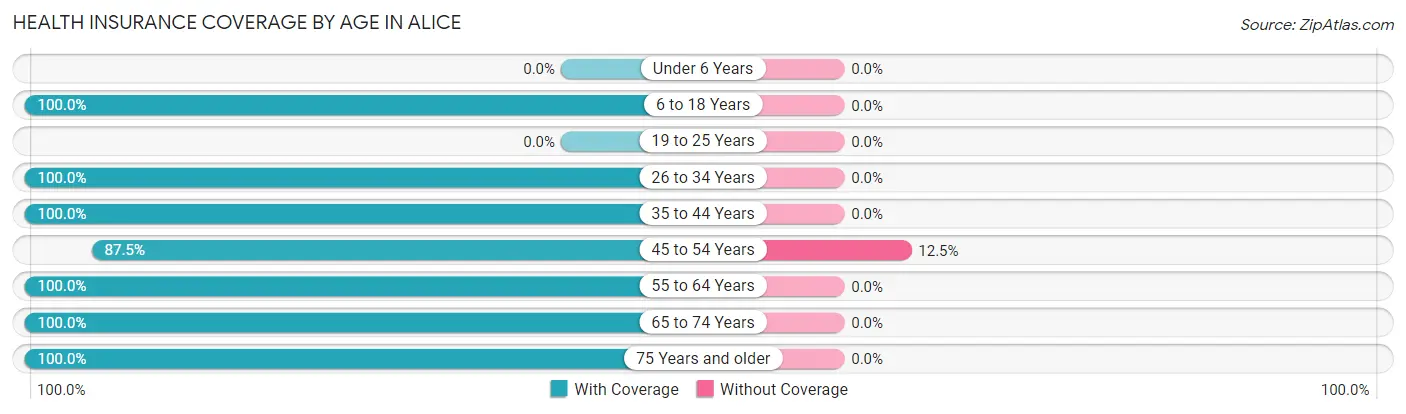
| Age Bracket | With Coverage | Without Coverage |
| Under 6 Years | 0 (0.0%) | 0 (0.0%) |
| 6 to 18 Years | 17 (100.0%) | 0 (0.0%) |
| 19 to 25 Years | 0 (0.0%) | 0 (0.0%) |
| 26 to 34 Years | 2 (100.0%) | 0 (0.0%) |
| 35 to 44 Years | 11 (100.0%) | 0 (0.0%) |
| 45 to 54 Years | 7 (87.5%) | 1 (12.5%) |
| 55 to 64 Years | 1 (100.0%) | 0 (0.0%) |
| 65 to 74 Years | 4 (100.0%) | 0 (0.0%) |
| 75 Years and older | 1 (100.0%) | 0 (0.0%) |
| Total | 43 (97.7%) | 1 (2.3%) |
Health Insurance Coverage by Citizenship Status in Alice
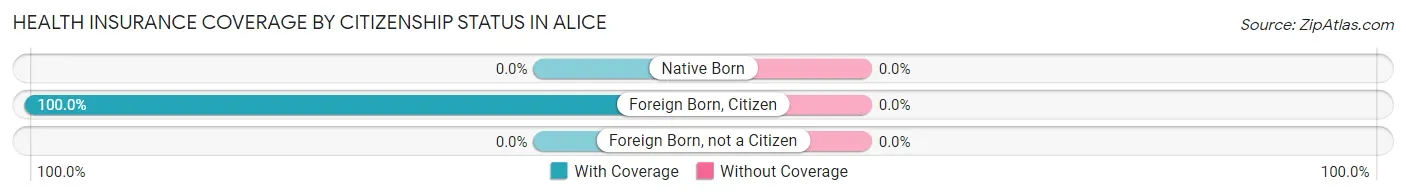
| Citizenship Status | With Coverage | Without Coverage |
| Native Born | 0 (0.0%) | 0 (0.0%) |
| Foreign Born, Citizen | 17 (100.0%) | 0 (0.0%) |
| Foreign Born, not a Citizen | 0 (0.0%) | 0 (0.0%) |
Health Insurance Coverage by Household Income in Alice
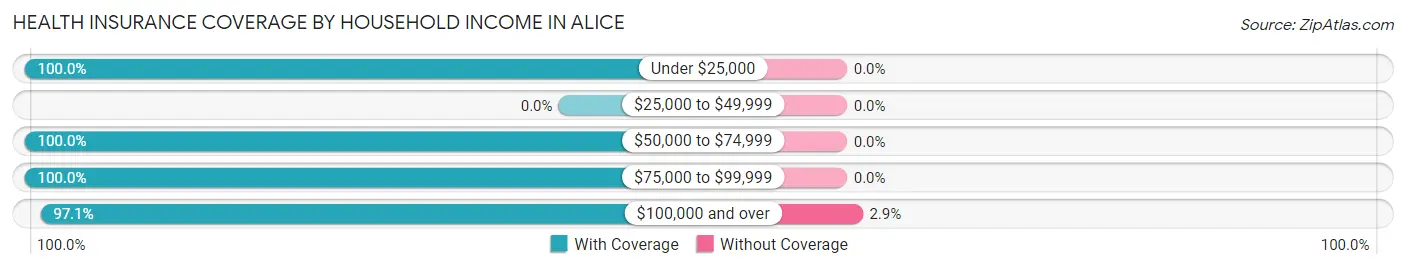
| Household Income | With Coverage | Without Coverage |
| Under $25,000 | 5 (100.0%) | 0 (0.0%) |
| $25,000 to $49,999 | 0 (0.0%) | 0 (0.0%) |
| $50,000 to $74,999 | 2 (100.0%) | 0 (0.0%) |
| $75,000 to $99,999 | 3 (100.0%) | 0 (0.0%) |
| $100,000 and over | 33 (97.1%) | 1 (2.9%) |
Public vs Private Health Insurance Coverage by Age in Alice
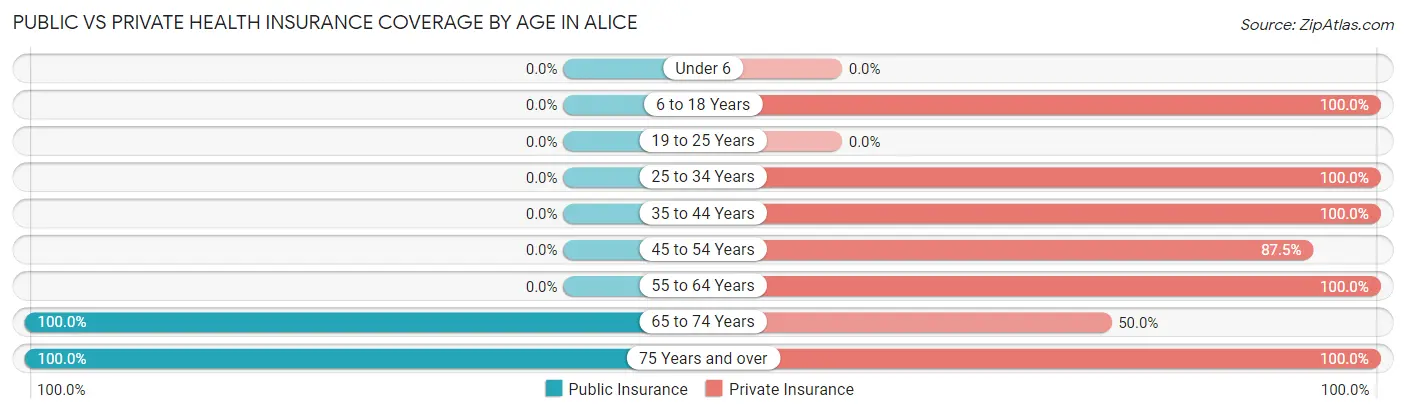
| Age Bracket | Public Insurance | Private Insurance |
| Under 6 | 0 (0.0%) | 0 (0.0%) |
| 6 to 18 Years | 0 (0.0%) | 17 (100.0%) |
| 19 to 25 Years | 0 (0.0%) | 0 (0.0%) |
| 25 to 34 Years | 0 (0.0%) | 2 (100.0%) |
| 35 to 44 Years | 0 (0.0%) | 11 (100.0%) |
| 45 to 54 Years | 0 (0.0%) | 7 (87.5%) |
| 55 to 64 Years | 0 (0.0%) | 1 (100.0%) |
| 65 to 74 Years | 4 (100.0%) | 2 (50.0%) |
| 75 Years and over | 1 (100.0%) | 1 (100.0%) |
| Total | 5 (11.4%) | 41 (93.2%) |
Disability Status by Sex by Age in Alice
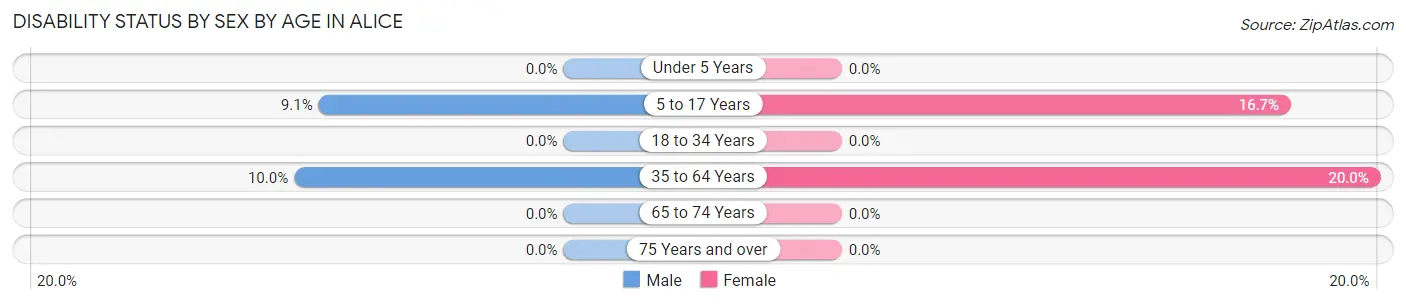
| Age Bracket | Male | Female |
| Under 5 Years | 0 (0.0%) | 0 (0.0%) |
| 5 to 17 Years | 1 (9.1%) | 1 (16.7%) |
| 18 to 34 Years | 0 (0.0%) | 0 (0.0%) |
| 35 to 64 Years | 1 (10.0%) | 2 (20.0%) |
| 65 to 74 Years | 0 (0.0%) | 0 (0.0%) |
| 75 Years and over | 0 (0.0%) | 0 (0.0%) |
Disability Class by Sex by Age in Alice
Disability Class: Hearing Difficulty
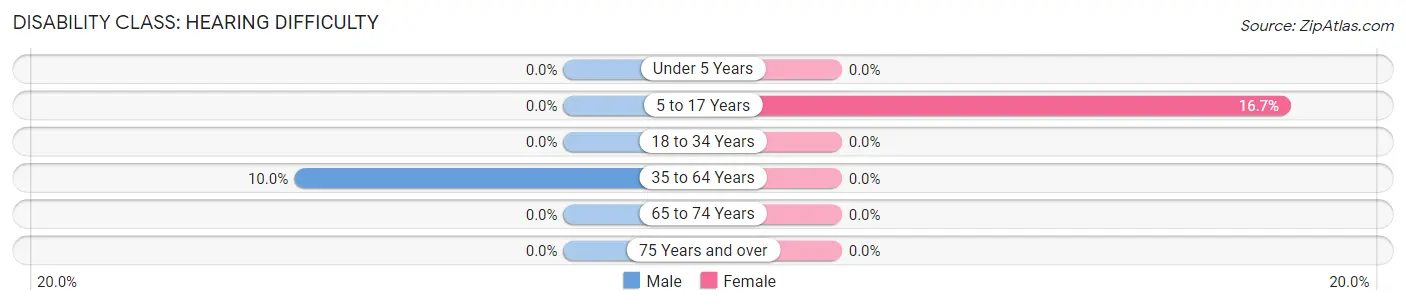
| Age Bracket | Male | Female |
| Under 5 Years | 0 (0.0%) | 0 (0.0%) |
| 5 to 17 Years | 0 (0.0%) | 1 (16.7%) |
| 18 to 34 Years | 0 (0.0%) | 0 (0.0%) |
| 35 to 64 Years | 1 (10.0%) | 0 (0.0%) |
| 65 to 74 Years | 0 (0.0%) | 0 (0.0%) |
| 75 Years and over | 0 (0.0%) | 0 (0.0%) |
Disability Class: Vision Difficulty
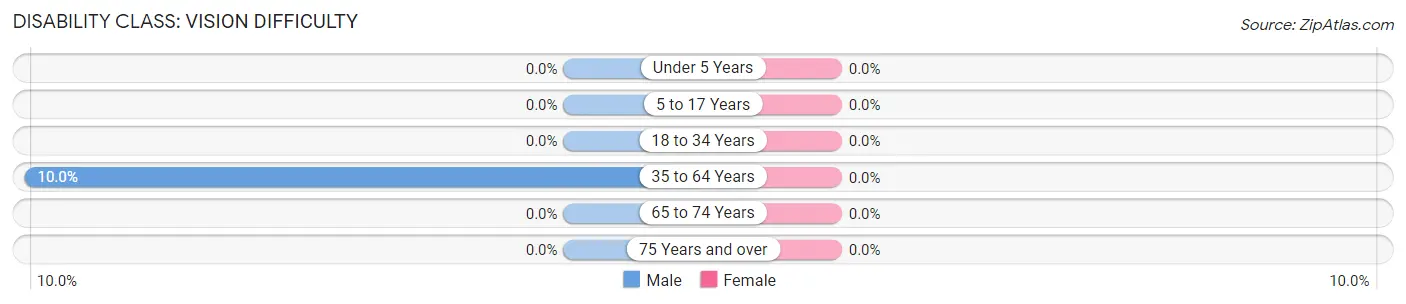
| Age Bracket | Male | Female |
| Under 5 Years | 0 (0.0%) | 0 (0.0%) |
| 5 to 17 Years | 0 (0.0%) | 0 (0.0%) |
| 18 to 34 Years | 0 (0.0%) | 0 (0.0%) |
| 35 to 64 Years | 1 (10.0%) | 0 (0.0%) |
| 65 to 74 Years | 0 (0.0%) | 0 (0.0%) |
| 75 Years and over | 0 (0.0%) | 0 (0.0%) |
Disability Class: Cognitive Difficulty
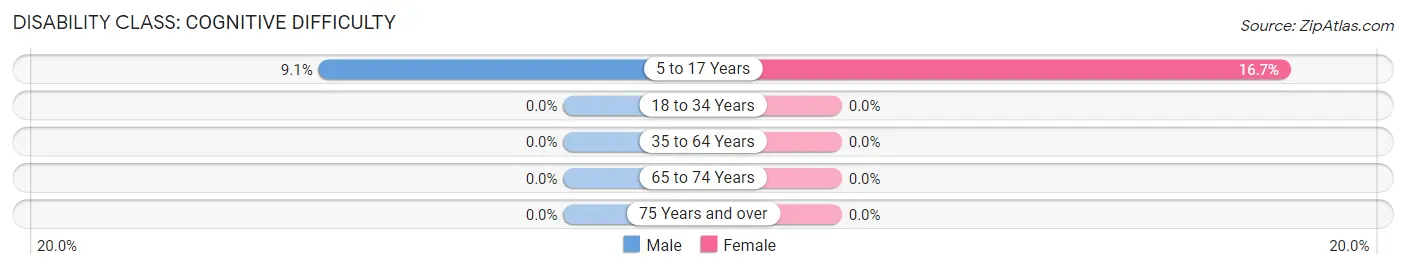
| Age Bracket | Male | Female |
| 5 to 17 Years | 1 (9.1%) | 1 (16.7%) |
| 18 to 34 Years | 0 (0.0%) | 0 (0.0%) |
| 35 to 64 Years | 0 (0.0%) | 0 (0.0%) |
| 65 to 74 Years | 0 (0.0%) | 0 (0.0%) |
| 75 Years and over | 0 (0.0%) | 0 (0.0%) |
Disability Class: Ambulatory Difficulty
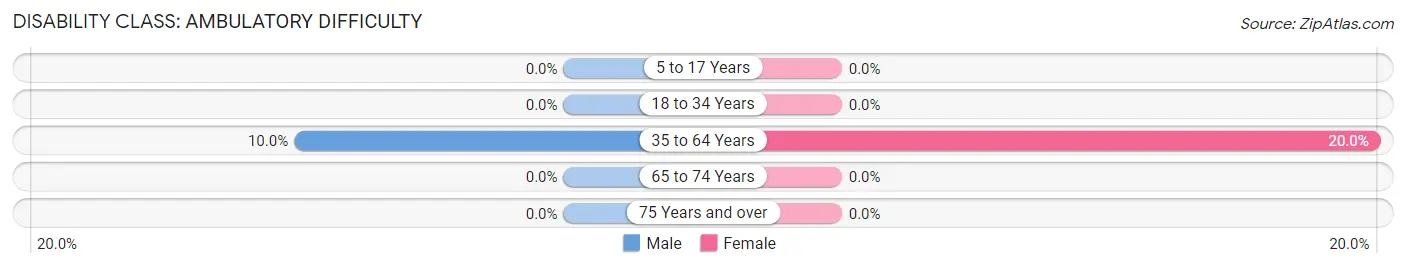
| Age Bracket | Male | Female |
| 5 to 17 Years | 0 (0.0%) | 0 (0.0%) |
| 18 to 34 Years | 0 (0.0%) | 0 (0.0%) |
| 35 to 64 Years | 1 (10.0%) | 2 (20.0%) |
| 65 to 74 Years | 0 (0.0%) | 0 (0.0%) |
| 75 Years and over | 0 (0.0%) | 0 (0.0%) |
Disability Class: Self-Care Difficulty
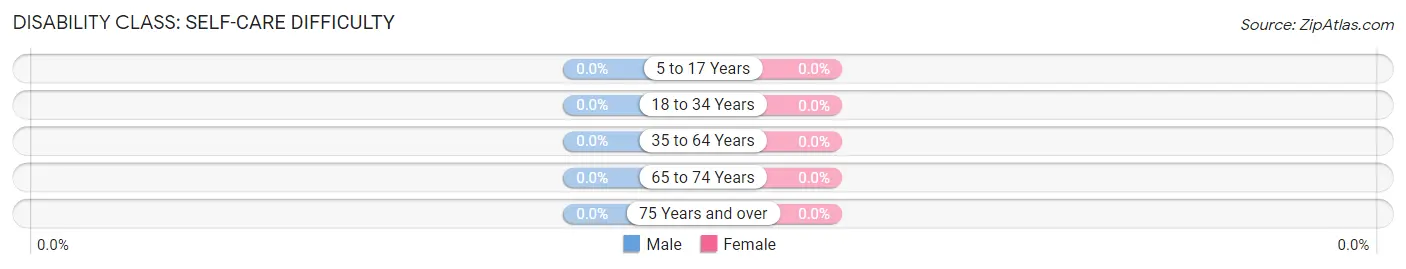
| Age Bracket | Male | Female |
| 5 to 17 Years | 0 (0.0%) | 0 (0.0%) |
| 18 to 34 Years | 0 (0.0%) | 0 (0.0%) |
| 35 to 64 Years | 0 (0.0%) | 0 (0.0%) |
| 65 to 74 Years | 0 (0.0%) | 0 (0.0%) |
| 75 Years and over | 0 (0.0%) | 0 (0.0%) |
Technology Access in Alice
Computing Device Access in Alice
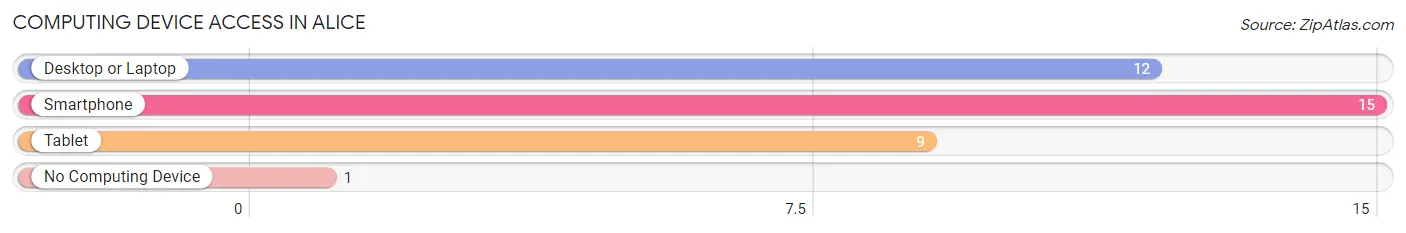
| Device Type | # Households | % Households |
| Desktop or Laptop | 12 | 75.0% |
| Smartphone | 15 | 93.8% |
| Tablet | 9 | 56.2% |
| No Computing Device | 1 | 6.2% |
| Total | 16 | 100.0% |
Internet Access in Alice
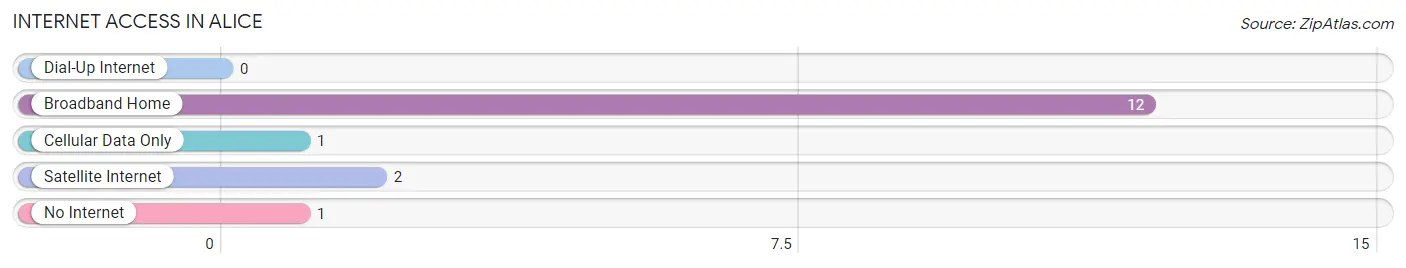
| Internet Type | # Households | % Households |
| Dial-Up Internet | 0 | 0.0% |
| Broadband Home | 12 | 75.0% |
| Cellular Data Only | 1 | 6.2% |
| Satellite Internet | 2 | 12.5% |
| No Internet | 1 | 6.2% |
| Total | 16 | 100.0% |
Alice Summary
Alice is a small city located in the state of North Dakota. It is located in the southwestern part of the state, about 25 miles from the South Dakota border. The city has a population of approximately 1,500 people, and is the county seat of Hettinger County.
History
Alice was founded in 1883, when the Northern Pacific Railroad was built through the area. The town was named after Alice Hettinger, the daughter of the county’s first settler. The town quickly grew, and by the early 1900s, it had become a bustling center of commerce and industry.
Alice was the site of a major battle during the Sioux Uprising of 1890. The battle, which was fought between the U.S. Army and the Sioux, resulted in the death of several soldiers and civilians. The battle was a major event in the history of the town, and is commemorated by a monument located in the city’s center.
Geography
Alice is located in the southwestern part of North Dakota, about 25 miles from the South Dakota border. The city is situated in the Badlands region of the state, and is surrounded by rolling hills and prairies. The city is located at an elevation of 2,400 feet, and has a total area of 1.2 square miles.
The climate in Alice is semi-arid, with hot summers and cold winters. The average annual temperature is around 50 degrees Fahrenheit, and the average annual precipitation is around 16 inches.
Economy
Alice’s economy is largely based on agriculture and tourism. The city is home to several farms, which produce a variety of crops, including wheat, corn, and soybeans. The city is also home to several tourist attractions, including the Badlands National Park, the Theodore Roosevelt National Park, and the Knife River Indian Villages National Historic Site.
Demographics
As of the 2010 census, Alice had a population of 1,500 people. The racial makeup of the city was 97.3% White, 0.7% Native American, 0.3% Asian, 0.2% from other races, and 1.5% from two or more races. The median household income was $37,500, and the median family income was $45,000.
Alice is a small city with a rich history and a vibrant economy. The city is home to a diverse population, and is a popular destination for tourists. With its beautiful scenery and friendly people, Alice is a great place to live and visit.
Common Questions
What is Per Capita Income in Alice?
Per Capita income in Alice is $33,239.
What is the Median Family Income in Alice?
Median Family Income in Alice is $118,214.
What is the Median Household income in Alice?
Median Household Income in Alice is $117,857.
What is Income or Wage Gap in Alice?
Income or Wage Gap in Alice is 54.6%.
Women in Alice earn 45.4 cents for every dollar earned by a man.
What is Inequality or Gini Index in Alice?
Inequality or Gini Index in Alice is 0.26.
What is the Total Population of Alice?
Total Population of Alice is 44.
What is the Total Male Population of Alice?
Total Male Population of Alice is 24.
What is the Total Female Population of Alice?
Total Female Population of Alice is 20.
What is the Ratio of Males per 100 Females in Alice?
There are 120.00 Males per 100 Females in Alice.
What is the Ratio of Females per 100 Males in Alice?
There are 83.33 Females per 100 Males in Alice.
What is the Median Population Age in Alice?
Median Population Age in Alice is 37.4 Years.
What is the Average Family Size in Alice
Average Family Size in Alice is 2.9 People.
What is the Average Household Size in Alice
Average Household Size in Alice is 2.8 People.
How Large is the Labor Force in Alice?
There are 22 People in the Labor Forcein in Alice.
What is the Percentage of People in the Labor Force in Alice?
81.5% of People are in the Labor Force in Alice.