Cooke City, MT Map & Demographics
Cooke City Map
Cooke City Overview
$33,986
PER CAPITA INCOME
$75,536
AVG FAMILY INCOME
$41,250
AVG HOUSEHOLD INCOME
51.7%
WAGE / INCOME GAP [ % ]
48.3¢/ $1
WAGE / INCOME GAP [ $ ]
0.40
INEQUALITY / GINI INDEX
83
TOTAL POPULATION
43
MALE POPULATION
40
FEMALE POPULATION
107.50
MALES / 100 FEMALES
93.02
FEMALES / 100 MALES
46.3
MEDIAN AGE
2.3
AVG FAMILY SIZE
1.8
AVG HOUSEHOLD SIZE
46
LABOR FORCE [ PEOPLE ]
59.0%
PERCENT IN LABOR FORCE
Cooke City Zip Codes
Cooke City Area Codes
Income in Cooke City
Income Overview in Cooke City
Per Capita Income in Cooke City is $33,986, while median incomes of families and households are $75,536 and $41,250 respectively.
| Characteristic | Number | Measure |
| Per Capita Income | 83 | $33,986 |
| Median Family Income | 27 | $75,536 |
| Mean Family Income | 27 | $84,633 |
| Median Household Income | 45 | $41,250 |
| Mean Household Income | 45 | $61,227 |
| Income Deficit | 27 | $0 |
| Wage / Income Gap (%) | 83 | 51.65% |
| Wage / Income Gap ($) | 83 | 48.35¢ per $1 |
| Gini / Inequality Index | 83 | 0.40 |
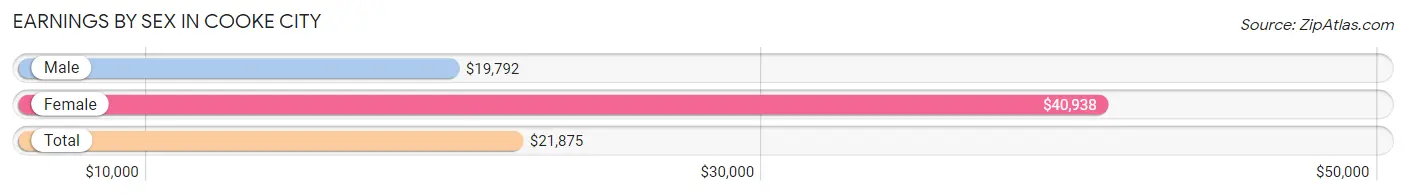
Earnings by Sex in Cooke City
Average Earnings in Cooke City are $21,875, $19,792 for men and $40,938 for women, a difference of 51.6%.
| Sex | Number | Average Earnings |
| Male | 31 (56.4%) | $19,792 |
| Female | 24 (43.6%) | $40,938 |
| Total | 55 (100.0%) | $21,875 |
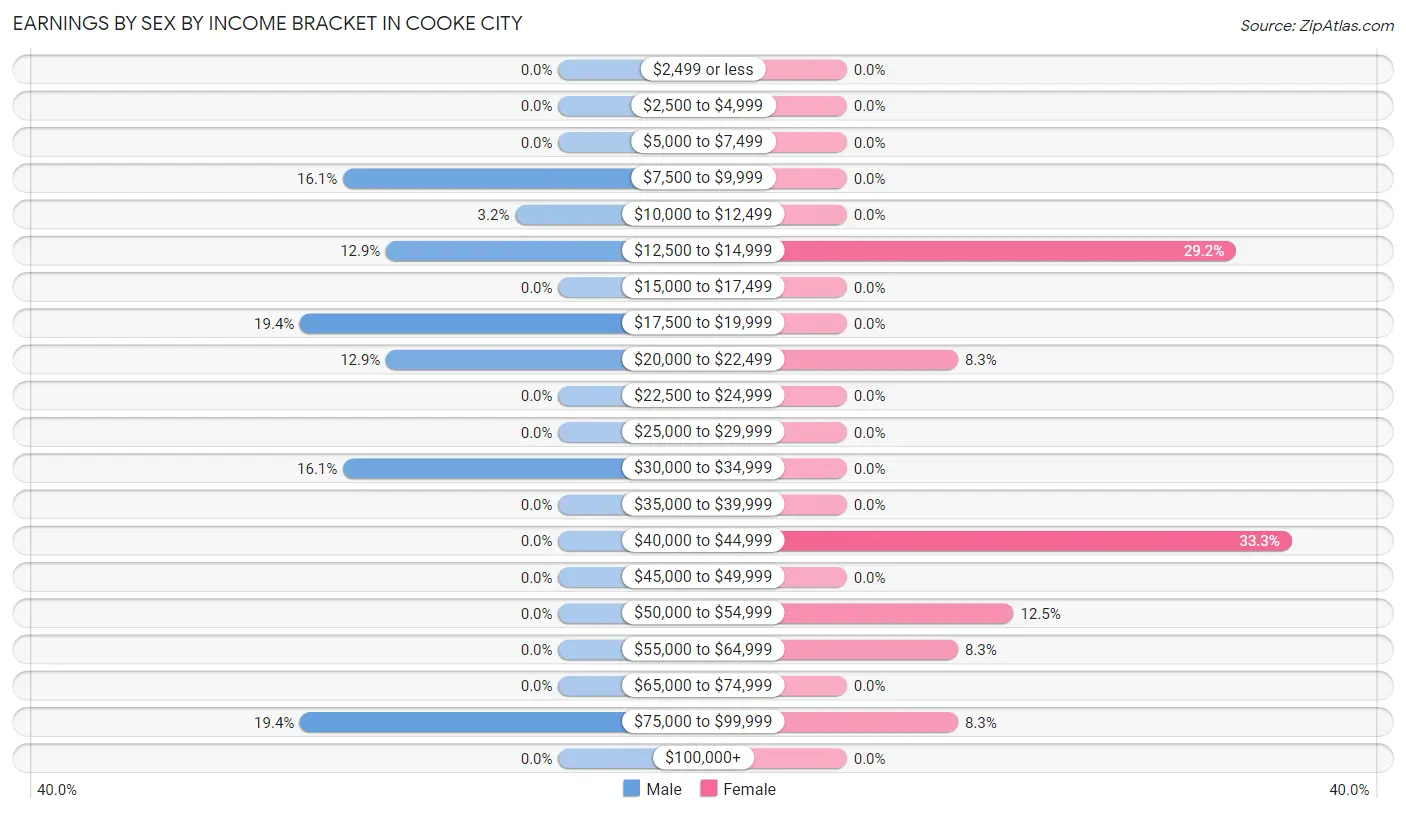
Earnings by Sex by Income Bracket in Cooke City
The most common earnings brackets in Cooke City are $17,500 to $19,999 for men (6 | 19.4%) and $40,000 to $44,999 for women (8 | 33.3%).
| Income | Male | Female |
| $2,499 or less | 0 (0.0%) | 0 (0.0%) |
| $2,500 to $4,999 | 0 (0.0%) | 0 (0.0%) |
| $5,000 to $7,499 | 0 (0.0%) | 0 (0.0%) |
| $7,500 to $9,999 | 5 (16.1%) | 0 (0.0%) |
| $10,000 to $12,499 | 1 (3.2%) | 0 (0.0%) |
| $12,500 to $14,999 | 4 (12.9%) | 7 (29.2%) |
| $15,000 to $17,499 | 0 (0.0%) | 0 (0.0%) |
| $17,500 to $19,999 | 6 (19.4%) | 0 (0.0%) |
| $20,000 to $22,499 | 4 (12.9%) | 2 (8.3%) |
| $22,500 to $24,999 | 0 (0.0%) | 0 (0.0%) |
| $25,000 to $29,999 | 0 (0.0%) | 0 (0.0%) |
| $30,000 to $34,999 | 5 (16.1%) | 0 (0.0%) |
| $35,000 to $39,999 | 0 (0.0%) | 0 (0.0%) |
| $40,000 to $44,999 | 0 (0.0%) | 8 (33.3%) |
| $45,000 to $49,999 | 0 (0.0%) | 0 (0.0%) |
| $50,000 to $54,999 | 0 (0.0%) | 3 (12.5%) |
| $55,000 to $64,999 | 0 (0.0%) | 2 (8.3%) |
| $65,000 to $74,999 | 0 (0.0%) | 0 (0.0%) |
| $75,000 to $99,999 | 6 (19.4%) | 2 (8.3%) |
| $100,000+ | 0 (0.0%) | 0 (0.0%) |
| Total | 31 (100.0%) | 24 (100.0%) |
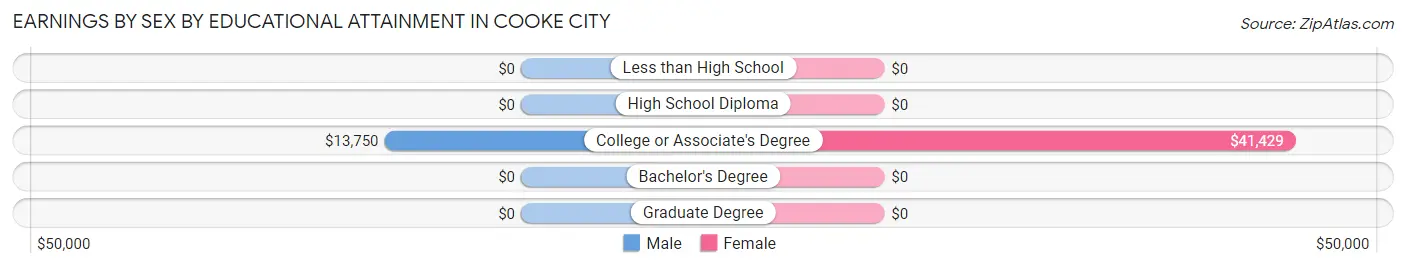
Earnings by Sex by Educational Attainment in Cooke City
Average earnings in Cooke City are $21,563 for men and $41,250 for women, a difference of 47.7%. Men with an educational attainment of college or associate's degree enjoy the highest average annual earnings of $13,750, while those with college or associate's degree education earn the least with $13,750. Women with an educational attainment of college or associate's degree earn the most with the average annual earnings of $41,429, while those with college or associate's degree education have the smallest earnings of $41,429.
| Educational Attainment | Male Income | Female Income |
| Less than High School | - | - |
| High School Diploma | - | - |
| College or Associate's Degree | $13,750 | $41,429 |
| Bachelor's Degree | - | - |
| Graduate Degree | - | - |
| Total | $21,563 | $41,250 |
Family Income in Cooke City
Family Income Brackets in Cooke City
According to the Cooke City family income data, there are 7 families falling into the $75,000 to $99,999 income range, which is the most common income bracket and makes up 25.9% of all families.
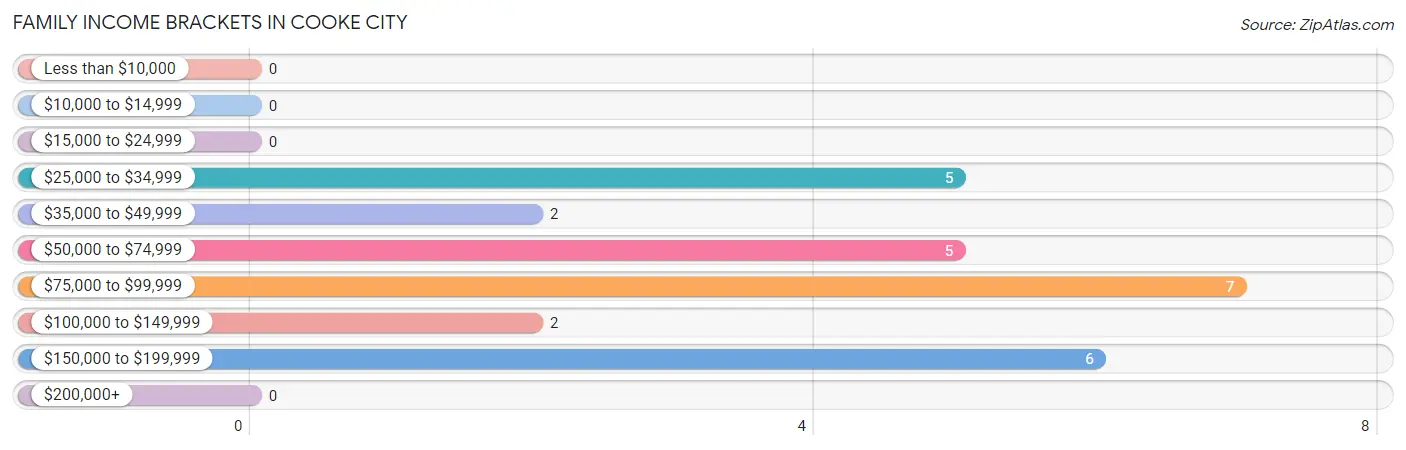
| Income Bracket | # Families | % Families |
| Less than $10,000 | 0 | 0.0% |
| $10,000 to $14,999 | 0 | 0.0% |
| $15,000 to $24,999 | 0 | 0.0% |
| $25,000 to $34,999 | 5 | 18.5% |
| $35,000 to $49,999 | 2 | 7.4% |
| $50,000 to $74,999 | 5 | 18.5% |
| $75,000 to $99,999 | 7 | 25.9% |
| $100,000 to $149,999 | 2 | 7.4% |
| $150,000 to $199,999 | 6 | 22.2% |
| $200,000+ | 0 | 0.0% |
Family Income by Famaliy Size in Cooke City
2-person families (21 | 77.8%) account for the highest median family income in Cooke City with $75,893 per family, while 2-person families (21 | 77.8%) have the highest median income of $37,946 per family member.
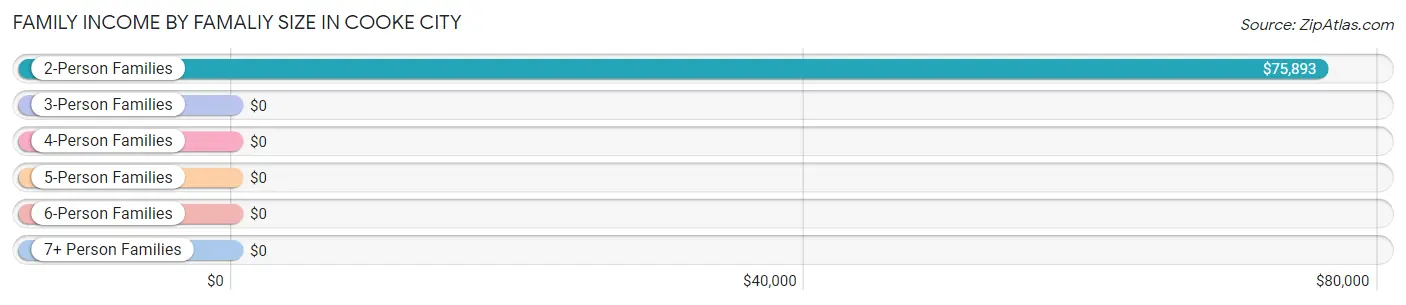
| Income Bracket | # Families | Median Income |
| 2-Person Families | 21 (77.8%) | $75,893 |
| 3-Person Families | 2 (7.4%) | $0 |
| 4-Person Families | 4 (14.8%) | $0 |
| 5-Person Families | 0 (0.0%) | $0 |
| 6-Person Families | 0 (0.0%) | $0 |
| 7+ Person Families | 0 (0.0%) | $0 |
| Total | 27 (100.0%) | $75,536 |
Family Income by Number of Earners in Cooke City
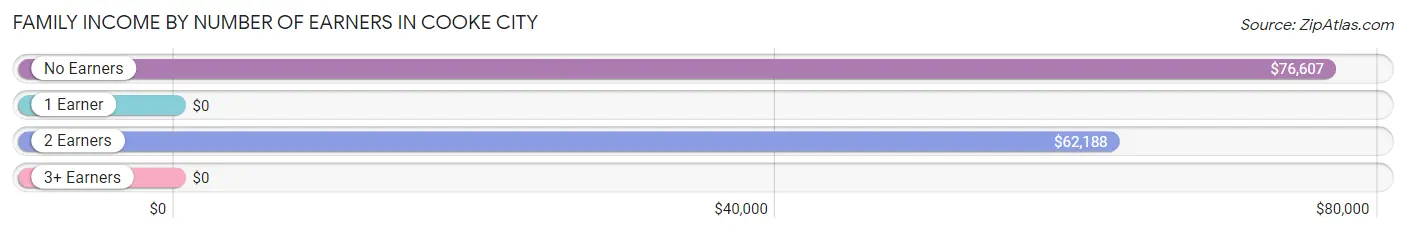
| Number of Earners | # Families | Median Income |
| No Earners | 9 (33.3%) | $76,607 |
| 1 Earner | 3 (11.1%) | $0 |
| 2 Earners | 15 (55.6%) | $62,188 |
| 3+ Earners | 0 (0.0%) | $0 |
| Total | 27 (100.0%) | $75,536 |
Household Income in Cooke City
Household Income Brackets in Cooke City
With 9 households falling in the category, the $35,000 to $49,999 income range is the most frequent in Cooke City, accounting for 20.0% of all households.
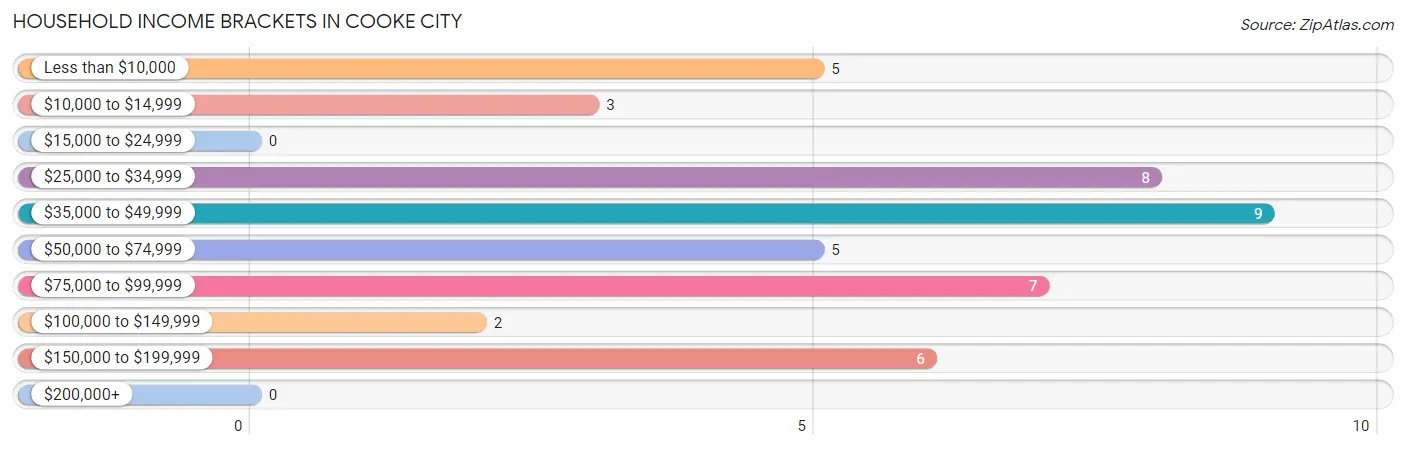
| Income Bracket | # Households | % Households |
| Less than $10,000 | 5 | 11.1% |
| $10,000 to $14,999 | 3 | 6.7% |
| $15,000 to $24,999 | 0 | 0.0% |
| $25,000 to $34,999 | 8 | 17.8% |
| $35,000 to $49,999 | 9 | 20.0% |
| $50,000 to $74,999 | 5 | 11.1% |
| $75,000 to $99,999 | 7 | 15.6% |
| $100,000 to $149,999 | 2 | 4.4% |
| $150,000 to $199,999 | 6 | 13.3% |
| $200,000+ | 0 | 0.0% |
Household Income by Householder Age in Cooke City
The median household income in Cooke City is $41,250, with the highest median household income of $75,625 found in the 45 to 64 years age bracket for the primary householder. A total of 14 households (31.1%) fall into this category. Meanwhile, the 15 to 24 years age bracket for the primary householder has the lowest median household income of $0, with 6 households (13.3%) in this group.
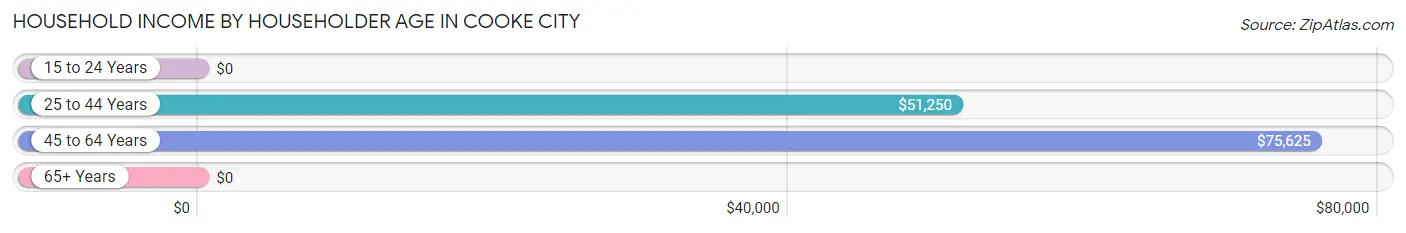
| Income Bracket | # Households | Median Income |
| 15 to 24 Years | 6 (13.3%) | $0 |
| 25 to 44 Years | 12 (26.7%) | $51,250 |
| 45 to 64 Years | 14 (31.1%) | $75,625 |
| 65+ Years | 13 (28.9%) | $0 |
| Total | 45 (100.0%) | $41,250 |
Poverty in Cooke City
Income Below Poverty by Sex and Age in Cooke City
With 11.6% poverty level for males and 7.5% for females among the residents of Cooke City, 75 year old and over males and 55 to 64 year old females are the most vulnerable to poverty, with 5 males (71.4%) and 3 females (27.3%) in their respective age groups living below the poverty level.
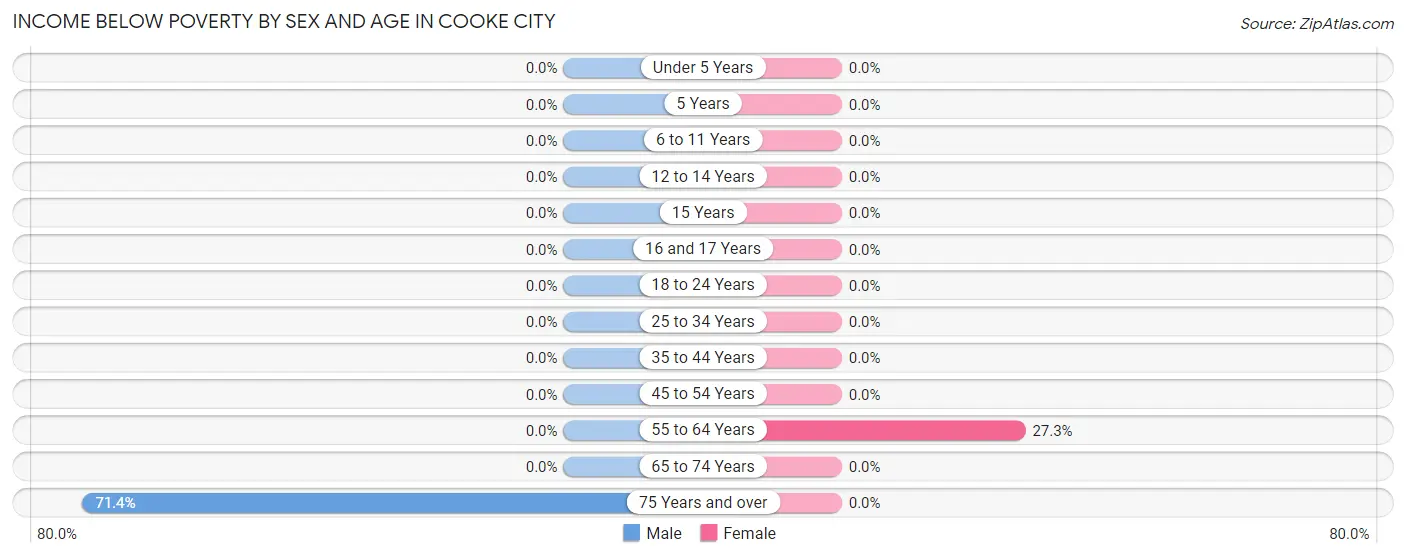
| Age Bracket | Male | Female |
| Under 5 Years | 0 (0.0%) | 0 (0.0%) |
| 5 Years | 0 (0.0%) | 0 (0.0%) |
| 6 to 11 Years | 0 (0.0%) | 0 (0.0%) |
| 12 to 14 Years | 0 (0.0%) | 0 (0.0%) |
| 15 Years | 0 (0.0%) | 0 (0.0%) |
| 16 and 17 Years | 0 (0.0%) | 0 (0.0%) |
| 18 to 24 Years | 0 (0.0%) | 0 (0.0%) |
| 25 to 34 Years | 0 (0.0%) | 0 (0.0%) |
| 35 to 44 Years | 0 (0.0%) | 0 (0.0%) |
| 45 to 54 Years | 0 (0.0%) | 0 (0.0%) |
| 55 to 64 Years | 0 (0.0%) | 3 (27.3%) |
| 65 to 74 Years | 0 (0.0%) | 0 (0.0%) |
| 75 Years and over | 5 (71.4%) | 0 (0.0%) |
| Total | 5 (11.6%) | 3 (7.5%) |
Income Above Poverty by Sex and Age in Cooke City
According to the poverty statistics in Cooke City, males aged 18 to 24 years and females aged 6 to 11 years are the age groups that are most secure financially, with 100.0% of males and 100.0% of females in these age groups living above the poverty line.
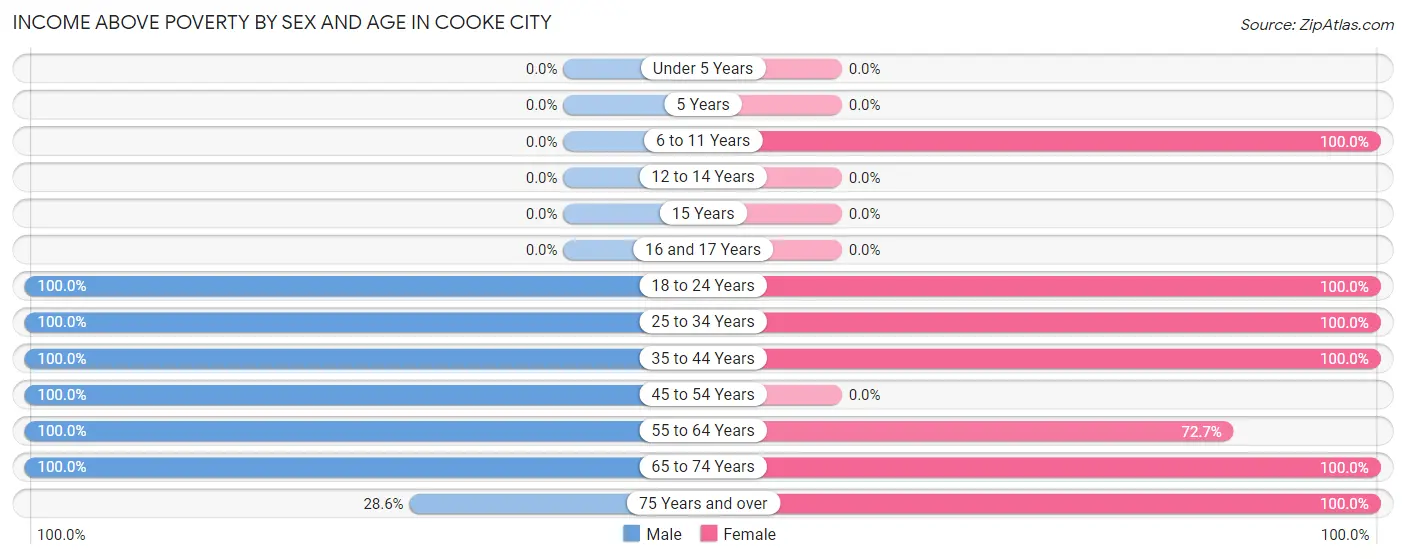
| Age Bracket | Male | Female |
| Under 5 Years | 0 (0.0%) | 0 (0.0%) |
| 5 Years | 0 (0.0%) | 0 (0.0%) |
| 6 to 11 Years | 0 (0.0%) | 5 (100.0%) |
| 12 to 14 Years | 0 (0.0%) | 0 (0.0%) |
| 15 Years | 0 (0.0%) | 0 (0.0%) |
| 16 and 17 Years | 0 (0.0%) | 0 (0.0%) |
| 18 to 24 Years | 6 (100.0%) | 2 (100.0%) |
| 25 to 34 Years | 7 (100.0%) | 4 (100.0%) |
| 35 to 44 Years | 4 (100.0%) | 13 (100.0%) |
| 45 to 54 Years | 8 (100.0%) | 0 (0.0%) |
| 55 to 64 Years | 1 (100.0%) | 8 (72.7%) |
| 65 to 74 Years | 10 (100.0%) | 3 (100.0%) |
| 75 Years and over | 2 (28.6%) | 2 (100.0%) |
| Total | 38 (88.4%) | 37 (92.5%) |
Income Below Poverty Among Married-Couple Families in Cooke City
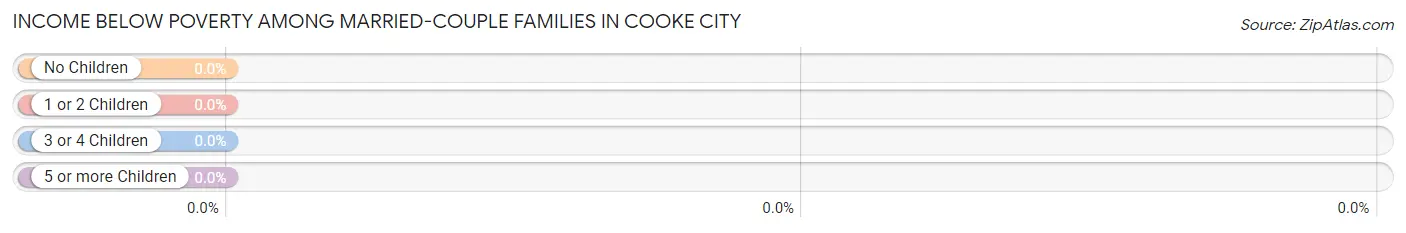
| Children | Above Poverty | Below Poverty |
| No Children | 21 (100.0%) | 0 (0.0%) |
| 1 or 2 Children | 6 (100.0%) | 0 (0.0%) |
| 3 or 4 Children | 0 (0.0%) | 0 (0.0%) |
| 5 or more Children | 0 (0.0%) | 0 (0.0%) |
| Total | 27 (100.0%) | 0 (0.0%) |
Income Below Poverty Among Single-Parent Households in Cooke City
| Children | Single Father | Single Mother |
| No Children | 0 (0.0%) | 0 (0.0%) |
| 1 or 2 Children | 0 (0.0%) | 0 (0.0%) |
| 3 or 4 Children | 0 (0.0%) | 0 (0.0%) |
| 5 or more Children | 0 (0.0%) | 0 (0.0%) |
| Total | 0 (0.0%) | 0 (0.0%) |
Income Below Poverty Among Married-Couple vs Single-Parent Households in Cooke City
| Children | Married-Couple Families | Single-Parent Households |
| No Children | 0 (0.0%) | 0 (0.0%) |
| 1 or 2 Children | 0 (0.0%) | 0 (0.0%) |
| 3 or 4 Children | 0 (0.0%) | 0 (0.0%) |
| 5 or more Children | 0 (0.0%) | 0 (0.0%) |
| Total | 0 (0.0%) | 0 (0.0%) |
Race in Cooke City
The most populous races in Cooke City are White / Caucasian (83 | 100.0%), and Hispanic or Latino (2 | 2.4%).
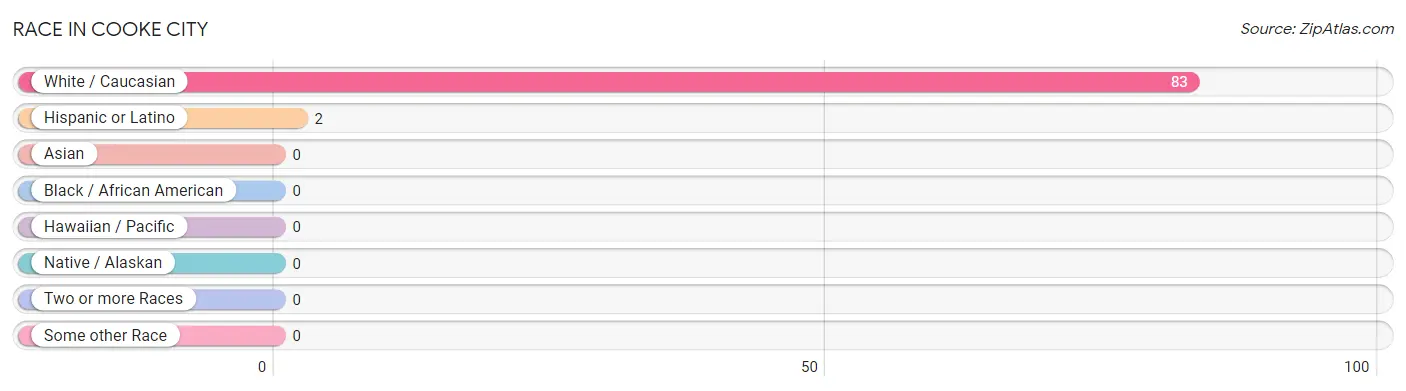
| Race | # Population | % Population |
| Asian | 0 | 0.0% |
| Black / African American | 0 | 0.0% |
| Hawaiian / Pacific | 0 | 0.0% |
| Hispanic or Latino | 2 | 2.4% |
| Native / Alaskan | 0 | 0.0% |
| White / Caucasian | 83 | 100.0% |
| Two or more Races | 0 | 0.0% |
| Some other Race | 0 | 0.0% |
| Total | 83 | 100.0% |
Ancestry in Cooke City
The most populous ancestries reported in Cooke City are Irish (21 | 25.3%), English (17 | 20.5%), German (16 | 19.3%), Dutch (15 | 18.1%), and Scottish (8 | 9.6%), together accounting for 92.8% of all Cooke City residents.
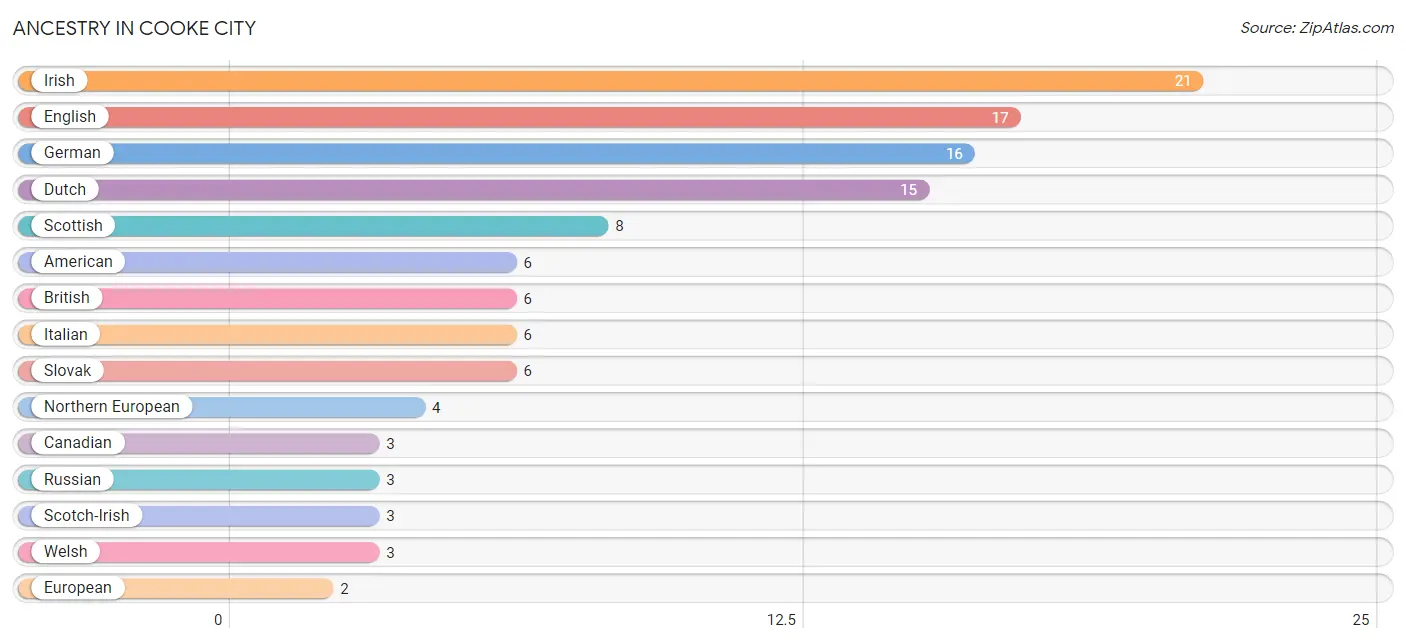
| Ancestry | # Population | % Population |
| American | 6 | 7.2% |
| British | 6 | 7.2% |
| Canadian | 3 | 3.6% |
| Czech | 1 | 1.2% |
| Dutch | 15 | 18.1% |
| English | 17 | 20.5% |
| European | 2 | 2.4% |
| German | 16 | 19.3% |
| Irish | 21 | 25.3% |
| Italian | 6 | 7.2% |
| Mexican | 2 | 2.4% |
| Northern European | 4 | 4.8% |
| Russian | 3 | 3.6% |
| Scotch-Irish | 3 | 3.6% |
| Scottish | 8 | 9.6% |
| Slovak | 6 | 7.2% |
| Welsh | 3 | 3.6% | View All 17 Rows |
Immigrants in Cooke City
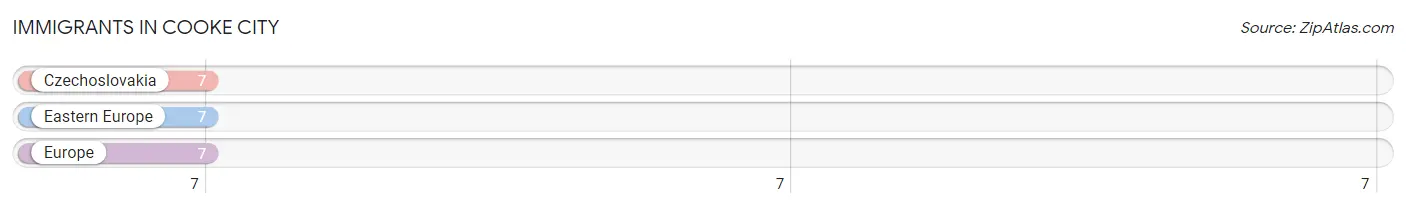
The most numerous immigrant groups reported in Cooke City came from Czechoslovakia (7 | 8.4%), Eastern Europe (7 | 8.4%), and Europe (7 | 8.4%), together accounting for 25.3% of all Cooke City residents.
| Immigration Origin | # Population | % Population |
| Czechoslovakia | 7 | 8.4% |
| Eastern Europe | 7 | 8.4% |
| Europe | 7 | 8.4% | View All 3 Rows |
Sex and Age in Cooke City
Sex and Age in Cooke City
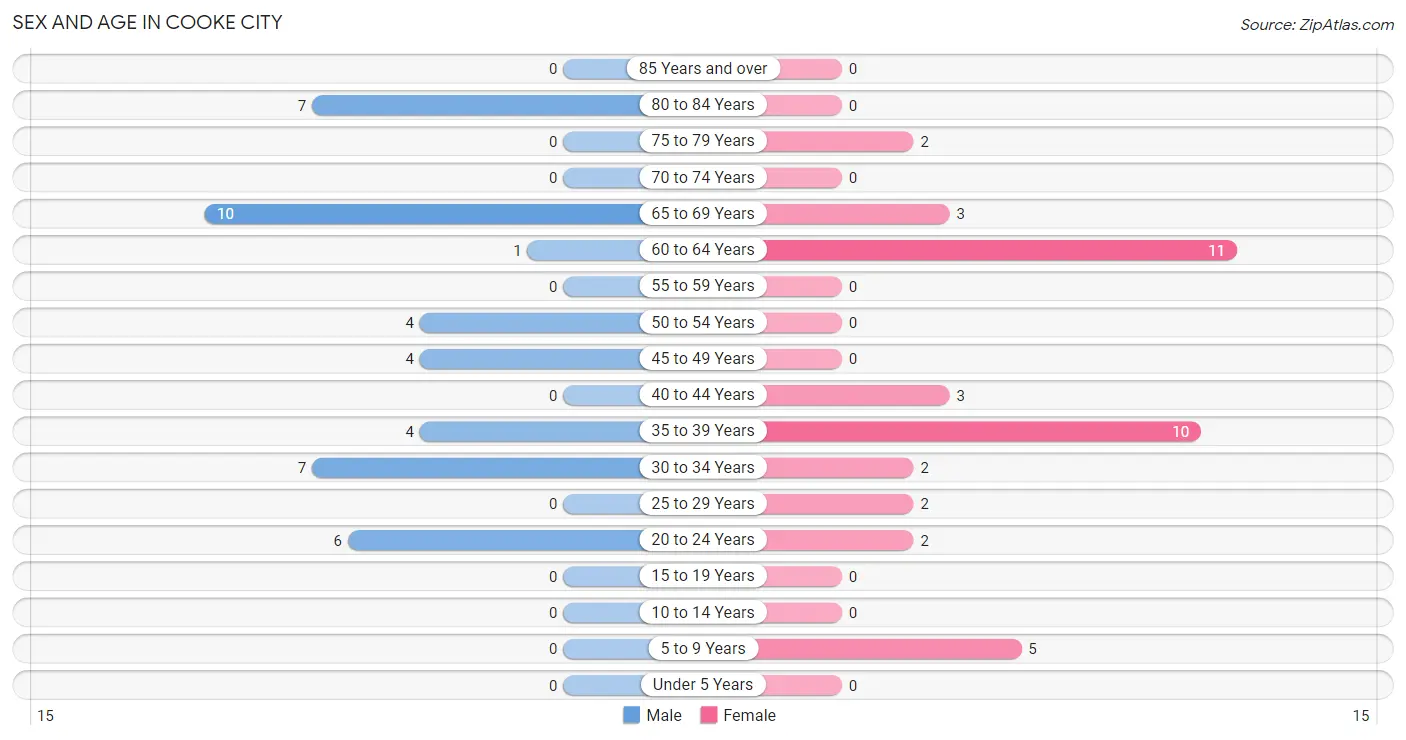
The most populous age groups in Cooke City are 65 to 69 Years (10 | 23.3%) for men and 60 to 64 Years (11 | 27.5%) for women.
| Age Bracket | Male | Female |
| Under 5 Years | 0 (0.0%) | 0 (0.0%) |
| 5 to 9 Years | 0 (0.0%) | 5 (12.5%) |
| 10 to 14 Years | 0 (0.0%) | 0 (0.0%) |
| 15 to 19 Years | 0 (0.0%) | 0 (0.0%) |
| 20 to 24 Years | 6 (14.0%) | 2 (5.0%) |
| 25 to 29 Years | 0 (0.0%) | 2 (5.0%) |
| 30 to 34 Years | 7 (16.3%) | 2 (5.0%) |
| 35 to 39 Years | 4 (9.3%) | 10 (25.0%) |
| 40 to 44 Years | 0 (0.0%) | 3 (7.5%) |
| 45 to 49 Years | 4 (9.3%) | 0 (0.0%) |
| 50 to 54 Years | 4 (9.3%) | 0 (0.0%) |
| 55 to 59 Years | 0 (0.0%) | 0 (0.0%) |
| 60 to 64 Years | 1 (2.3%) | 11 (27.5%) |
| 65 to 69 Years | 10 (23.3%) | 3 (7.5%) |
| 70 to 74 Years | 0 (0.0%) | 0 (0.0%) |
| 75 to 79 Years | 0 (0.0%) | 2 (5.0%) |
| 80 to 84 Years | 7 (16.3%) | 0 (0.0%) |
| 85 Years and over | 0 (0.0%) | 0 (0.0%) |
| Total | 43 (100.0%) | 40 (100.0%) |
Families and Households in Cooke City
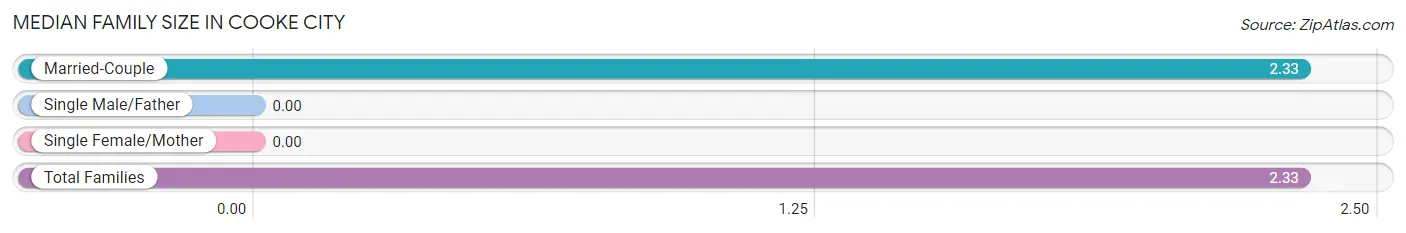
Median Family Size in Cooke City
| Family Type | # Families | Family Size |
| Married-Couple | 27 (100.0%) | 2.33 |
| Single Male/Father | 0 (0.0%) | - |
| Single Female/Mother | 0 (0.0%) | - |
| Total Families | 27 (100.0%) | 2.33 |
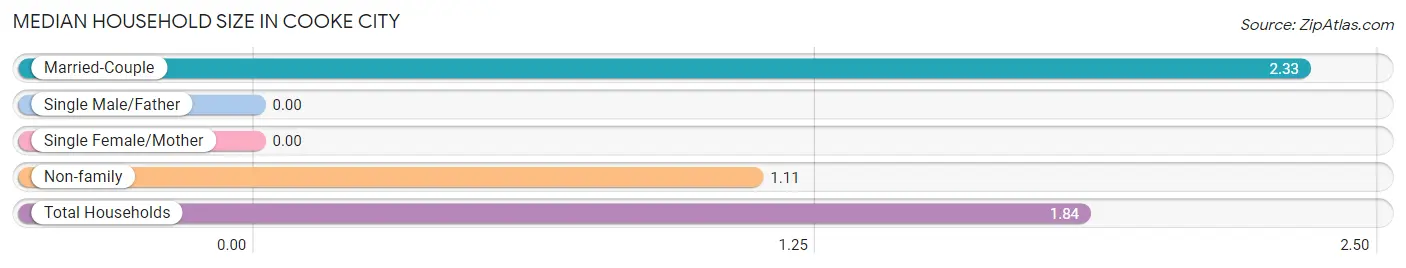
Median Household Size in Cooke City
| Household Type | # Households | Household Size |
| Married-Couple | 27 (60.0%) | 2.33 |
| Single Male/Father | 0 (0.0%) | - |
| Single Female/Mother | 0 (0.0%) | - |
| Non-family | 18 (40.0%) | 1.11 |
| Total Households | 45 (100.0%) | 1.84 |
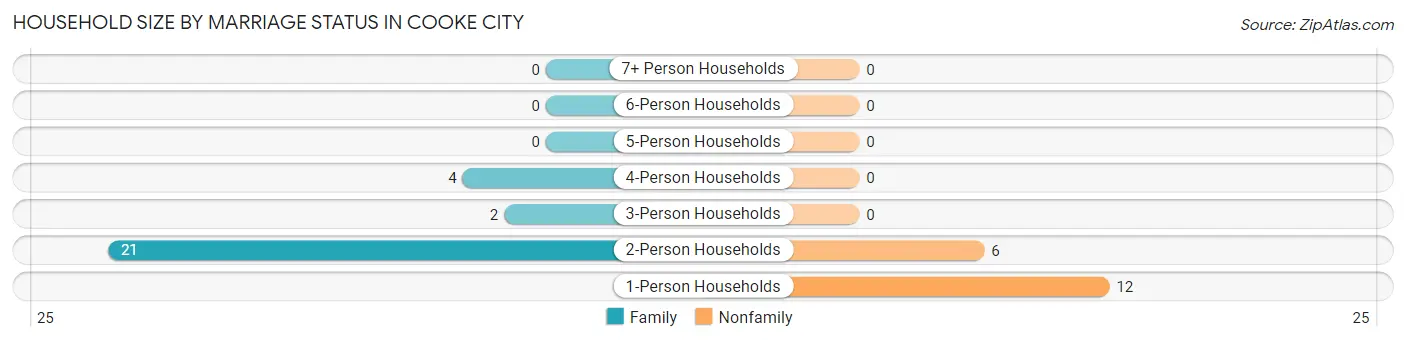
Household Size by Marriage Status in Cooke City
Out of a total of 45 households in Cooke City, 27 (60.0%) are family households, while 18 (40.0%) are nonfamily households. The most numerous type of family households are 2-person households, comprising 21, and the most common type of nonfamily households are 1-person households, comprising 12.
| Household Size | Family Households | Nonfamily Households |
| 1-Person Households | - | 12 (26.7%) |
| 2-Person Households | 21 (46.7%) | 6 (13.3%) |
| 3-Person Households | 2 (4.4%) | 0 (0.0%) |
| 4-Person Households | 4 (8.9%) | 0 (0.0%) |
| 5-Person Households | 0 (0.0%) | 0 (0.0%) |
| 6-Person Households | 0 (0.0%) | 0 (0.0%) |
| 7+ Person Households | 0 (0.0%) | 0 (0.0%) |
| Total | 27 (60.0%) | 18 (40.0%) |
Female Fertility in Cooke City
Fertility by Age in Cooke City
| Age Bracket | Women with Births | Births / 1,000 Women |
| 15 to 19 years | 0 (0.0%) | 0.0 |
| 20 to 34 years | 0 (0.0%) | 0.0 |
| 35 to 50 years | 0 (0.0%) | 0.0 |
| Total | 0 (0.0%) | 0.0 |
Fertility by Age by Marriage Status in Cooke City
| Age Bracket | Married | Unmarried |
| 15 to 19 years | 0 (0.0%) | 0 (0.0%) |
| 20 to 34 years | 0 (0.0%) | 0 (0.0%) |
| 35 to 50 years | 0 (0.0%) | 0 (0.0%) |
| Total | 0 (0.0%) | 0 (0.0%) |
Fertility by Education in Cooke City
| Educational Attainment | Women with Births | Births / 1,000 Women |
| Less than High School | 0 (0.0%) | 0.0 |
| High School Diploma | 0 (0.0%) | 0.0 |
| College or Associate's Degree | 0 (0.0%) | 0.0 |
| Bachelor's Degree | 0 (0.0%) | 0.0 |
| Graduate Degree | 0 (0.0%) | 0.0 |
| Total | 0 (0.0%) | 0.0 |
Fertility by Education by Marriage Status in Cooke City
| Educational Attainment | Married | Unmarried |
| Less than High School | 0 (0.0%) | 0 (0.0%) |
| High School Diploma | 0 (0.0%) | 0 (0.0%) |
| College or Associate's Degree | 0 (0.0%) | 0 (0.0%) |
| Bachelor's Degree | 0 (0.0%) | 0 (0.0%) |
| Graduate Degree | 0 (0.0%) | 0 (0.0%) |
| Total | 0 (0.0%) | 0 (0.0%) |
Employment Characteristics in Cooke City
Employment by Class of Employer in Cooke City
Among the 36 employed individuals in Cooke City, private company employees (24 | 66.7%), self-employed (incorporated) (6 | 16.7%), and self-employed (not incorporated) (6 | 16.7%) make up the most common classes of employment.
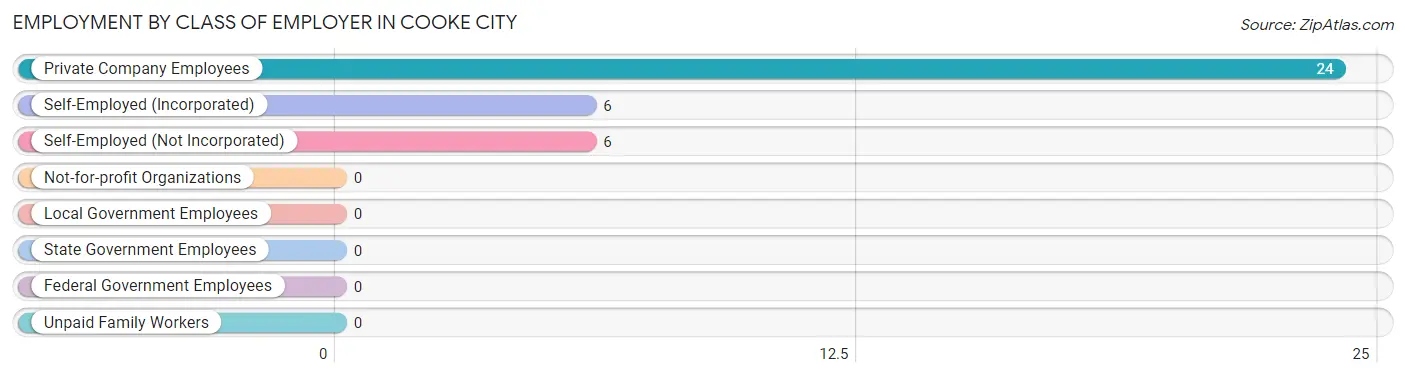
| Employer Class | # Employees | % Employees |
| Private Company Employees | 24 | 66.7% |
| Self-Employed (Incorporated) | 6 | 16.7% |
| Self-Employed (Not Incorporated) | 6 | 16.7% |
| Not-for-profit Organizations | 0 | 0.0% |
| Local Government Employees | 0 | 0.0% |
| State Government Employees | 0 | 0.0% |
| Federal Government Employees | 0 | 0.0% |
| Unpaid Family Workers | 0 | 0.0% |
| Total | 36 | 100.0% |
Employment Status by Age in Cooke City
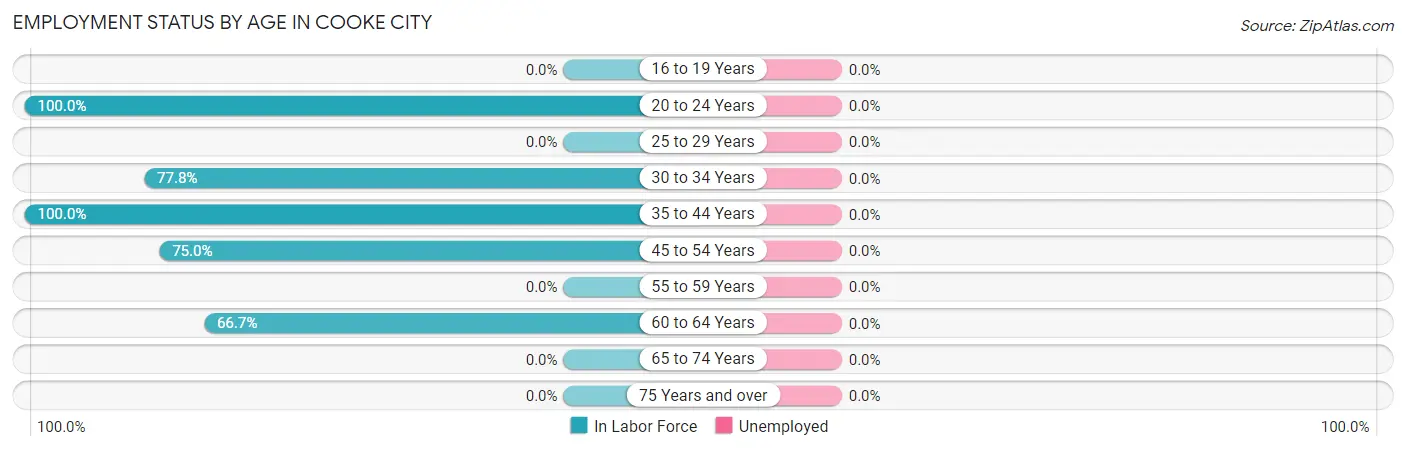
| Age Bracket | In Labor Force | Unemployed |
| 16 to 19 Years | 0 (0.0%) | 0 (0.0%) |
| 20 to 24 Years | 8 (100.0%) | 0 (0.0%) |
| 25 to 29 Years | 0 (0.0%) | 0 (0.0%) |
| 30 to 34 Years | 7 (77.8%) | 0 (0.0%) |
| 35 to 44 Years | 17 (100.0%) | 0 (0.0%) |
| 45 to 54 Years | 6 (75.0%) | 0 (0.0%) |
| 55 to 59 Years | 0 (0.0%) | 0 (0.0%) |
| 60 to 64 Years | 8 (66.7%) | 0 (0.0%) |
| 65 to 74 Years | 0 (0.0%) | 0 (0.0%) |
| 75 Years and over | 0 (0.0%) | 0 (0.0%) |
| Total | 46 (59.0%) | 0 (0.0%) |
Employment Status by Educational Attainment in Cooke City
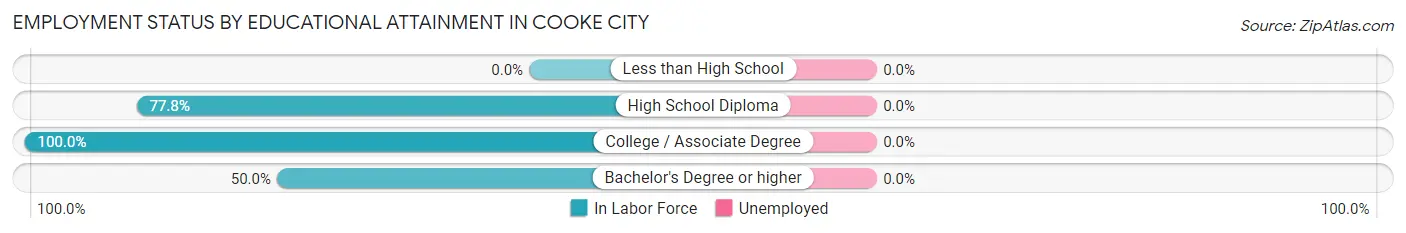
| Educational Attainment | In Labor Force | Unemployed |
| Less than High School | 0 (0.0%) | 0 (0.0%) |
| High School Diploma | 7 (77.8%) | 0 (0.0%) |
| College / Associate Degree | 23 (100.0%) | 0 (0.0%) |
| Bachelor's Degree or higher | 8 (50.0%) | 0 (0.0%) |
| Total | 38 (79.2%) | 0 (0.0%) |
Employment Occupations by Sex in Cooke City
Management, Business, Science and Arts Occupations
The most common Management, Business, Science and Arts occupations in Cooke City are Management (16 | 34.8%), and Business & Financial (7 | 15.2%).
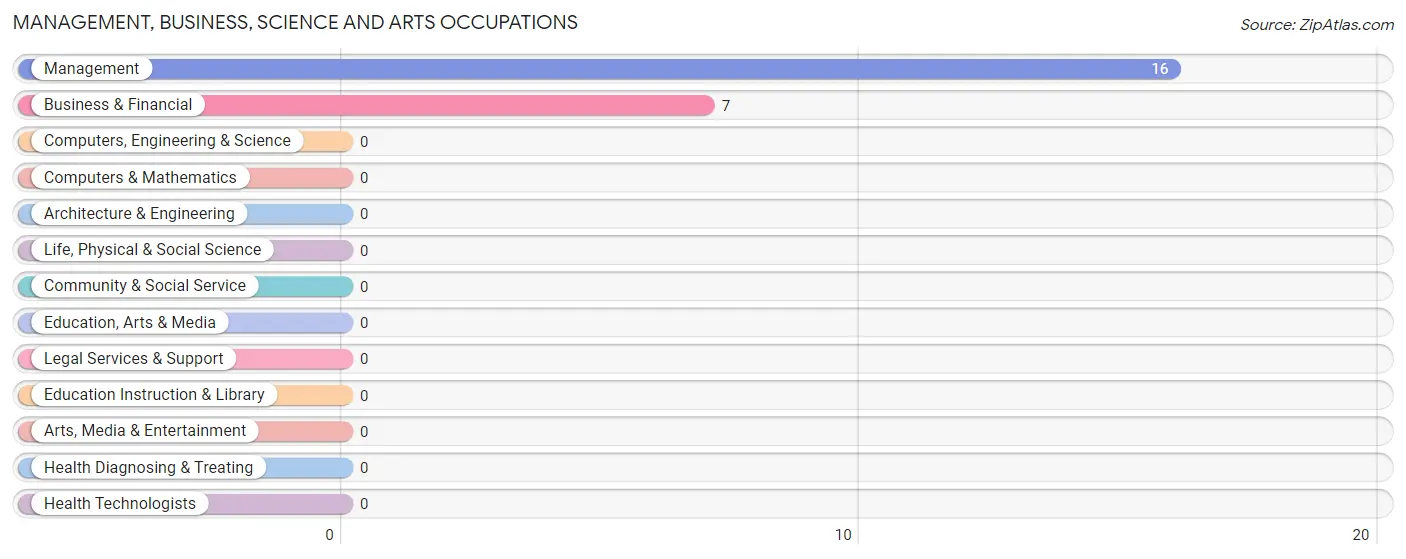
Management, Business, Science and Arts Occupations by Sex
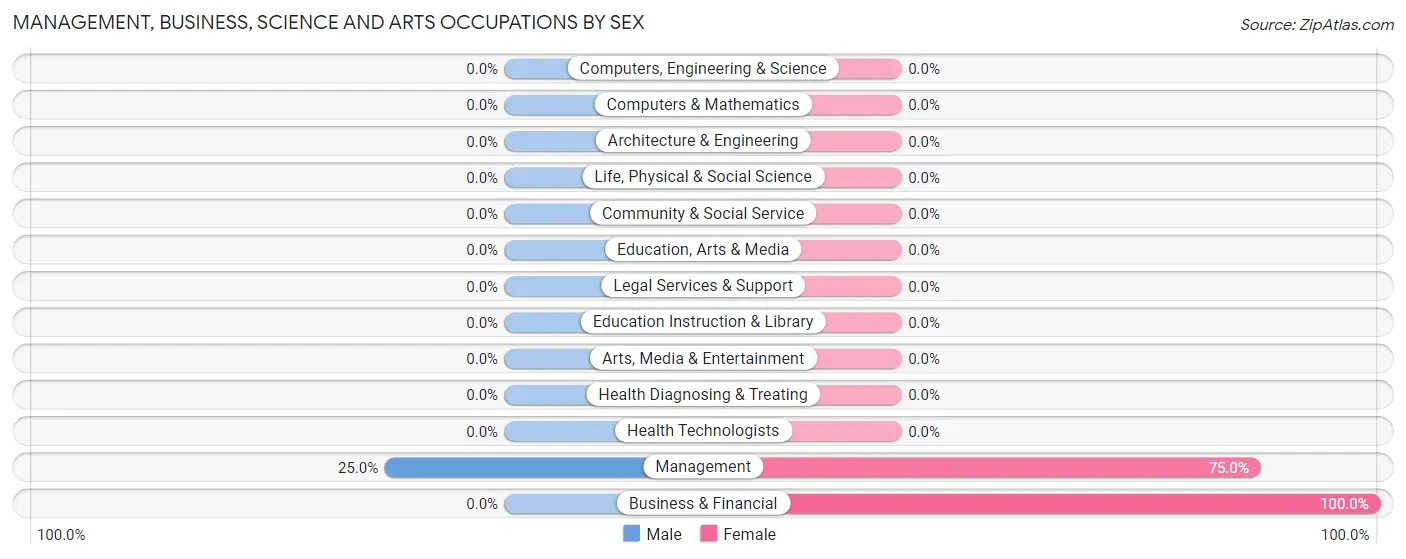
| Occupation | Male | Female |
| Management | 4 (25.0%) | 12 (75.0%) |
| Business & Financial | 0 (0.0%) | 7 (100.0%) |
| Computers, Engineering & Science | 0 (0.0%) | 0 (0.0%) |
| Computers & Mathematics | 0 (0.0%) | 0 (0.0%) |
| Architecture & Engineering | 0 (0.0%) | 0 (0.0%) |
| Life, Physical & Social Science | 0 (0.0%) | 0 (0.0%) |
| Community & Social Service | 0 (0.0%) | 0 (0.0%) |
| Education, Arts & Media | 0 (0.0%) | 0 (0.0%) |
| Legal Services & Support | 0 (0.0%) | 0 (0.0%) |
| Education Instruction & Library | 0 (0.0%) | 0 (0.0%) |
| Arts, Media & Entertainment | 0 (0.0%) | 0 (0.0%) |
| Health Diagnosing & Treating | 0 (0.0%) | 0 (0.0%) |
| Health Technologists | 0 (0.0%) | 0 (0.0%) |
| Total (Category) | 4 (17.4%) | 19 (82.6%) |
| Total (Overall) | 24 (52.2%) | 22 (47.8%) |
Services Occupations
The most common Services occupations in Cooke City are Food Preparation & Serving (11 | 23.9%), and Cleaning & Maintenance (1 | 2.2%).
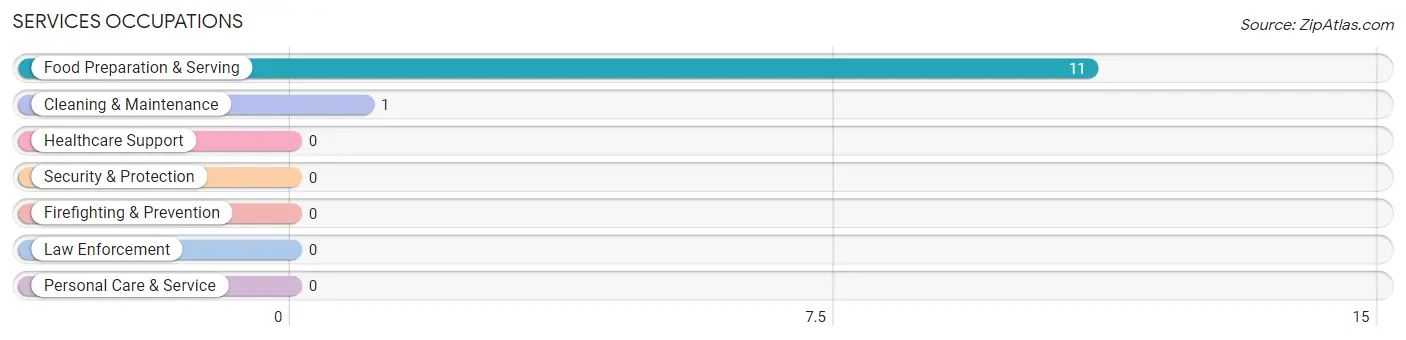
Services Occupations by Sex
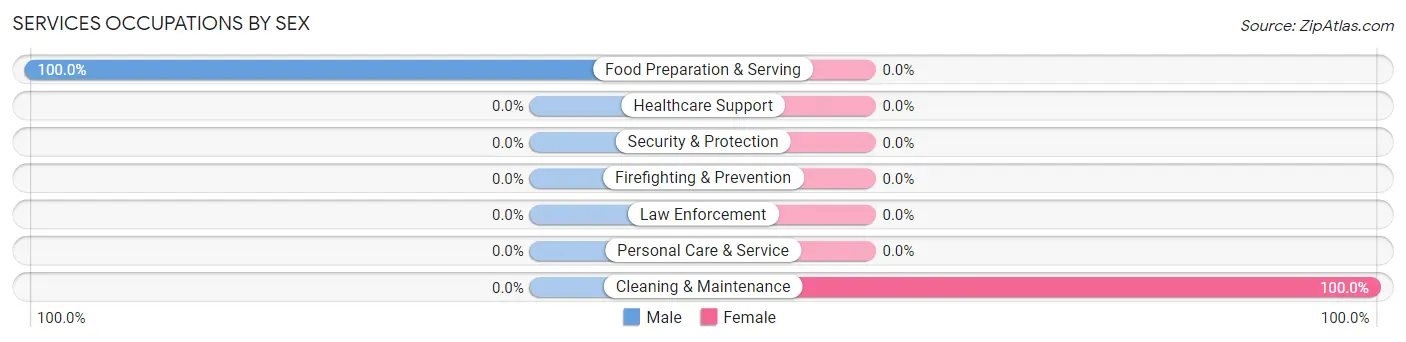
| Occupation | Male | Female |
| Healthcare Support | 0 (0.0%) | 0 (0.0%) |
| Security & Protection | 0 (0.0%) | 0 (0.0%) |
| Firefighting & Prevention | 0 (0.0%) | 0 (0.0%) |
| Law Enforcement | 0 (0.0%) | 0 (0.0%) |
| Food Preparation & Serving | 11 (100.0%) | 0 (0.0%) |
| Cleaning & Maintenance | 0 (0.0%) | 1 (100.0%) |
| Personal Care & Service | 0 (0.0%) | 0 (0.0%) |
| Total (Category) | 11 (91.7%) | 1 (8.3%) |
| Total (Overall) | 24 (52.2%) | 22 (47.8%) |
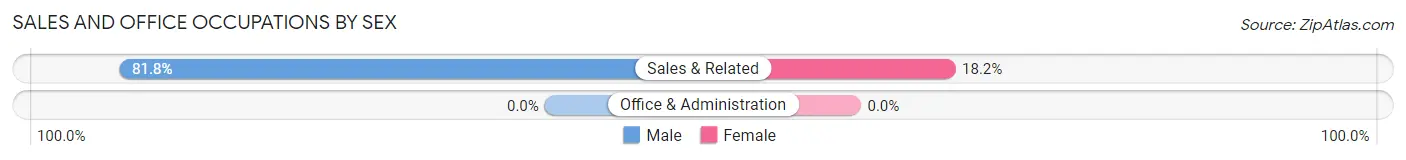
Sales and Office Occupations
The most common Sales and Office occupations in Cooke City are , and Sales & Related (11 | 23.9%).

Sales and Office Occupations by Sex
| Occupation | Male | Female |
| Sales & Related | 9 (81.8%) | 2 (18.2%) |
| Office & Administration | 0 (0.0%) | 0 (0.0%) |
| Total (Category) | 9 (81.8%) | 2 (18.2%) |
| Total (Overall) | 24 (52.2%) | 22 (47.8%) |
Natural Resources, Construction and Maintenance Occupations
Natural Resources, Construction and Maintenance Occupations by Sex
| Occupation | Male | Female |
| Farming, Fishing & Forestry | 0 (0.0%) | 0 (0.0%) |
| Construction & Extraction | 0 (0.0%) | 0 (0.0%) |
| Installation, Maintenance & Repair | 0 (0.0%) | 0 (0.0%) |
| Total (Category) | 0 (0.0%) | 0 (0.0%) |
| Total (Overall) | 24 (52.2%) | 22 (47.8%) |
Production, Transportation and Moving Occupations
Production, Transportation and Moving Occupations by Sex
| Occupation | Male | Female |
| Production | 0 (0.0%) | 0 (0.0%) |
| Transportation | 0 (0.0%) | 0 (0.0%) |
| Material Moving | 0 (0.0%) | 0 (0.0%) |
| Total (Category) | 0 (0.0%) | 0 (0.0%) |
| Total (Overall) | 24 (52.2%) | 22 (47.8%) |
Employment Industries by Sex in Cooke City
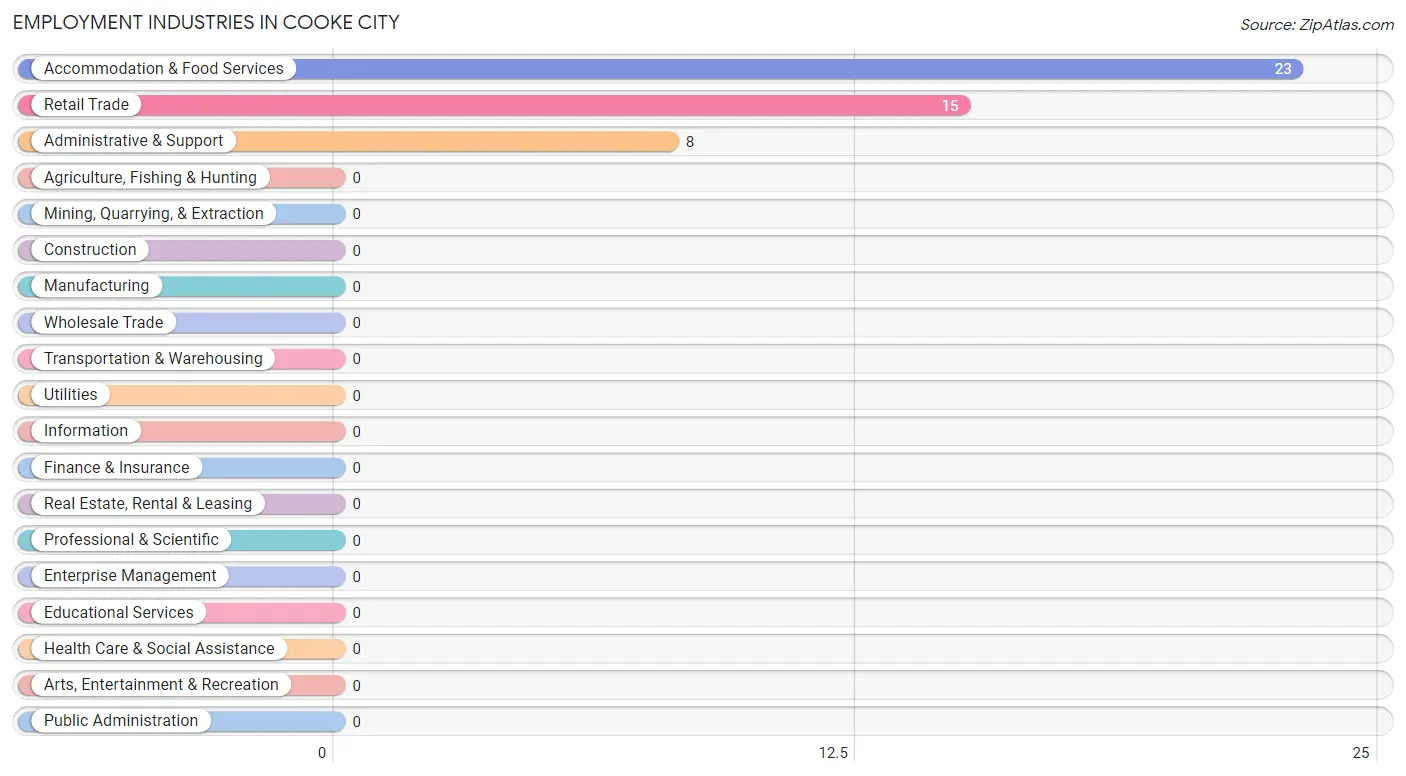
Employment Industries in Cooke City
The major employment industries in Cooke City include Accommodation & Food Services (23 | 50.0%), Retail Trade (15 | 32.6%), and Administrative & Support (8 | 17.4%).
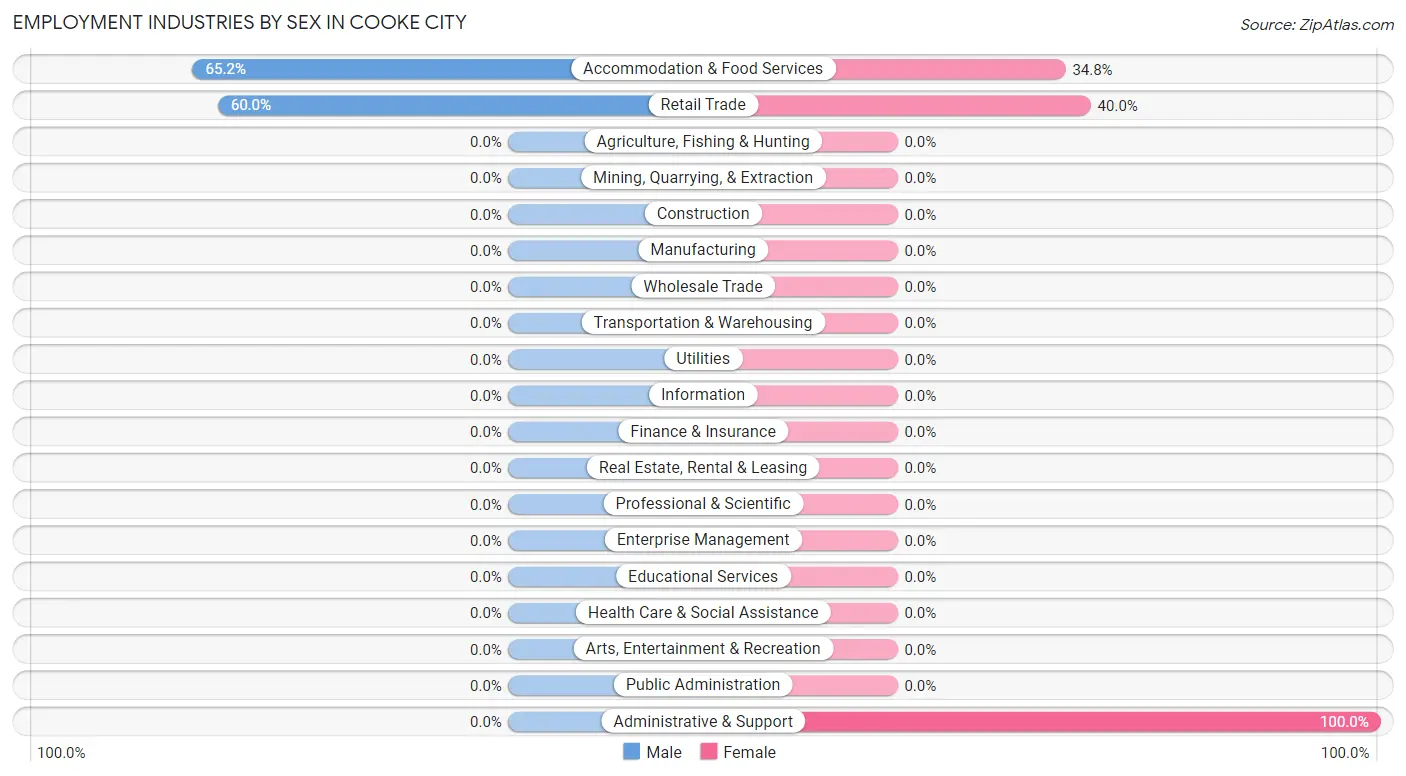
Employment Industries by Sex in Cooke City
The Cooke City industries that see more men than women are Accommodation & Food Services (65.2%), and Retail Trade (60.0%), whereas the industries that tend to have a higher number of women are Administrative & Support (100.0%), Retail Trade (40.0%), and Accommodation & Food Services (34.8%).
| Industry | Male | Female |
| Agriculture, Fishing & Hunting | 0 (0.0%) | 0 (0.0%) |
| Mining, Quarrying, & Extraction | 0 (0.0%) | 0 (0.0%) |
| Construction | 0 (0.0%) | 0 (0.0%) |
| Manufacturing | 0 (0.0%) | 0 (0.0%) |
| Wholesale Trade | 0 (0.0%) | 0 (0.0%) |
| Retail Trade | 9 (60.0%) | 6 (40.0%) |
| Transportation & Warehousing | 0 (0.0%) | 0 (0.0%) |
| Utilities | 0 (0.0%) | 0 (0.0%) |
| Information | 0 (0.0%) | 0 (0.0%) |
| Finance & Insurance | 0 (0.0%) | 0 (0.0%) |
| Real Estate, Rental & Leasing | 0 (0.0%) | 0 (0.0%) |
| Professional & Scientific | 0 (0.0%) | 0 (0.0%) |
| Enterprise Management | 0 (0.0%) | 0 (0.0%) |
| Administrative & Support | 0 (0.0%) | 8 (100.0%) |
| Educational Services | 0 (0.0%) | 0 (0.0%) |
| Health Care & Social Assistance | 0 (0.0%) | 0 (0.0%) |
| Arts, Entertainment & Recreation | 0 (0.0%) | 0 (0.0%) |
| Accommodation & Food Services | 15 (65.2%) | 8 (34.8%) |
| Public Administration | 0 (0.0%) | 0 (0.0%) |
| Total | 24 (52.2%) | 22 (47.8%) |
Education in Cooke City
School Enrollment in Cooke City
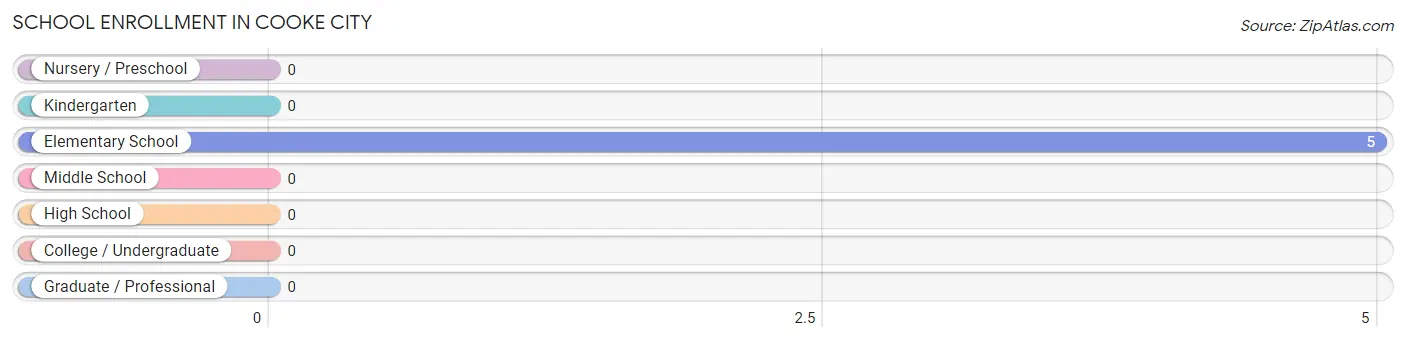
| School Level | # Students | % Students |
| Nursery / Preschool | 0 | 0.0% |
| Kindergarten | 0 | 0.0% |
| Elementary School | 5 | 100.0% |
| Middle School | 0 | 0.0% |
| High School | 0 | 0.0% |
| College / Undergraduate | 0 | 0.0% |
| Graduate / Professional | 0 | 0.0% |
| Total | 5 | 100.0% |
School Enrollment by Age by Funding Source in Cooke City
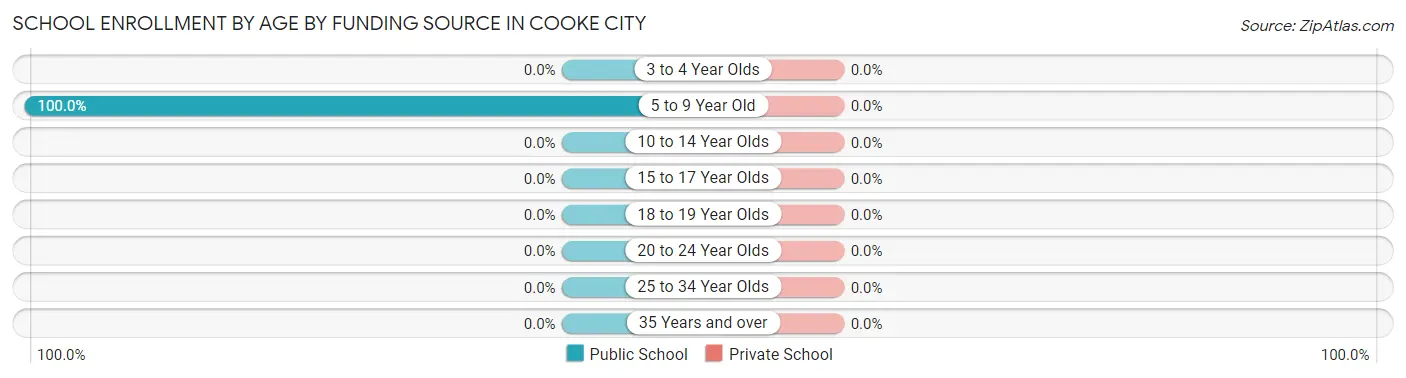
| Age Bracket | Public School | Private School |
| 3 to 4 Year Olds | 0 (0.0%) | 0 (0.0%) |
| 5 to 9 Year Old | 5 (100.0%) | 0 (0.0%) |
| 10 to 14 Year Olds | 0 (0.0%) | 0 (0.0%) |
| 15 to 17 Year Olds | 0 (0.0%) | 0 (0.0%) |
| 18 to 19 Year Olds | 0 (0.0%) | 0 (0.0%) |
| 20 to 24 Year Olds | 0 (0.0%) | 0 (0.0%) |
| 25 to 34 Year Olds | 0 (0.0%) | 0 (0.0%) |
| 35 Years and over | 0 (0.0%) | 0 (0.0%) |
| Total | 5 (100.0%) | 0 (0.0%) |
Educational Attainment by Field of Study in Cooke City
Bio, nature & agricultural (12 | 44.4%), arts & humanities (6 | 22.2%), engineering (3 | 11.1%), physical & health sciences (2 | 7.4%), and education (2 | 7.4%) are the most common fields of study among 27 individuals in Cooke City who have obtained a bachelor's degree or higher.
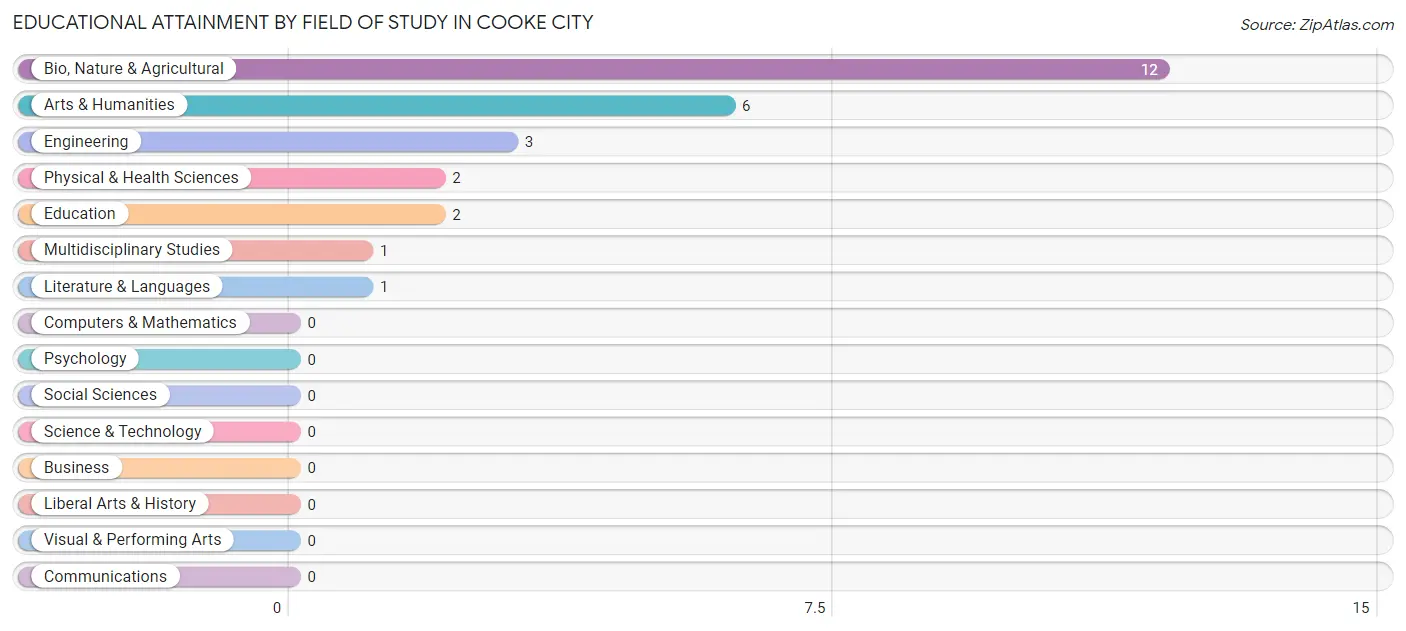
| Field of Study | # Graduates | % Graduates |
| Computers & Mathematics | 0 | 0.0% |
| Bio, Nature & Agricultural | 12 | 44.4% |
| Physical & Health Sciences | 2 | 7.4% |
| Psychology | 0 | 0.0% |
| Social Sciences | 0 | 0.0% |
| Engineering | 3 | 11.1% |
| Multidisciplinary Studies | 1 | 3.7% |
| Science & Technology | 0 | 0.0% |
| Business | 0 | 0.0% |
| Education | 2 | 7.4% |
| Literature & Languages | 1 | 3.7% |
| Liberal Arts & History | 0 | 0.0% |
| Visual & Performing Arts | 0 | 0.0% |
| Communications | 0 | 0.0% |
| Arts & Humanities | 6 | 22.2% |
| Total | 27 | 100.0% |
Transportation & Commute in Cooke City
Vehicle Availability by Sex in Cooke City
The most prevalent vehicle ownership categories in Cooke City are males with 2 vehicles (12, accounting for 66.7%) and females with 2 vehicles (11, making up 66.7%).
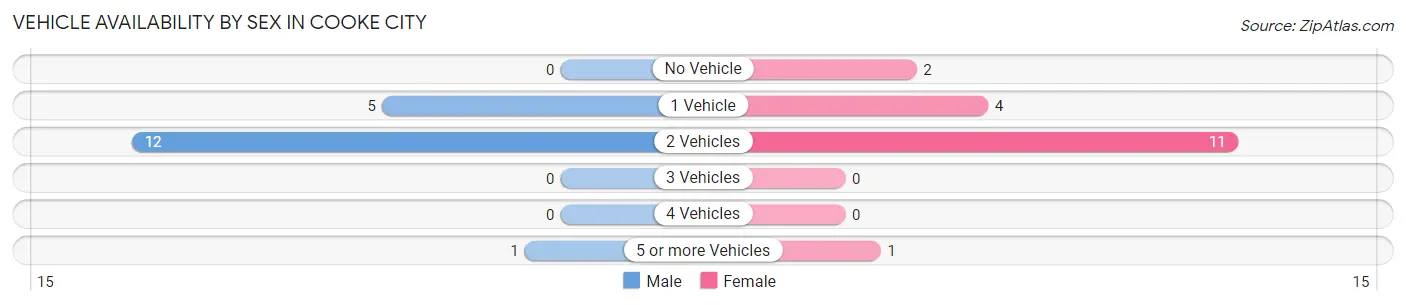
| Vehicles Available | Male | Female |
| No Vehicle | 0 (0.0%) | 2 (11.1%) |
| 1 Vehicle | 5 (27.8%) | 4 (22.2%) |
| 2 Vehicles | 12 (66.7%) | 11 (61.1%) |
| 3 Vehicles | 0 (0.0%) | 0 (0.0%) |
| 4 Vehicles | 0 (0.0%) | 0 (0.0%) |
| 5 or more Vehicles | 1 (5.6%) | 1 (5.6%) |
| Total | 18 (100.0%) | 18 (100.0%) |
Commute Time in Cooke City
The most frequently occuring commute durations in Cooke City are less than 5 minutes (22 commuters, 66.7%), 5 to 9 minutes (7 commuters, 21.2%), and 15 to 19 minutes (4 commuters, 12.1%).
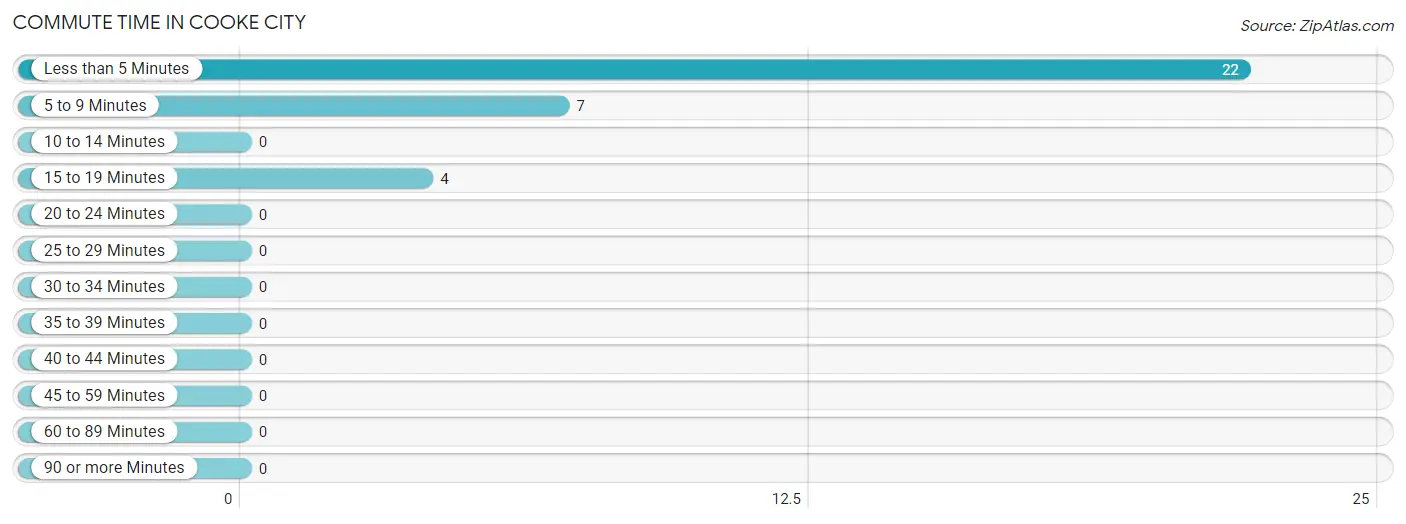
| Commute Time | # Commuters | % Commuters |
| Less than 5 Minutes | 22 | 66.7% |
| 5 to 9 Minutes | 7 | 21.2% |
| 10 to 14 Minutes | 0 | 0.0% |
| 15 to 19 Minutes | 4 | 12.1% |
| 20 to 24 Minutes | 0 | 0.0% |
| 25 to 29 Minutes | 0 | 0.0% |
| 30 to 34 Minutes | 0 | 0.0% |
| 35 to 39 Minutes | 0 | 0.0% |
| 40 to 44 Minutes | 0 | 0.0% |
| 45 to 59 Minutes | 0 | 0.0% |
| 60 to 89 Minutes | 0 | 0.0% |
| 90 or more Minutes | 0 | 0.0% |
Commute Time by Sex in Cooke City
The most common commute times in Cooke City are less than 5 minutes (11 commuters, 61.1%) for males and less than 5 minutes (11 commuters, 73.3%) for females.
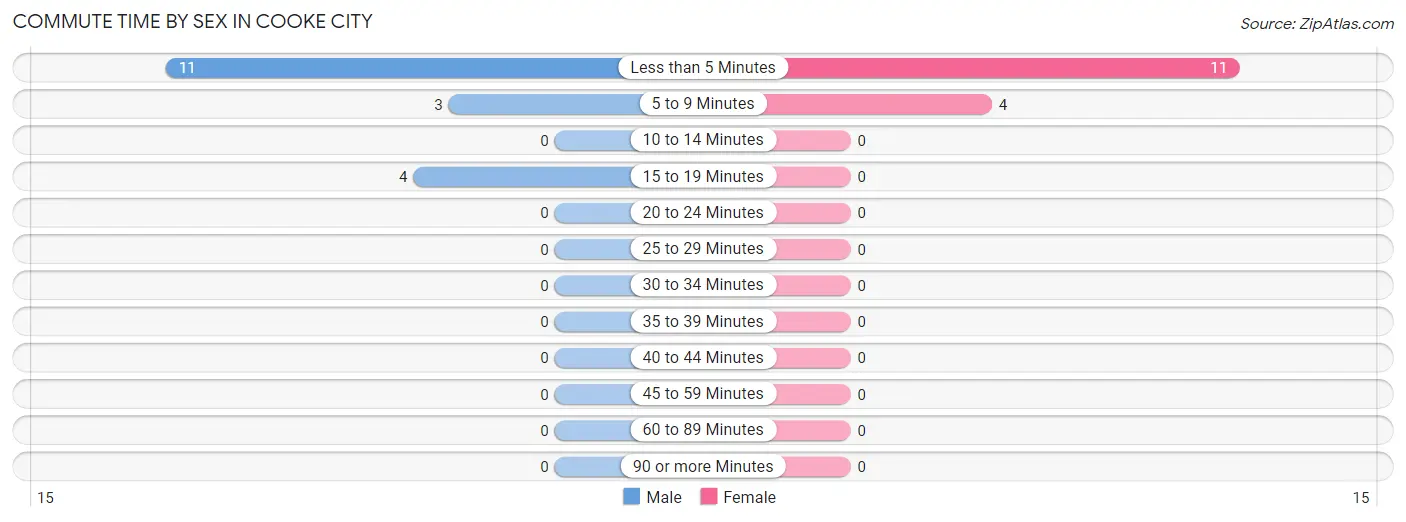
| Commute Time | Male | Female |
| Less than 5 Minutes | 11 (61.1%) | 11 (73.3%) |
| 5 to 9 Minutes | 3 (16.7%) | 4 (26.7%) |
| 10 to 14 Minutes | 0 (0.0%) | 0 (0.0%) |
| 15 to 19 Minutes | 4 (22.2%) | 0 (0.0%) |
| 20 to 24 Minutes | 0 (0.0%) | 0 (0.0%) |
| 25 to 29 Minutes | 0 (0.0%) | 0 (0.0%) |
| 30 to 34 Minutes | 0 (0.0%) | 0 (0.0%) |
| 35 to 39 Minutes | 0 (0.0%) | 0 (0.0%) |
| 40 to 44 Minutes | 0 (0.0%) | 0 (0.0%) |
| 45 to 59 Minutes | 0 (0.0%) | 0 (0.0%) |
| 60 to 89 Minutes | 0 (0.0%) | 0 (0.0%) |
| 90 or more Minutes | 0 (0.0%) | 0 (0.0%) |
Time of Departure to Work by Sex in Cooke City
The most frequent times of departure to work in Cooke City are 8:00 AM to 8:29 AM (6, 33.3%) for males and 7:30 AM to 7:59 AM (7, 46.7%) for females.
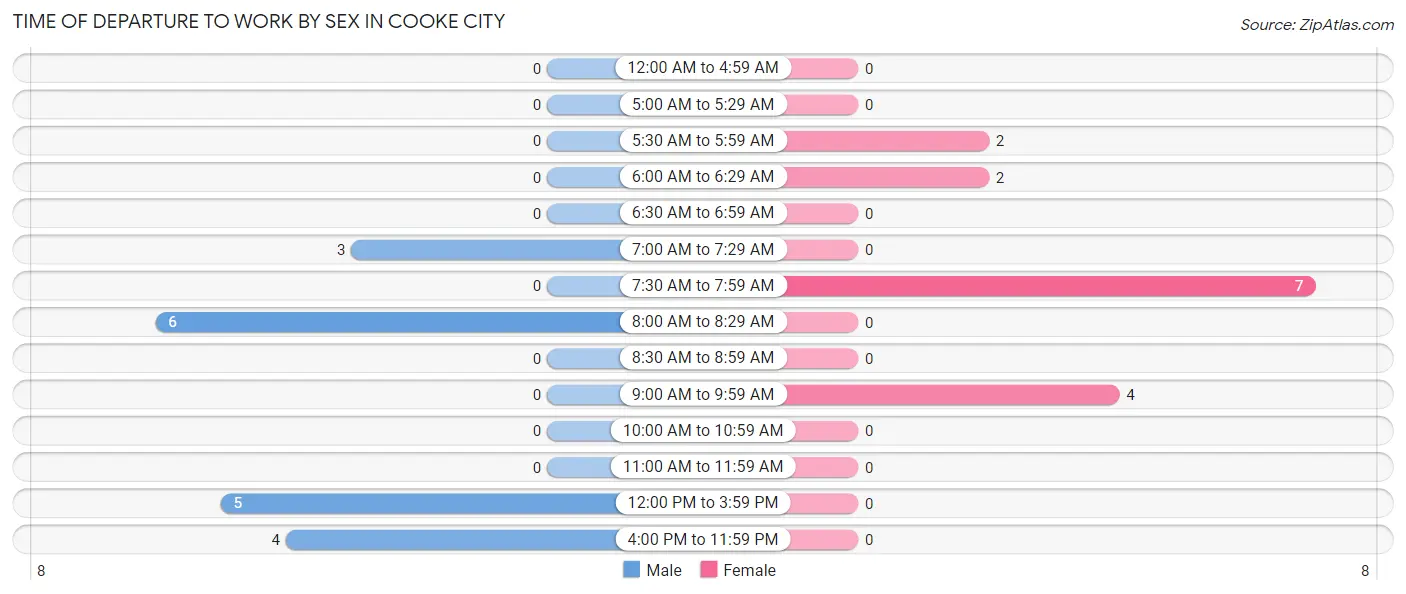
| Time of Departure | Male | Female |
| 12:00 AM to 4:59 AM | 0 (0.0%) | 0 (0.0%) |
| 5:00 AM to 5:29 AM | 0 (0.0%) | 0 (0.0%) |
| 5:30 AM to 5:59 AM | 0 (0.0%) | 2 (13.3%) |
| 6:00 AM to 6:29 AM | 0 (0.0%) | 2 (13.3%) |
| 6:30 AM to 6:59 AM | 0 (0.0%) | 0 (0.0%) |
| 7:00 AM to 7:29 AM | 3 (16.7%) | 0 (0.0%) |
| 7:30 AM to 7:59 AM | 0 (0.0%) | 7 (46.7%) |
| 8:00 AM to 8:29 AM | 6 (33.3%) | 0 (0.0%) |
| 8:30 AM to 8:59 AM | 0 (0.0%) | 0 (0.0%) |
| 9:00 AM to 9:59 AM | 0 (0.0%) | 4 (26.7%) |
| 10:00 AM to 10:59 AM | 0 (0.0%) | 0 (0.0%) |
| 11:00 AM to 11:59 AM | 0 (0.0%) | 0 (0.0%) |
| 12:00 PM to 3:59 PM | 5 (27.8%) | 0 (0.0%) |
| 4:00 PM to 11:59 PM | 4 (22.2%) | 0 (0.0%) |
| Total | 18 (100.0%) | 15 (100.0%) |
Housing Occupancy in Cooke City
Occupancy by Ownership in Cooke City
Of the total 45 dwellings in Cooke City, owner-occupied units account for 27 (60.0%), while renter-occupied units make up 18 (40.0%).
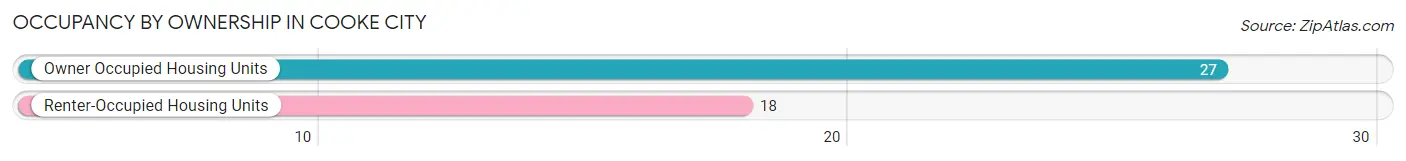
| Occupancy | # Housing Units | % Housing Units |
| Owner Occupied Housing Units | 27 | 60.0% |
| Renter-Occupied Housing Units | 18 | 40.0% |
| Total Occupied Housing Units | 45 | 100.0% |
Occupancy by Household Size in Cooke City
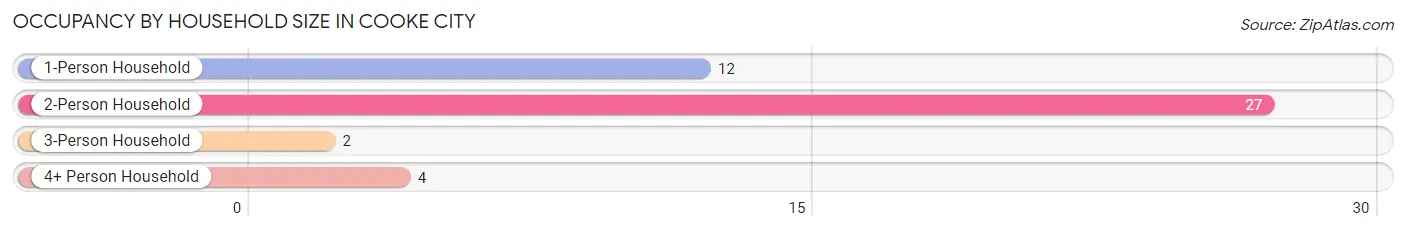
| Household Size | # Housing Units | % Housing Units |
| 1-Person Household | 12 | 26.7% |
| 2-Person Household | 27 | 60.0% |
| 3-Person Household | 2 | 4.4% |
| 4+ Person Household | 4 | 8.9% |
| Total Housing Units | 45 | 100.0% |
Occupancy by Ownership by Household Size in Cooke City
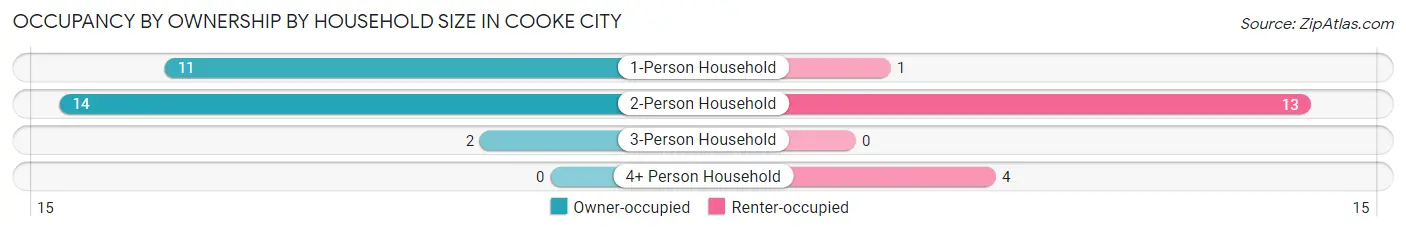
| Household Size | Owner-occupied | Renter-occupied |
| 1-Person Household | 11 (91.7%) | 1 (8.3%) |
| 2-Person Household | 14 (51.8%) | 13 (48.1%) |
| 3-Person Household | 2 (100.0%) | 0 (0.0%) |
| 4+ Person Household | 0 (0.0%) | 4 (100.0%) |
| Total Housing Units | 27 (60.0%) | 18 (40.0%) |
Occupancy by Educational Attainment in Cooke City
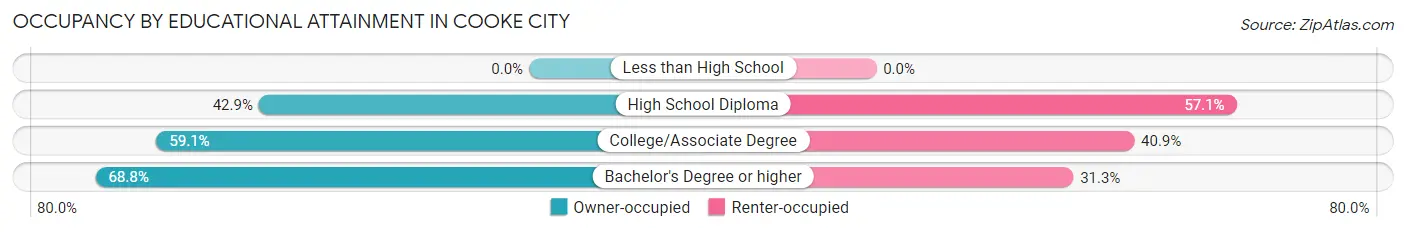
| Household Size | Owner-occupied | Renter-occupied |
| Less than High School | 0 (0.0%) | 0 (0.0%) |
| High School Diploma | 3 (42.9%) | 4 (57.1%) |
| College/Associate Degree | 13 (59.1%) | 9 (40.9%) |
| Bachelor's Degree or higher | 11 (68.8%) | 5 (31.2%) |
Occupancy by Age of Householder in Cooke City
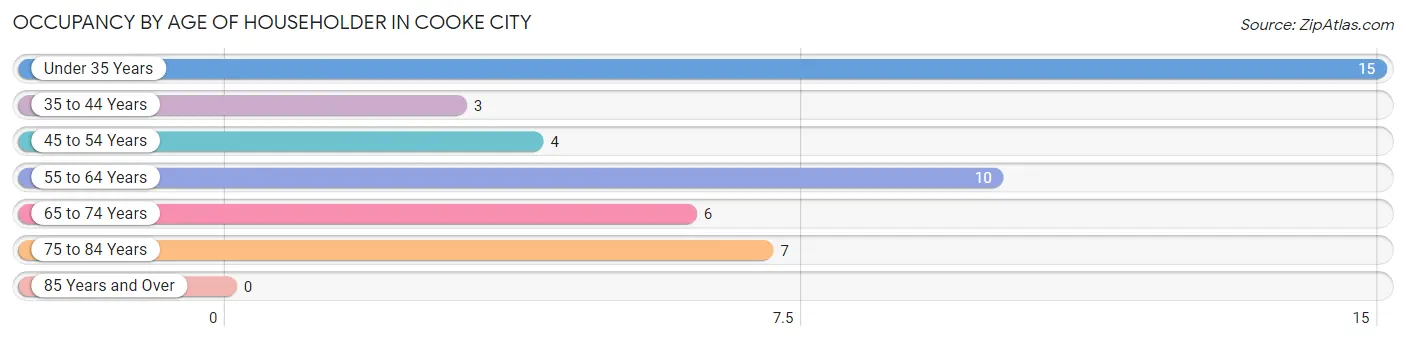
| Age Bracket | # Households | % Households |
| Under 35 Years | 15 | 33.3% |
| 35 to 44 Years | 3 | 6.7% |
| 45 to 54 Years | 4 | 8.9% |
| 55 to 64 Years | 10 | 22.2% |
| 65 to 74 Years | 6 | 13.3% |
| 75 to 84 Years | 7 | 15.6% |
| 85 Years and Over | 0 | 0.0% |
| Total | 45 | 100.0% |
Housing Finances in Cooke City
Median Income by Occupancy in Cooke City
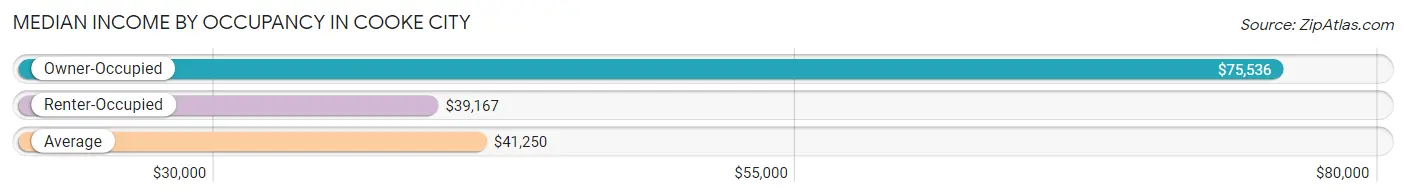
| Occupancy Type | # Households | Median Income |
| Owner-Occupied | 27 (60.0%) | $75,536 |
| Renter-Occupied | 18 (40.0%) | $39,167 |
| Average | 45 (100.0%) | $41,250 |
Occupancy by Householder Income Bracket in Cooke City
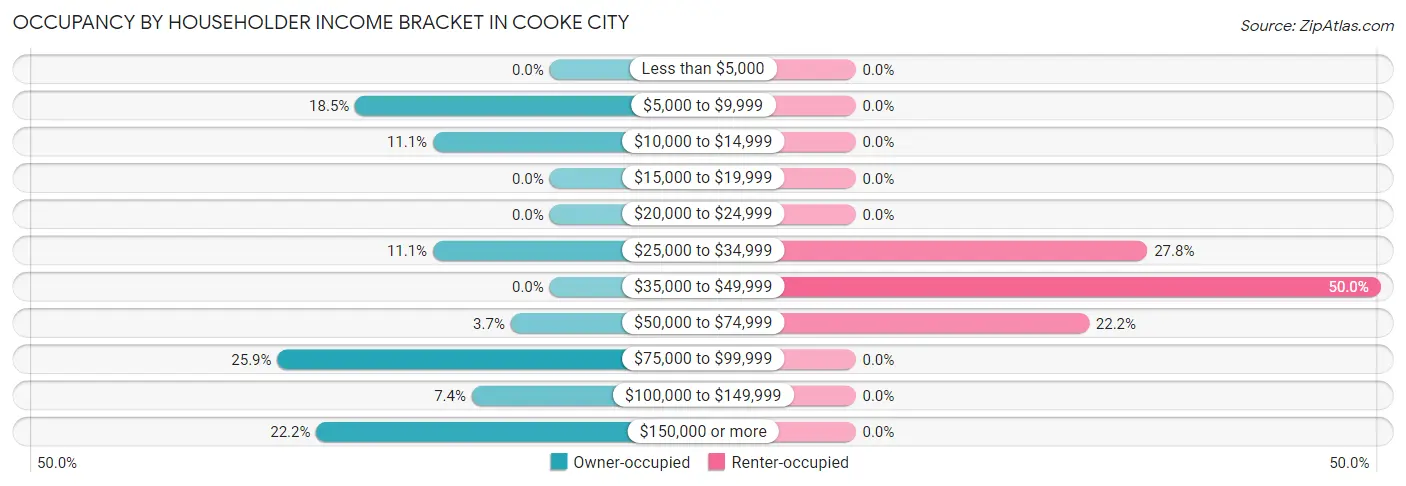
| Income Bracket | Owner-occupied | Renter-occupied |
| Less than $5,000 | 0 (0.0%) | 0 (0.0%) |
| $5,000 to $9,999 | 5 (18.5%) | 0 (0.0%) |
| $10,000 to $14,999 | 3 (11.1%) | 0 (0.0%) |
| $15,000 to $19,999 | 0 (0.0%) | 0 (0.0%) |
| $20,000 to $24,999 | 0 (0.0%) | 0 (0.0%) |
| $25,000 to $34,999 | 3 (11.1%) | 5 (27.8%) |
| $35,000 to $49,999 | 0 (0.0%) | 9 (50.0%) |
| $50,000 to $74,999 | 1 (3.7%) | 4 (22.2%) |
| $75,000 to $99,999 | 7 (25.9%) | 0 (0.0%) |
| $100,000 to $149,999 | 2 (7.4%) | 0 (0.0%) |
| $150,000 or more | 6 (22.2%) | 0 (0.0%) |
| Total | 27 (100.0%) | 18 (100.0%) |
Monthly Housing Cost Tiers in Cooke City
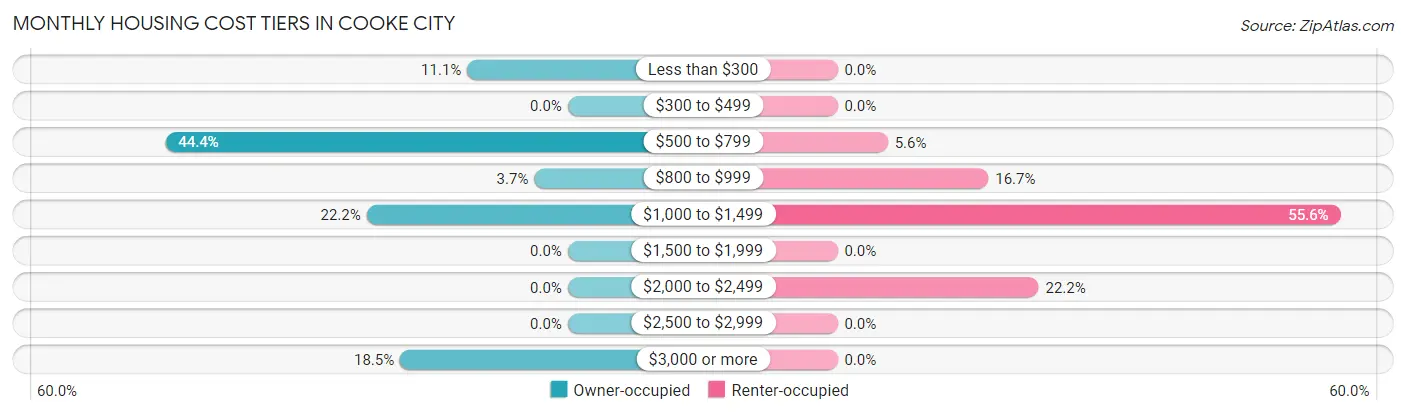
| Monthly Cost | Owner-occupied | Renter-occupied |
| Less than $300 | 3 (11.1%) | 0 (0.0%) |
| $300 to $499 | 0 (0.0%) | 0 (0.0%) |
| $500 to $799 | 12 (44.4%) | 1 (5.6%) |
| $800 to $999 | 1 (3.7%) | 3 (16.7%) |
| $1,000 to $1,499 | 6 (22.2%) | 10 (55.6%) |
| $1,500 to $1,999 | 0 (0.0%) | 0 (0.0%) |
| $2,000 to $2,499 | 0 (0.0%) | 4 (22.2%) |
| $2,500 to $2,999 | 0 (0.0%) | 0 (0.0%) |
| $3,000 or more | 5 (18.5%) | 0 (0.0%) |
| Total | 27 (100.0%) | 18 (100.0%) |
Physical Housing Characteristics in Cooke City
Housing Structures in Cooke City
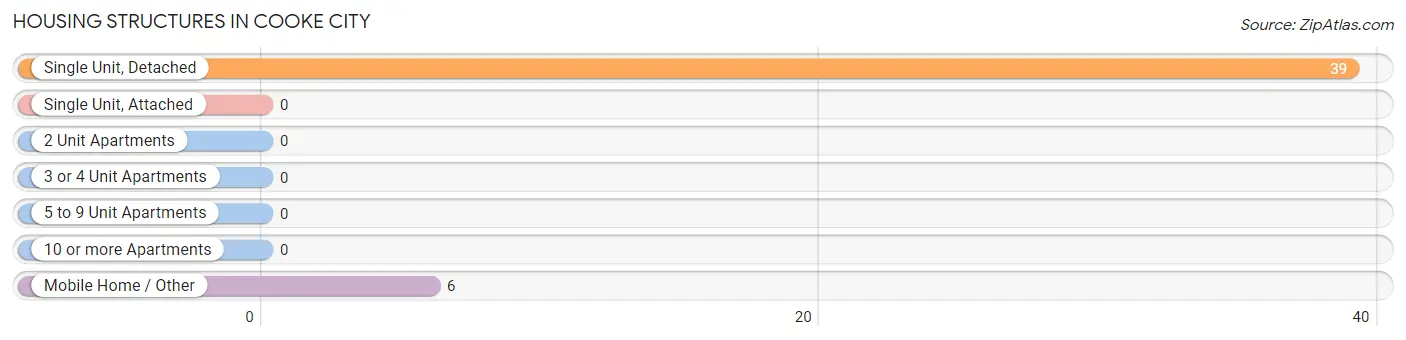
| Structure Type | # Housing Units | % Housing Units |
| Single Unit, Detached | 39 | 86.7% |
| Single Unit, Attached | 0 | 0.0% |
| 2 Unit Apartments | 0 | 0.0% |
| 3 or 4 Unit Apartments | 0 | 0.0% |
| 5 to 9 Unit Apartments | 0 | 0.0% |
| 10 or more Apartments | 0 | 0.0% |
| Mobile Home / Other | 6 | 13.3% |
| Total | 45 | 100.0% |
Housing Structures by Occupancy in Cooke City
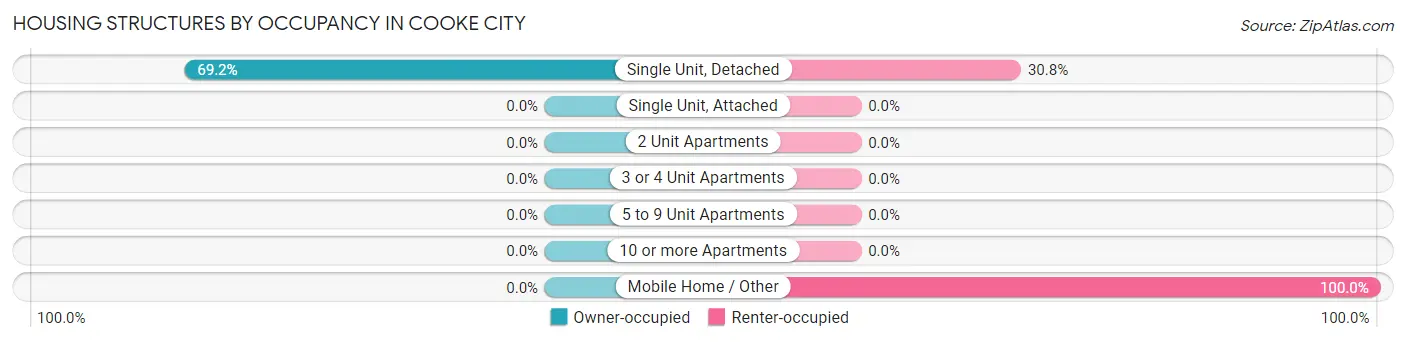
| Structure Type | Owner-occupied | Renter-occupied |
| Single Unit, Detached | 27 (69.2%) | 12 (30.8%) |
| Single Unit, Attached | 0 (0.0%) | 0 (0.0%) |
| 2 Unit Apartments | 0 (0.0%) | 0 (0.0%) |
| 3 or 4 Unit Apartments | 0 (0.0%) | 0 (0.0%) |
| 5 to 9 Unit Apartments | 0 (0.0%) | 0 (0.0%) |
| 10 or more Apartments | 0 (0.0%) | 0 (0.0%) |
| Mobile Home / Other | 0 (0.0%) | 6 (100.0%) |
| Total | 27 (60.0%) | 18 (40.0%) |
Housing Structures by Number of Rooms in Cooke City
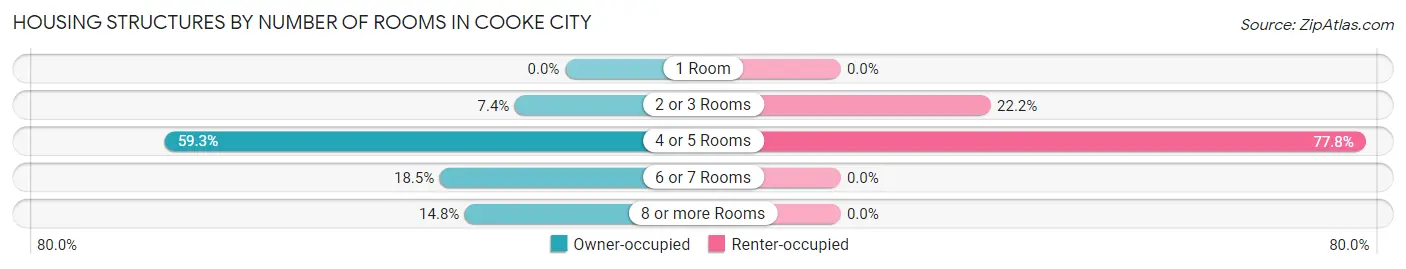
| Number of Rooms | Owner-occupied | Renter-occupied |
| 1 Room | 0 (0.0%) | 0 (0.0%) |
| 2 or 3 Rooms | 2 (7.4%) | 4 (22.2%) |
| 4 or 5 Rooms | 16 (59.3%) | 14 (77.8%) |
| 6 or 7 Rooms | 5 (18.5%) | 0 (0.0%) |
| 8 or more Rooms | 4 (14.8%) | 0 (0.0%) |
| Total | 27 (100.0%) | 18 (100.0%) |
Housing Structure by Heating Type in Cooke City
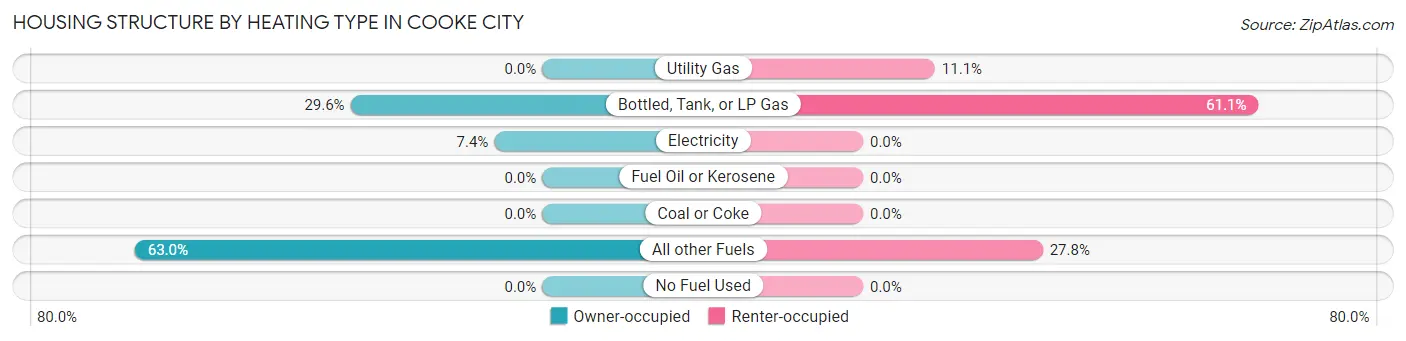
| Heating Type | Owner-occupied | Renter-occupied |
| Utility Gas | 0 (0.0%) | 2 (11.1%) |
| Bottled, Tank, or LP Gas | 8 (29.6%) | 11 (61.1%) |
| Electricity | 2 (7.4%) | 0 (0.0%) |
| Fuel Oil or Kerosene | 0 (0.0%) | 0 (0.0%) |
| Coal or Coke | 0 (0.0%) | 0 (0.0%) |
| All other Fuels | 17 (63.0%) | 5 (27.8%) |
| No Fuel Used | 0 (0.0%) | 0 (0.0%) |
| Total | 27 (100.0%) | 18 (100.0%) |
Household Vehicle Usage in Cooke City
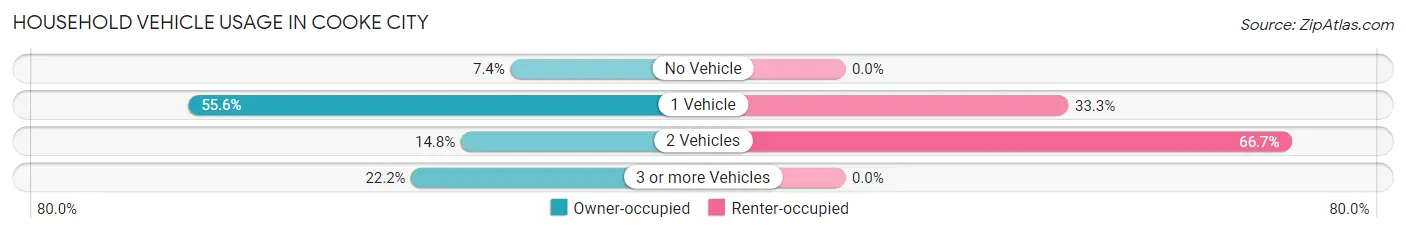
| Vehicles per Household | Owner-occupied | Renter-occupied |
| No Vehicle | 2 (7.4%) | 0 (0.0%) |
| 1 Vehicle | 15 (55.6%) | 6 (33.3%) |
| 2 Vehicles | 4 (14.8%) | 12 (66.7%) |
| 3 or more Vehicles | 6 (22.2%) | 0 (0.0%) |
| Total | 27 (100.0%) | 18 (100.0%) |
Real Estate & Mortgages in Cooke City
Real Estate and Mortgage Overview in Cooke City
| Characteristic | Without Mortgage | With Mortgage |
| Housing Units | 22 | 5 |
| Median Property Value | $366,700 | $0 |
| Median Household Income | $75,714 | $2 |
| Monthly Housing Costs | $650 | $5 |
| Real Estate Taxes | $2,357 | $0 |
Property Value by Mortgage Status in Cooke City
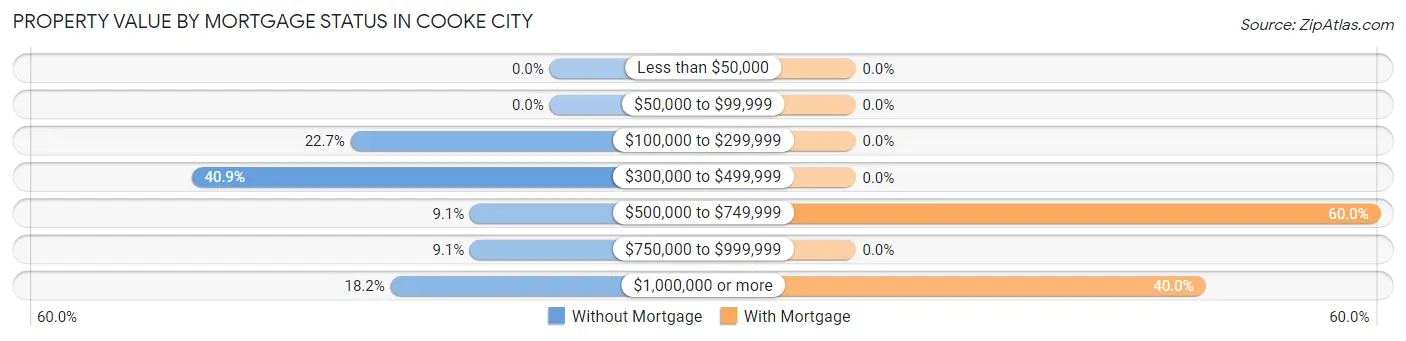
| Property Value | Without Mortgage | With Mortgage |
| Less than $50,000 | 0 (0.0%) | 0 (0.0%) |
| $50,000 to $99,999 | 0 (0.0%) | 0 (0.0%) |
| $100,000 to $299,999 | 5 (22.7%) | 0 (0.0%) |
| $300,000 to $499,999 | 9 (40.9%) | 0 (0.0%) |
| $500,000 to $749,999 | 2 (9.1%) | 3 (60.0%) |
| $750,000 to $999,999 | 2 (9.1%) | 0 (0.0%) |
| $1,000,000 or more | 4 (18.2%) | 2 (40.0%) |
| Total | 22 (100.0%) | 5 (100.0%) |
Household Income by Mortgage Status in Cooke City
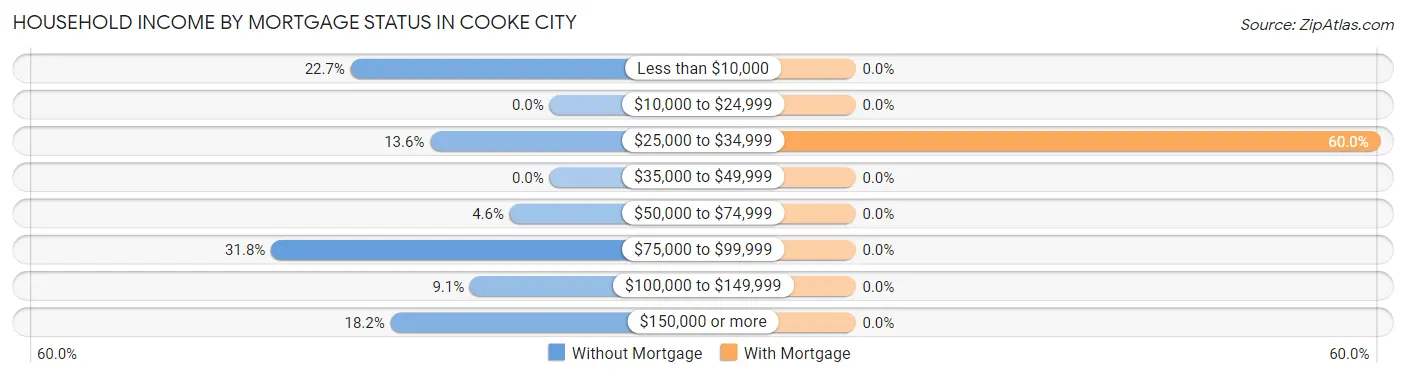
| Household Income | Without Mortgage | With Mortgage |
| Less than $10,000 | 5 (22.7%) | 0 (0.0%) |
| $10,000 to $24,999 | 0 (0.0%) | 0 (0.0%) |
| $25,000 to $34,999 | 3 (13.6%) | 3 (60.0%) |
| $35,000 to $49,999 | 0 (0.0%) | 0 (0.0%) |
| $50,000 to $74,999 | 1 (4.5%) | 0 (0.0%) |
| $75,000 to $99,999 | 7 (31.8%) | 0 (0.0%) |
| $100,000 to $149,999 | 2 (9.1%) | 0 (0.0%) |
| $150,000 or more | 4 (18.2%) | 0 (0.0%) |
| Total | 22 (100.0%) | 5 (100.0%) |
Property Value to Household Income Ratio in Cooke City
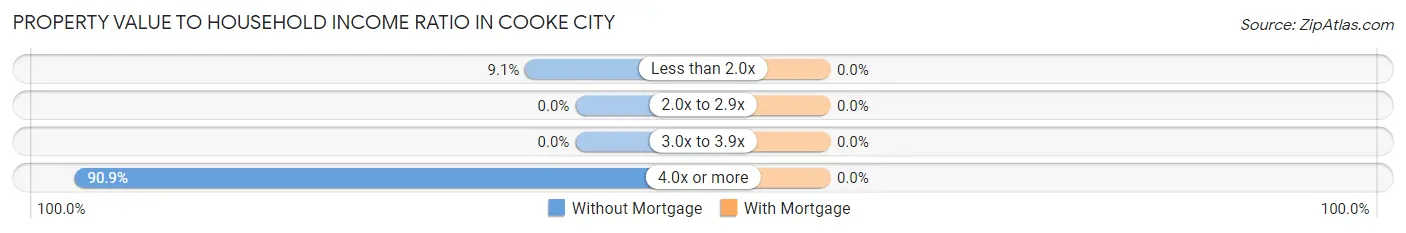
| Value-to-Income Ratio | Without Mortgage | With Mortgage |
| Less than 2.0x | 2 (9.1%) | 0 (0.0%) |
| 2.0x to 2.9x | 0 (0.0%) | 0 (0.0%) |
| 3.0x to 3.9x | 0 (0.0%) | 0 (0.0%) |
| 4.0x or more | 20 (90.9%) | 0 (0.0%) |
| Total | 22 (100.0%) | 5 (100.0%) |
Real Estate Taxes by Mortgage Status in Cooke City
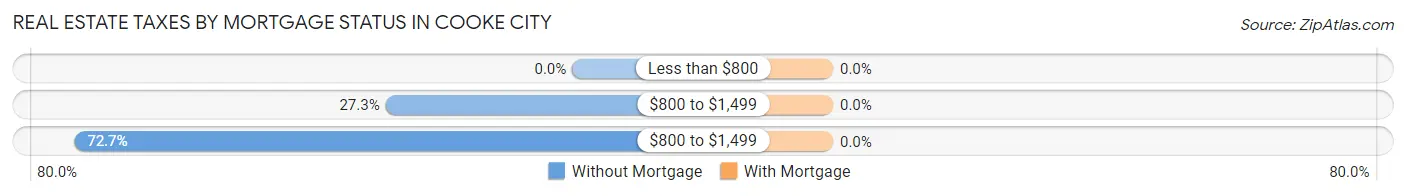
| Property Taxes | Without Mortgage | With Mortgage |
| Less than $800 | 0 (0.0%) | 0 (0.0%) |
| $800 to $1,499 | 6 (27.3%) | 0 (0.0%) |
| $800 to $1,499 | 16 (72.7%) | 0 (0.0%) |
| Total | 22 (100.0%) | 5 (100.0%) |
Health & Disability in Cooke City
Health Insurance Coverage by Age in Cooke City
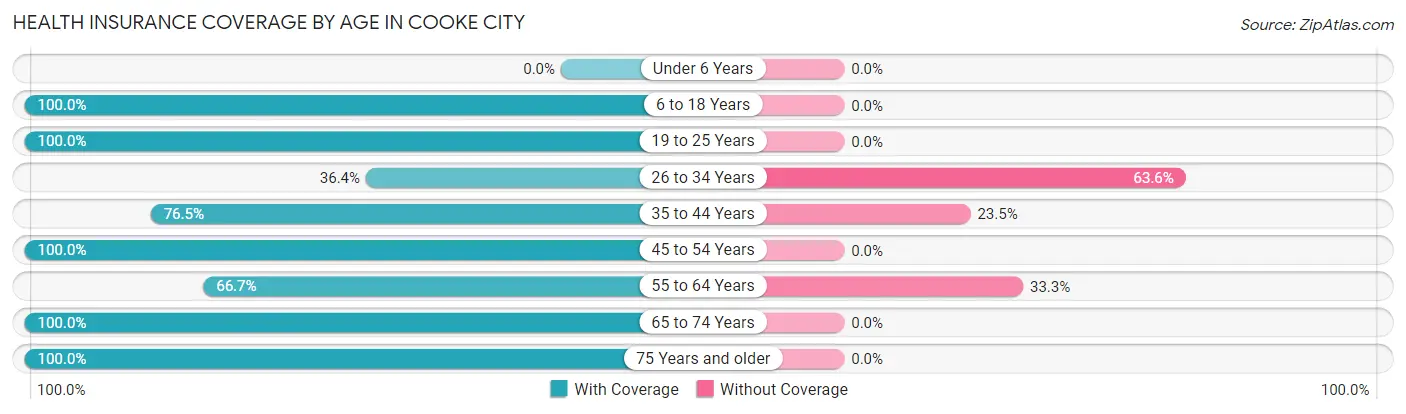
| Age Bracket | With Coverage | Without Coverage |
| Under 6 Years | 0 (0.0%) | 0 (0.0%) |
| 6 to 18 Years | 5 (100.0%) | 0 (0.0%) |
| 19 to 25 Years | 8 (100.0%) | 0 (0.0%) |
| 26 to 34 Years | 4 (36.4%) | 7 (63.6%) |
| 35 to 44 Years | 13 (76.5%) | 4 (23.5%) |
| 45 to 54 Years | 8 (100.0%) | 0 (0.0%) |
| 55 to 64 Years | 8 (66.7%) | 4 (33.3%) |
| 65 to 74 Years | 13 (100.0%) | 0 (0.0%) |
| 75 Years and older | 9 (100.0%) | 0 (0.0%) |
| Total | 68 (81.9%) | 15 (18.1%) |
Health Insurance Coverage by Citizenship Status in Cooke City
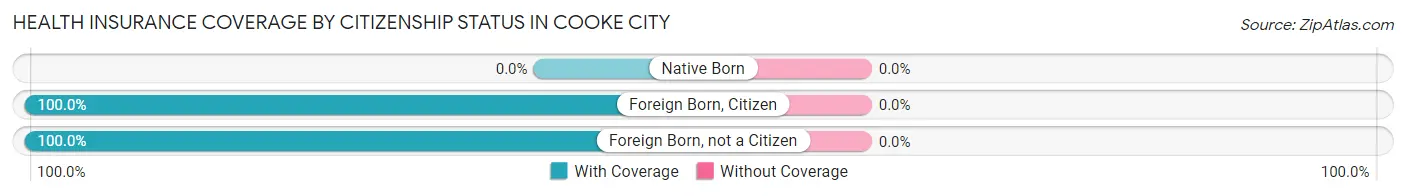
| Citizenship Status | With Coverage | Without Coverage |
| Native Born | 0 (0.0%) | 0 (0.0%) |
| Foreign Born, Citizen | 5 (100.0%) | 0 (0.0%) |
| Foreign Born, not a Citizen | 8 (100.0%) | 0 (0.0%) |
Health Insurance Coverage by Household Income in Cooke City
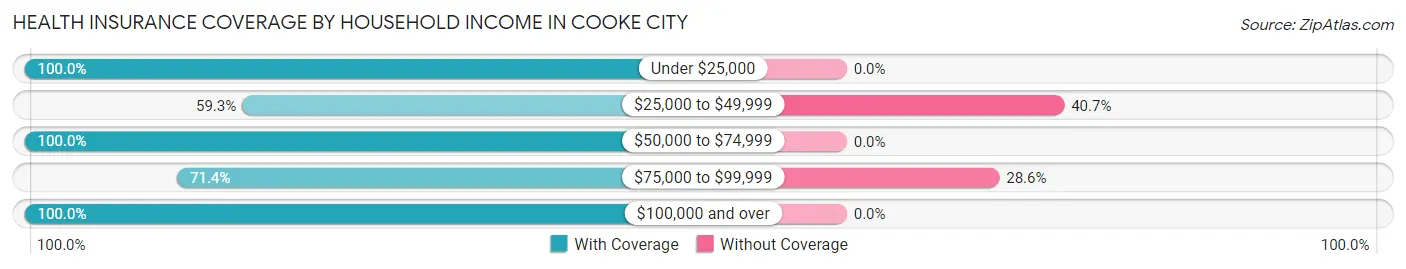
| Household Income | With Coverage | Without Coverage |
| Under $25,000 | 8 (100.0%) | 0 (0.0%) |
| $25,000 to $49,999 | 16 (59.3%) | 11 (40.7%) |
| $50,000 to $74,999 | 17 (100.0%) | 0 (0.0%) |
| $75,000 to $99,999 | 10 (71.4%) | 4 (28.6%) |
| $100,000 and over | 17 (100.0%) | 0 (0.0%) |
Public vs Private Health Insurance Coverage by Age in Cooke City
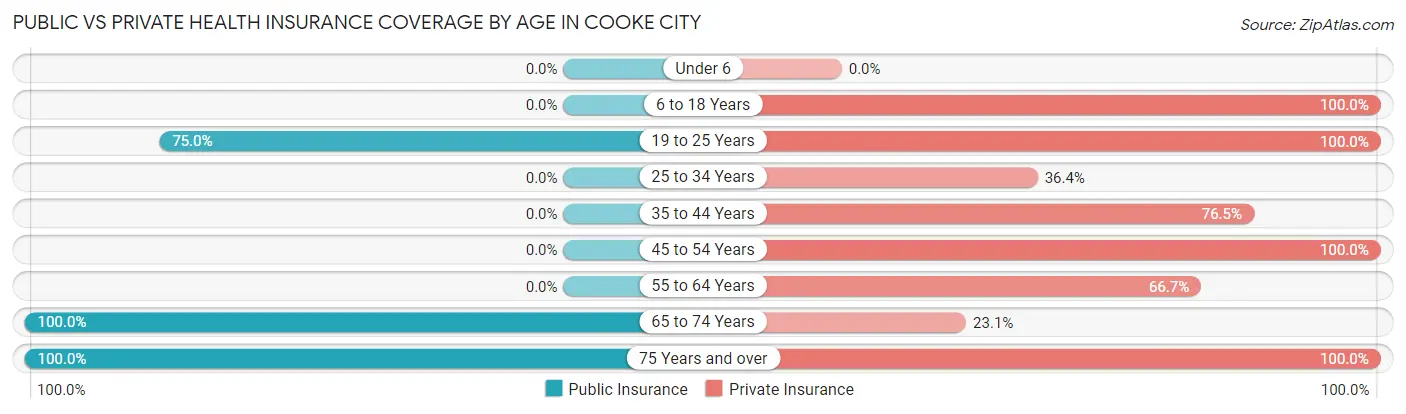
| Age Bracket | Public Insurance | Private Insurance |
| Under 6 | 0 (0.0%) | 0 (0.0%) |
| 6 to 18 Years | 0 (0.0%) | 5 (100.0%) |
| 19 to 25 Years | 6 (75.0%) | 8 (100.0%) |
| 25 to 34 Years | 0 (0.0%) | 4 (36.4%) |
| 35 to 44 Years | 0 (0.0%) | 13 (76.5%) |
| 45 to 54 Years | 0 (0.0%) | 8 (100.0%) |
| 55 to 64 Years | 0 (0.0%) | 8 (66.7%) |
| 65 to 74 Years | 13 (100.0%) | 3 (23.1%) |
| 75 Years and over | 9 (100.0%) | 9 (100.0%) |
| Total | 28 (33.7%) | 58 (69.9%) |
Disability Status by Sex by Age in Cooke City
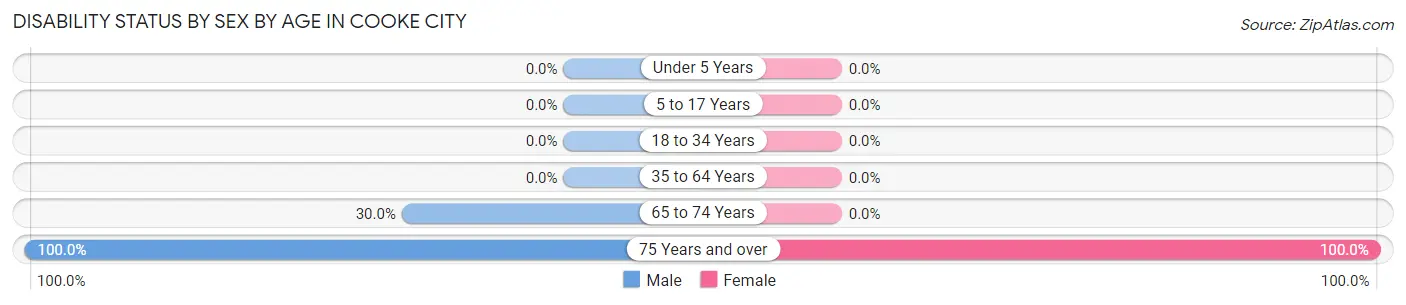
| Age Bracket | Male | Female |
| Under 5 Years | 0 (0.0%) | 0 (0.0%) |
| 5 to 17 Years | 0 (0.0%) | 0 (0.0%) |
| 18 to 34 Years | 0 (0.0%) | 0 (0.0%) |
| 35 to 64 Years | 0 (0.0%) | 0 (0.0%) |
| 65 to 74 Years | 3 (30.0%) | 0 (0.0%) |
| 75 Years and over | 7 (100.0%) | 2 (100.0%) |
Disability Class by Sex by Age in Cooke City
Disability Class: Hearing Difficulty
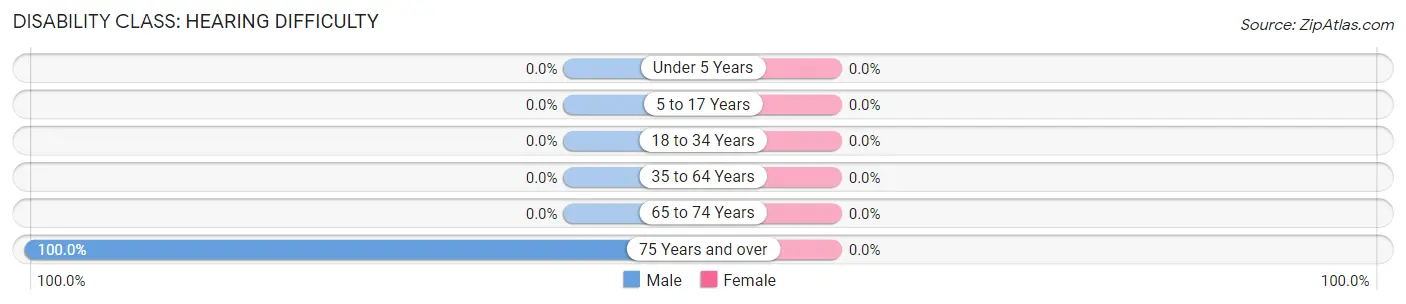
| Age Bracket | Male | Female |
| Under 5 Years | 0 (0.0%) | 0 (0.0%) |
| 5 to 17 Years | 0 (0.0%) | 0 (0.0%) |
| 18 to 34 Years | 0 (0.0%) | 0 (0.0%) |
| 35 to 64 Years | 0 (0.0%) | 0 (0.0%) |
| 65 to 74 Years | 0 (0.0%) | 0 (0.0%) |
| 75 Years and over | 7 (100.0%) | 0 (0.0%) |
Disability Class: Vision Difficulty
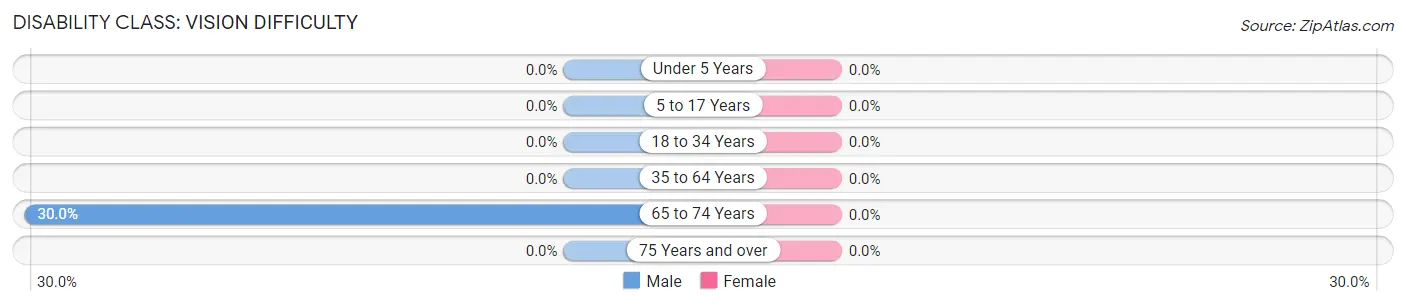
| Age Bracket | Male | Female |
| Under 5 Years | 0 (0.0%) | 0 (0.0%) |
| 5 to 17 Years | 0 (0.0%) | 0 (0.0%) |
| 18 to 34 Years | 0 (0.0%) | 0 (0.0%) |
| 35 to 64 Years | 0 (0.0%) | 0 (0.0%) |
| 65 to 74 Years | 3 (30.0%) | 0 (0.0%) |
| 75 Years and over | 0 (0.0%) | 0 (0.0%) |
Disability Class: Cognitive Difficulty
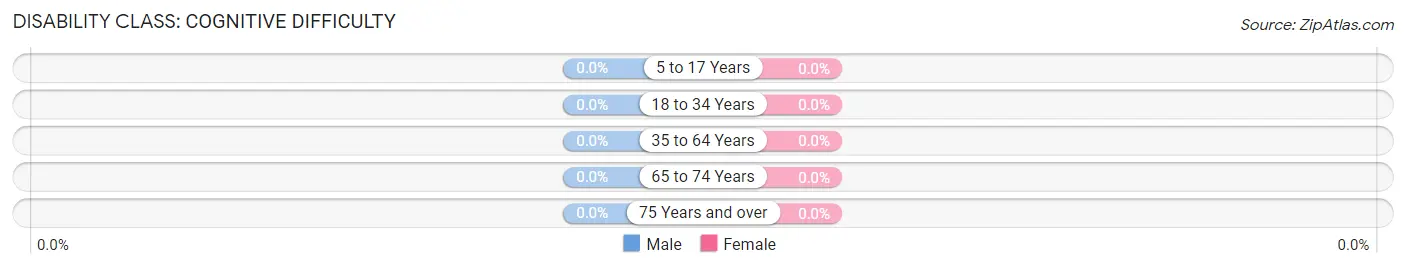
| Age Bracket | Male | Female |
| 5 to 17 Years | 0 (0.0%) | 0 (0.0%) |
| 18 to 34 Years | 0 (0.0%) | 0 (0.0%) |
| 35 to 64 Years | 0 (0.0%) | 0 (0.0%) |
| 65 to 74 Years | 0 (0.0%) | 0 (0.0%) |
| 75 Years and over | 0 (0.0%) | 0 (0.0%) |
Disability Class: Ambulatory Difficulty
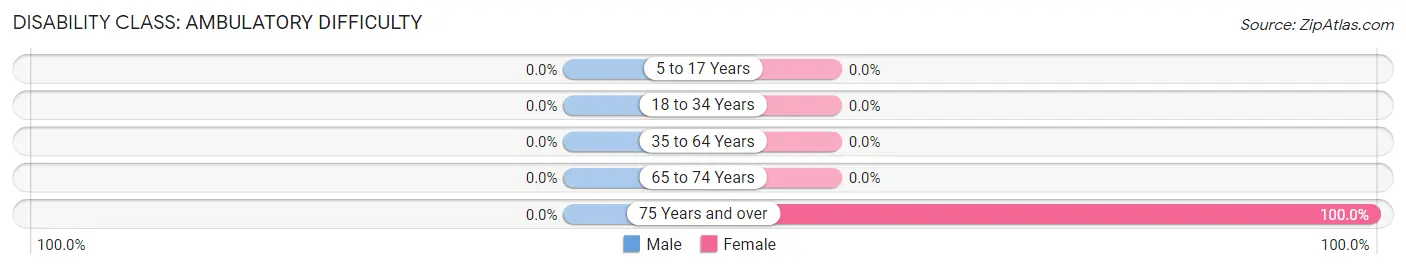
| Age Bracket | Male | Female |
| 5 to 17 Years | 0 (0.0%) | 0 (0.0%) |
| 18 to 34 Years | 0 (0.0%) | 0 (0.0%) |
| 35 to 64 Years | 0 (0.0%) | 0 (0.0%) |
| 65 to 74 Years | 0 (0.0%) | 0 (0.0%) |
| 75 Years and over | 0 (0.0%) | 2 (100.0%) |
Disability Class: Self-Care Difficulty
| Age Bracket | Male | Female |
| 5 to 17 Years | 0 (0.0%) | 0 (0.0%) |
| 18 to 34 Years | 0 (0.0%) | 0 (0.0%) |
| 35 to 64 Years | 0 (0.0%) | 0 (0.0%) |
| 65 to 74 Years | 0 (0.0%) | 0 (0.0%) |
| 75 Years and over | 0 (0.0%) | 0 (0.0%) |
Technology Access in Cooke City
Computing Device Access in Cooke City
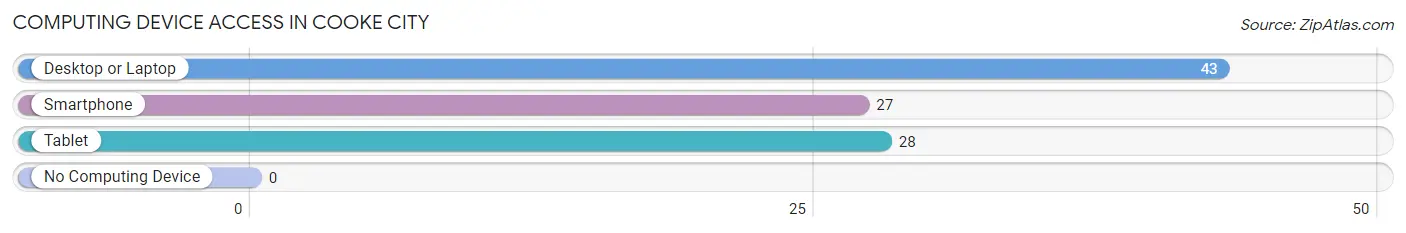
| Device Type | # Households | % Households |
| Desktop or Laptop | 43 | 95.6% |
| Smartphone | 27 | 60.0% |
| Tablet | 28 | 62.2% |
| No Computing Device | 0 | 0.0% |
| Total | 45 | 100.0% |
Internet Access in Cooke City
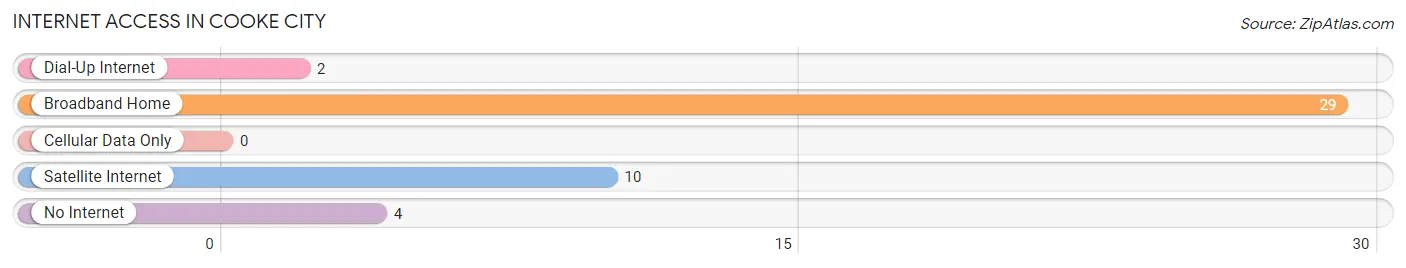
| Internet Type | # Households | % Households |
| Dial-Up Internet | 2 | 4.4% |
| Broadband Home | 29 | 64.4% |
| Cellular Data Only | 0 | 0.0% |
| Satellite Internet | 10 | 22.2% |
| No Internet | 4 | 8.9% |
| Total | 45 | 100.0% |
Cooke City Summary
Cooke City, Montana is a small town located in the Beartooth Mountains of Carbon County, Montana. It is situated at an elevation of 6,890 feet and is surrounded by the Absaroka-Beartooth Wilderness. The town is located on the border of Yellowstone National Park and is a popular tourist destination for those looking to explore the outdoors.
History
Cooke City was founded in 1882 by gold prospectors who were drawn to the area by the promise of riches. The town was named after Jay Cooke, a financier who had invested heavily in the Northern Pacific Railroad. The town quickly grew to become a bustling mining community, with a population of over 1,000 people. The town was home to several saloons, hotels, and stores, as well as a post office and a school.
The town’s fortunes changed in the early 1900s when the gold mines began to run dry. By the 1920s, the population had dwindled to just a few hundred people. The town was nearly abandoned until the 1950s when it was rediscovered by tourists looking to explore the outdoors.
Geography
Cooke City is located in the Beartooth Mountains of Carbon County, Montana. It is situated at an elevation of 6,890 feet and is surrounded by the Absaroka-Beartooth Wilderness. The town is located on the border of Yellowstone National Park and is a popular tourist destination for those looking to explore the outdoors.
The town is located in a valley surrounded by mountains, with the highest peak in the area being Mount Cowen at 11,214 feet. The town is located in a temperate climate, with temperatures ranging from the low 30s in the winter to the high 70s in the summer.
Economy
Cooke City’s economy is largely based on tourism. The town is a popular destination for those looking to explore the outdoors, with activities such as hiking, fishing, and camping. The town is also home to several restaurants, hotels, and stores catering to tourists.
The town is also home to several small businesses, including a gas station, a grocery store, and a hardware store. The town is also home to a post office and a school.
Demographics
As of the 2010 census, the population of Cooke City was 140. The town is predominantly white, with the majority of the population being of German, Irish, and English descent. The median household income is $37,500, and the median age is 44.
Conclusion
Cooke City, Montana is a small town located in the Beartooth Mountains of Carbon County, Montana. It is situated at an elevation of 6,890 feet and is surrounded by the Absaroka-Beartooth Wilderness. The town is located on the border of Yellowstone National Park and is a popular tourist destination for those looking to explore the outdoors. The town’s economy is largely based on tourism, with activities such as hiking, fishing, and camping. The town is predominantly white, with the majority of the population being of German, Irish, and English descent.
Common Questions
What is Per Capita Income in Cooke City?
Per Capita income in Cooke City is $33,986.
What is the Median Family Income in Cooke City?
Median Family Income in Cooke City is $75,536.
What is the Median Household income in Cooke City?
Median Household Income in Cooke City is $41,250.
What is Income or Wage Gap in Cooke City?
Income or Wage Gap in Cooke City is 51.7%.
Women in Cooke City earn 48.3 cents for every dollar earned by a man.
What is Inequality or Gini Index in Cooke City?
Inequality or Gini Index in Cooke City is 0.40.
What is the Total Population of Cooke City?
Total Population of Cooke City is 83.
What is the Total Male Population of Cooke City?
Total Male Population of Cooke City is 43.
What is the Total Female Population of Cooke City?
Total Female Population of Cooke City is 40.
What is the Ratio of Males per 100 Females in Cooke City?
There are 107.50 Males per 100 Females in Cooke City.
What is the Ratio of Females per 100 Males in Cooke City?
There are 93.02 Females per 100 Males in Cooke City.
What is the Median Population Age in Cooke City?
Median Population Age in Cooke City is 46.3 Years.
What is the Average Family Size in Cooke City
Average Family Size in Cooke City is 2.3 People.
What is the Average Household Size in Cooke City
Average Household Size in Cooke City is 1.8 People.
How Large is the Labor Force in Cooke City?
There are 46 People in the Labor Forcein in Cooke City.
What is the Percentage of People in the Labor Force in Cooke City?
59.0% of People are in the Labor Force in Cooke City.