Old Agency, MT Map & Demographics
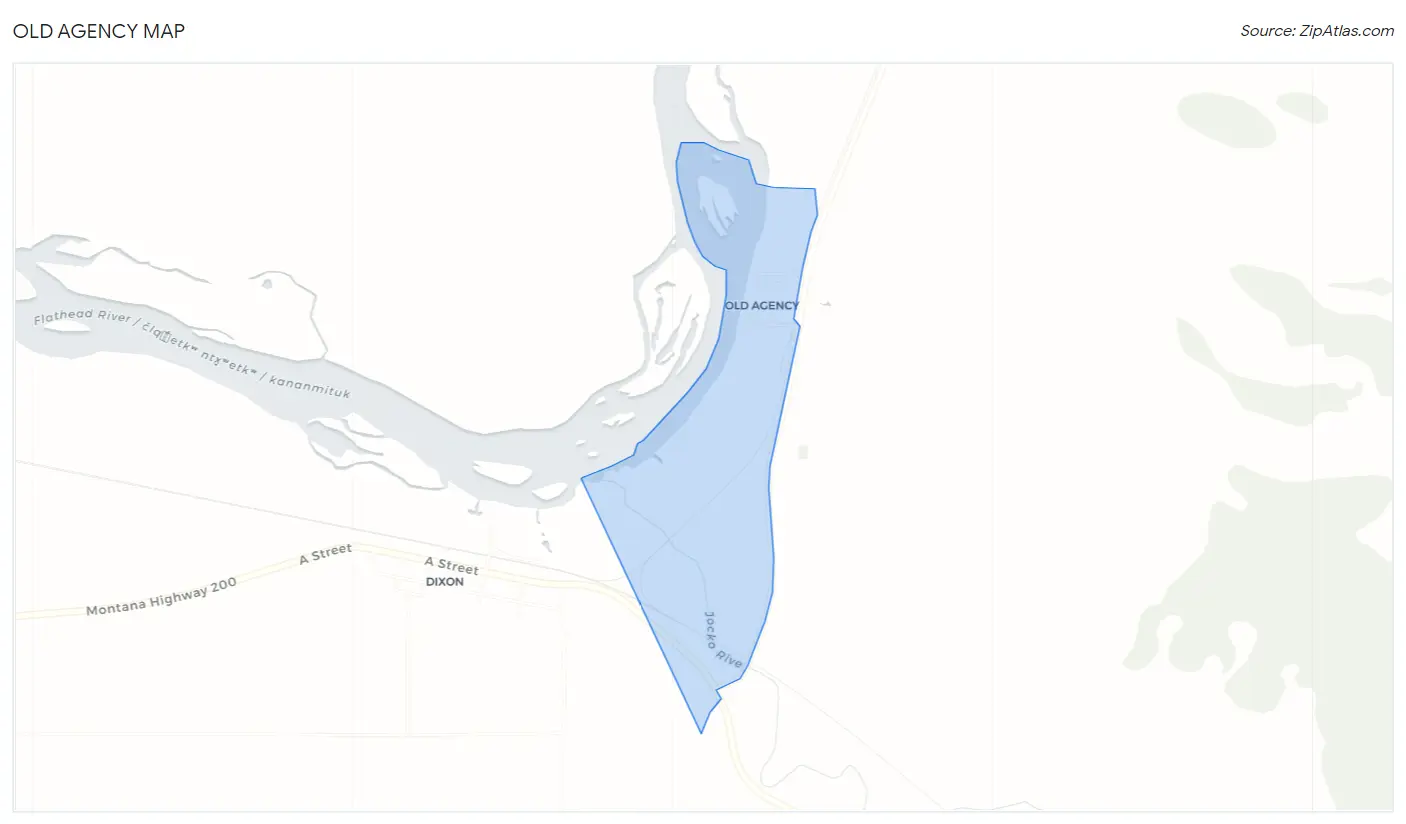
Old Agency Map
Old Agency Overview
$8,022
PER CAPITA INCOME
0.48
INEQUALITY / GINI INDEX
85
TOTAL POPULATION
40
MALE POPULATION
45
FEMALE POPULATION
88.89
MALES / 100 FEMALES
112.50
FEMALES / 100 MALES
18.7
MEDIAN AGE
5.8
AVG FAMILY SIZE
4.2
AVG HOUSEHOLD SIZE
28
LABOR FORCE [ PEOPLE ]
59.6%
PERCENT IN LABOR FORCE
17.9%
UNEMPLOYMENT RATE
Income in Old Agency
Income Overview in Old Agency
| Characteristic | Number | Measure |
| Per Capita Income | 85 | $8,022 |
| Median Family Income | 13 | $0 |
| Mean Family Income | 13 | $44,600 |
| Median Household Income | 20 | $0 |
| Mean Household Income | 20 | $34,750 |
| Income Deficit | 13 | $0 |
| Wage / Income Gap (%) | 85 | 0.00% |
| Wage / Income Gap ($) | 85 | 100.00¢ per $1 |
| Gini / Inequality Index | 85 | 0.48 |
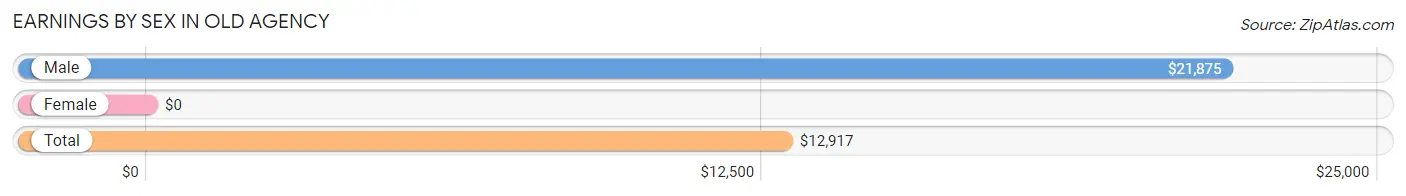
Earnings by Sex in Old Agency
| Sex | Number | Average Earnings |
| Male | 9 (33.3%) | $21,875 |
| Female | 18 (66.7%) | $0 |
| Total | 27 (100.0%) | $12,917 |
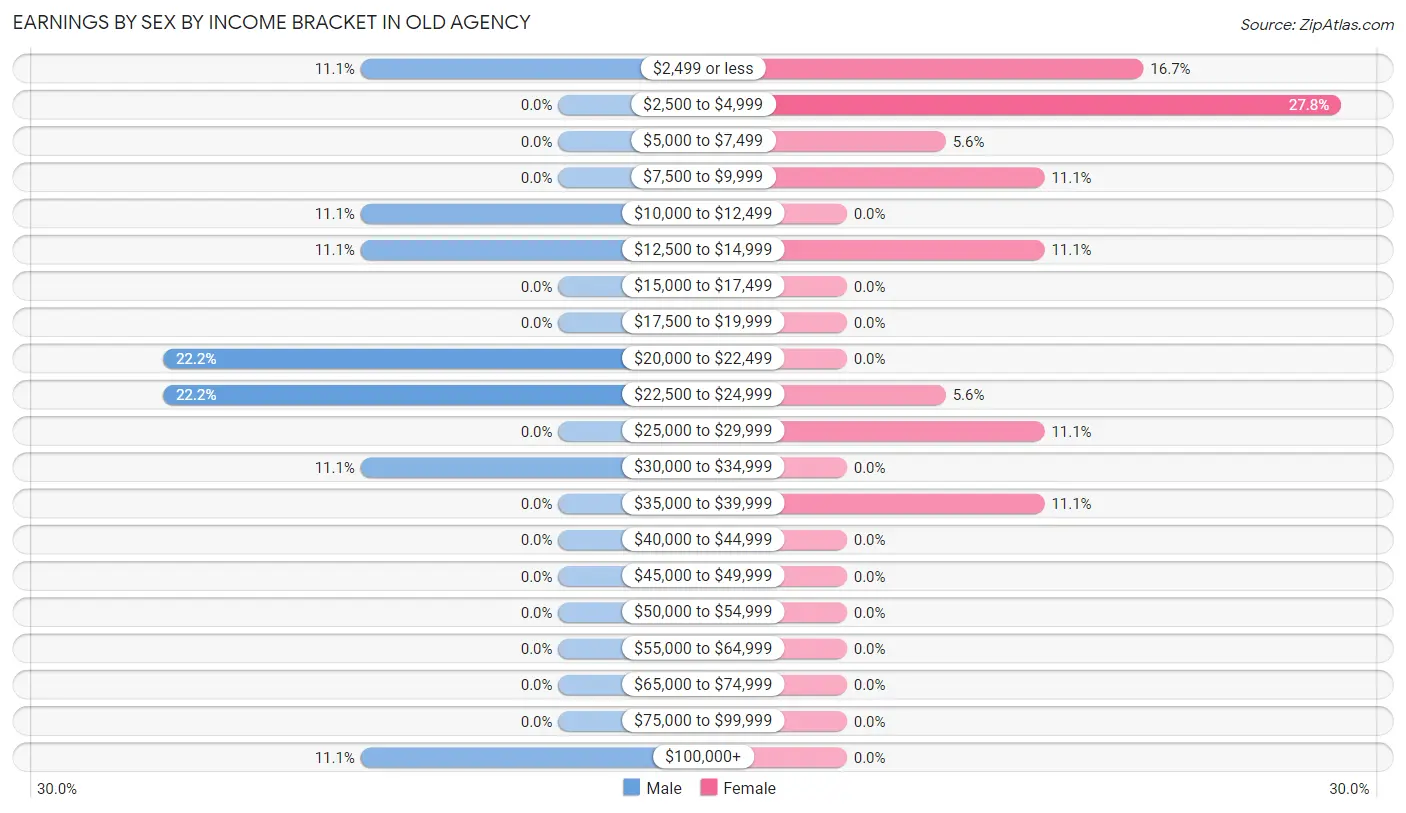
Earnings by Sex by Income Bracket in Old Agency
The most common earnings brackets in Old Agency are $20,000 to $22,499 for men (2 | 22.2%) and $2,500 to $4,999 for women (5 | 27.8%).
| Income | Male | Female |
| $2,499 or less | 1 (11.1%) | 3 (16.7%) |
| $2,500 to $4,999 | 0 (0.0%) | 5 (27.8%) |
| $5,000 to $7,499 | 0 (0.0%) | 1 (5.6%) |
| $7,500 to $9,999 | 0 (0.0%) | 2 (11.1%) |
| $10,000 to $12,499 | 1 (11.1%) | 0 (0.0%) |
| $12,500 to $14,999 | 1 (11.1%) | 2 (11.1%) |
| $15,000 to $17,499 | 0 (0.0%) | 0 (0.0%) |
| $17,500 to $19,999 | 0 (0.0%) | 0 (0.0%) |
| $20,000 to $22,499 | 2 (22.2%) | 0 (0.0%) |
| $22,500 to $24,999 | 2 (22.2%) | 1 (5.6%) |
| $25,000 to $29,999 | 0 (0.0%) | 2 (11.1%) |
| $30,000 to $34,999 | 1 (11.1%) | 0 (0.0%) |
| $35,000 to $39,999 | 0 (0.0%) | 2 (11.1%) |
| $40,000 to $44,999 | 0 (0.0%) | 0 (0.0%) |
| $45,000 to $49,999 | 0 (0.0%) | 0 (0.0%) |
| $50,000 to $54,999 | 0 (0.0%) | 0 (0.0%) |
| $55,000 to $64,999 | 0 (0.0%) | 0 (0.0%) |
| $65,000 to $74,999 | 0 (0.0%) | 0 (0.0%) |
| $75,000 to $99,999 | 0 (0.0%) | 0 (0.0%) |
| $100,000+ | 1 (11.1%) | 0 (0.0%) |
| Total | 9 (100.0%) | 18 (100.0%) |
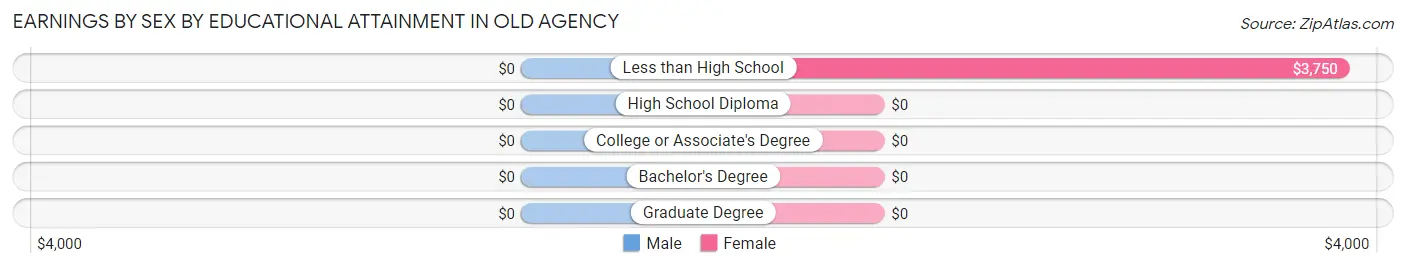
Earnings by Sex by Educational Attainment in Old Agency
| Educational Attainment | Male Income | Female Income |
| Less than High School | - | - |
| High School Diploma | - | - |
| College or Associate's Degree | - | - |
| Bachelor's Degree | - | - |
| Graduate Degree | - | - |
| Total | $21,875 | $0 |
Family Income in Old Agency
Family Income Brackets in Old Agency
According to the Old Agency family income data, there are 5 families falling into the $50,000 to $74,999 income range, which is the most common income bracket and makes up 38.5% of all families.
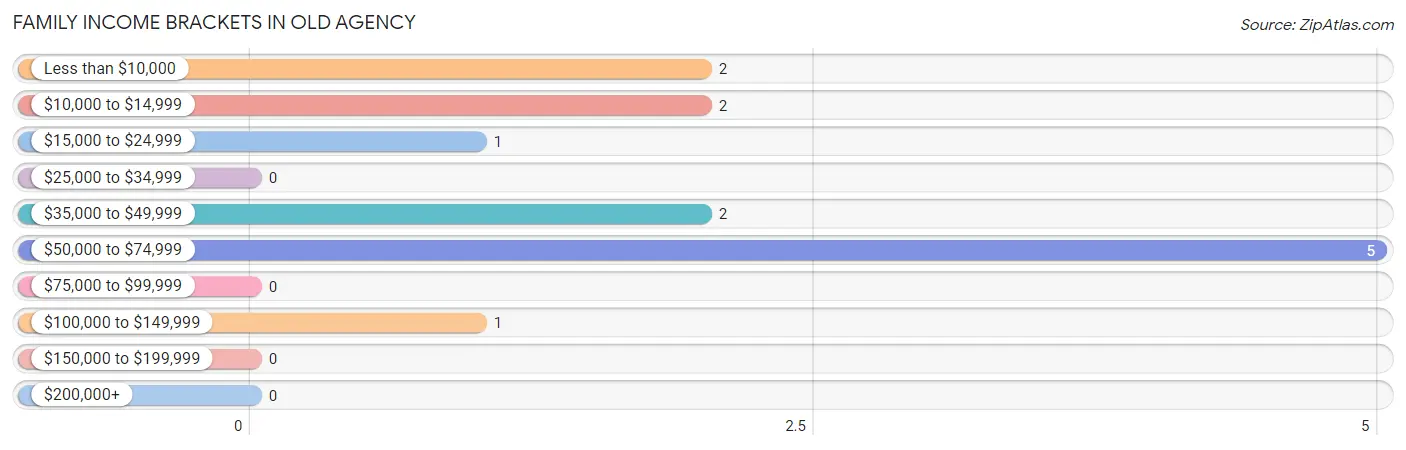
| Income Bracket | # Families | % Families |
| Less than $10,000 | 2 | 15.4% |
| $10,000 to $14,999 | 2 | 15.4% |
| $15,000 to $24,999 | 1 | 7.7% |
| $25,000 to $34,999 | 0 | 0.0% |
| $35,000 to $49,999 | 2 | 15.4% |
| $50,000 to $74,999 | 5 | 38.5% |
| $75,000 to $99,999 | 0 | 0.0% |
| $100,000 to $149,999 | 1 | 7.7% |
| $150,000 to $199,999 | 0 | 0.0% |
| $200,000+ | 0 | 0.0% |
Family Income by Famaliy Size in Old Agency
5-person families (4 | 30.8%) account for the highest median family income in Old Agency with $65,000 per family, while 5-person families (4 | 30.8%) have the highest median income of $13,000 per family member.
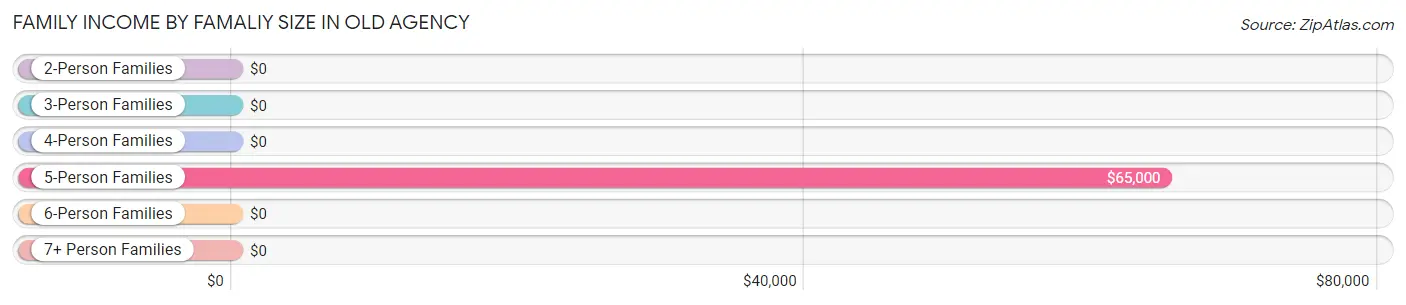
| Income Bracket | # Families | Median Income |
| 2-Person Families | 1 (7.7%) | $0 |
| 3-Person Families | 3 (23.1%) | $0 |
| 4-Person Families | 2 (15.4%) | $0 |
| 5-Person Families | 4 (30.8%) | $65,000 |
| 6-Person Families | 3 (23.1%) | $0 |
| 7+ Person Families | 0 (0.0%) | $0 |
| Total | 13 (100.0%) | $0 |
Family Income by Number of Earners in Old Agency
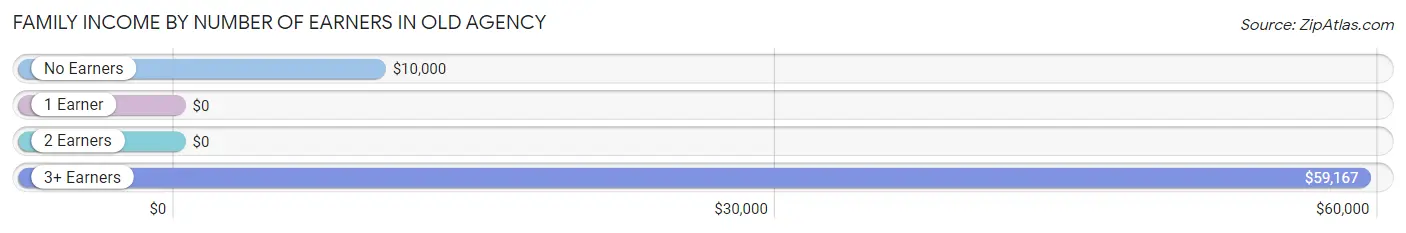
| Number of Earners | # Families | Median Income |
| No Earners | 4 (30.8%) | $10,000 |
| 1 Earner | 2 (15.4%) | $0 |
| 2 Earners | 1 (7.7%) | $0 |
| 3+ Earners | 6 (46.2%) | $59,167 |
| Total | 13 (100.0%) | $0 |
Household Income in Old Agency
Household Income Brackets in Old Agency
With 5 households falling in the category, the less than $10,000 income range is the most frequent in Old Agency, accounting for 25.0% of all households.
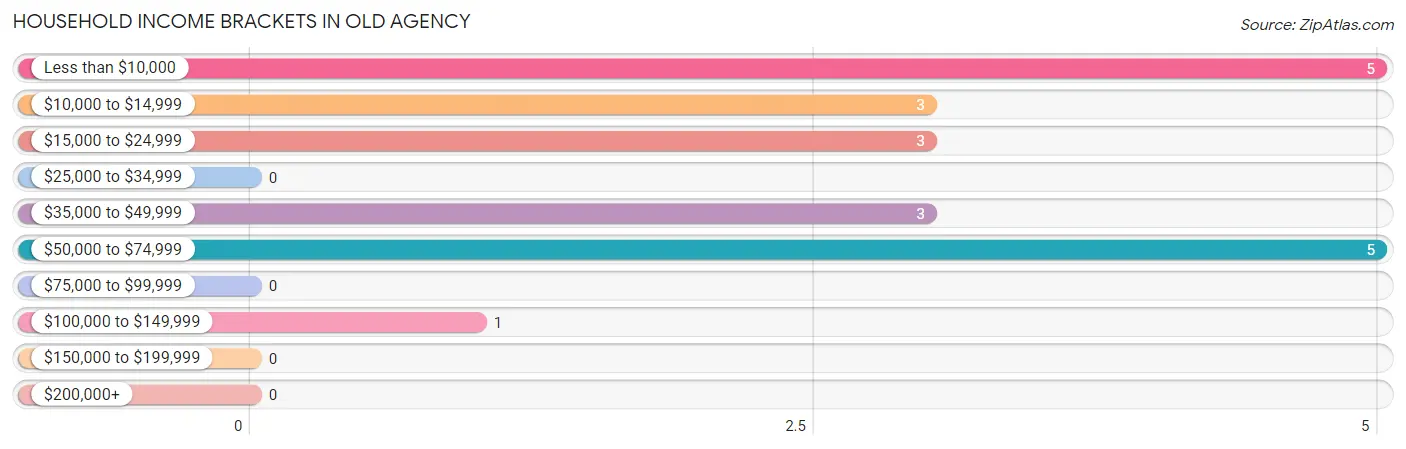
| Income Bracket | # Households | % Households |
| Less than $10,000 | 5 | 25.0% |
| $10,000 to $14,999 | 3 | 15.0% |
| $15,000 to $24,999 | 3 | 15.0% |
| $25,000 to $34,999 | 0 | 0.0% |
| $35,000 to $49,999 | 3 | 15.0% |
| $50,000 to $74,999 | 5 | 25.0% |
| $75,000 to $99,999 | 0 | 0.0% |
| $100,000 to $149,999 | 1 | 5.0% |
| $150,000 to $199,999 | 0 | 0.0% |
| $200,000+ | 0 | 0.0% |
Household Income by Householder Age in Old Agency
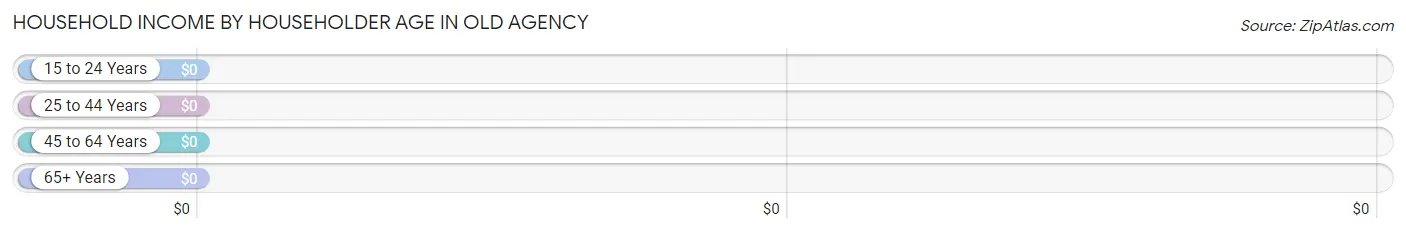
| Income Bracket | # Households | Median Income |
| 15 to 24 Years | 0 (0.0%) | $0 |
| 25 to 44 Years | 6 (30.0%) | $0 |
| 45 to 64 Years | 8 (40.0%) | $0 |
| 65+ Years | 6 (30.0%) | $0 |
| Total | 20 (100.0%) | $0 |
Poverty in Old Agency
Income Below Poverty by Sex and Age in Old Agency
With 47.5% poverty level for males and 53.3% for females among the residents of Old Agency, under 5 year old males and under 5 year old females are the most vulnerable to poverty, with 8 males (100.0%) and 11 females (100.0%) in their respective age groups living below the poverty level.
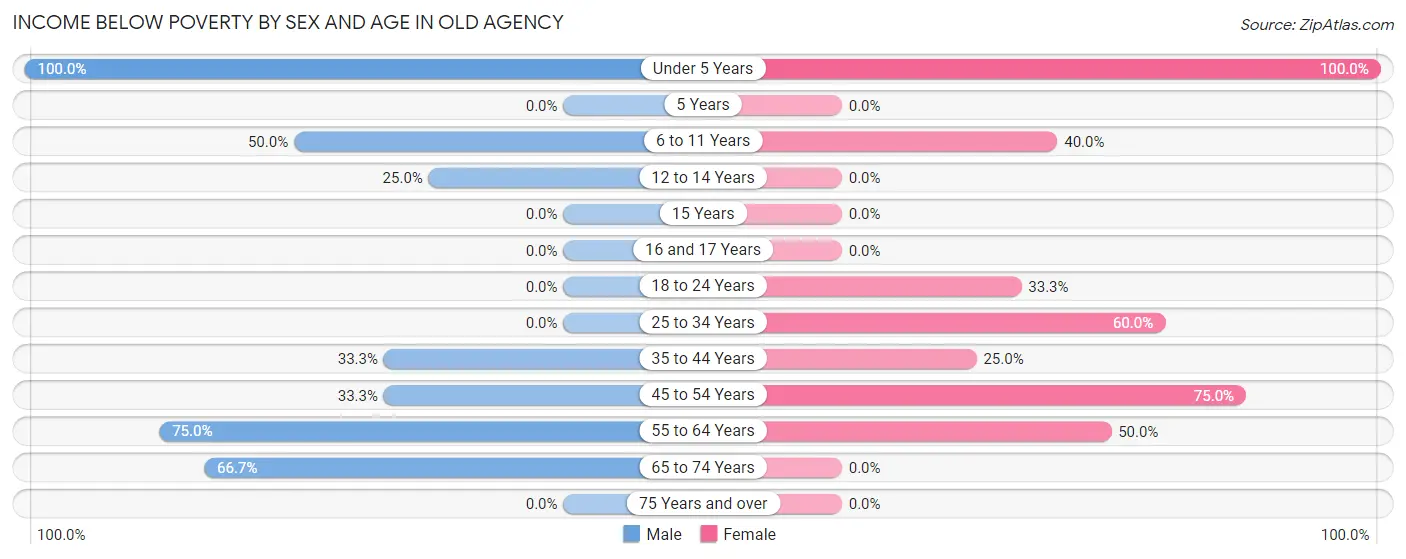
| Age Bracket | Male | Female |
| Under 5 Years | 8 (100.0%) | 11 (100.0%) |
| 5 Years | 0 (0.0%) | 0 (0.0%) |
| 6 to 11 Years | 3 (50.0%) | 2 (40.0%) |
| 12 to 14 Years | 1 (25.0%) | 0 (0.0%) |
| 15 Years | 0 (0.0%) | 0 (0.0%) |
| 16 and 17 Years | 0 (0.0%) | 0 (0.0%) |
| 18 to 24 Years | 0 (0.0%) | 2 (33.3%) |
| 25 to 34 Years | 0 (0.0%) | 3 (60.0%) |
| 35 to 44 Years | 1 (33.3%) | 1 (25.0%) |
| 45 to 54 Years | 1 (33.3%) | 3 (75.0%) |
| 55 to 64 Years | 3 (75.0%) | 2 (50.0%) |
| 65 to 74 Years | 2 (66.7%) | 0 (0.0%) |
| 75 Years and over | 0 (0.0%) | 0 (0.0%) |
| Total | 19 (47.5%) | 24 (53.3%) |
Income Above Poverty by Sex and Age in Old Agency
According to the poverty statistics in Old Agency, males aged 15 years and females aged 5 years are the age groups that are most secure financially, with 100.0% of males and 100.0% of females in these age groups living above the poverty line.
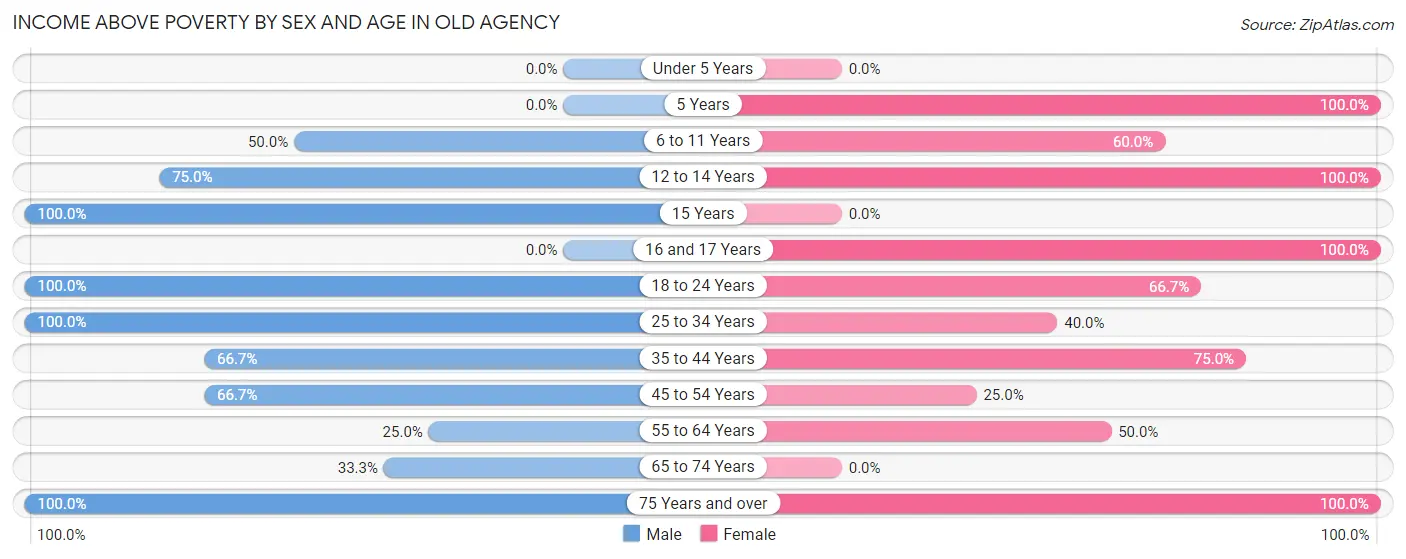
| Age Bracket | Male | Female |
| Under 5 Years | 0 (0.0%) | 0 (0.0%) |
| 5 Years | 0 (0.0%) | 1 (100.0%) |
| 6 to 11 Years | 3 (50.0%) | 3 (60.0%) |
| 12 to 14 Years | 3 (75.0%) | 2 (100.0%) |
| 15 Years | 1 (100.0%) | 0 (0.0%) |
| 16 and 17 Years | 0 (0.0%) | 1 (100.0%) |
| 18 to 24 Years | 2 (100.0%) | 4 (66.7%) |
| 25 to 34 Years | 5 (100.0%) | 2 (40.0%) |
| 35 to 44 Years | 2 (66.7%) | 3 (75.0%) |
| 45 to 54 Years | 2 (66.7%) | 1 (25.0%) |
| 55 to 64 Years | 1 (25.0%) | 2 (50.0%) |
| 65 to 74 Years | 1 (33.3%) | 0 (0.0%) |
| 75 Years and over | 1 (100.0%) | 2 (100.0%) |
| Total | 21 (52.5%) | 21 (46.7%) |
Income Below Poverty Among Married-Couple Families in Old Agency
The poverty statistics for married-couple families in Old Agency show that 25.0% or 1 of the total 4 families live below the poverty line. Families with 1 or 2 children have the highest poverty rate of 33.3%, comprising of 1 families. On the other hand, families with 3 or 4 children have the lowest poverty rate of 0.0%, which includes 0 families.
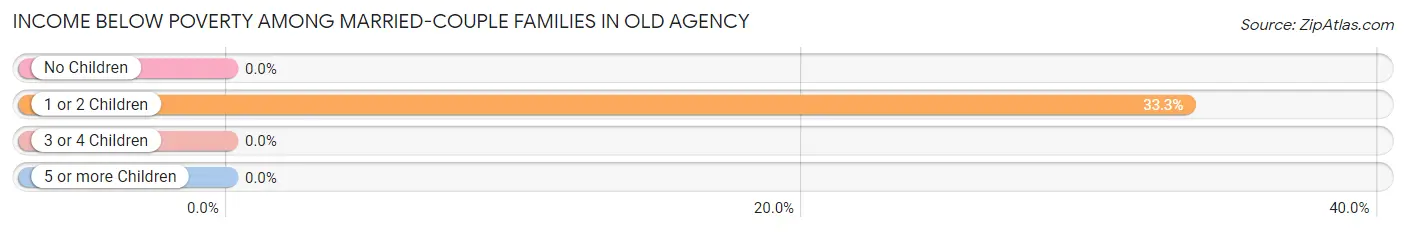
| Children | Above Poverty | Below Poverty |
| No Children | 0 (0.0%) | 0 (0.0%) |
| 1 or 2 Children | 2 (66.7%) | 1 (33.3%) |
| 3 or 4 Children | 1 (100.0%) | 0 (0.0%) |
| 5 or more Children | 0 (0.0%) | 0 (0.0%) |
| Total | 3 (75.0%) | 1 (25.0%) |
Income Below Poverty Among Single-Parent Households in Old Agency
According to the poverty data in Old Agency, 60.0% or 3 single-father households and 25.0% or 1 single-mother households are living below the poverty line. Among single-father households, those with 5 or more children have the highest poverty rate, with 1 households (100.0%) experiencing poverty. Likewise, among single-mother households, those with 3 or 4 children have the highest poverty rate, with 1 households (50.0%) falling below the poverty line.
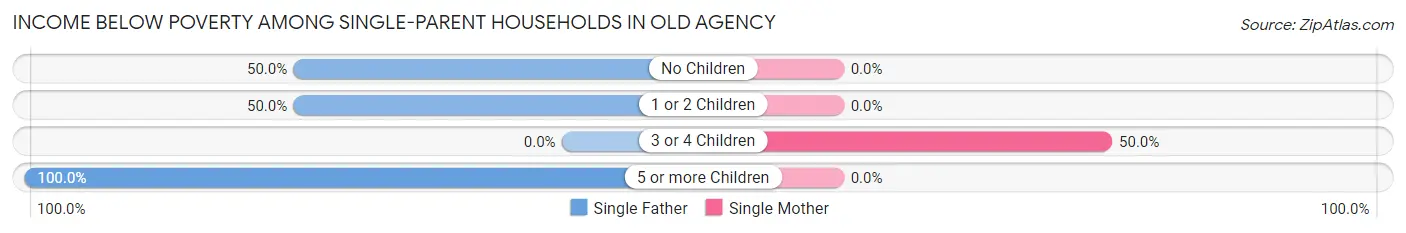
| Children | Single Father | Single Mother |
| No Children | 1 (50.0%) | 0 (0.0%) |
| 1 or 2 Children | 1 (50.0%) | 0 (0.0%) |
| 3 or 4 Children | 0 (0.0%) | 1 (50.0%) |
| 5 or more Children | 1 (100.0%) | 0 (0.0%) |
| Total | 3 (60.0%) | 1 (25.0%) |
Income Below Poverty Among Married-Couple vs Single-Parent Households in Old Agency
The poverty data for Old Agency shows that 1 of the married-couple family households (25.0%) and 4 of the single-parent households (44.4%) are living below the poverty level. Within the married-couple family households, those with 1 or 2 children have the highest poverty rate, with 1 households (33.3%) falling below the poverty line. Among the single-parent households, those with 5 or more children have the highest poverty rate, with 1 household (100.0%) living below poverty.
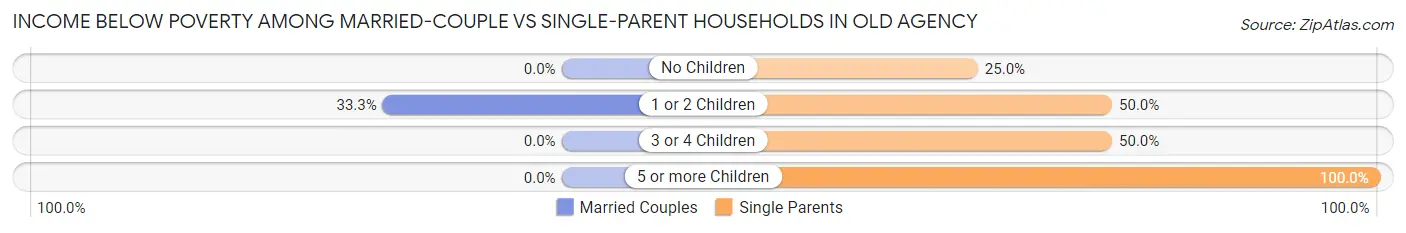
| Children | Married-Couple Families | Single-Parent Households |
| No Children | 0 (0.0%) | 1 (25.0%) |
| 1 or 2 Children | 1 (33.3%) | 1 (50.0%) |
| 3 or 4 Children | 0 (0.0%) | 1 (50.0%) |
| 5 or more Children | 0 (0.0%) | 1 (100.0%) |
| Total | 1 (25.0%) | 4 (44.4%) |
Race in Old Agency
The most populous races in Old Agency are Native / Alaskan (54 | 63.5%), Two or more Races (25 | 29.4%), and White / Caucasian (6 | 7.1%).
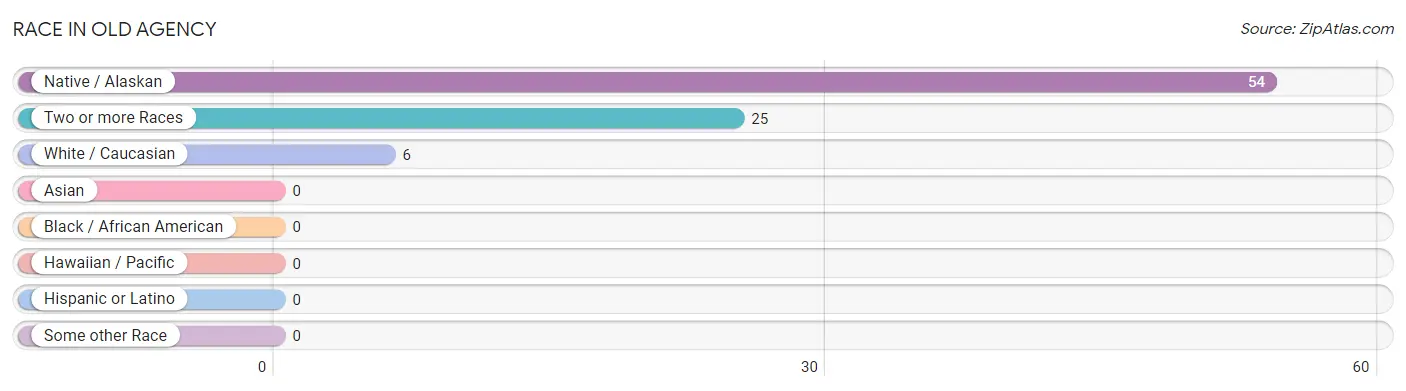
| Race | # Population | % Population |
| Asian | 0 | 0.0% |
| Black / African American | 0 | 0.0% |
| Hawaiian / Pacific | 0 | 0.0% |
| Hispanic or Latino | 0 | 0.0% |
| Native / Alaskan | 54 | 63.5% |
| White / Caucasian | 6 | 7.1% |
| Two or more Races | 25 | 29.4% |
| Some other Race | 0 | 0.0% |
| Total | 85 | 100.0% |
Ancestry in Old Agency
The most populous ancestries reported in Old Agency are Blackfeet (20 | 23.5%), Sioux (6 | 7.1%), Cheyenne (5 | 5.9%), German (4 | 4.7%), and Apache (1 | 1.2%), together accounting for 42.4% of all Old Agency residents.
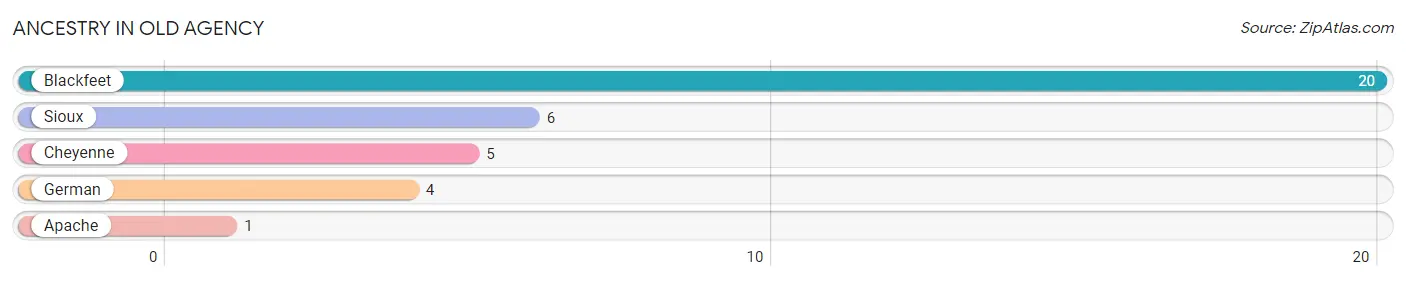
| Ancestry | # Population | % Population |
| Apache | 1 | 1.2% |
| Blackfeet | 20 | 23.5% |
| Cheyenne | 5 | 5.9% |
| German | 4 | 4.7% |
| Sioux | 6 | 7.1% | View All 5 Rows |
Immigrants in Old Agency
The most numerous immigrant groups reported in Old Agency came from , and Canada (1 | 1.2%), together accounting for 1.2% of all Old Agency residents.

| Immigration Origin | # Population | % Population |
| Canada | 1 | 1.2% | View All 1 Rows |
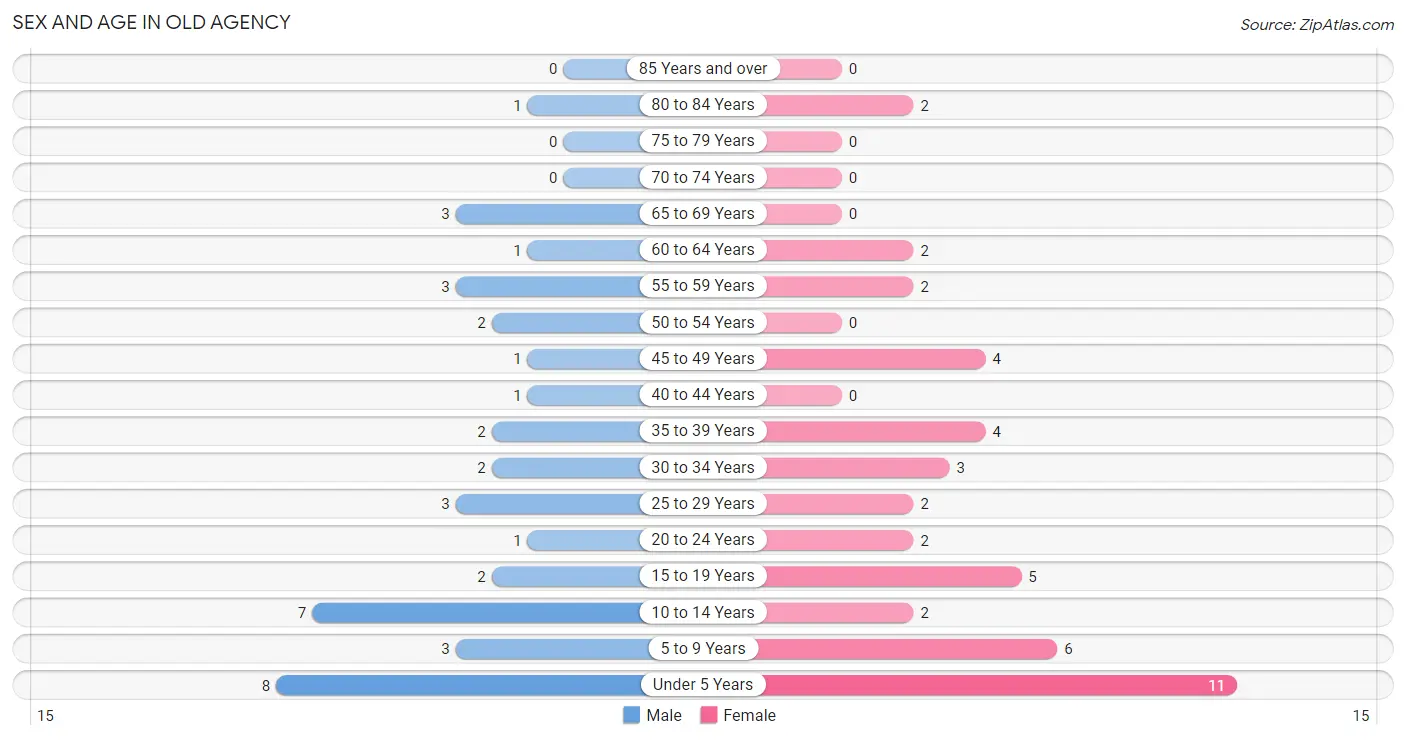
Sex and Age in Old Agency
Sex and Age in Old Agency
The most populous age groups in Old Agency are Under 5 Years (8 | 20.0%) for men and Under 5 Years (11 | 24.4%) for women.
| Age Bracket | Male | Female |
| Under 5 Years | 8 (20.0%) | 11 (24.4%) |
| 5 to 9 Years | 3 (7.5%) | 6 (13.3%) |
| 10 to 14 Years | 7 (17.5%) | 2 (4.4%) |
| 15 to 19 Years | 2 (5.0%) | 5 (11.1%) |
| 20 to 24 Years | 1 (2.5%) | 2 (4.4%) |
| 25 to 29 Years | 3 (7.5%) | 2 (4.4%) |
| 30 to 34 Years | 2 (5.0%) | 3 (6.7%) |
| 35 to 39 Years | 2 (5.0%) | 4 (8.9%) |
| 40 to 44 Years | 1 (2.5%) | 0 (0.0%) |
| 45 to 49 Years | 1 (2.5%) | 4 (8.9%) |
| 50 to 54 Years | 2 (5.0%) | 0 (0.0%) |
| 55 to 59 Years | 3 (7.5%) | 2 (4.4%) |
| 60 to 64 Years | 1 (2.5%) | 2 (4.4%) |
| 65 to 69 Years | 3 (7.5%) | 0 (0.0%) |
| 70 to 74 Years | 0 (0.0%) | 0 (0.0%) |
| 75 to 79 Years | 0 (0.0%) | 0 (0.0%) |
| 80 to 84 Years | 1 (2.5%) | 2 (4.4%) |
| 85 Years and over | 0 (0.0%) | 0 (0.0%) |
| Total | 40 (100.0%) | 45 (100.0%) |
Families and Households in Old Agency
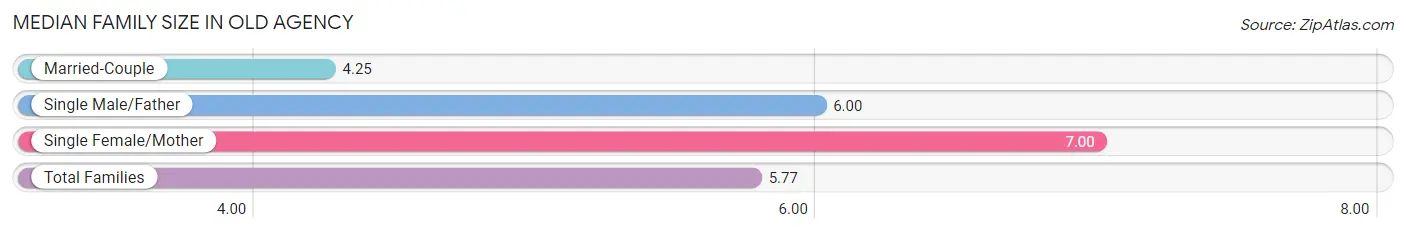
Median Family Size in Old Agency
The median family size in Old Agency is 5.77 persons per family, with single female/mother families (4 | 30.8%) accounting for the largest median family size of 7 persons per family. On the other hand, married-couple families (4 | 30.8%) represent the smallest median family size with 4.25 persons per family.
| Family Type | # Families | Family Size |
| Married-Couple | 4 (30.8%) | 4.25 |
| Single Male/Father | 5 (38.5%) | 6.00 |
| Single Female/Mother | 4 (30.8%) | 7.00 |
| Total Families | 13 (100.0%) | 5.77 |
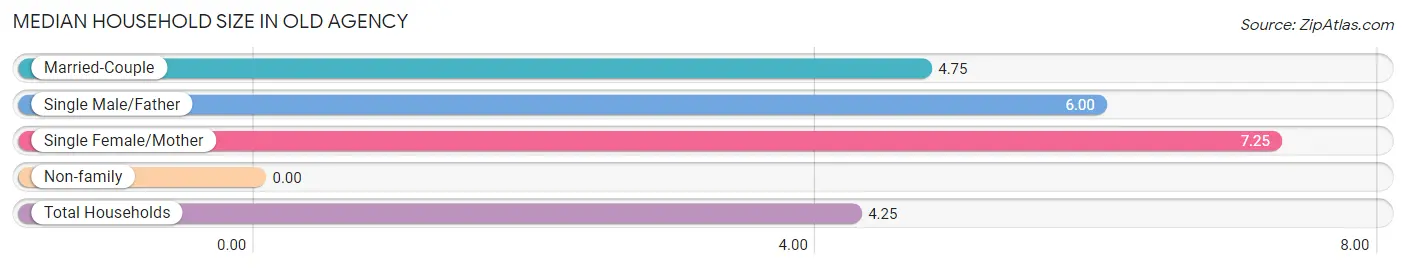
Median Household Size in Old Agency
| Household Type | # Households | Household Size |
| Married-Couple | 4 (20.0%) | 4.75 |
| Single Male/Father | 5 (25.0%) | 6.00 |
| Single Female/Mother | 4 (20.0%) | 7.25 |
| Non-family | 7 (35.0%) | - |
| Total Households | 20 (100.0%) | 4.25 |
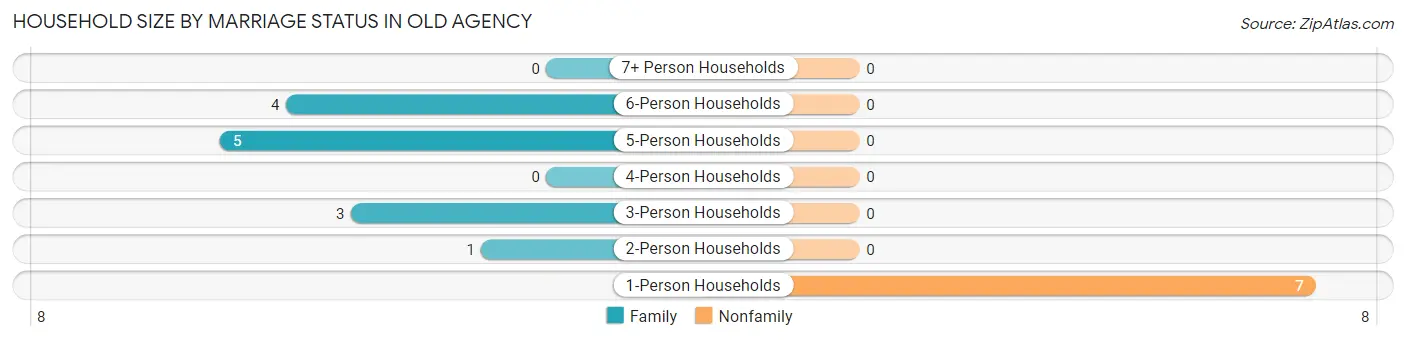
Household Size by Marriage Status in Old Agency
Out of a total of 20 households in Old Agency, 13 (65.0%) are family households, while 7 (35.0%) are nonfamily households. The most numerous type of family households are 5-person households, comprising 5, and the most common type of nonfamily households are 1-person households, comprising 7.
| Household Size | Family Households | Nonfamily Households |
| 1-Person Households | - | 7 (35.0%) |
| 2-Person Households | 1 (5.0%) | 0 (0.0%) |
| 3-Person Households | 3 (15.0%) | 0 (0.0%) |
| 4-Person Households | 0 (0.0%) | 0 (0.0%) |
| 5-Person Households | 5 (25.0%) | 0 (0.0%) |
| 6-Person Households | 4 (20.0%) | 0 (0.0%) |
| 7+ Person Households | 0 (0.0%) | 0 (0.0%) |
| Total | 13 (65.0%) | 7 (35.0%) |
Female Fertility in Old Agency
Fertility by Age in Old Agency
Average fertility rate in Old Agency is 100.0 births per 1,000 women. Women in the age bracket of 15 to 19 years have the highest fertility rate with 200.0 births per 1,000 women. Women in the age bracket of 15 to 19 years acount for 50.0% of all women with births.
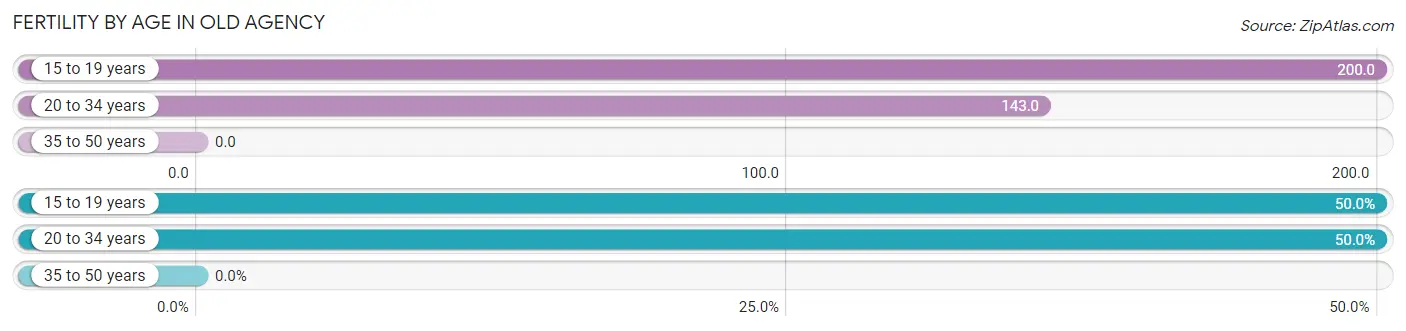
| Age Bracket | Women with Births | Births / 1,000 Women |
| 15 to 19 years | 1 (50.0%) | 200.0 |
| 20 to 34 years | 1 (50.0%) | 143.0 |
| 35 to 50 years | 0 (0.0%) | 0.0 |
| Total | 2 (100.0%) | 100.0 |
Fertility by Age by Marriage Status in Old Agency
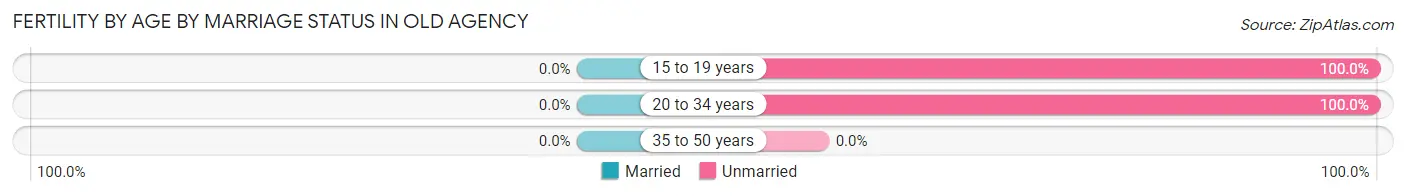
| Age Bracket | Married | Unmarried |
| 15 to 19 years | 0 (0.0%) | 1 (100.0%) |
| 20 to 34 years | 0 (0.0%) | 1 (100.0%) |
| 35 to 50 years | 0 (0.0%) | 0 (0.0%) |
| Total | 0 (0.0%) | 2 (100.0%) |
Fertility by Education in Old Agency
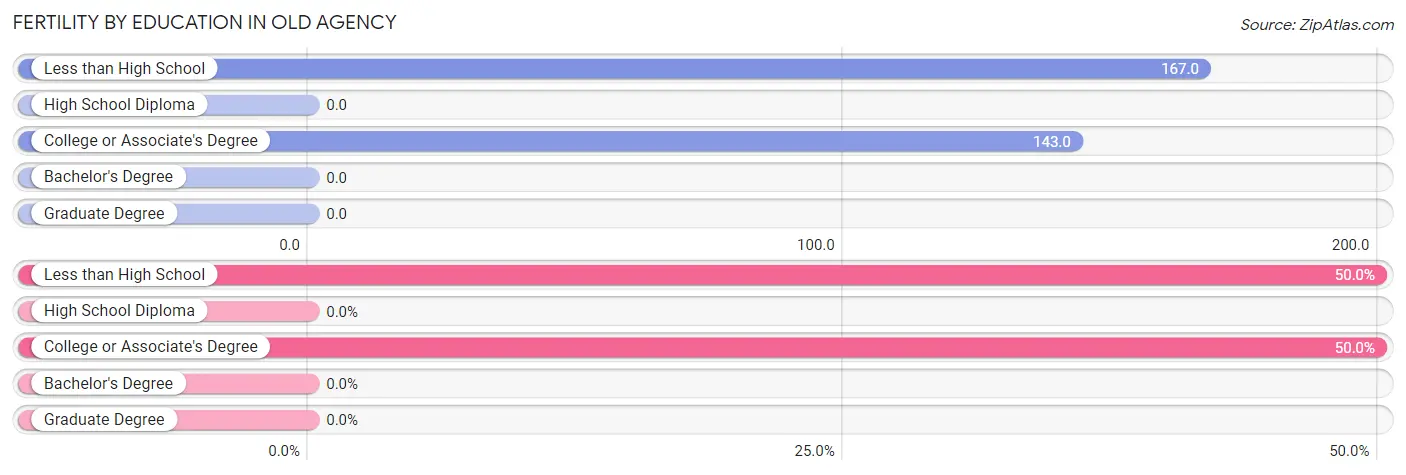
| Educational Attainment | Women with Births | Births / 1,000 Women |
| Less than High School | 1 (50.0%) | 167.0 |
| High School Diploma | 0 (0.0%) | 0.0 |
| College or Associate's Degree | 1 (50.0%) | 143.0 |
| Bachelor's Degree | 0 (0.0%) | 0.0 |
| Graduate Degree | 0 (0.0%) | 0.0 |
| Total | 2 (100.0%) | 100.0 |
Fertility by Education by Marriage Status in Old Agency
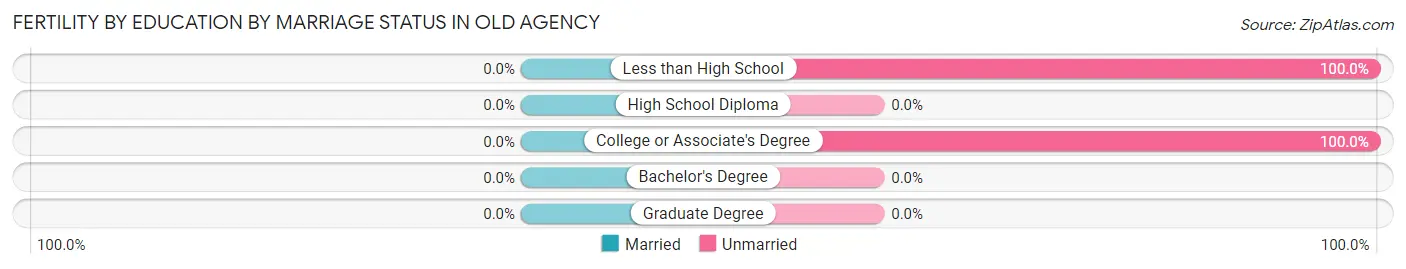
| Educational Attainment | Married | Unmarried |
| Less than High School | 0 (0.0%) | 1 (100.0%) |
| High School Diploma | 0 (0.0%) | 0 (0.0%) |
| College or Associate's Degree | 0 (0.0%) | 1 (100.0%) |
| Bachelor's Degree | 0 (0.0%) | 0 (0.0%) |
| Graduate Degree | 0 (0.0%) | 0 (0.0%) |
| Total | 0 (0.0%) | 2 (100.0%) |
Employment Characteristics in Old Agency
Employment by Class of Employer in Old Agency
Among the 23 employed individuals in Old Agency, local government employees (8 | 34.8%), private company employees (5 | 21.7%), and self-employed (not incorporated) (5 | 21.7%) make up the most common classes of employment.
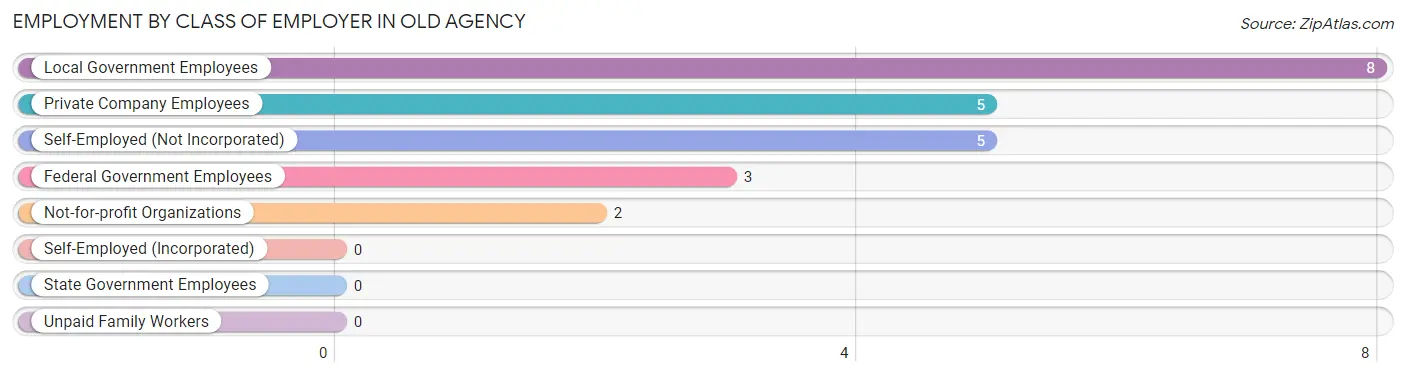
| Employer Class | # Employees | % Employees |
| Private Company Employees | 5 | 21.7% |
| Self-Employed (Incorporated) | 0 | 0.0% |
| Self-Employed (Not Incorporated) | 5 | 21.7% |
| Not-for-profit Organizations | 2 | 8.7% |
| Local Government Employees | 8 | 34.8% |
| State Government Employees | 0 | 0.0% |
| Federal Government Employees | 3 | 13.0% |
| Unpaid Family Workers | 0 | 0.0% |
| Total | 23 | 100.0% |
Employment Status by Age in Old Agency
According to the labor force statistics for Old Agency, out of the total population over 16 years of age (47), 59.6% or 28 individuals are in the labor force, with 17.9% or 5 of them unemployed. The age group with the highest labor force participation rate is 25 to 29 years, with 100.0% or 5 individuals in the labor force. Within the labor force, the 30 to 34 years age range has the highest percentage of unemployed individuals, with 100.0% or 2 of them being unemployed.
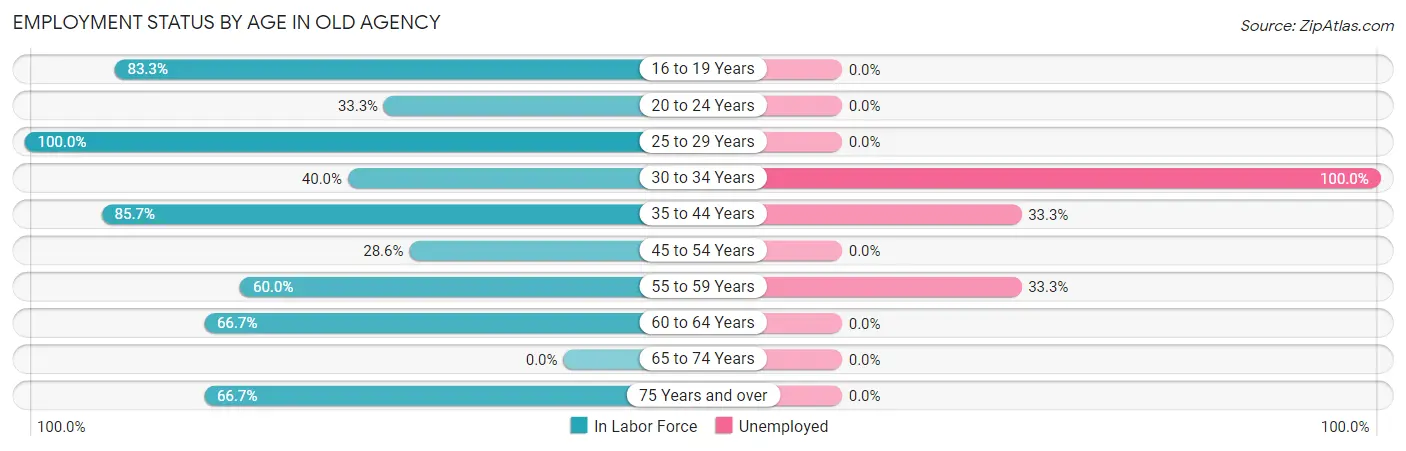
| Age Bracket | In Labor Force | Unemployed |
| 16 to 19 Years | 5 (83.3%) | 0 (0.0%) |
| 20 to 24 Years | 1 (33.3%) | 0 (0.0%) |
| 25 to 29 Years | 5 (100.0%) | 0 (0.0%) |
| 30 to 34 Years | 2 (40.0%) | 2 (100.0%) |
| 35 to 44 Years | 6 (85.7%) | 2 (33.3%) |
| 45 to 54 Years | 2 (28.6%) | 0 (0.0%) |
| 55 to 59 Years | 3 (60.0%) | 1 (33.3%) |
| 60 to 64 Years | 2 (66.7%) | 0 (0.0%) |
| 65 to 74 Years | 0 (0.0%) | 0 (0.0%) |
| 75 Years and over | 2 (66.7%) | 0 (0.0%) |
| Total | 28 (59.6%) | 5 (17.9%) |
Employment Status by Educational Attainment in Old Agency
According to labor force statistics for Old Agency, 62.5% of individuals (20) out of the total population between 25 and 64 years of age (32) are in the labor force, with 25.0% or 5 of them being unemployed. The group with the highest labor force participation rate are those with the educational attainment of high school diploma, with 87.5% or 7 individuals in the labor force. Within the labor force, individuals with college / associate degree education have the highest percentage of unemployment, with 42.9% or 3 of them being unemployed.
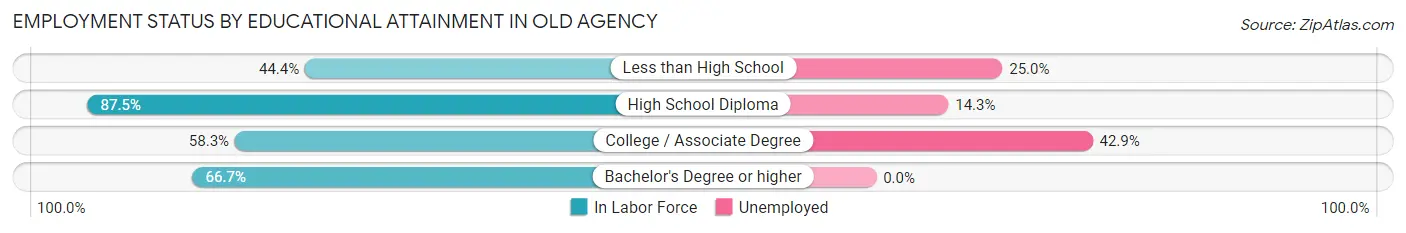
| Educational Attainment | In Labor Force | Unemployed |
| Less than High School | 4 (44.4%) | 2 (25.0%) |
| High School Diploma | 7 (87.5%) | 1 (14.3%) |
| College / Associate Degree | 7 (58.3%) | 5 (42.9%) |
| Bachelor's Degree or higher | 2 (66.7%) | 0 (0.0%) |
| Total | 20 (62.5%) | 8 (25.0%) |
Employment Occupations by Sex in Old Agency
Management, Business, Science and Arts Occupations
The most common Management, Business, Science and Arts occupations in Old Agency are Community & Social Service (2 | 8.7%), Education Instruction & Library (2 | 8.7%), and Management (1 | 4.3%).
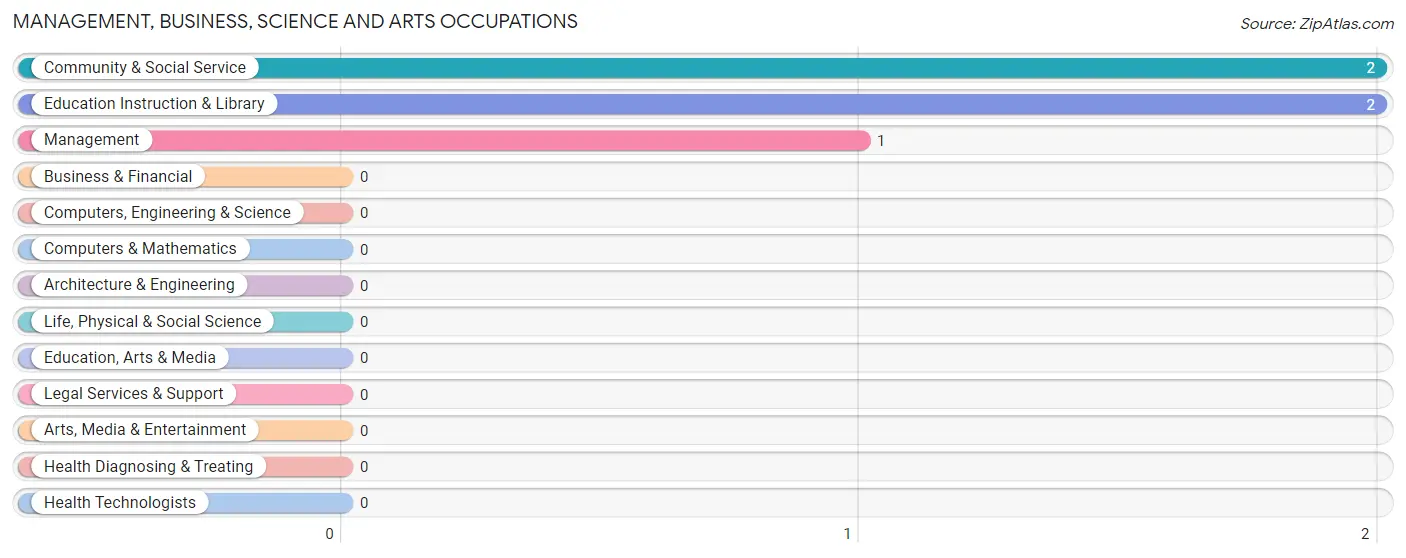
Management, Business, Science and Arts Occupations by Sex
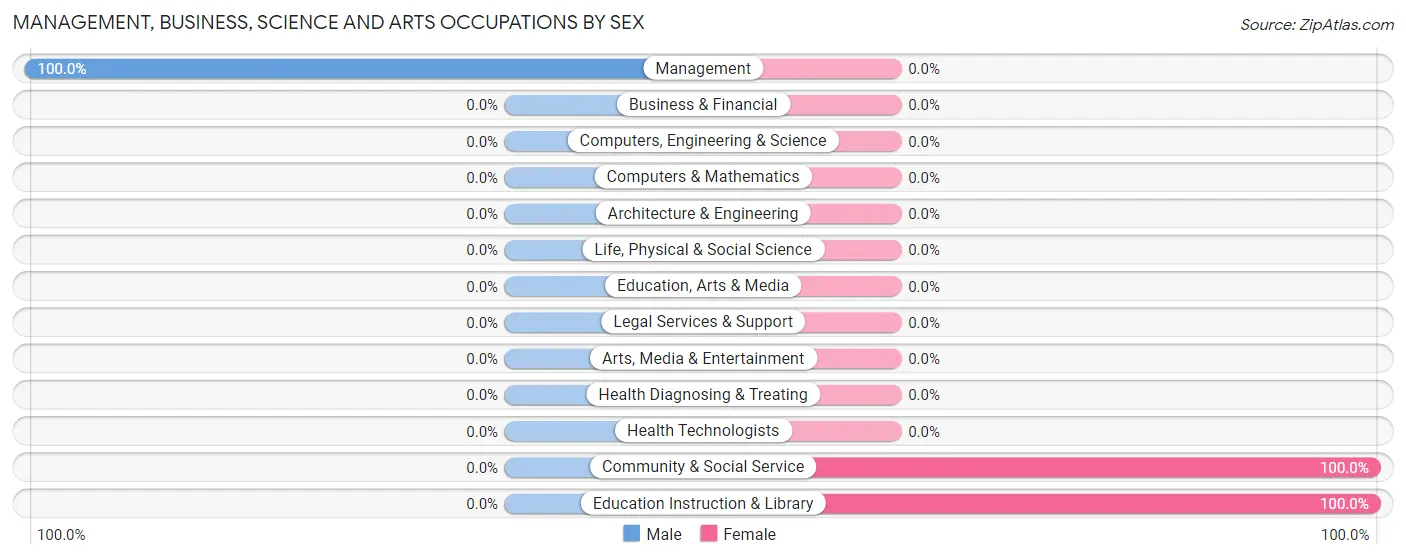
| Occupation | Male | Female |
| Management | 1 (100.0%) | 0 (0.0%) |
| Business & Financial | 0 (0.0%) | 0 (0.0%) |
| Computers, Engineering & Science | 0 (0.0%) | 0 (0.0%) |
| Computers & Mathematics | 0 (0.0%) | 0 (0.0%) |
| Architecture & Engineering | 0 (0.0%) | 0 (0.0%) |
| Life, Physical & Social Science | 0 (0.0%) | 0 (0.0%) |
| Community & Social Service | 0 (0.0%) | 2 (100.0%) |
| Education, Arts & Media | 0 (0.0%) | 0 (0.0%) |
| Legal Services & Support | 0 (0.0%) | 0 (0.0%) |
| Education Instruction & Library | 0 (0.0%) | 2 (100.0%) |
| Arts, Media & Entertainment | 0 (0.0%) | 0 (0.0%) |
| Health Diagnosing & Treating | 0 (0.0%) | 0 (0.0%) |
| Health Technologists | 0 (0.0%) | 0 (0.0%) |
| Total (Category) | 1 (33.3%) | 2 (66.7%) |
| Total (Overall) | 6 (26.1%) | 17 (73.9%) |
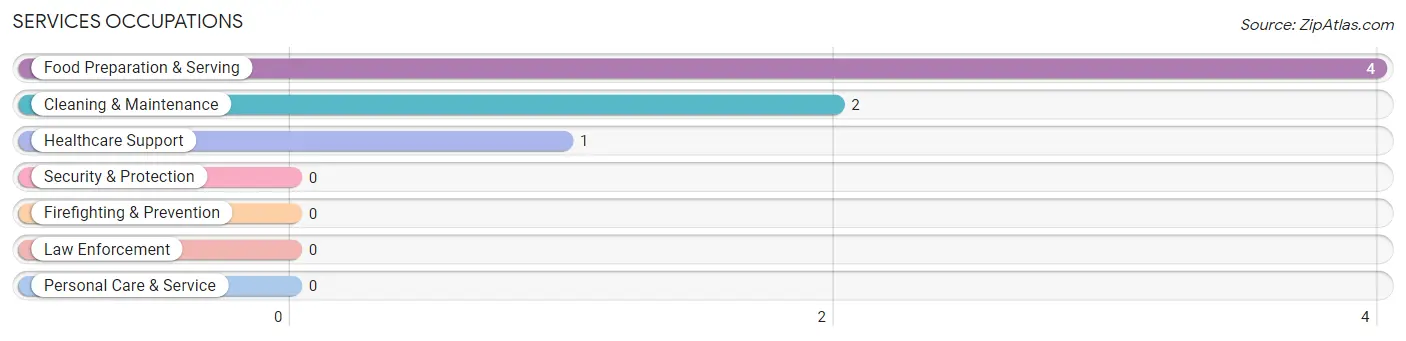
Services Occupations
The most common Services occupations in Old Agency are Food Preparation & Serving (4 | 17.4%), Cleaning & Maintenance (2 | 8.7%), and Healthcare Support (1 | 4.3%).
Services Occupations by Sex
Within the Services occupations in Old Agency, the most male-oriented occupations are Healthcare Support (100.0%), and Food Preparation & Serving (50.0%), while the most female-oriented occupations are Cleaning & Maintenance (100.0%), and Food Preparation & Serving (50.0%).
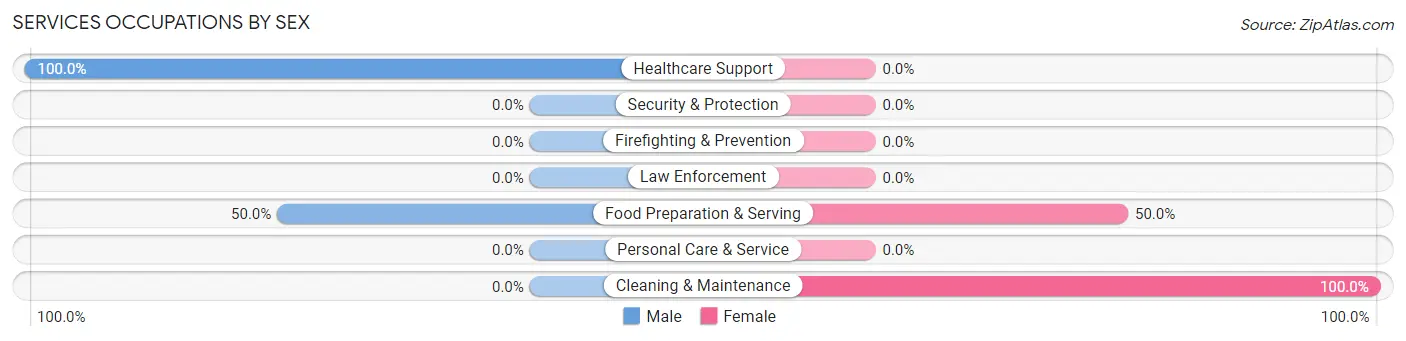
| Occupation | Male | Female |
| Healthcare Support | 1 (100.0%) | 0 (0.0%) |
| Security & Protection | 0 (0.0%) | 0 (0.0%) |
| Firefighting & Prevention | 0 (0.0%) | 0 (0.0%) |
| Law Enforcement | 0 (0.0%) | 0 (0.0%) |
| Food Preparation & Serving | 2 (50.0%) | 2 (50.0%) |
| Cleaning & Maintenance | 0 (0.0%) | 2 (100.0%) |
| Personal Care & Service | 0 (0.0%) | 0 (0.0%) |
| Total (Category) | 3 (42.9%) | 4 (57.1%) |
| Total (Overall) | 6 (26.1%) | 17 (73.9%) |
Sales and Office Occupations
The most common Sales and Office occupations in Old Agency are Office & Administration (2 | 8.7%), and Sales & Related (1 | 4.3%).
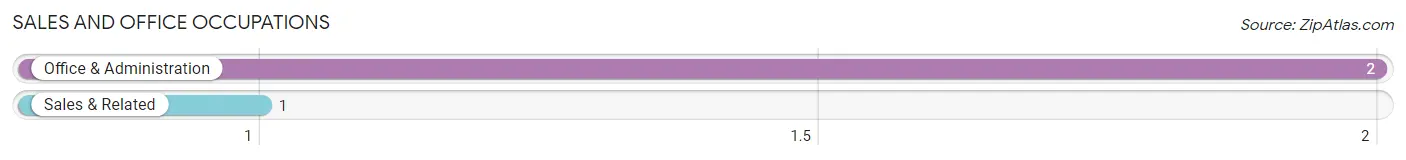
Sales and Office Occupations by Sex
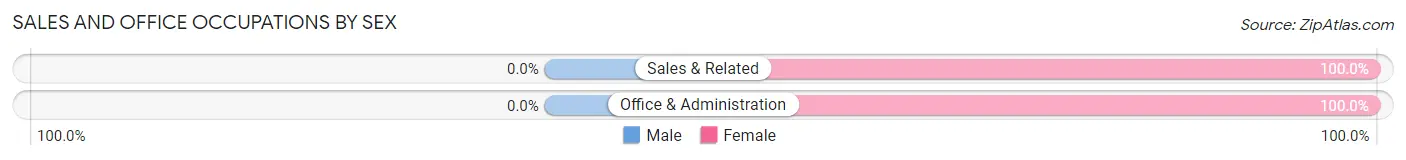
| Occupation | Male | Female |
| Sales & Related | 0 (0.0%) | 1 (100.0%) |
| Office & Administration | 0 (0.0%) | 2 (100.0%) |
| Total (Category) | 0 (0.0%) | 3 (100.0%) |
| Total (Overall) | 6 (26.1%) | 17 (73.9%) |
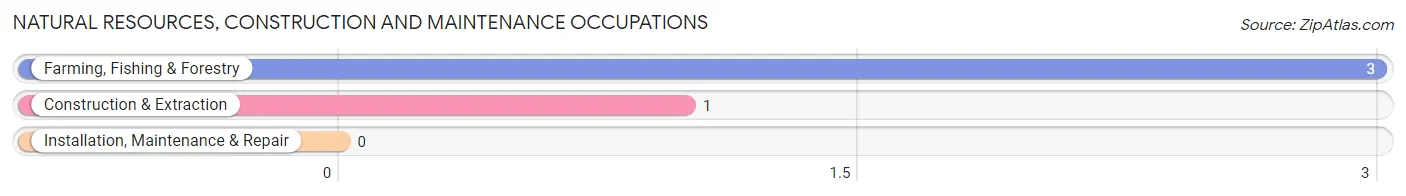
Natural Resources, Construction and Maintenance Occupations
The most common Natural Resources, Construction and Maintenance occupations in Old Agency are Farming, Fishing & Forestry (3 | 13.0%), and Construction & Extraction (1 | 4.3%).
Natural Resources, Construction and Maintenance Occupations by Sex
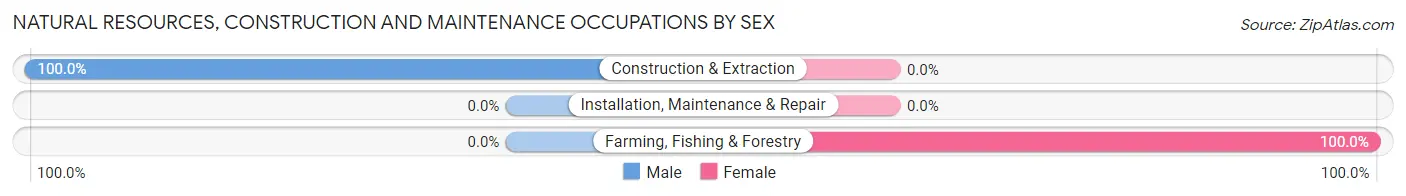
| Occupation | Male | Female |
| Farming, Fishing & Forestry | 0 (0.0%) | 3 (100.0%) |
| Construction & Extraction | 1 (100.0%) | 0 (0.0%) |
| Installation, Maintenance & Repair | 0 (0.0%) | 0 (0.0%) |
| Total (Category) | 1 (25.0%) | 3 (75.0%) |
| Total (Overall) | 6 (26.1%) | 17 (73.9%) |
Production, Transportation and Moving Occupations
The most common Production, Transportation and Moving occupations in Old Agency are Material Moving (4 | 17.4%), and Transportation (2 | 8.7%).
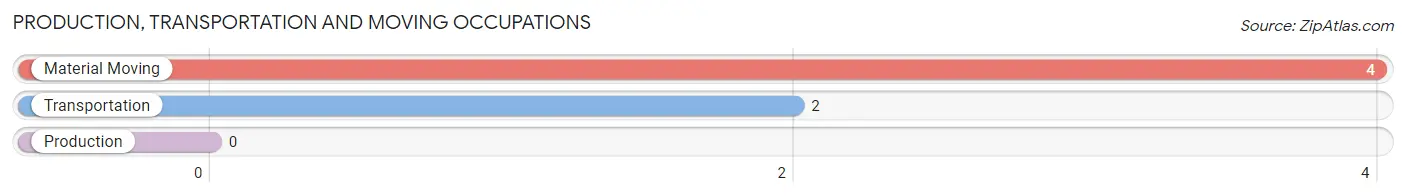
Production, Transportation and Moving Occupations by Sex
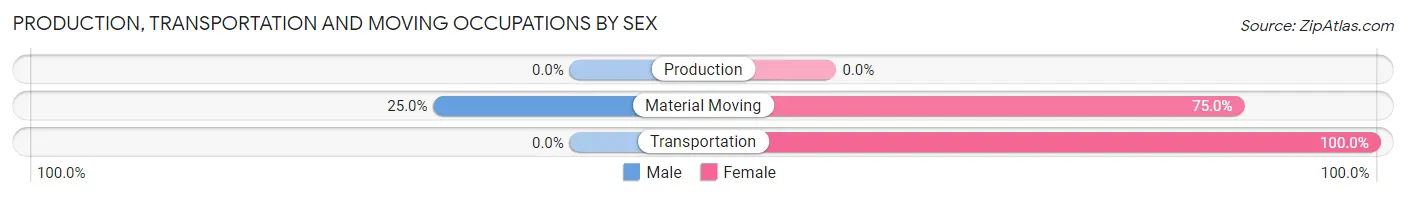
| Occupation | Male | Female |
| Production | 0 (0.0%) | 0 (0.0%) |
| Transportation | 0 (0.0%) | 2 (100.0%) |
| Material Moving | 1 (25.0%) | 3 (75.0%) |
| Total (Category) | 1 (16.7%) | 5 (83.3%) |
| Total (Overall) | 6 (26.1%) | 17 (73.9%) |
Employment Industries by Sex in Old Agency
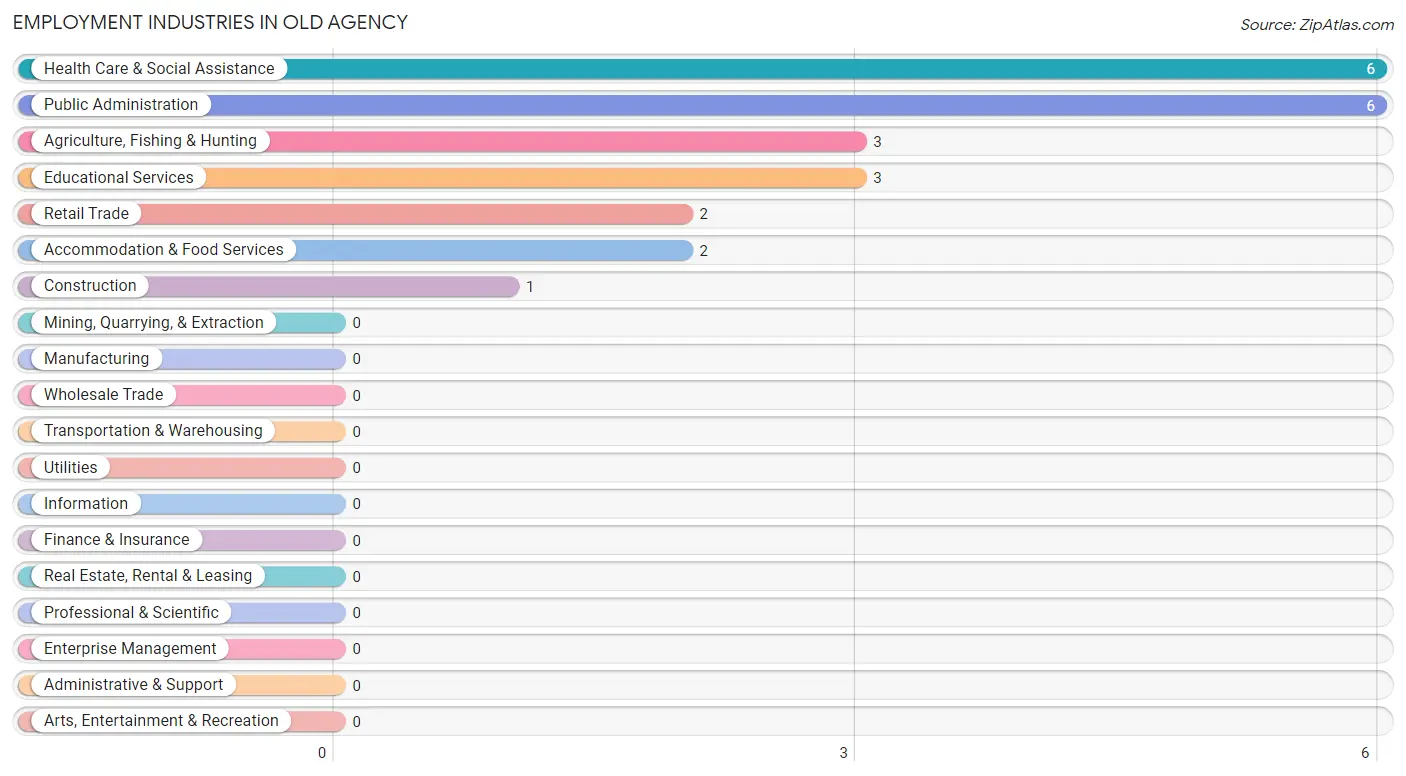
Employment Industries in Old Agency
The major employment industries in Old Agency include Health Care & Social Assistance (6 | 26.1%), Public Administration (6 | 26.1%), Agriculture, Fishing & Hunting (3 | 13.0%), Educational Services (3 | 13.0%), and Retail Trade (2 | 8.7%).
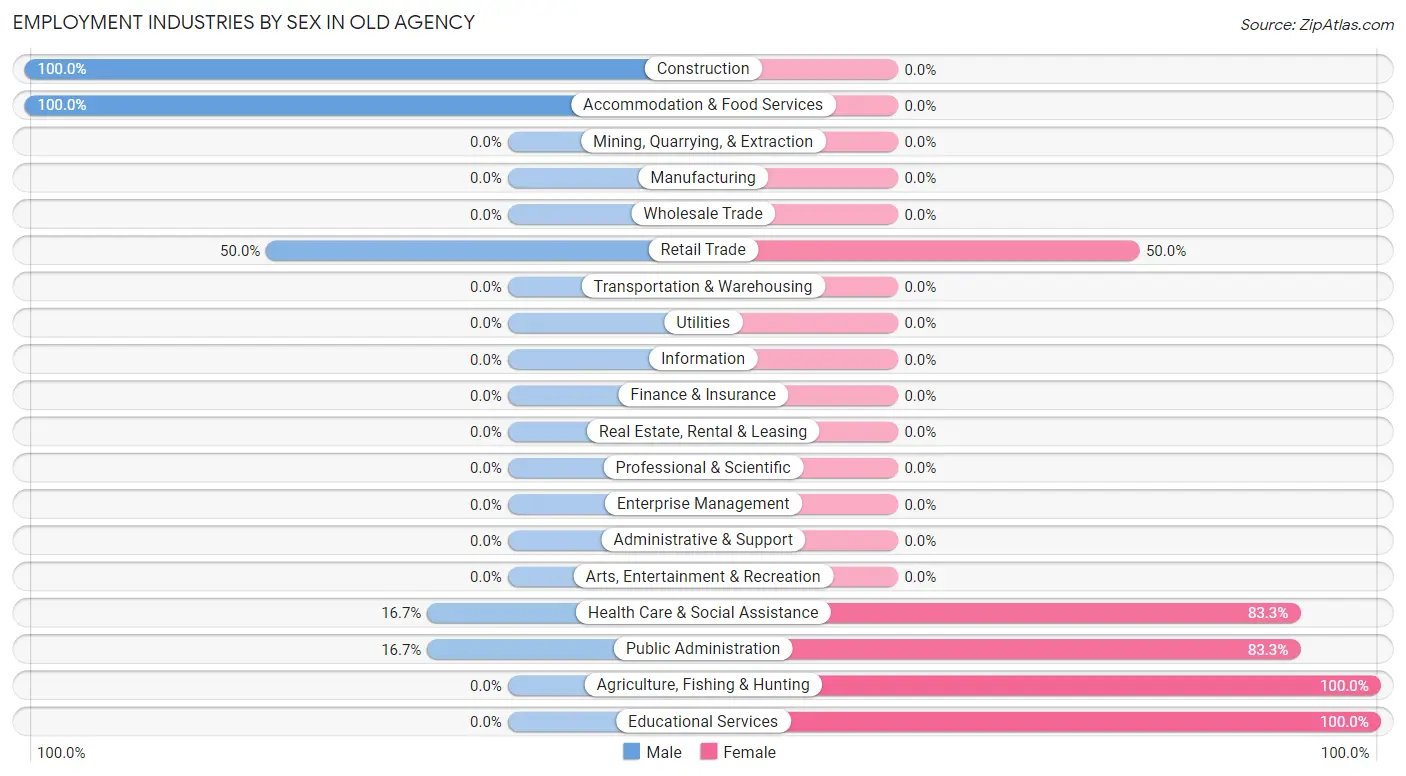
Employment Industries by Sex in Old Agency
The Old Agency industries that see more men than women are Construction (100.0%), Accommodation & Food Services (100.0%), and Retail Trade (50.0%), whereas the industries that tend to have a higher number of women are Agriculture, Fishing & Hunting (100.0%), Educational Services (100.0%), and Health Care & Social Assistance (83.3%).
| Industry | Male | Female |
| Agriculture, Fishing & Hunting | 0 (0.0%) | 3 (100.0%) |
| Mining, Quarrying, & Extraction | 0 (0.0%) | 0 (0.0%) |
| Construction | 1 (100.0%) | 0 (0.0%) |
| Manufacturing | 0 (0.0%) | 0 (0.0%) |
| Wholesale Trade | 0 (0.0%) | 0 (0.0%) |
| Retail Trade | 1 (50.0%) | 1 (50.0%) |
| Transportation & Warehousing | 0 (0.0%) | 0 (0.0%) |
| Utilities | 0 (0.0%) | 0 (0.0%) |
| Information | 0 (0.0%) | 0 (0.0%) |
| Finance & Insurance | 0 (0.0%) | 0 (0.0%) |
| Real Estate, Rental & Leasing | 0 (0.0%) | 0 (0.0%) |
| Professional & Scientific | 0 (0.0%) | 0 (0.0%) |
| Enterprise Management | 0 (0.0%) | 0 (0.0%) |
| Administrative & Support | 0 (0.0%) | 0 (0.0%) |
| Educational Services | 0 (0.0%) | 3 (100.0%) |
| Health Care & Social Assistance | 1 (16.7%) | 5 (83.3%) |
| Arts, Entertainment & Recreation | 0 (0.0%) | 0 (0.0%) |
| Accommodation & Food Services | 2 (100.0%) | 0 (0.0%) |
| Public Administration | 1 (16.7%) | 5 (83.3%) |
| Total | 6 (26.1%) | 17 (73.9%) |
Education in Old Agency
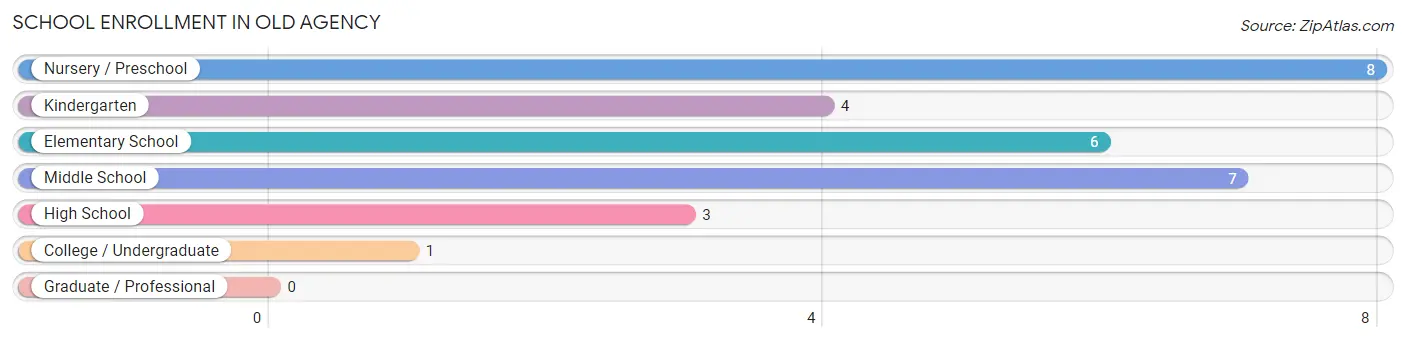
School Enrollment in Old Agency
The most common levels of schooling among the 29 students in Old Agency are nursery / preschool (8 | 27.6%), middle school (7 | 24.1%), and elementary school (6 | 20.7%).
| School Level | # Students | % Students |
| Nursery / Preschool | 8 | 27.6% |
| Kindergarten | 4 | 13.8% |
| Elementary School | 6 | 20.7% |
| Middle School | 7 | 24.1% |
| High School | 3 | 10.3% |
| College / Undergraduate | 1 | 3.5% |
| Graduate / Professional | 0 | 0.0% |
| Total | 29 | 100.0% |
School Enrollment by Age by Funding Source in Old Agency
Out of a total of 29 students who are enrolled in schools in Old Agency, 7 (24.1%) attend a private institution, while the remaining 22 (75.9%) are enrolled in public schools. The age group of 3 to 4 year olds has the highest likelihood of being enrolled in private schools, with 4 (50.0% in the age bracket) enrolled. Conversely, the age group of 15 to 17 year olds has the lowest likelihood of being enrolled in a private school, with 2 (100.0% in the age bracket) attending a public institution.
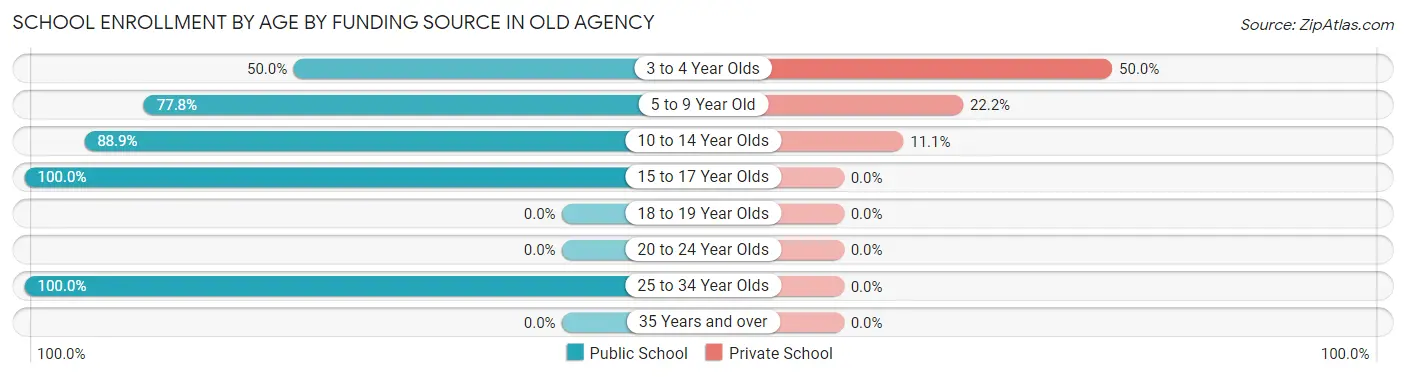
| Age Bracket | Public School | Private School |
| 3 to 4 Year Olds | 4 (50.0%) | 4 (50.0%) |
| 5 to 9 Year Old | 7 (77.8%) | 2 (22.2%) |
| 10 to 14 Year Olds | 8 (88.9%) | 1 (11.1%) |
| 15 to 17 Year Olds | 2 (100.0%) | 0 (0.0%) |
| 18 to 19 Year Olds | 0 (0.0%) | 0 (0.0%) |
| 20 to 24 Year Olds | 0 (0.0%) | 0 (0.0%) |
| 25 to 34 Year Olds | 1 (100.0%) | 0 (0.0%) |
| 35 Years and over | 0 (0.0%) | 0 (0.0%) |
| Total | 22 (75.9%) | 7 (24.1%) |
Educational Attainment by Field of Study in Old Agency
Education (2 | 50.0%), and literature & languages (2 | 50.0%) are the most common fields of study among 4 individuals in Old Agency who have obtained a bachelor's degree or higher.
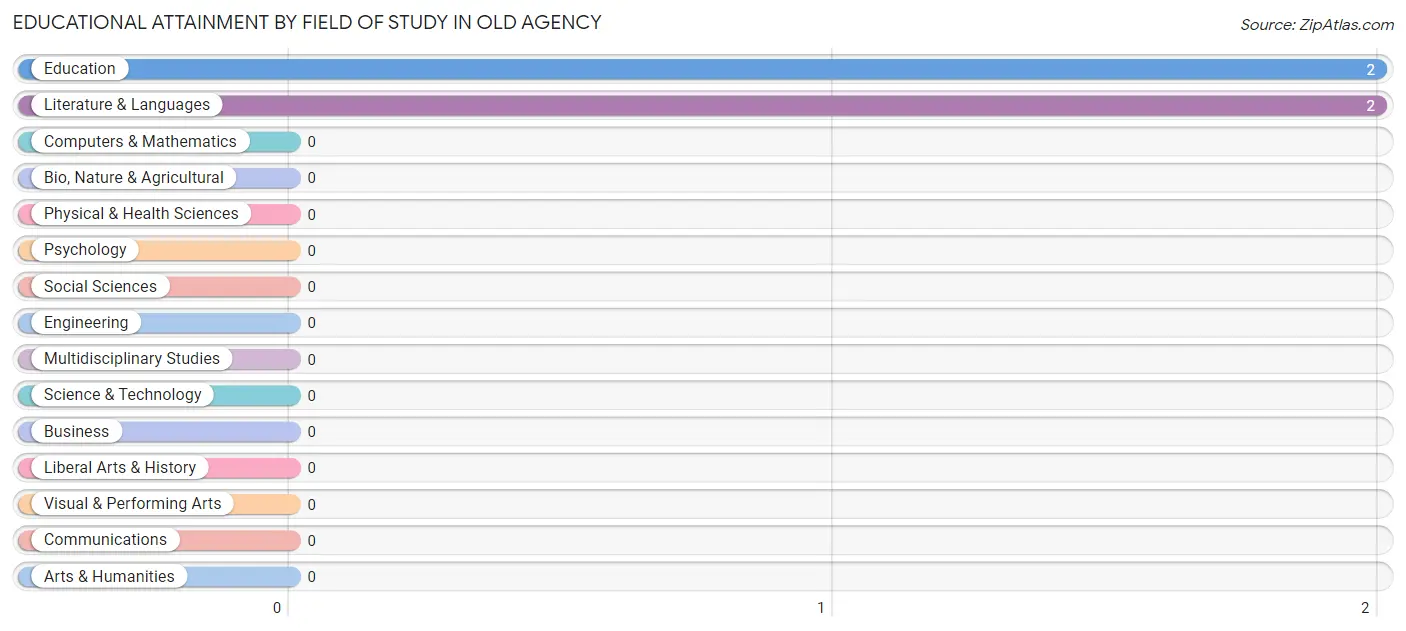
| Field of Study | # Graduates | % Graduates |
| Computers & Mathematics | 0 | 0.0% |
| Bio, Nature & Agricultural | 0 | 0.0% |
| Physical & Health Sciences | 0 | 0.0% |
| Psychology | 0 | 0.0% |
| Social Sciences | 0 | 0.0% |
| Engineering | 0 | 0.0% |
| Multidisciplinary Studies | 0 | 0.0% |
| Science & Technology | 0 | 0.0% |
| Business | 0 | 0.0% |
| Education | 2 | 50.0% |
| Literature & Languages | 2 | 50.0% |
| Liberal Arts & History | 0 | 0.0% |
| Visual & Performing Arts | 0 | 0.0% |
| Communications | 0 | 0.0% |
| Arts & Humanities | 0 | 0.0% |
| Total | 4 | 100.0% |
Transportation & Commute in Old Agency
Vehicle Availability by Sex in Old Agency
The most prevalent vehicle ownership categories in Old Agency are males with 4 vehicles (2, accounting for 33.3%) and females with 4 vehicles (5, making up 11.8%).
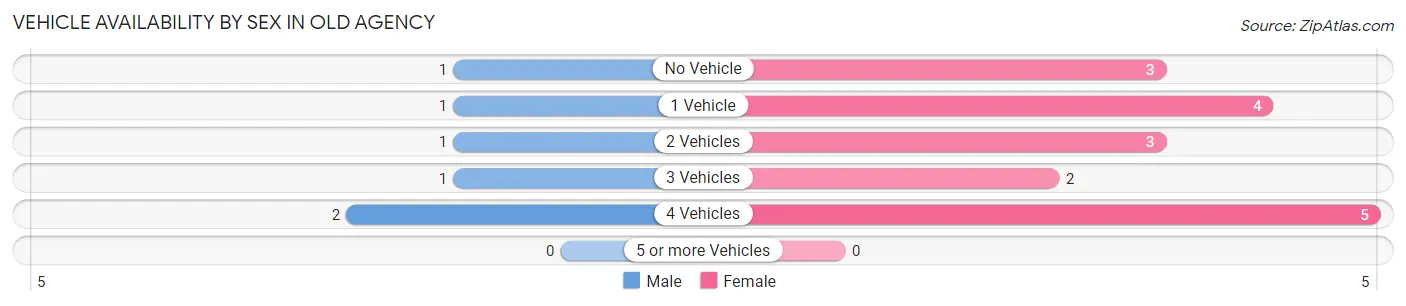
| Vehicles Available | Male | Female |
| No Vehicle | 1 (16.7%) | 3 (17.6%) |
| 1 Vehicle | 1 (16.7%) | 4 (23.5%) |
| 2 Vehicles | 1 (16.7%) | 3 (17.6%) |
| 3 Vehicles | 1 (16.7%) | 2 (11.8%) |
| 4 Vehicles | 2 (33.3%) | 5 (29.4%) |
| 5 or more Vehicles | 0 (0.0%) | 0 (0.0%) |
| Total | 6 (100.0%) | 17 (100.0%) |
Commute Time in Old Agency
The most frequently occuring commute durations in Old Agency are 10 to 14 minutes (7 commuters, 30.4%), 45 to 59 minutes (7 commuters, 30.4%), and 30 to 34 minutes (4 commuters, 17.4%).
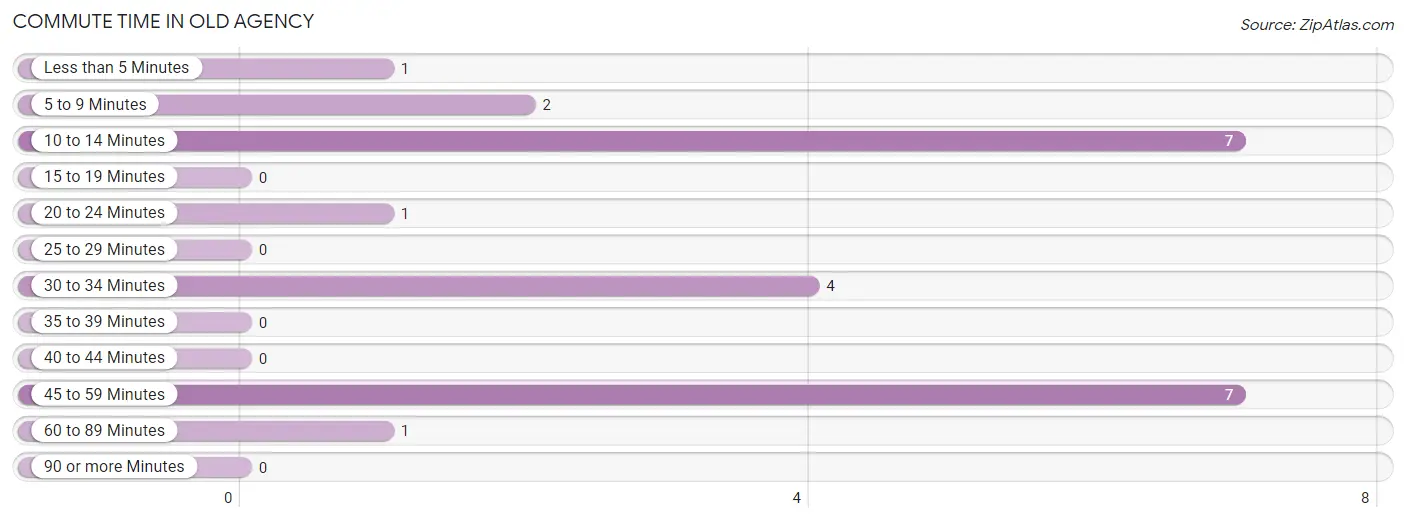
| Commute Time | # Commuters | % Commuters |
| Less than 5 Minutes | 1 | 4.3% |
| 5 to 9 Minutes | 2 | 8.7% |
| 10 to 14 Minutes | 7 | 30.4% |
| 15 to 19 Minutes | 0 | 0.0% |
| 20 to 24 Minutes | 1 | 4.3% |
| 25 to 29 Minutes | 0 | 0.0% |
| 30 to 34 Minutes | 4 | 17.4% |
| 35 to 39 Minutes | 0 | 0.0% |
| 40 to 44 Minutes | 0 | 0.0% |
| 45 to 59 Minutes | 7 | 30.4% |
| 60 to 89 Minutes | 1 | 4.3% |
| 90 or more Minutes | 0 | 0.0% |
Commute Time by Sex in Old Agency
The most common commute times in Old Agency are 10 to 14 minutes (4 commuters, 66.7%) for males and 45 to 59 minutes (6 commuters, 35.3%) for females.
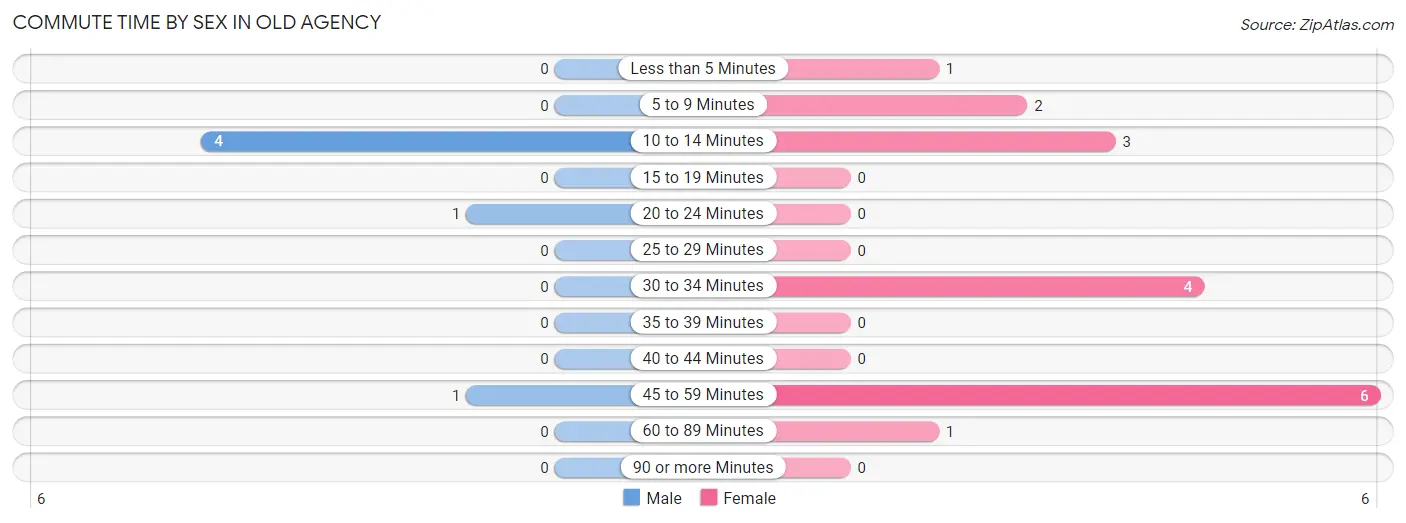
| Commute Time | Male | Female |
| Less than 5 Minutes | 0 (0.0%) | 1 (5.9%) |
| 5 to 9 Minutes | 0 (0.0%) | 2 (11.8%) |
| 10 to 14 Minutes | 4 (66.7%) | 3 (17.6%) |
| 15 to 19 Minutes | 0 (0.0%) | 0 (0.0%) |
| 20 to 24 Minutes | 1 (16.7%) | 0 (0.0%) |
| 25 to 29 Minutes | 0 (0.0%) | 0 (0.0%) |
| 30 to 34 Minutes | 0 (0.0%) | 4 (23.5%) |
| 35 to 39 Minutes | 0 (0.0%) | 0 (0.0%) |
| 40 to 44 Minutes | 0 (0.0%) | 0 (0.0%) |
| 45 to 59 Minutes | 1 (16.7%) | 6 (35.3%) |
| 60 to 89 Minutes | 0 (0.0%) | 1 (5.9%) |
| 90 or more Minutes | 0 (0.0%) | 0 (0.0%) |
Time of Departure to Work by Sex in Old Agency
The most frequent times of departure to work in Old Agency are 10:00 AM to 10:59 AM (3, 50.0%) for males and 6:00 AM to 6:29 AM (9, 52.9%) for females.
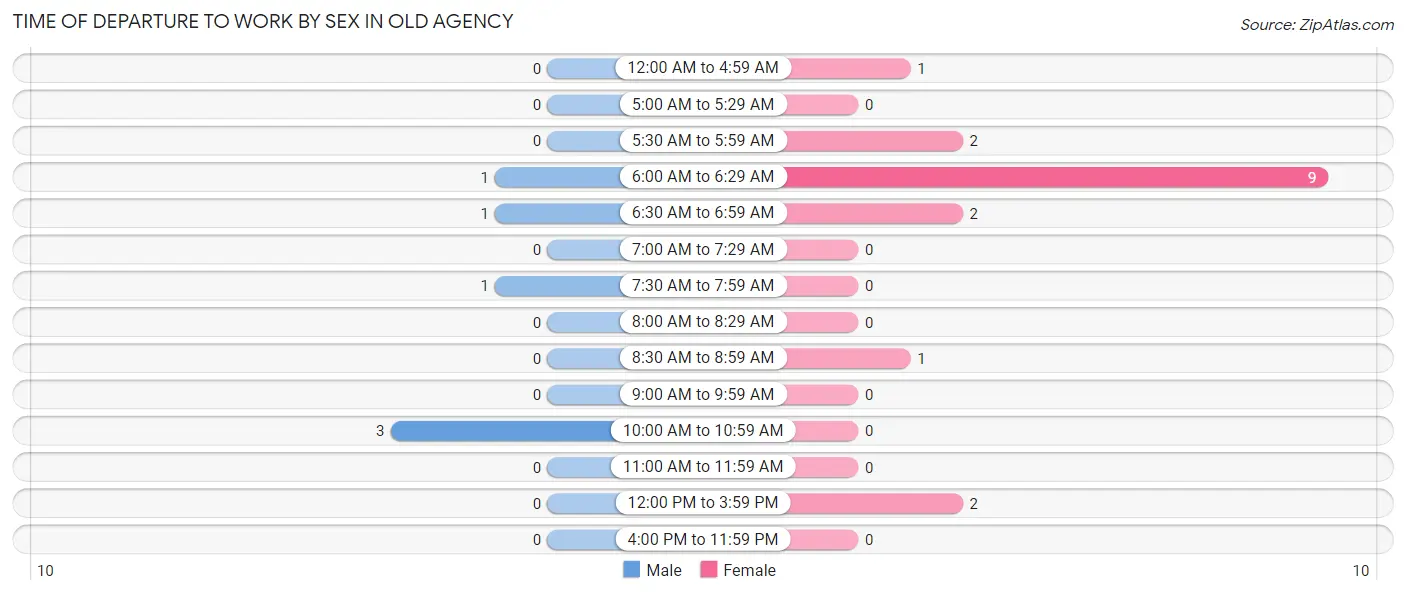
| Time of Departure | Male | Female |
| 12:00 AM to 4:59 AM | 0 (0.0%) | 1 (5.9%) |
| 5:00 AM to 5:29 AM | 0 (0.0%) | 0 (0.0%) |
| 5:30 AM to 5:59 AM | 0 (0.0%) | 2 (11.8%) |
| 6:00 AM to 6:29 AM | 1 (16.7%) | 9 (52.9%) |
| 6:30 AM to 6:59 AM | 1 (16.7%) | 2 (11.8%) |
| 7:00 AM to 7:29 AM | 0 (0.0%) | 0 (0.0%) |
| 7:30 AM to 7:59 AM | 1 (16.7%) | 0 (0.0%) |
| 8:00 AM to 8:29 AM | 0 (0.0%) | 0 (0.0%) |
| 8:30 AM to 8:59 AM | 0 (0.0%) | 1 (5.9%) |
| 9:00 AM to 9:59 AM | 0 (0.0%) | 0 (0.0%) |
| 10:00 AM to 10:59 AM | 3 (50.0%) | 0 (0.0%) |
| 11:00 AM to 11:59 AM | 0 (0.0%) | 0 (0.0%) |
| 12:00 PM to 3:59 PM | 0 (0.0%) | 2 (11.8%) |
| 4:00 PM to 11:59 PM | 0 (0.0%) | 0 (0.0%) |
| Total | 6 (100.0%) | 17 (100.0%) |
Housing Occupancy in Old Agency
Occupancy by Ownership in Old Agency
Of the total 20 dwellings in Old Agency, owner-occupied units account for 11 (55.0%), while renter-occupied units make up 9 (45.0%).
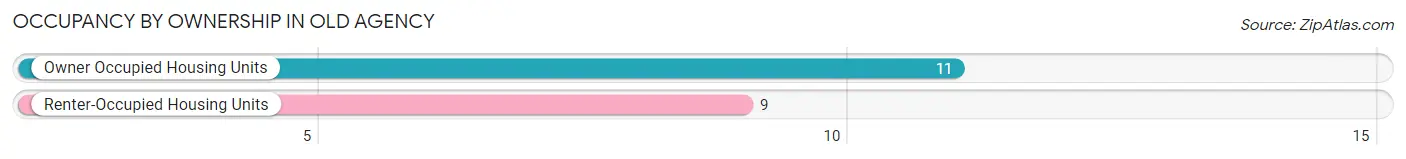
| Occupancy | # Housing Units | % Housing Units |
| Owner Occupied Housing Units | 11 | 55.0% |
| Renter-Occupied Housing Units | 9 | 45.0% |
| Total Occupied Housing Units | 20 | 100.0% |
Occupancy by Household Size in Old Agency
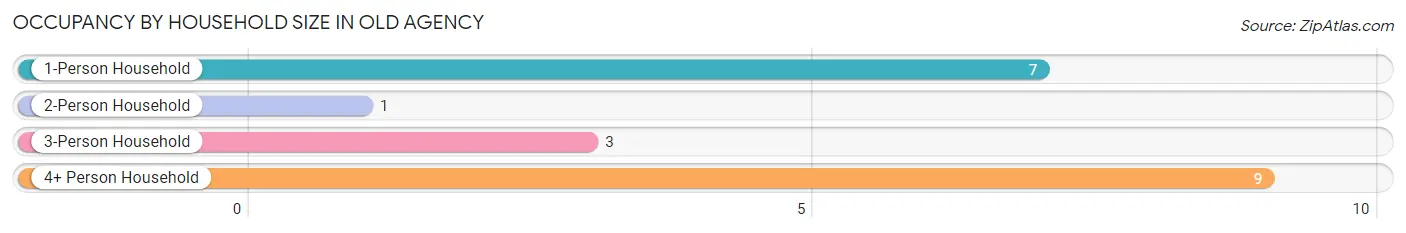
| Household Size | # Housing Units | % Housing Units |
| 1-Person Household | 7 | 35.0% |
| 2-Person Household | 1 | 5.0% |
| 3-Person Household | 3 | 15.0% |
| 4+ Person Household | 9 | 45.0% |
| Total Housing Units | 20 | 100.0% |
Occupancy by Ownership by Household Size in Old Agency
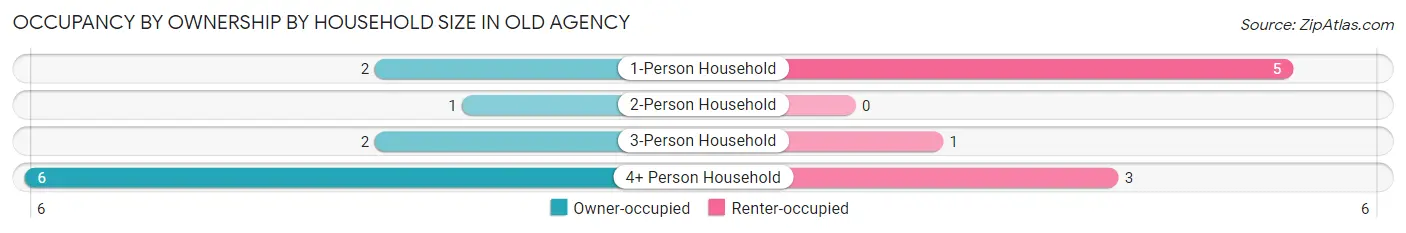
| Household Size | Owner-occupied | Renter-occupied |
| 1-Person Household | 2 (28.6%) | 5 (71.4%) |
| 2-Person Household | 1 (100.0%) | 0 (0.0%) |
| 3-Person Household | 2 (66.7%) | 1 (33.3%) |
| 4+ Person Household | 6 (66.7%) | 3 (33.3%) |
| Total Housing Units | 11 (55.0%) | 9 (45.0%) |
Occupancy by Educational Attainment in Old Agency
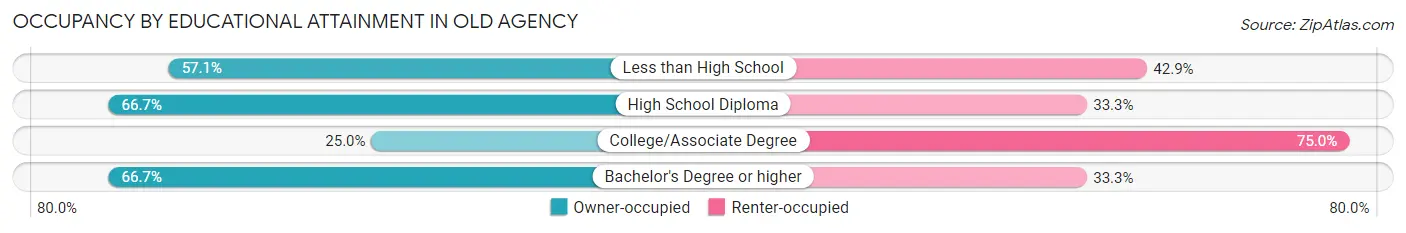
| Household Size | Owner-occupied | Renter-occupied |
| Less than High School | 4 (57.1%) | 3 (42.9%) |
| High School Diploma | 4 (66.7%) | 2 (33.3%) |
| College/Associate Degree | 1 (25.0%) | 3 (75.0%) |
| Bachelor's Degree or higher | 2 (66.7%) | 1 (33.3%) |
Occupancy by Age of Householder in Old Agency
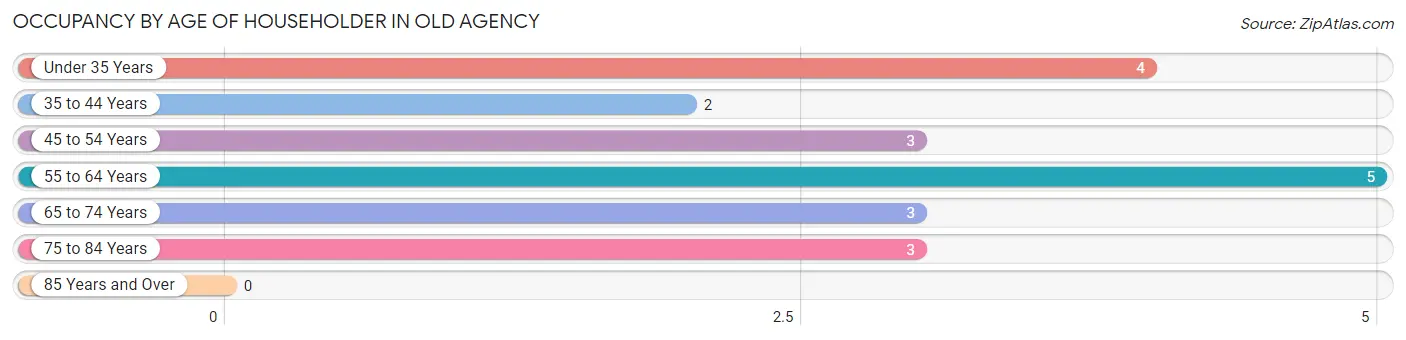
| Age Bracket | # Households | % Households |
| Under 35 Years | 4 | 20.0% |
| 35 to 44 Years | 2 | 10.0% |
| 45 to 54 Years | 3 | 15.0% |
| 55 to 64 Years | 5 | 25.0% |
| 65 to 74 Years | 3 | 15.0% |
| 75 to 84 Years | 3 | 15.0% |
| 85 Years and Over | 0 | 0.0% |
| Total | 20 | 100.0% |
Housing Finances in Old Agency
Median Income by Occupancy in Old Agency
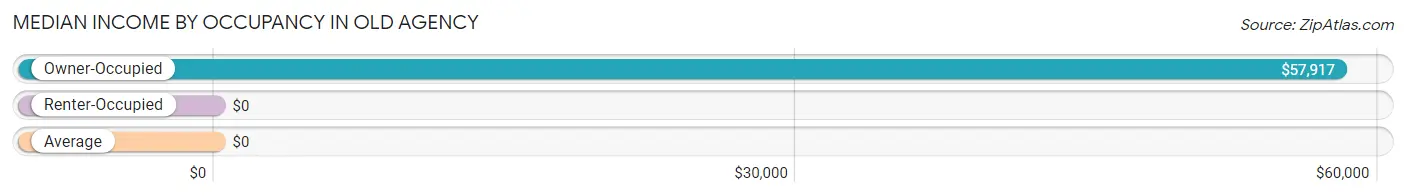
| Occupancy Type | # Households | Median Income |
| Owner-Occupied | 11 (55.0%) | $57,917 |
| Renter-Occupied | 9 (45.0%) | $0 |
| Average | 20 (100.0%) | $0 |
Occupancy by Householder Income Bracket in Old Agency
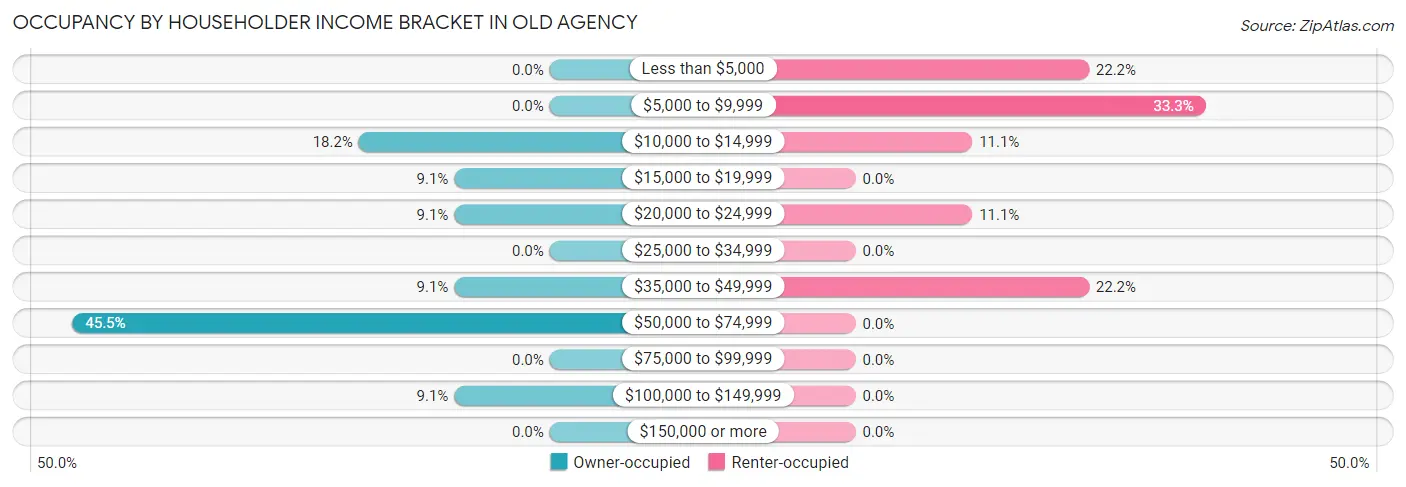
| Income Bracket | Owner-occupied | Renter-occupied |
| Less than $5,000 | 0 (0.0%) | 2 (22.2%) |
| $5,000 to $9,999 | 0 (0.0%) | 3 (33.3%) |
| $10,000 to $14,999 | 2 (18.2%) | 1 (11.1%) |
| $15,000 to $19,999 | 1 (9.1%) | 0 (0.0%) |
| $20,000 to $24,999 | 1 (9.1%) | 1 (11.1%) |
| $25,000 to $34,999 | 0 (0.0%) | 0 (0.0%) |
| $35,000 to $49,999 | 1 (9.1%) | 2 (22.2%) |
| $50,000 to $74,999 | 5 (45.5%) | 0 (0.0%) |
| $75,000 to $99,999 | 0 (0.0%) | 0 (0.0%) |
| $100,000 to $149,999 | 1 (9.1%) | 0 (0.0%) |
| $150,000 or more | 0 (0.0%) | 0 (0.0%) |
| Total | 11 (100.0%) | 9 (100.0%) |
Monthly Housing Cost Tiers in Old Agency
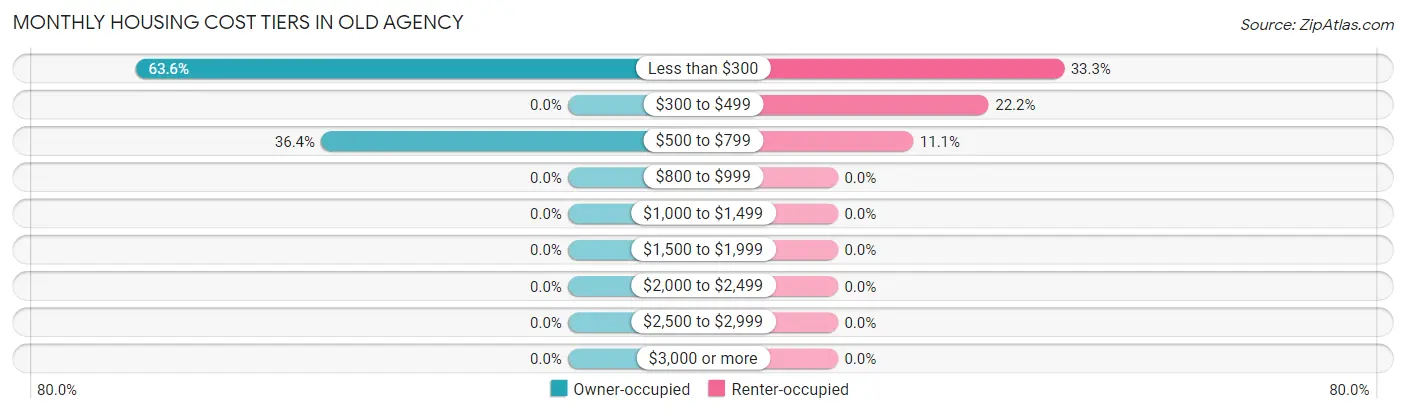
| Monthly Cost | Owner-occupied | Renter-occupied |
| Less than $300 | 7 (63.6%) | 3 (33.3%) |
| $300 to $499 | 0 (0.0%) | 2 (22.2%) |
| $500 to $799 | 4 (36.4%) | 1 (11.1%) |
| $800 to $999 | 0 (0.0%) | 0 (0.0%) |
| $1,000 to $1,499 | 0 (0.0%) | 0 (0.0%) |
| $1,500 to $1,999 | 0 (0.0%) | 0 (0.0%) |
| $2,000 to $2,499 | 0 (0.0%) | 0 (0.0%) |
| $2,500 to $2,999 | 0 (0.0%) | 0 (0.0%) |
| $3,000 or more | 0 (0.0%) | 0 (0.0%) |
| Total | 11 (100.0%) | 9 (100.0%) |
Physical Housing Characteristics in Old Agency
Housing Structures in Old Agency
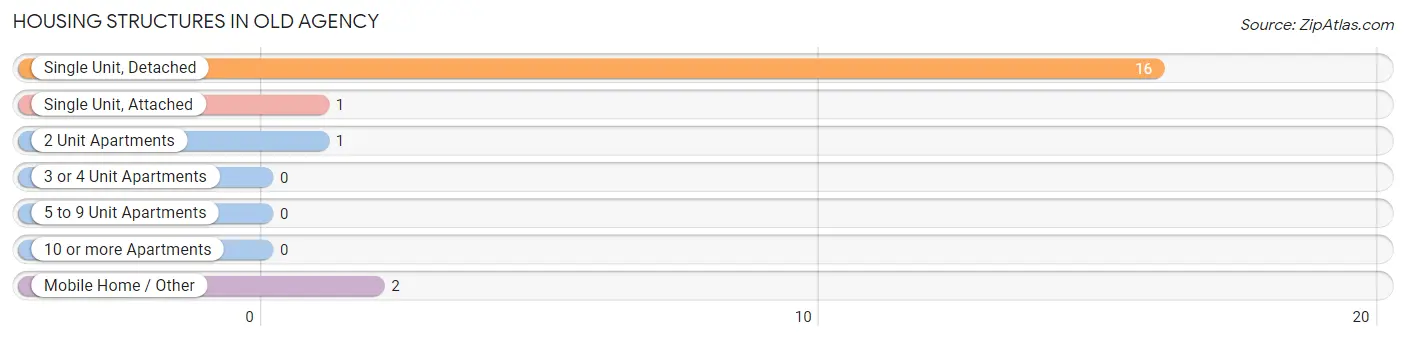
| Structure Type | # Housing Units | % Housing Units |
| Single Unit, Detached | 16 | 80.0% |
| Single Unit, Attached | 1 | 5.0% |
| 2 Unit Apartments | 1 | 5.0% |
| 3 or 4 Unit Apartments | 0 | 0.0% |
| 5 to 9 Unit Apartments | 0 | 0.0% |
| 10 or more Apartments | 0 | 0.0% |
| Mobile Home / Other | 2 | 10.0% |
| Total | 20 | 100.0% |
Housing Structures by Occupancy in Old Agency
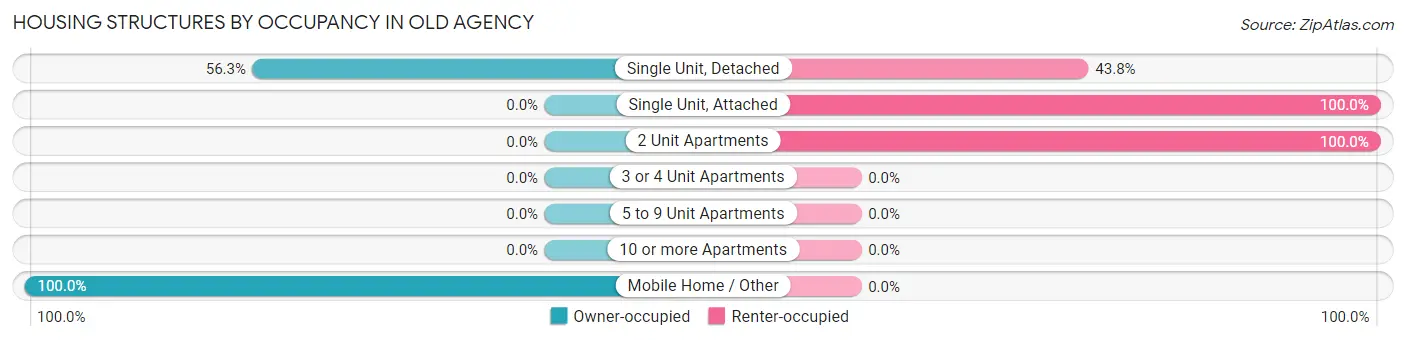
| Structure Type | Owner-occupied | Renter-occupied |
| Single Unit, Detached | 9 (56.2%) | 7 (43.8%) |
| Single Unit, Attached | 0 (0.0%) | 1 (100.0%) |
| 2 Unit Apartments | 0 (0.0%) | 1 (100.0%) |
| 3 or 4 Unit Apartments | 0 (0.0%) | 0 (0.0%) |
| 5 to 9 Unit Apartments | 0 (0.0%) | 0 (0.0%) |
| 10 or more Apartments | 0 (0.0%) | 0 (0.0%) |
| Mobile Home / Other | 2 (100.0%) | 0 (0.0%) |
| Total | 11 (55.0%) | 9 (45.0%) |
Housing Structures by Number of Rooms in Old Agency
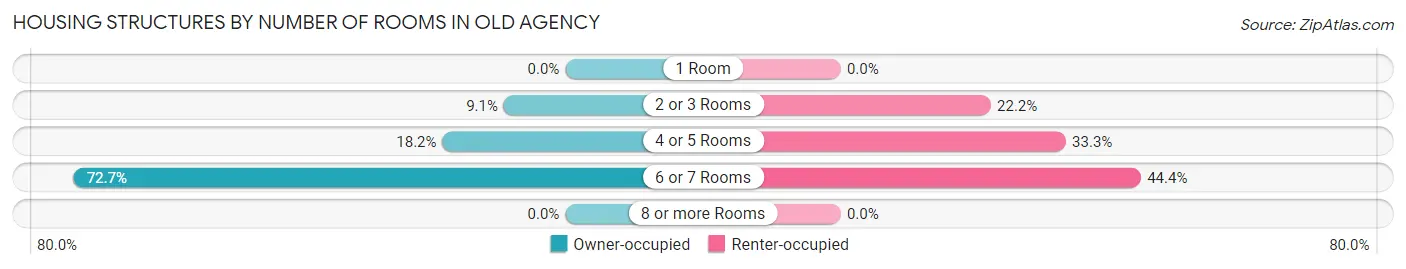
| Number of Rooms | Owner-occupied | Renter-occupied |
| 1 Room | 0 (0.0%) | 0 (0.0%) |
| 2 or 3 Rooms | 1 (9.1%) | 2 (22.2%) |
| 4 or 5 Rooms | 2 (18.2%) | 3 (33.3%) |
| 6 or 7 Rooms | 8 (72.7%) | 4 (44.4%) |
| 8 or more Rooms | 0 (0.0%) | 0 (0.0%) |
| Total | 11 (100.0%) | 9 (100.0%) |
Housing Structure by Heating Type in Old Agency
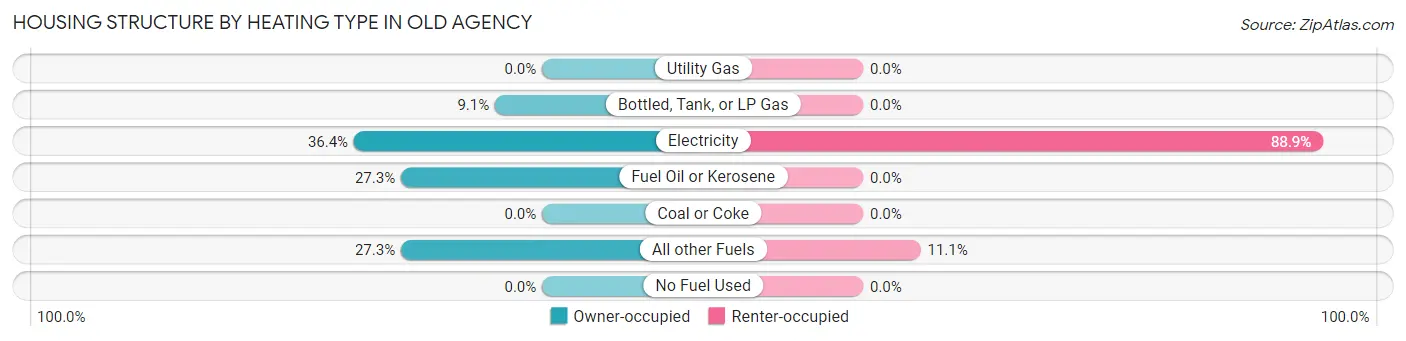
| Heating Type | Owner-occupied | Renter-occupied |
| Utility Gas | 0 (0.0%) | 0 (0.0%) |
| Bottled, Tank, or LP Gas | 1 (9.1%) | 0 (0.0%) |
| Electricity | 4 (36.4%) | 8 (88.9%) |
| Fuel Oil or Kerosene | 3 (27.3%) | 0 (0.0%) |
| Coal or Coke | 0 (0.0%) | 0 (0.0%) |
| All other Fuels | 3 (27.3%) | 1 (11.1%) |
| No Fuel Used | 0 (0.0%) | 0 (0.0%) |
| Total | 11 (100.0%) | 9 (100.0%) |
Household Vehicle Usage in Old Agency
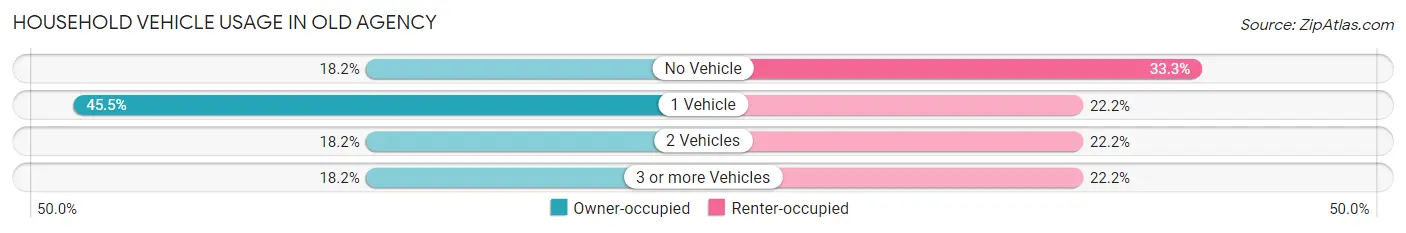
| Vehicles per Household | Owner-occupied | Renter-occupied |
| No Vehicle | 2 (18.2%) | 3 (33.3%) |
| 1 Vehicle | 5 (45.5%) | 2 (22.2%) |
| 2 Vehicles | 2 (18.2%) | 2 (22.2%) |
| 3 or more Vehicles | 2 (18.2%) | 2 (22.2%) |
| Total | 11 (100.0%) | 9 (100.0%) |
Real Estate & Mortgages in Old Agency
Real Estate and Mortgage Overview in Old Agency
| Characteristic | Without Mortgage | With Mortgage |
| Housing Units | 9 | 2 |
| Median Property Value | - | - |
| Median Household Income | - | - |
| Monthly Housing Costs | $213 | $0 |
| Real Estate Taxes | - | - |
Property Value by Mortgage Status in Old Agency
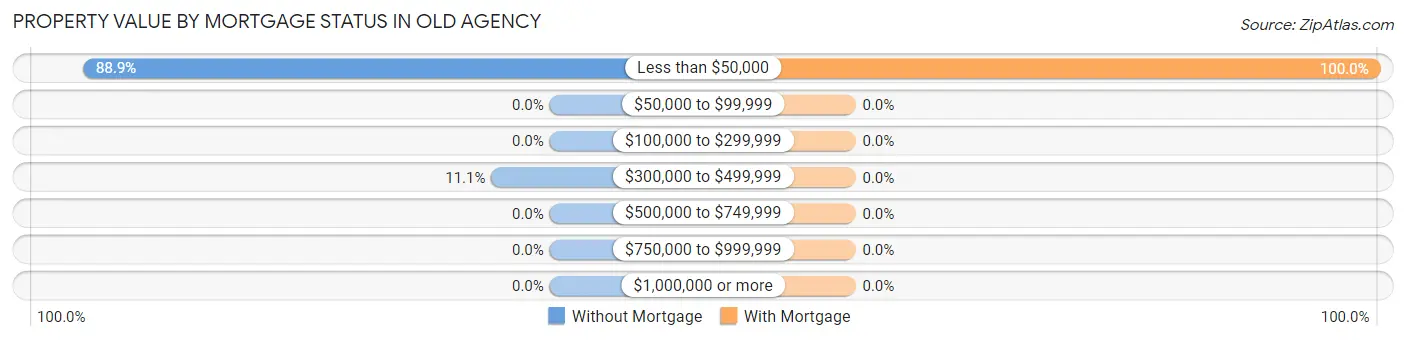
| Property Value | Without Mortgage | With Mortgage |
| Less than $50,000 | 8 (88.9%) | 2 (100.0%) |
| $50,000 to $99,999 | 0 (0.0%) | 0 (0.0%) |
| $100,000 to $299,999 | 0 (0.0%) | 0 (0.0%) |
| $300,000 to $499,999 | 1 (11.1%) | 0 (0.0%) |
| $500,000 to $749,999 | 0 (0.0%) | 0 (0.0%) |
| $750,000 to $999,999 | 0 (0.0%) | 0 (0.0%) |
| $1,000,000 or more | 0 (0.0%) | 0 (0.0%) |
| Total | 9 (100.0%) | 2 (100.0%) |
Household Income by Mortgage Status in Old Agency
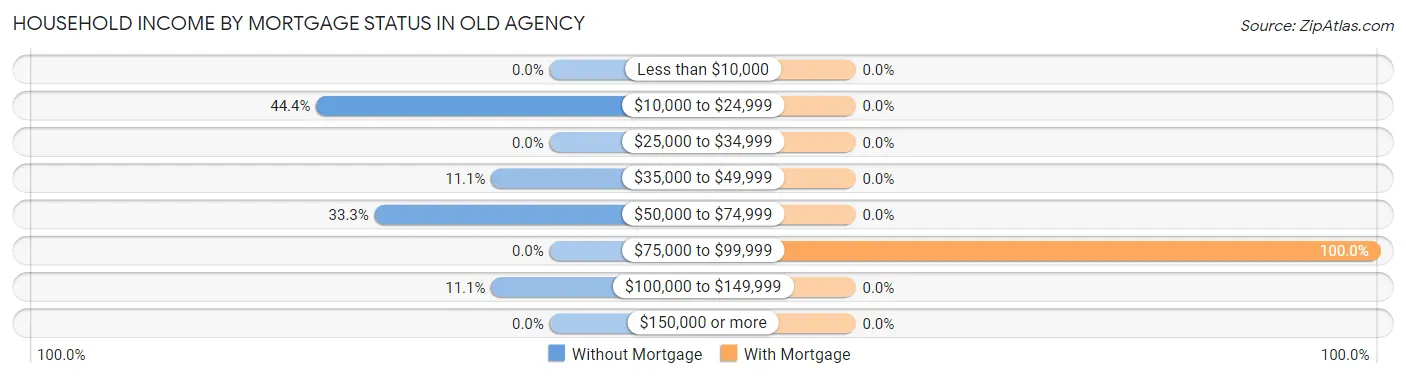
| Household Income | Without Mortgage | With Mortgage |
| Less than $10,000 | 0 (0.0%) | 0 (0.0%) |
| $10,000 to $24,999 | 4 (44.4%) | 0 (0.0%) |
| $25,000 to $34,999 | 0 (0.0%) | 0 (0.0%) |
| $35,000 to $49,999 | 1 (11.1%) | 0 (0.0%) |
| $50,000 to $74,999 | 3 (33.3%) | 0 (0.0%) |
| $75,000 to $99,999 | 0 (0.0%) | 2 (100.0%) |
| $100,000 to $149,999 | 1 (11.1%) | 0 (0.0%) |
| $150,000 or more | 0 (0.0%) | 0 (0.0%) |
| Total | 9 (100.0%) | 2 (100.0%) |
Property Value to Household Income Ratio in Old Agency
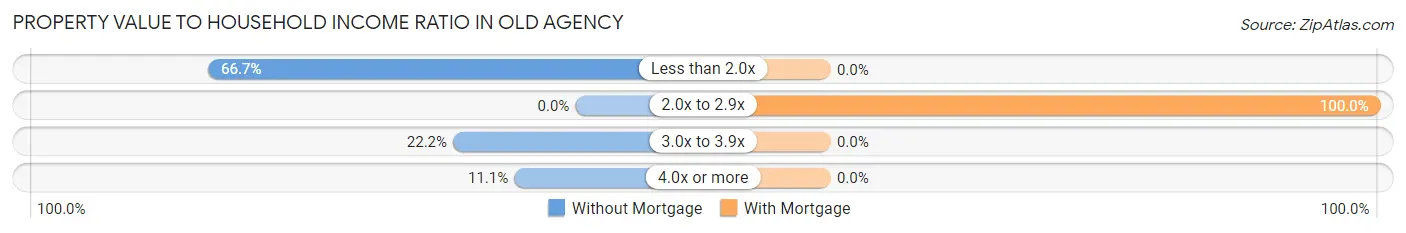
| Value-to-Income Ratio | Without Mortgage | With Mortgage |
| Less than 2.0x | 6 (66.7%) | 0 (0.0%) |
| 2.0x to 2.9x | 0 (0.0%) | 2 (100.0%) |
| 3.0x to 3.9x | 2 (22.2%) | 0 (0.0%) |
| 4.0x or more | 1 (11.1%) | 0 (0.0%) |
| Total | 9 (100.0%) | 2 (100.0%) |
Real Estate Taxes by Mortgage Status in Old Agency
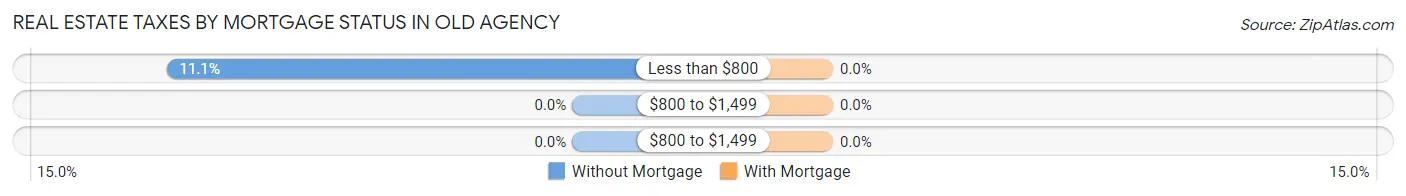
| Property Taxes | Without Mortgage | With Mortgage |
| Less than $800 | 1 (11.1%) | 0 (0.0%) |
| $800 to $1,499 | 0 (0.0%) | 0 (0.0%) |
| $800 to $1,499 | 0 (0.0%) | 0 (0.0%) |
| Total | 9 (100.0%) | 2 (100.0%) |
Health & Disability in Old Agency
Health Insurance Coverage by Age in Old Agency
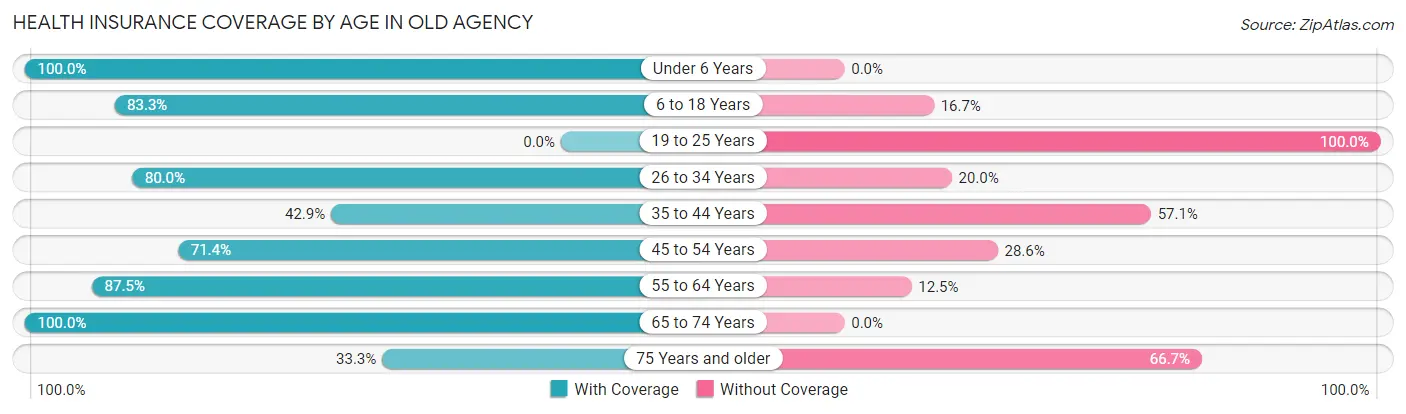
| Age Bracket | With Coverage | Without Coverage |
| Under 6 Years | 20 (100.0%) | 0 (0.0%) |
| 6 to 18 Years | 20 (83.3%) | 4 (16.7%) |
| 19 to 25 Years | 0 (0.0%) | 3 (100.0%) |
| 26 to 34 Years | 8 (80.0%) | 2 (20.0%) |
| 35 to 44 Years | 3 (42.9%) | 4 (57.1%) |
| 45 to 54 Years | 5 (71.4%) | 2 (28.6%) |
| 55 to 64 Years | 7 (87.5%) | 1 (12.5%) |
| 65 to 74 Years | 3 (100.0%) | 0 (0.0%) |
| 75 Years and older | 1 (33.3%) | 2 (66.7%) |
| Total | 67 (78.8%) | 18 (21.2%) |
Health Insurance Coverage by Citizenship Status in Old Agency
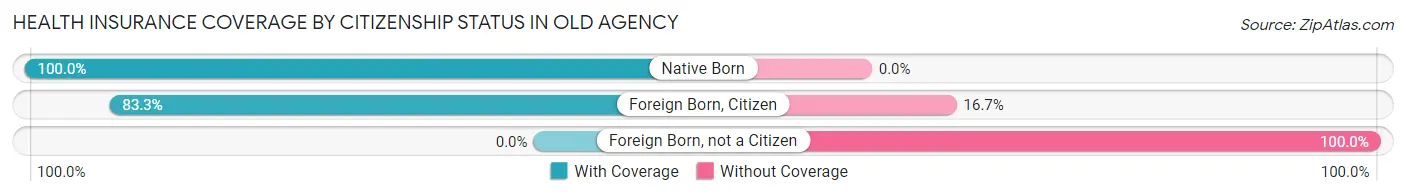
| Citizenship Status | With Coverage | Without Coverage |
| Native Born | 20 (100.0%) | 0 (0.0%) |
| Foreign Born, Citizen | 20 (83.3%) | 4 (16.7%) |
| Foreign Born, not a Citizen | 0 (0.0%) | 3 (100.0%) |
Health Insurance Coverage by Household Income in Old Agency
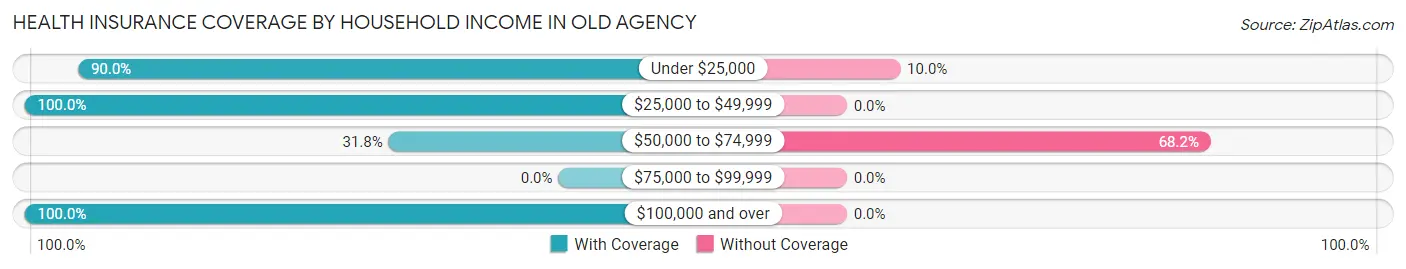
| Household Income | With Coverage | Without Coverage |
| Under $25,000 | 27 (90.0%) | 3 (10.0%) |
| $25,000 to $49,999 | 28 (100.0%) | 0 (0.0%) |
| $50,000 to $74,999 | 7 (31.8%) | 15 (68.2%) |
| $75,000 to $99,999 | 0 (0.0%) | 0 (0.0%) |
| $100,000 and over | 5 (100.0%) | 0 (0.0%) |
Public vs Private Health Insurance Coverage by Age in Old Agency
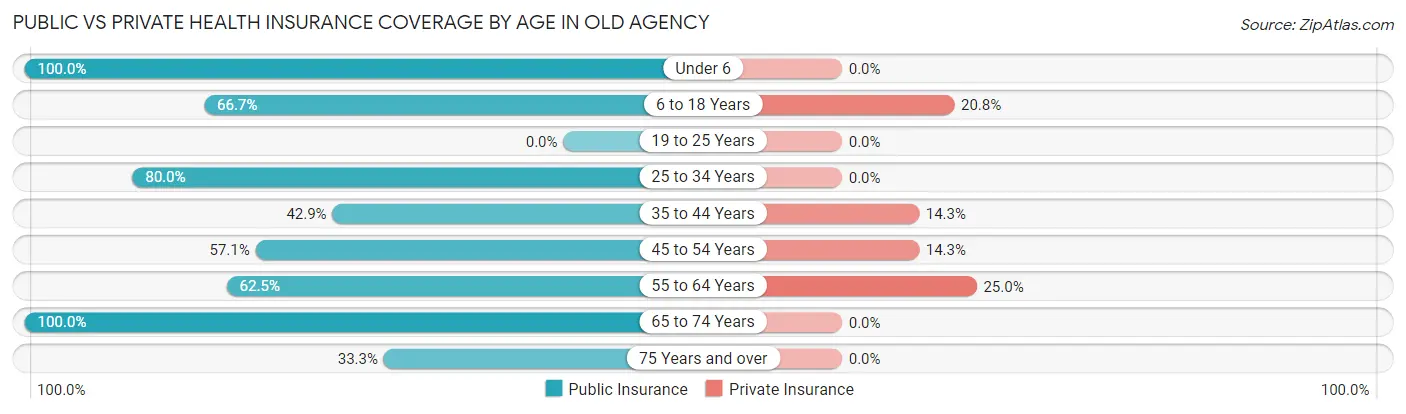
| Age Bracket | Public Insurance | Private Insurance |
| Under 6 | 20 (100.0%) | 0 (0.0%) |
| 6 to 18 Years | 16 (66.7%) | 5 (20.8%) |
| 19 to 25 Years | 0 (0.0%) | 0 (0.0%) |
| 25 to 34 Years | 8 (80.0%) | 0 (0.0%) |
| 35 to 44 Years | 3 (42.9%) | 1 (14.3%) |
| 45 to 54 Years | 4 (57.1%) | 1 (14.3%) |
| 55 to 64 Years | 5 (62.5%) | 2 (25.0%) |
| 65 to 74 Years | 3 (100.0%) | 0 (0.0%) |
| 75 Years and over | 1 (33.3%) | 0 (0.0%) |
| Total | 60 (70.6%) | 9 (10.6%) |
Disability Status by Sex by Age in Old Agency
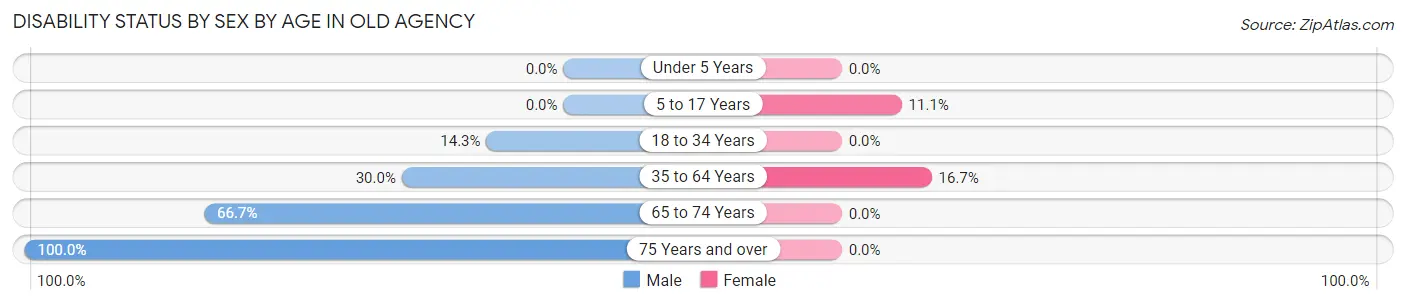
| Age Bracket | Male | Female |
| Under 5 Years | 0 (0.0%) | 0 (0.0%) |
| 5 to 17 Years | 0 (0.0%) | 1 (11.1%) |
| 18 to 34 Years | 1 (14.3%) | 0 (0.0%) |
| 35 to 64 Years | 3 (30.0%) | 2 (16.7%) |
| 65 to 74 Years | 2 (66.7%) | 0 (0.0%) |
| 75 Years and over | 1 (100.0%) | 0 (0.0%) |
Disability Class by Sex by Age in Old Agency
Disability Class: Hearing Difficulty
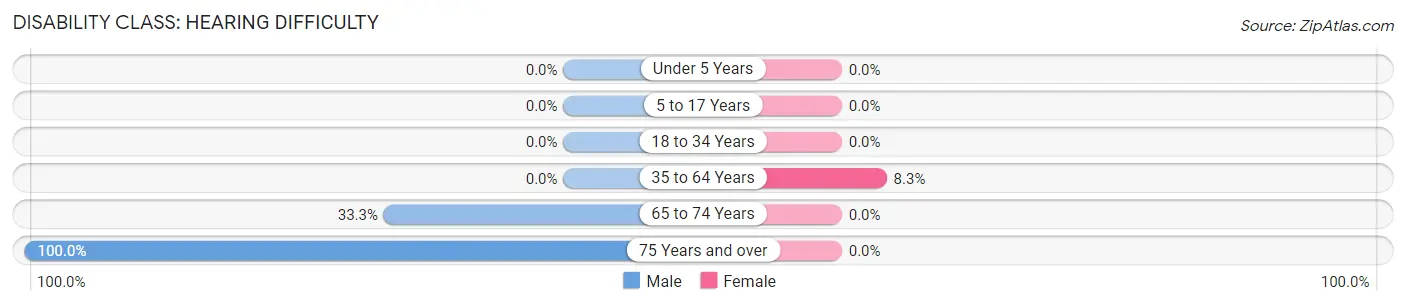
| Age Bracket | Male | Female |
| Under 5 Years | 0 (0.0%) | 0 (0.0%) |
| 5 to 17 Years | 0 (0.0%) | 0 (0.0%) |
| 18 to 34 Years | 0 (0.0%) | 0 (0.0%) |
| 35 to 64 Years | 0 (0.0%) | 1 (8.3%) |
| 65 to 74 Years | 1 (33.3%) | 0 (0.0%) |
| 75 Years and over | 1 (100.0%) | 0 (0.0%) |
Disability Class: Vision Difficulty
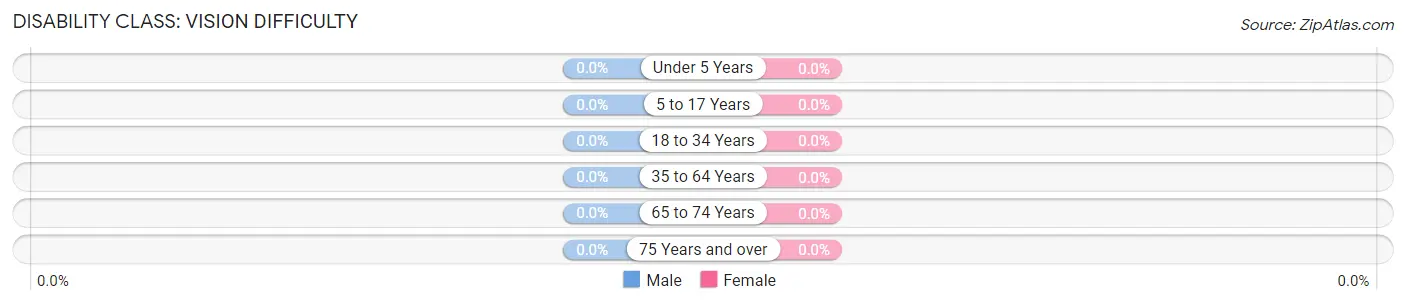
| Age Bracket | Male | Female |
| Under 5 Years | 0 (0.0%) | 0 (0.0%) |
| 5 to 17 Years | 0 (0.0%) | 0 (0.0%) |
| 18 to 34 Years | 0 (0.0%) | 0 (0.0%) |
| 35 to 64 Years | 0 (0.0%) | 0 (0.0%) |
| 65 to 74 Years | 0 (0.0%) | 0 (0.0%) |
| 75 Years and over | 0 (0.0%) | 0 (0.0%) |
Disability Class: Cognitive Difficulty
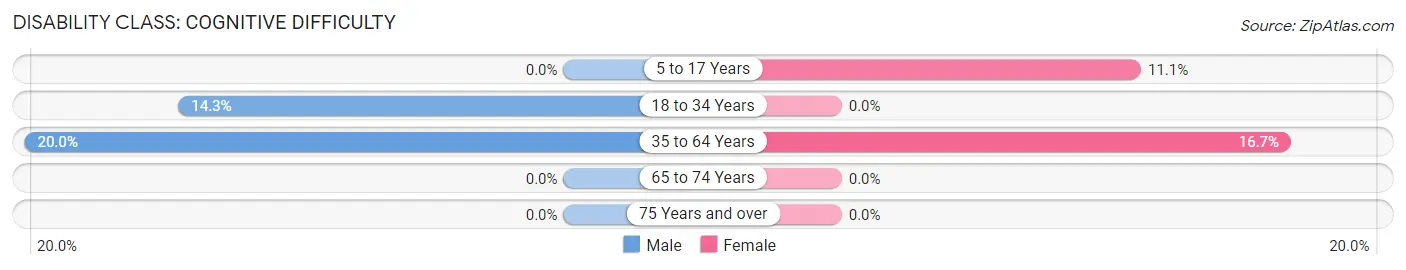
| Age Bracket | Male | Female |
| 5 to 17 Years | 0 (0.0%) | 1 (11.1%) |
| 18 to 34 Years | 1 (14.3%) | 0 (0.0%) |
| 35 to 64 Years | 2 (20.0%) | 2 (16.7%) |
| 65 to 74 Years | 0 (0.0%) | 0 (0.0%) |
| 75 Years and over | 0 (0.0%) | 0 (0.0%) |
Disability Class: Ambulatory Difficulty
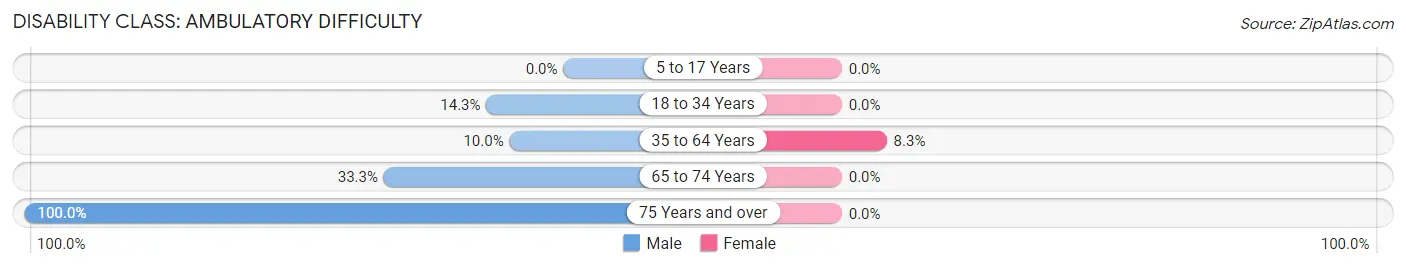
| Age Bracket | Male | Female |
| 5 to 17 Years | 0 (0.0%) | 0 (0.0%) |
| 18 to 34 Years | 1 (14.3%) | 0 (0.0%) |
| 35 to 64 Years | 1 (10.0%) | 1 (8.3%) |
| 65 to 74 Years | 1 (33.3%) | 0 (0.0%) |
| 75 Years and over | 1 (100.0%) | 0 (0.0%) |
Disability Class: Self-Care Difficulty
| Age Bracket | Male | Female |
| 5 to 17 Years | 0 (0.0%) | 0 (0.0%) |
| 18 to 34 Years | 0 (0.0%) | 0 (0.0%) |
| 35 to 64 Years | 0 (0.0%) | 0 (0.0%) |
| 65 to 74 Years | 0 (0.0%) | 0 (0.0%) |
| 75 Years and over | 0 (0.0%) | 0 (0.0%) |
Technology Access in Old Agency
Computing Device Access in Old Agency
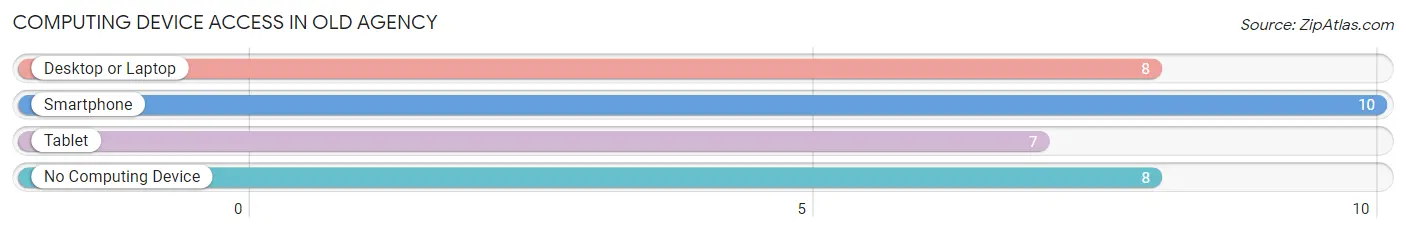
| Device Type | # Households | % Households |
| Desktop or Laptop | 8 | 40.0% |
| Smartphone | 10 | 50.0% |
| Tablet | 7 | 35.0% |
| No Computing Device | 8 | 40.0% |
| Total | 20 | 100.0% |
Internet Access in Old Agency
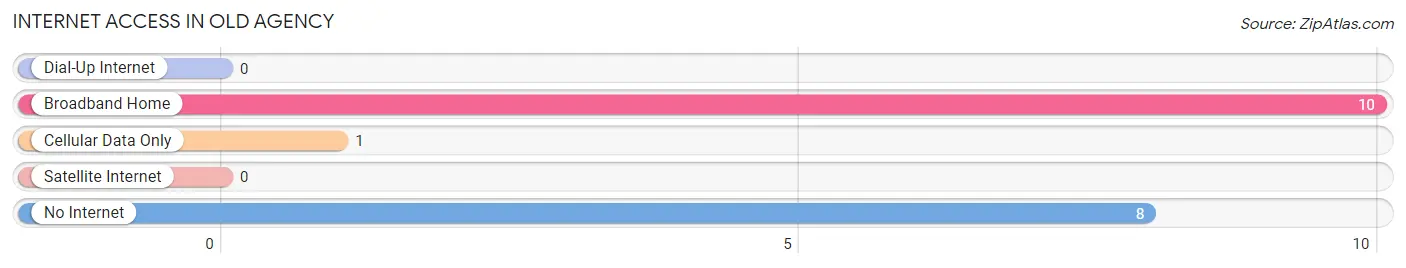
| Internet Type | # Households | % Households |
| Dial-Up Internet | 0 | 0.0% |
| Broadband Home | 10 | 50.0% |
| Cellular Data Only | 1 | 5.0% |
| Satellite Internet | 0 | 0.0% |
| No Internet | 8 | 40.0% |
| Total | 20 | 100.0% |
Old Agency Summary
Old Agency is a small unincorporated community located in the Flathead Indian Reservation in western Montana. It is situated in the Flathead Valley, approximately 20 miles east of Kalispell and 40 miles south of the Canadian border. The community is home to the Confederated Salish and Kootenai Tribes of the Flathead Nation, and is part of the larger Flathead Indian Reservation.
History
The area now known as Old Agency was originally inhabited by the Salish and Kootenai tribes of the Flathead Nation. The tribes had lived in the area for centuries before the arrival of European settlers in the late 19th century. In 1855, the tribes signed the Hellgate Treaty with the United States government, which established the Flathead Indian Reservation. The treaty set aside a large portion of the Flathead Valley for the exclusive use of the tribes, and the area now known as Old Agency was included in this reservation.
In 1891, the United States government established the Flathead Indian Agency at Old Agency. The agency was responsible for administering the affairs of the tribes on the reservation, and it was the first permanent government presence in the area. The agency was later moved to Dixon, Montana, but the name “Old Agency” stuck.
Geography
Old Agency is located in the Flathead Valley of western Montana. The community is situated in the Flathead Indian Reservation, approximately 20 miles east of Kalispell and 40 miles south of the Canadian border. The area is characterized by rolling hills, open meadows, and dense forests. The Flathead River runs through the valley, providing a source of water for the area.
The climate in Old Agency is typical of the northern Rocky Mountains, with cold winters and mild summers. The average annual temperature is around 40 degrees Fahrenheit, and the average annual precipitation is around 20 inches.
Economy
The economy of Old Agency is largely based on agriculture and tourism. The area is home to several small farms, which produce a variety of crops, including wheat, barley, hay, and potatoes. The area is also popular with tourists, who come to enjoy the area’s natural beauty and outdoor recreation opportunities.
In addition to agriculture and tourism, Old Agency is home to several small businesses, including a gas station, a grocery store, and a restaurant. The community also has a post office and a small library.
Demographics
As of the 2010 census, the population of Old Agency was 1,093. The population is primarily Native American, with the majority of residents belonging to the Confederated Salish and Kootenai Tribes of the Flathead Nation. The median household income in Old Agency is $30,000, and the median age is 35. The area is served by the Flathead Valley School District.
Common Questions
What is Per Capita Income in Old Agency?
Per Capita income in Old Agency is $8,022.
What is Inequality or Gini Index in Old Agency?
Inequality or Gini Index in Old Agency is 0.48.
What is the Total Population of Old Agency?
Total Population of Old Agency is 85.
What is the Total Male Population of Old Agency?
Total Male Population of Old Agency is 40.
What is the Total Female Population of Old Agency?
Total Female Population of Old Agency is 45.
What is the Ratio of Males per 100 Females in Old Agency?
There are 88.89 Males per 100 Females in Old Agency.
What is the Ratio of Females per 100 Males in Old Agency?
There are 112.50 Females per 100 Males in Old Agency.
What is the Median Population Age in Old Agency?
Median Population Age in Old Agency is 18.7 Years.
What is the Average Family Size in Old Agency
Average Family Size in Old Agency is 5.8 People.
What is the Average Household Size in Old Agency
Average Household Size in Old Agency is 4.2 People.
How Large is the Labor Force in Old Agency?
There are 28 People in the Labor Forcein in Old Agency.
What is the Percentage of People in the Labor Force in Old Agency?
59.6% of People are in the Labor Force in Old Agency.
What is the Unemployment Rate in Old Agency?
Unemployment Rate in Old Agency is 17.9%.