Havre North, MT Map & Demographics
Havre North Map
Havre North Overview
$16,045
PER CAPITA INCOME
$34,737
AVG FAMILY INCOME
$37,250
AVG HOUSEHOLD INCOME
17.5%
WAGE / INCOME GAP [ % ]
82.5¢/ $1
WAGE / INCOME GAP [ $ ]
0.32
INEQUALITY / GINI INDEX
848
TOTAL POPULATION
514
MALE POPULATION
334
FEMALE POPULATION
153.89
MALES / 100 FEMALES
64.98
FEMALES / 100 MALES
35.7
MEDIAN AGE
2.4
AVG FAMILY SIZE
2.3
AVG HOUSEHOLD SIZE
331
LABOR FORCE [ PEOPLE ]
50.5%
PERCENT IN LABOR FORCE
3.6%
UNEMPLOYMENT RATE
Income in Havre North
Income Overview in Havre North
Per Capita Income in Havre North is $16,045, while median incomes of families and households are $34,737 and $37,250 respectively.
| Characteristic | Number | Measure |
| Per Capita Income | 848 | $16,045 |
| Median Family Income | 270 | $34,737 |
| Mean Family Income | 270 | $38,087 |
| Median Household Income | 370 | $37,250 |
| Mean Household Income | 370 | $36,900 |
| Income Deficit | 270 | $0 |
| Wage / Income Gap (%) | 848 | 17.51% |
| Wage / Income Gap ($) | 848 | 82.49¢ per $1 |
| Gini / Inequality Index | 848 | 0.32 |
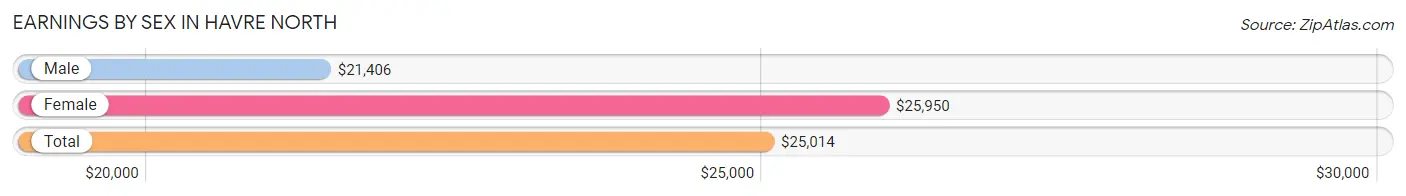
Earnings by Sex in Havre North
Average Earnings in Havre North are $25,014, $21,406 for men and $25,950 for women, a difference of 17.5%.
| Sex | Number | Average Earnings |
| Male | 174 (47.9%) | $21,406 |
| Female | 189 (52.1%) | $25,950 |
| Total | 363 (100.0%) | $25,014 |
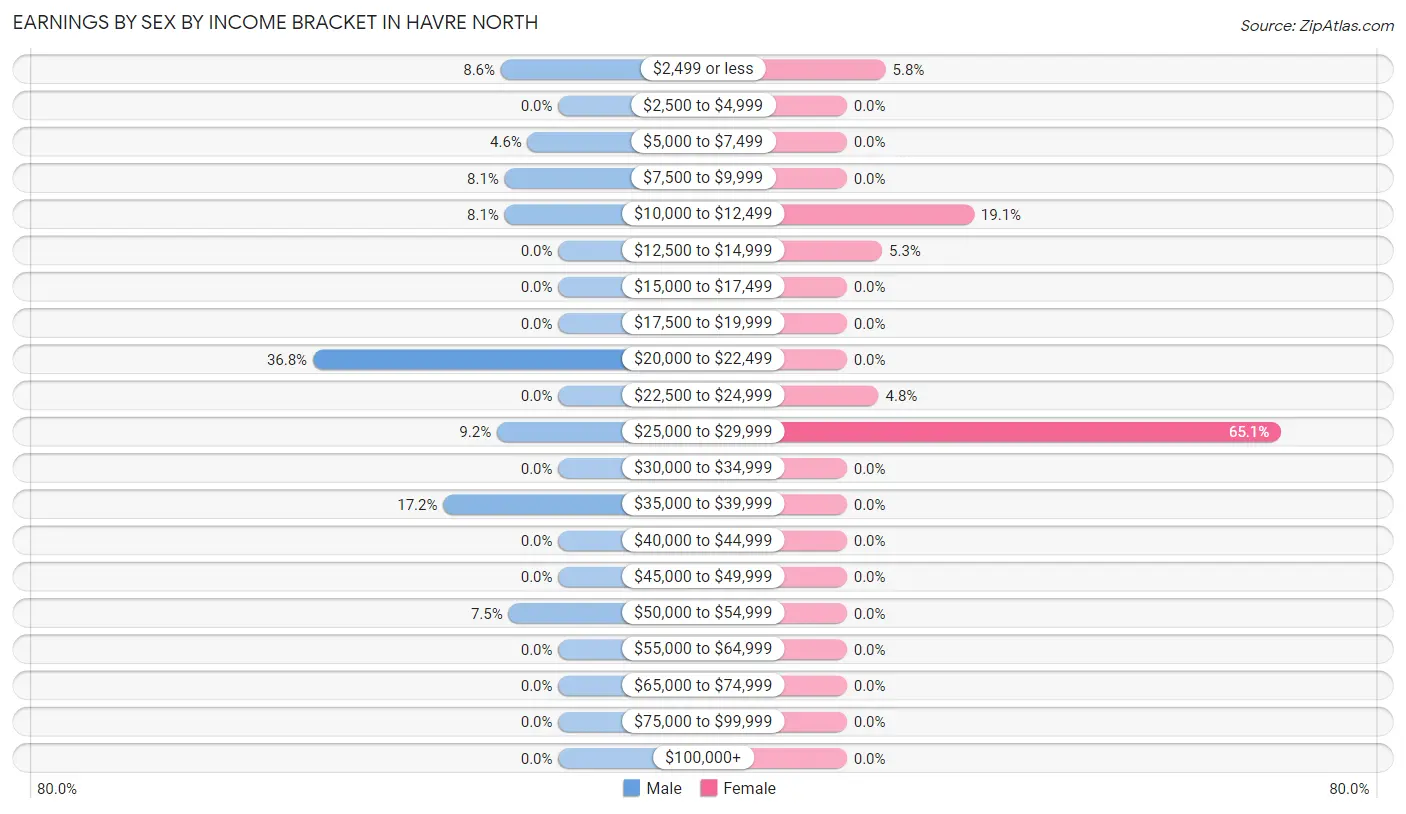
Earnings by Sex by Income Bracket in Havre North
The most common earnings brackets in Havre North are $20,000 to $22,499 for men (64 | 36.8%) and $25,000 to $29,999 for women (123 | 65.1%).
| Income | Male | Female |
| $2,499 or less | 15 (8.6%) | 11 (5.8%) |
| $2,500 to $4,999 | 0 (0.0%) | 0 (0.0%) |
| $5,000 to $7,499 | 8 (4.6%) | 0 (0.0%) |
| $7,500 to $9,999 | 14 (8.1%) | 0 (0.0%) |
| $10,000 to $12,499 | 14 (8.1%) | 36 (19.1%) |
| $12,500 to $14,999 | 0 (0.0%) | 10 (5.3%) |
| $15,000 to $17,499 | 0 (0.0%) | 0 (0.0%) |
| $17,500 to $19,999 | 0 (0.0%) | 0 (0.0%) |
| $20,000 to $22,499 | 64 (36.8%) | 0 (0.0%) |
| $22,500 to $24,999 | 0 (0.0%) | 9 (4.8%) |
| $25,000 to $29,999 | 16 (9.2%) | 123 (65.1%) |
| $30,000 to $34,999 | 0 (0.0%) | 0 (0.0%) |
| $35,000 to $39,999 | 30 (17.2%) | 0 (0.0%) |
| $40,000 to $44,999 | 0 (0.0%) | 0 (0.0%) |
| $45,000 to $49,999 | 0 (0.0%) | 0 (0.0%) |
| $50,000 to $54,999 | 13 (7.5%) | 0 (0.0%) |
| $55,000 to $64,999 | 0 (0.0%) | 0 (0.0%) |
| $65,000 to $74,999 | 0 (0.0%) | 0 (0.0%) |
| $75,000 to $99,999 | 0 (0.0%) | 0 (0.0%) |
| $100,000+ | 0 (0.0%) | 0 (0.0%) |
| Total | 174 (100.0%) | 189 (100.0%) |
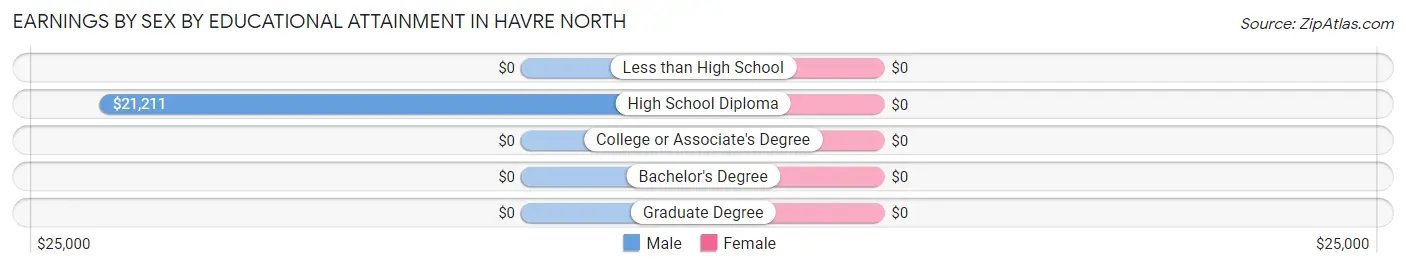
Earnings by Sex by Educational Attainment in Havre North
| Educational Attainment | Male Income | Female Income |
| Less than High School | - | - |
| High School Diploma | $21,211 | $0 |
| College or Associate's Degree | - | - |
| Bachelor's Degree | - | - |
| Graduate Degree | - | - |
| Total | $21,289 | $0 |
Family Income in Havre North
Family Income Brackets in Havre North
According to the Havre North family income data, there are 82 families falling into the $35,000 to $49,999 income range, which is the most common income bracket and makes up 30.4% of all families.
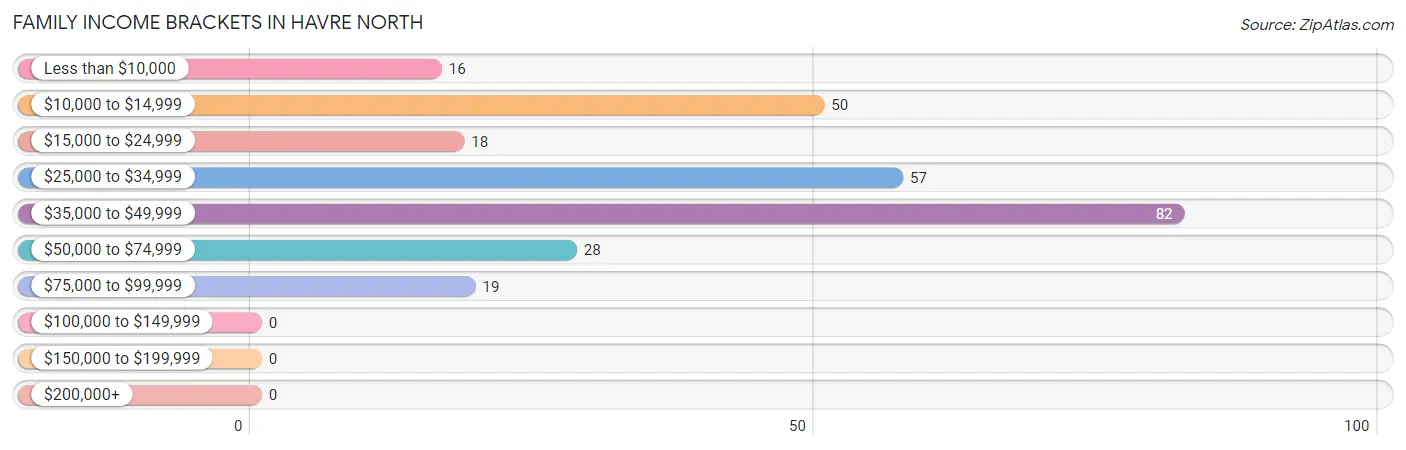
| Income Bracket | # Families | % Families |
| Less than $10,000 | 16 | 5.9% |
| $10,000 to $14,999 | 50 | 18.5% |
| $15,000 to $24,999 | 18 | 6.7% |
| $25,000 to $34,999 | 57 | 21.1% |
| $35,000 to $49,999 | 82 | 30.4% |
| $50,000 to $74,999 | 28 | 10.4% |
| $75,000 to $99,999 | 19 | 7.0% |
| $100,000 to $149,999 | 0 | 0.0% |
| $150,000 to $199,999 | 0 | 0.0% |
| $200,000+ | 0 | 0.0% |
Family Income by Famaliy Size in Havre North
2-person families (245 | 90.7%) account for the highest median family income in Havre North with $34,890 per family, while 2-person families (245 | 90.7%) have the highest median income of $17,445 per family member.
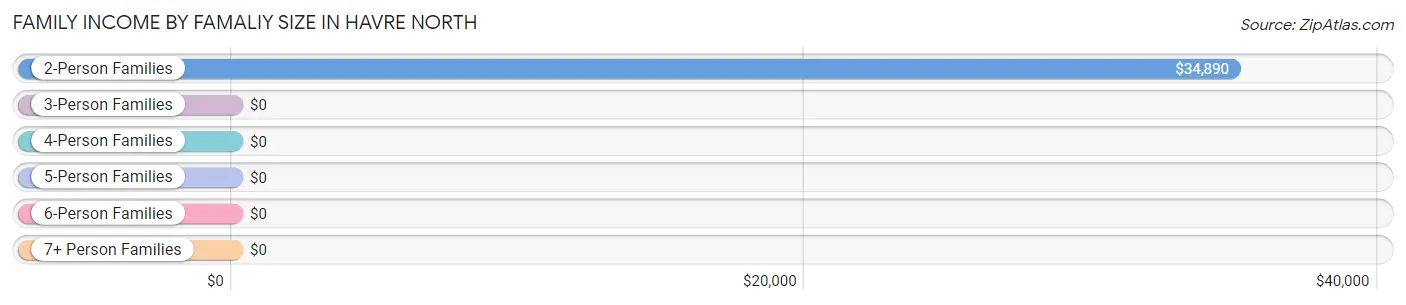
| Income Bracket | # Families | Median Income |
| 2-Person Families | 245 (90.7%) | $34,890 |
| 3-Person Families | 9 (3.3%) | $0 |
| 4-Person Families | 0 (0.0%) | $0 |
| 5-Person Families | 16 (5.9%) | $0 |
| 6-Person Families | 0 (0.0%) | $0 |
| 7+ Person Families | 0 (0.0%) | $0 |
| Total | 270 (100.0%) | $34,737 |
Family Income by Number of Earners in Havre North
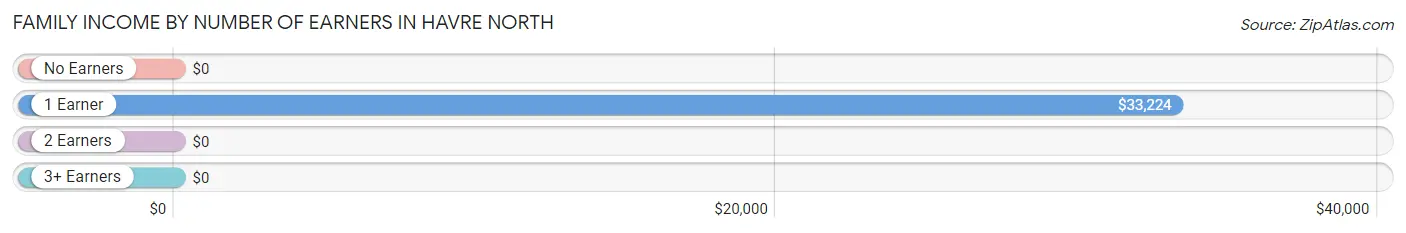
| Number of Earners | # Families | Median Income |
| No Earners | 53 (19.6%) | $0 |
| 1 Earner | 133 (49.3%) | $33,224 |
| 2 Earners | 84 (31.1%) | $0 |
| 3+ Earners | 0 (0.0%) | $0 |
| Total | 270 (100.0%) | $34,737 |
Household Income in Havre North
Household Income Brackets in Havre North
With 140 households falling in the category, the $35,000 to $49,999 income range is the most frequent in Havre North, accounting for 37.8% of all households.
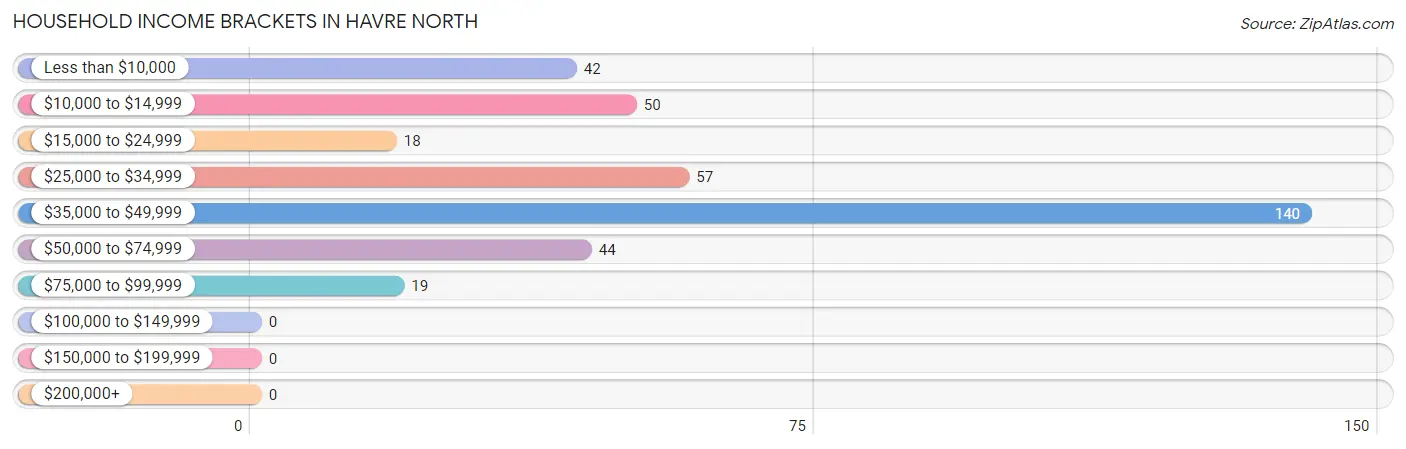
| Income Bracket | # Households | % Households |
| Less than $10,000 | 42 | 11.4% |
| $10,000 to $14,999 | 50 | 13.5% |
| $15,000 to $24,999 | 18 | 4.9% |
| $25,000 to $34,999 | 57 | 15.4% |
| $35,000 to $49,999 | 140 | 37.8% |
| $50,000 to $74,999 | 44 | 11.9% |
| $75,000 to $99,999 | 19 | 5.1% |
| $100,000 to $149,999 | 0 | 0.0% |
| $150,000 to $199,999 | 0 | 0.0% |
| $200,000+ | 0 | 0.0% |
Household Income by Householder Age in Havre North
The median household income in Havre North is $37,250, with the highest median household income of $54,107 found in the 65+ years age bracket for the primary householder. A total of 67 households (18.1%) fall into this category. Meanwhile, the 25 to 44 years age bracket for the primary householder has the lowest median household income of $0, with 68 households (18.4%) in this group.
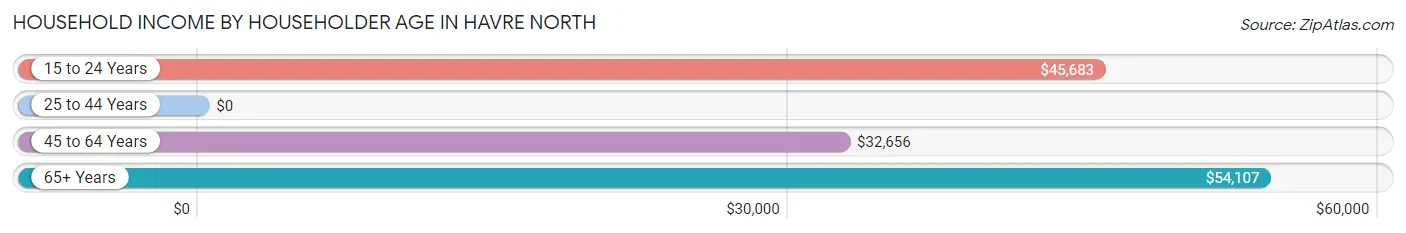
| Income Bracket | # Households | Median Income |
| 15 to 24 Years | 109 (29.5%) | $45,683 |
| 25 to 44 Years | 68 (18.4%) | $0 |
| 45 to 64 Years | 126 (34.1%) | $32,656 |
| 65+ Years | 67 (18.1%) | $54,107 |
| Total | 370 (100.0%) | $37,250 |
Poverty in Havre North
Income Below Poverty by Sex and Age in Havre North
With 42.6% poverty level for males and 43.1% for females among the residents of Havre North, under 5 year old males and 6 to 11 year old females are the most vulnerable to poverty, with 19 males (100.0%) and 45 females (100.0%) in their respective age groups living below the poverty level.
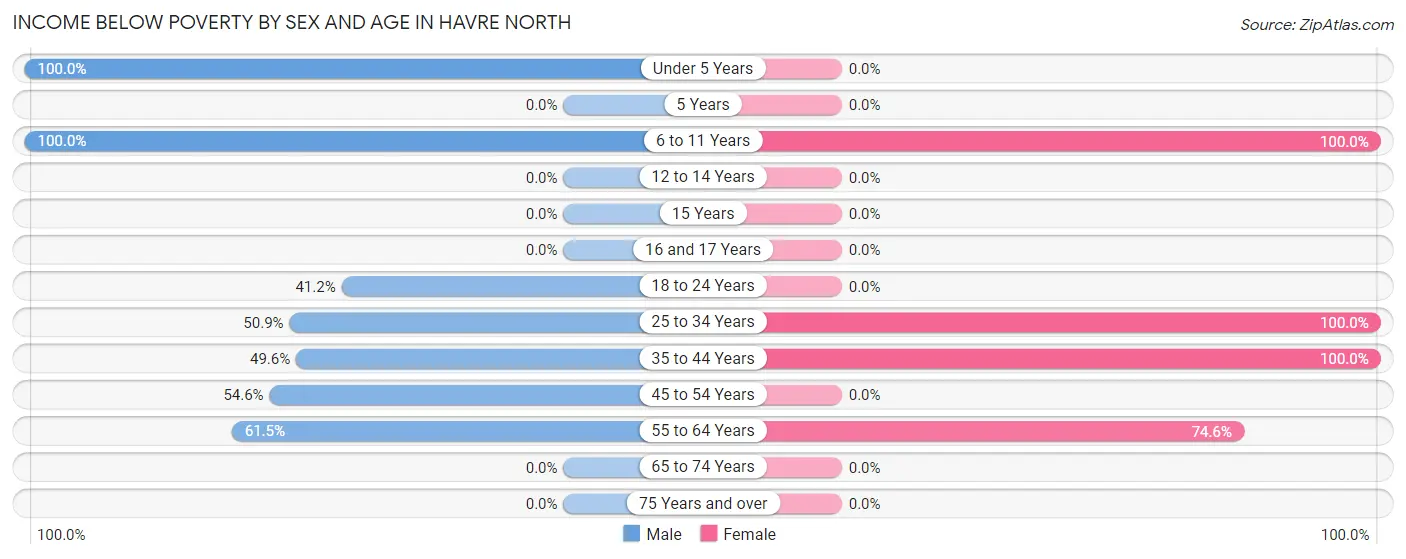
| Age Bracket | Male | Female |
| Under 5 Years | 19 (100.0%) | 0 (0.0%) |
| 5 Years | 0 (0.0%) | 0 (0.0%) |
| 6 to 11 Years | 49 (100.0%) | 45 (100.0%) |
| 12 to 14 Years | 0 (0.0%) | 0 (0.0%) |
| 15 Years | 0 (0.0%) | 0 (0.0%) |
| 16 and 17 Years | 0 (0.0%) | 0 (0.0%) |
| 18 to 24 Years | 14 (41.2%) | 0 (0.0%) |
| 25 to 34 Years | 30 (50.8%) | 16 (100.0%) |
| 35 to 44 Years | 63 (49.6%) | 36 (100.0%) |
| 45 to 54 Years | 12 (54.5%) | 0 (0.0%) |
| 55 to 64 Years | 32 (61.5%) | 47 (74.6%) |
| 65 to 74 Years | 0 (0.0%) | 0 (0.0%) |
| 75 Years and over | 0 (0.0%) | 0 (0.0%) |
| Total | 219 (42.6%) | 144 (43.1%) |
Income Above Poverty by Sex and Age in Havre North
According to the poverty statistics in Havre North, males aged 12 to 14 years and females aged 18 to 24 years are the age groups that are most secure financially, with 100.0% of males and 100.0% of females in these age groups living above the poverty line.
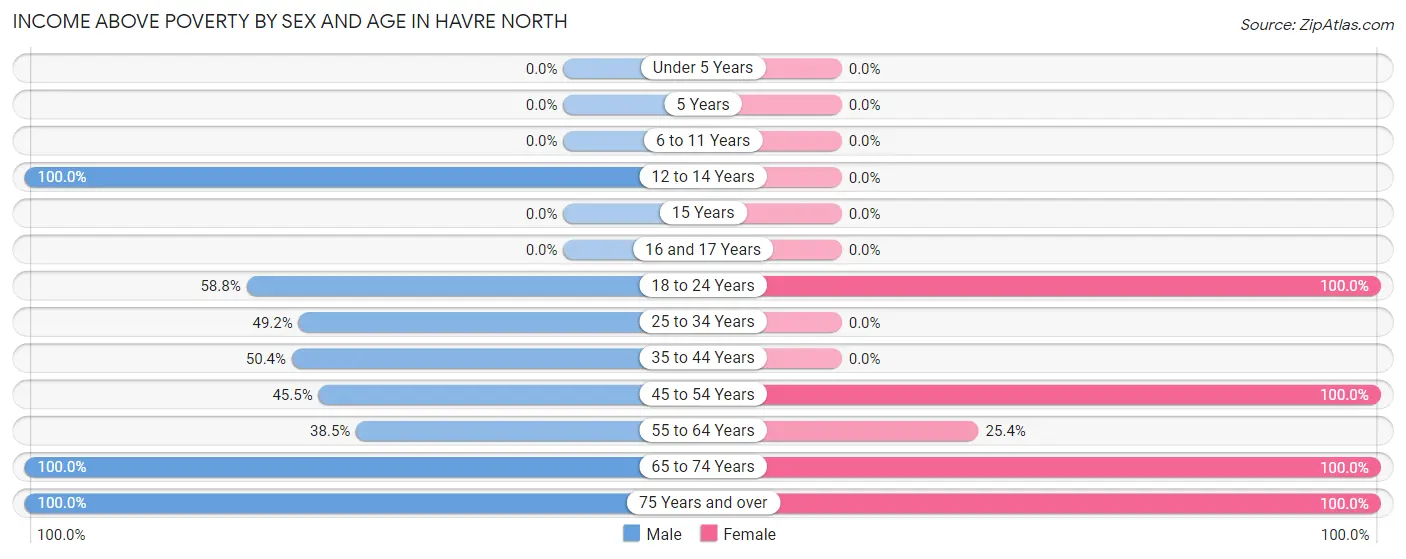
| Age Bracket | Male | Female |
| Under 5 Years | 0 (0.0%) | 0 (0.0%) |
| 5 Years | 0 (0.0%) | 0 (0.0%) |
| 6 to 11 Years | 0 (0.0%) | 0 (0.0%) |
| 12 to 14 Years | 80 (100.0%) | 0 (0.0%) |
| 15 Years | 0 (0.0%) | 0 (0.0%) |
| 16 and 17 Years | 0 (0.0%) | 0 (0.0%) |
| 18 to 24 Years | 20 (58.8%) | 75 (100.0%) |
| 25 to 34 Years | 29 (49.1%) | 0 (0.0%) |
| 35 to 44 Years | 64 (50.4%) | 0 (0.0%) |
| 45 to 54 Years | 10 (45.5%) | 57 (100.0%) |
| 55 to 64 Years | 20 (38.5%) | 16 (25.4%) |
| 65 to 74 Years | 48 (100.0%) | 25 (100.0%) |
| 75 Years and over | 24 (100.0%) | 17 (100.0%) |
| Total | 295 (57.4%) | 190 (56.9%) |
Income Below Poverty Among Married-Couple Families in Havre North
The poverty statistics for married-couple families in Havre North show that 12.2% or 18 of the total 147 families live below the poverty line. Families with no children have the highest poverty rate of 12.2%, comprising of 18 families. On the other hand, families with no children have the lowest poverty rate of 12.2%, which includes 18 families.
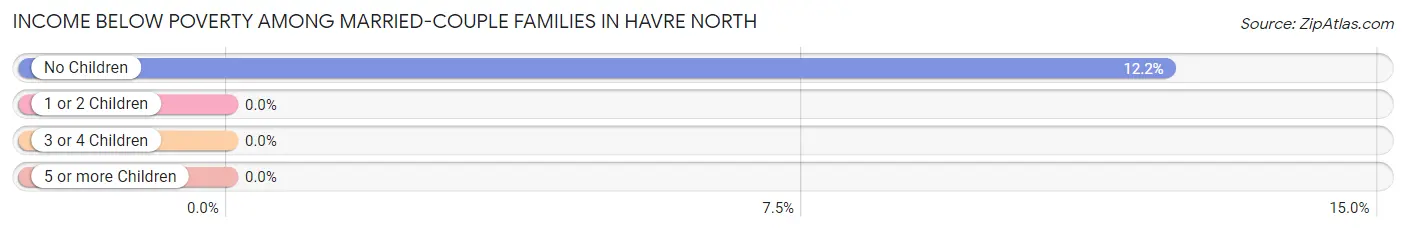
| Children | Above Poverty | Below Poverty |
| No Children | 129 (87.8%) | 18 (12.2%) |
| 1 or 2 Children | 0 (0.0%) | 0 (0.0%) |
| 3 or 4 Children | 0 (0.0%) | 0 (0.0%) |
| 5 or more Children | 0 (0.0%) | 0 (0.0%) |
| Total | 129 (87.8%) | 18 (12.2%) |
Income Below Poverty Among Single-Parent Households in Havre North
According to the poverty data in Havre North, 60.9% or 14 single-father households and 52.0% or 52 single-mother households are living below the poverty line. Among single-father households, those with no children have the highest poverty rate, with 14 households (60.9%) experiencing poverty. Likewise, among single-mother households, those with 3 or 4 children have the highest poverty rate, with 16 households (100.0%) falling below the poverty line.
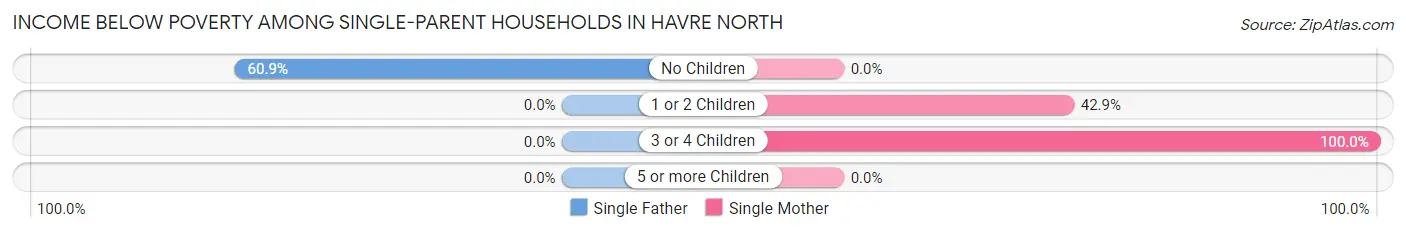
| Children | Single Father | Single Mother |
| No Children | 14 (60.9%) | 0 (0.0%) |
| 1 or 2 Children | 0 (0.0%) | 36 (42.9%) |
| 3 or 4 Children | 0 (0.0%) | 16 (100.0%) |
| 5 or more Children | 0 (0.0%) | 0 (0.0%) |
| Total | 14 (60.9%) | 52 (52.0%) |
Income Below Poverty Among Married-Couple vs Single-Parent Households in Havre North
The poverty data for Havre North shows that 18 of the married-couple family households (12.2%) and 66 of the single-parent households (53.7%) are living below the poverty level. Within the married-couple family households, those with no children have the highest poverty rate, with 18 households (12.2%) falling below the poverty line. Among the single-parent households, those with 3 or 4 children have the highest poverty rate, with 16 household (100.0%) living below poverty.
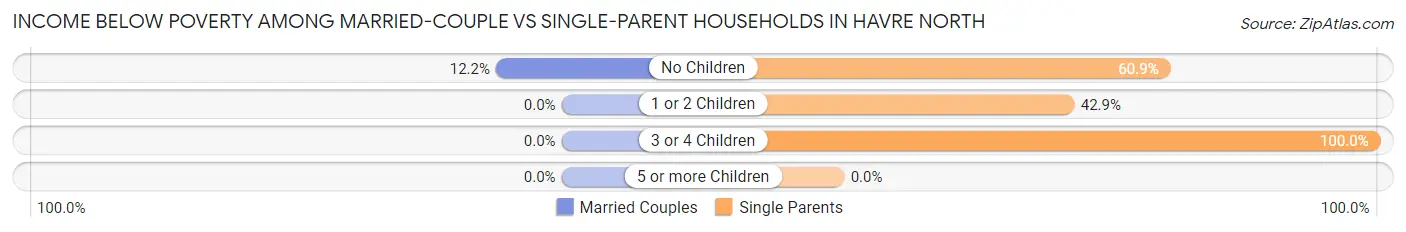
| Children | Married-Couple Families | Single-Parent Households |
| No Children | 18 (12.2%) | 14 (60.9%) |
| 1 or 2 Children | 0 (0.0%) | 36 (42.9%) |
| 3 or 4 Children | 0 (0.0%) | 16 (100.0%) |
| 5 or more Children | 0 (0.0%) | 0 (0.0%) |
| Total | 18 (12.2%) | 66 (53.7%) |
Race in Havre North
The most populous races in Havre North are White / Caucasian (639 | 75.3%), Native / Alaskan (131 | 15.4%), and Two or more Races (59 | 7.0%).
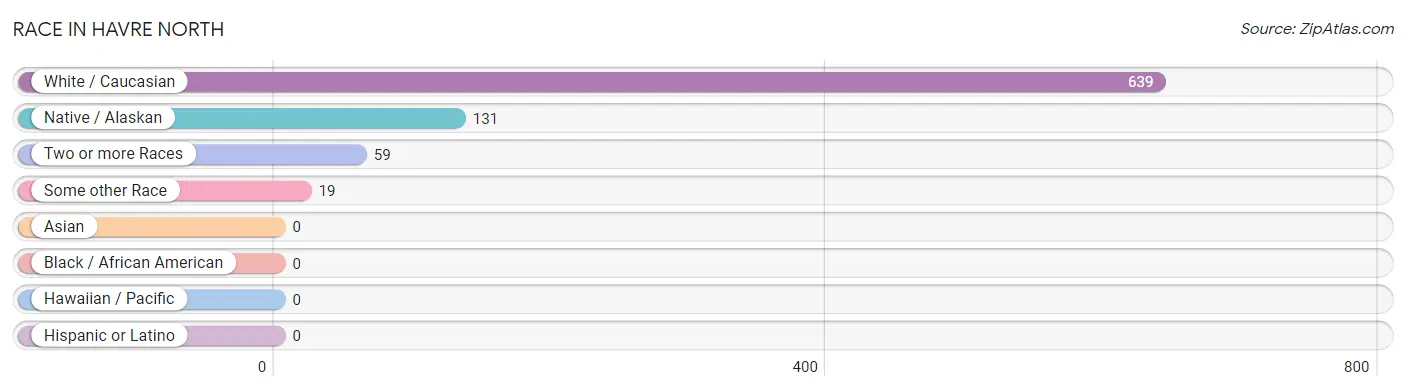
| Race | # Population | % Population |
| Asian | 0 | 0.0% |
| Black / African American | 0 | 0.0% |
| Hawaiian / Pacific | 0 | 0.0% |
| Hispanic or Latino | 0 | 0.0% |
| Native / Alaskan | 131 | 15.4% |
| White / Caucasian | 639 | 75.3% |
| Two or more Races | 59 | 7.0% |
| Some other Race | 19 | 2.2% |
| Total | 848 | 100.0% |
Ancestry in Havre North
The most populous ancestries reported in Havre North are German (106 | 12.5%), Norwegian (86 | 10.1%), American (85 | 10.0%), English (75 | 8.8%), and Dutch (31 | 3.7%), together accounting for 45.2% of all Havre North residents.
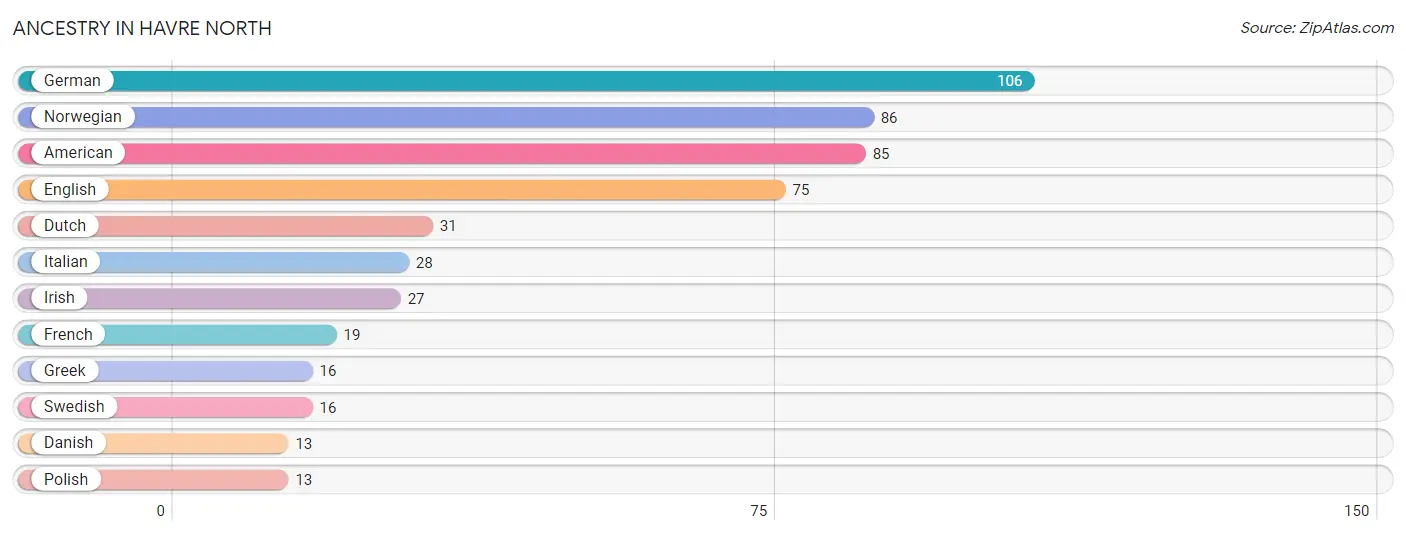
| Ancestry | # Population | % Population |
| American | 85 | 10.0% |
| Danish | 13 | 1.5% |
| Dutch | 31 | 3.7% |
| English | 75 | 8.8% |
| French | 19 | 2.2% |
| German | 106 | 12.5% |
| Greek | 16 | 1.9% |
| Irish | 27 | 3.2% |
| Italian | 28 | 3.3% |
| Norwegian | 86 | 10.1% |
| Polish | 13 | 1.5% |
| Swedish | 16 | 1.9% | View All 12 Rows |
Immigrants in Havre North

| Immigration Origin | # Population | % Population | View All 0 Rows |
Sex and Age in Havre North
Sex and Age in Havre North
The most populous age groups in Havre North are 10 to 14 Years (129 | 25.1%) for men and 20 to 24 Years (75 | 22.5%) for women.
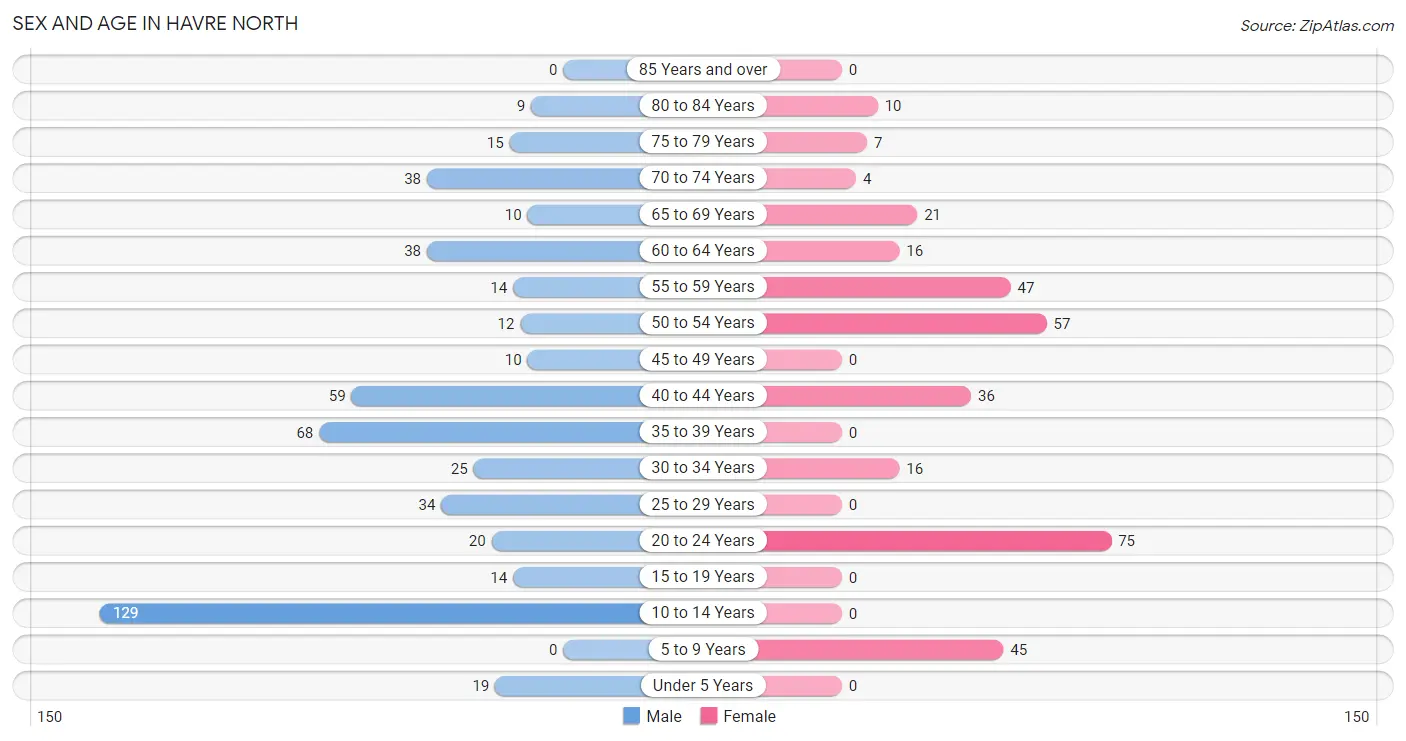
| Age Bracket | Male | Female |
| Under 5 Years | 19 (3.7%) | 0 (0.0%) |
| 5 to 9 Years | 0 (0.0%) | 45 (13.5%) |
| 10 to 14 Years | 129 (25.1%) | 0 (0.0%) |
| 15 to 19 Years | 14 (2.7%) | 0 (0.0%) |
| 20 to 24 Years | 20 (3.9%) | 75 (22.5%) |
| 25 to 29 Years | 34 (6.6%) | 0 (0.0%) |
| 30 to 34 Years | 25 (4.9%) | 16 (4.8%) |
| 35 to 39 Years | 68 (13.2%) | 0 (0.0%) |
| 40 to 44 Years | 59 (11.5%) | 36 (10.8%) |
| 45 to 49 Years | 10 (1.9%) | 0 (0.0%) |
| 50 to 54 Years | 12 (2.3%) | 57 (17.1%) |
| 55 to 59 Years | 14 (2.7%) | 47 (14.1%) |
| 60 to 64 Years | 38 (7.4%) | 16 (4.8%) |
| 65 to 69 Years | 10 (1.9%) | 21 (6.3%) |
| 70 to 74 Years | 38 (7.4%) | 4 (1.2%) |
| 75 to 79 Years | 15 (2.9%) | 7 (2.1%) |
| 80 to 84 Years | 9 (1.8%) | 10 (3.0%) |
| 85 Years and over | 0 (0.0%) | 0 (0.0%) |
| Total | 514 (100.0%) | 334 (100.0%) |
Families and Households in Havre North
Median Family Size in Havre North
The median family size in Havre North is 2.43 persons per family, with single female/mother families (100 | 37.0%) accounting for the largest median family size of 2.93 persons per family. On the other hand, married-couple families (147 | 54.4%) represent the smallest median family size with 2.12 persons per family.
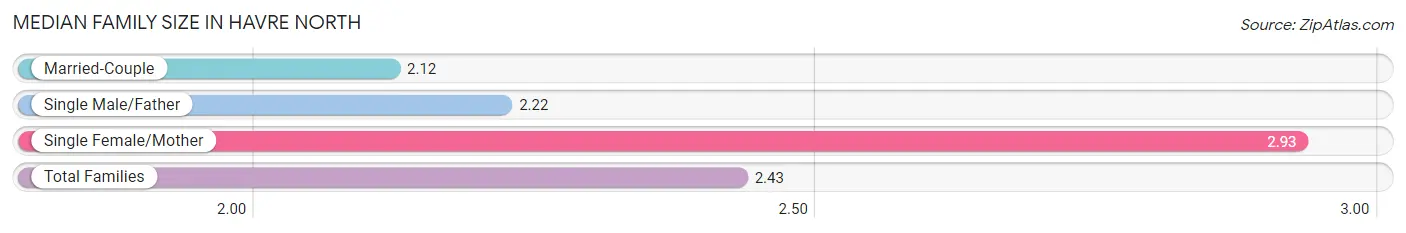
| Family Type | # Families | Family Size |
| Married-Couple | 147 (54.4%) | 2.12 |
| Single Male/Father | 23 (8.5%) | 2.22 |
| Single Female/Mother | 100 (37.0%) | 2.93 |
| Total Families | 270 (100.0%) | 2.43 |
Median Household Size in Havre North
The median household size in Havre North is 2.27 persons per household, with single female/mother households (100 | 27.0%) accounting for the largest median household size of 3.65 persons per household. non-family households (100 | 27.0%) represent the smallest median household size with 1.12 persons per household.
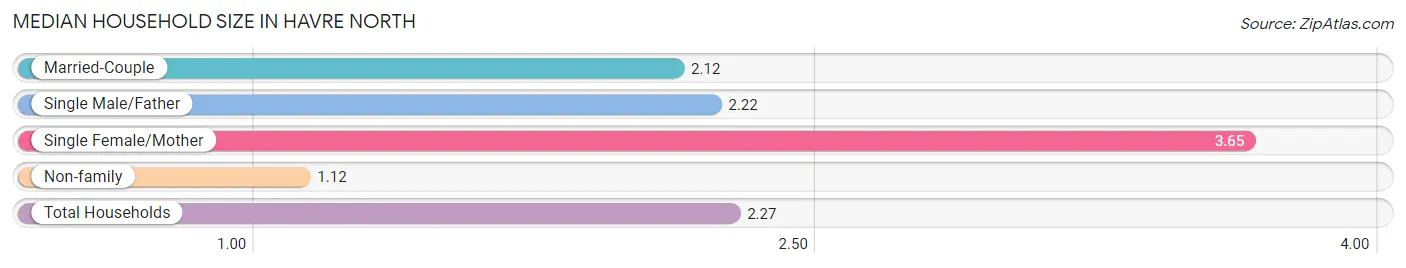
| Household Type | # Households | Household Size |
| Married-Couple | 147 (39.7%) | 2.12 |
| Single Male/Father | 23 (6.2%) | 2.22 |
| Single Female/Mother | 100 (27.0%) | 3.65 |
| Non-family | 100 (27.0%) | 1.12 |
| Total Households | 370 (100.0%) | 2.27 |
Household Size by Marriage Status in Havre North
Out of a total of 370 households in Havre North, 270 (73.0%) are family households, while 100 (27.0%) are nonfamily households. The most numerous type of family households are 2-person households, comprising 197, and the most common type of nonfamily households are 1-person households, comprising 84.
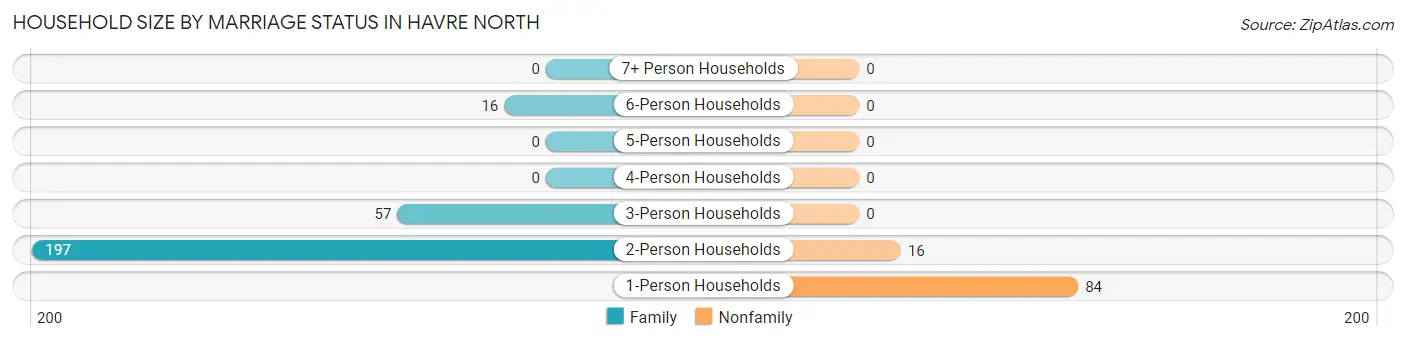
| Household Size | Family Households | Nonfamily Households |
| 1-Person Households | - | 84 (22.7%) |
| 2-Person Households | 197 (53.2%) | 16 (4.3%) |
| 3-Person Households | 57 (15.4%) | 0 (0.0%) |
| 4-Person Households | 0 (0.0%) | 0 (0.0%) |
| 5-Person Households | 0 (0.0%) | 0 (0.0%) |
| 6-Person Households | 16 (4.3%) | 0 (0.0%) |
| 7+ Person Households | 0 (0.0%) | 0 (0.0%) |
| Total | 270 (73.0%) | 100 (27.0%) |
Female Fertility in Havre North
Fertility by Age in Havre North
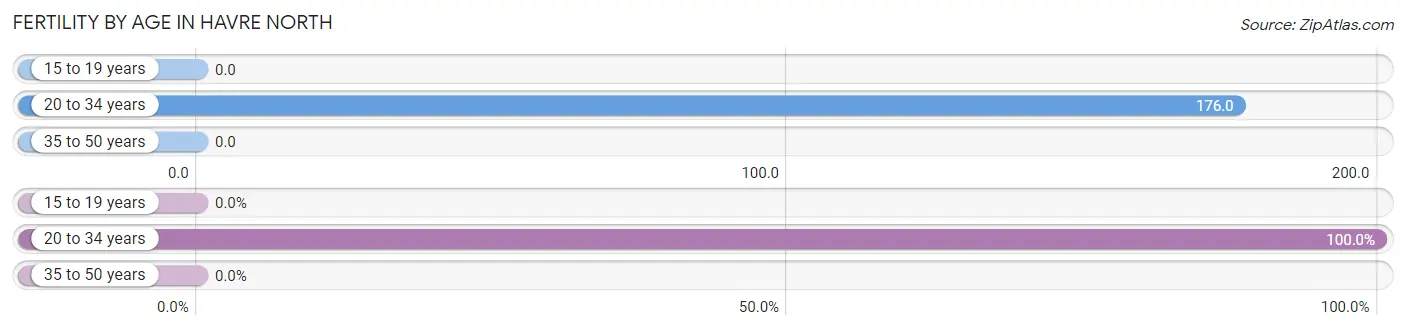
Average fertility rate in Havre North is 91.0 births per 1,000 women. Women in the age bracket of 20 to 34 years have the highest fertility rate with 176.0 births per 1,000 women. Women in the age bracket of 20 to 34 years acount for 100.0% of all women with births.
| Age Bracket | Women with Births | Births / 1,000 Women |
| 15 to 19 years | 0 (0.0%) | 0.0 |
| 20 to 34 years | 16 (100.0%) | 176.0 |
| 35 to 50 years | 0 (0.0%) | 0.0 |
| Total | 16 (100.0%) | 91.0 |
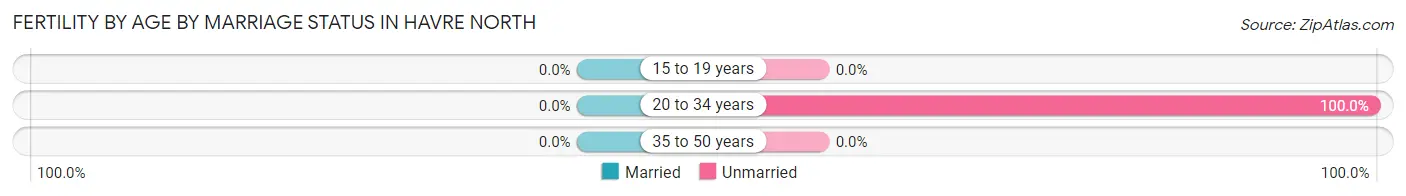
Fertility by Age by Marriage Status in Havre North
| Age Bracket | Married | Unmarried |
| 15 to 19 years | 0 (0.0%) | 0 (0.0%) |
| 20 to 34 years | 0 (0.0%) | 16 (100.0%) |
| 35 to 50 years | 0 (0.0%) | 0 (0.0%) |
| Total | 0 (0.0%) | 16 (100.0%) |
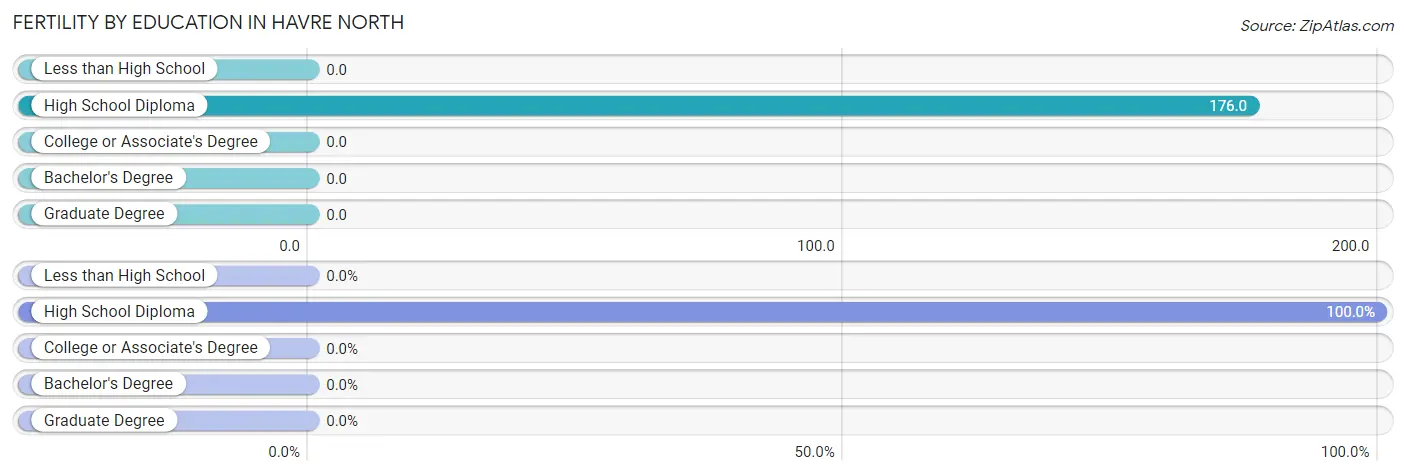
Fertility by Education in Havre North
| Educational Attainment | Women with Births | Births / 1,000 Women |
| Less than High School | 0 (0.0%) | 0.0 |
| High School Diploma | 16 (100.0%) | 176.0 |
| College or Associate's Degree | 0 (0.0%) | 0.0 |
| Bachelor's Degree | 0 (0.0%) | 0.0 |
| Graduate Degree | 0 (0.0%) | 0.0 |
| Total | 16 (100.0%) | 91.0 |
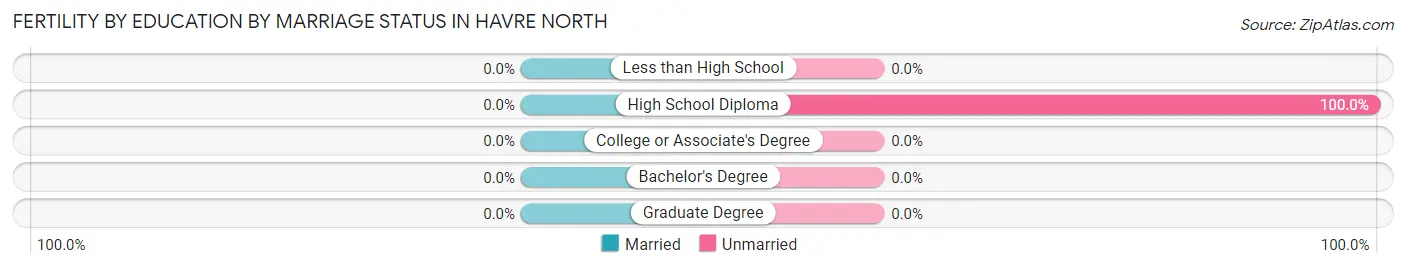
Fertility by Education by Marriage Status in Havre North
| Educational Attainment | Married | Unmarried |
| Less than High School | 0 (0.0%) | 0 (0.0%) |
| High School Diploma | 0 (0.0%) | 16 (100.0%) |
| College or Associate's Degree | 0 (0.0%) | 0 (0.0%) |
| Bachelor's Degree | 0 (0.0%) | 0 (0.0%) |
| Graduate Degree | 0 (0.0%) | 0 (0.0%) |
| Total | 0 (0.0%) | 16 (100.0%) |
Employment Characteristics in Havre North
Employment by Class of Employer in Havre North
Among the 319 employed individuals in Havre North, private company employees (253 | 79.3%), federal government employees (48 | 15.0%), and self-employed (not incorporated) (14 | 4.4%) make up the most common classes of employment.
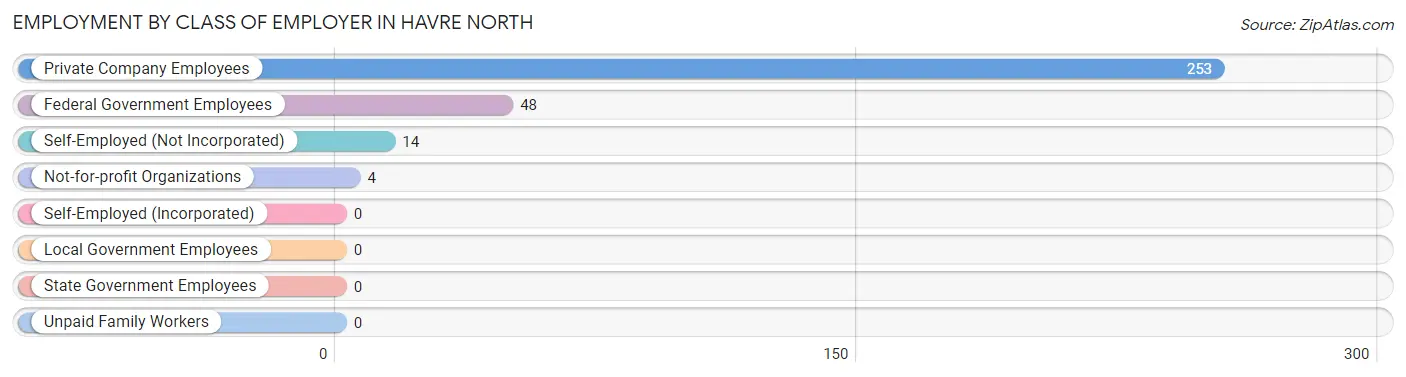
| Employer Class | # Employees | % Employees |
| Private Company Employees | 253 | 79.3% |
| Self-Employed (Incorporated) | 0 | 0.0% |
| Self-Employed (Not Incorporated) | 14 | 4.4% |
| Not-for-profit Organizations | 4 | 1.3% |
| Local Government Employees | 0 | 0.0% |
| State Government Employees | 0 | 0.0% |
| Federal Government Employees | 48 | 15.0% |
| Unpaid Family Workers | 0 | 0.0% |
| Total | 319 | 100.0% |
Employment Status by Age in Havre North
According to the labor force statistics for Havre North, out of the total population over 16 years of age (655), 50.5% or 331 individuals are in the labor force, with 3.6% or 12 of them unemployed. The age group with the highest labor force participation rate is 16 to 19 years, with 100.0% or 14 individuals in the labor force. Within the labor force, the 45 to 54 years age range has the highest percentage of unemployed individuals, with 15.2% or 12 of them being unemployed.
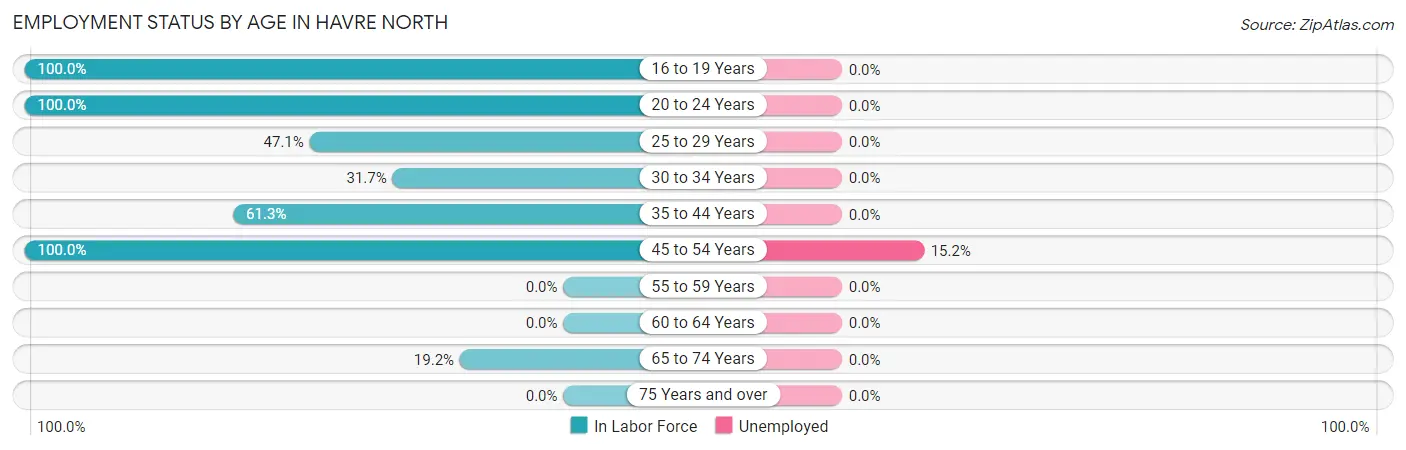
| Age Bracket | In Labor Force | Unemployed |
| 16 to 19 Years | 14 (100.0%) | 0 (0.0%) |
| 20 to 24 Years | 95 (100.0%) | 0 (0.0%) |
| 25 to 29 Years | 16 (47.1%) | 0 (0.0%) |
| 30 to 34 Years | 13 (31.7%) | 0 (0.0%) |
| 35 to 44 Years | 100 (61.3%) | 0 (0.0%) |
| 45 to 54 Years | 79 (100.0%) | 12 (15.2%) |
| 55 to 59 Years | 0 (0.0%) | 0 (0.0%) |
| 60 to 64 Years | 0 (0.0%) | 0 (0.0%) |
| 65 to 74 Years | 14 (19.2%) | 0 (0.0%) |
| 75 Years and over | 0 (0.0%) | 0 (0.0%) |
| Total | 331 (50.5%) | 12 (3.6%) |
Employment Status by Educational Attainment in Havre North
According to labor force statistics for Havre North, 48.1% of individuals (208) out of the total population between 25 and 64 years of age (432) are in the labor force, with 5.8% or 12 of them being unemployed. The group with the highest labor force participation rate are those with the educational attainment of college / associate degree, with 65.0% or 89 individuals in the labor force. Within the labor force, individuals with college / associate degree education have the highest percentage of unemployment, with 13.5% or 12 of them being unemployed.
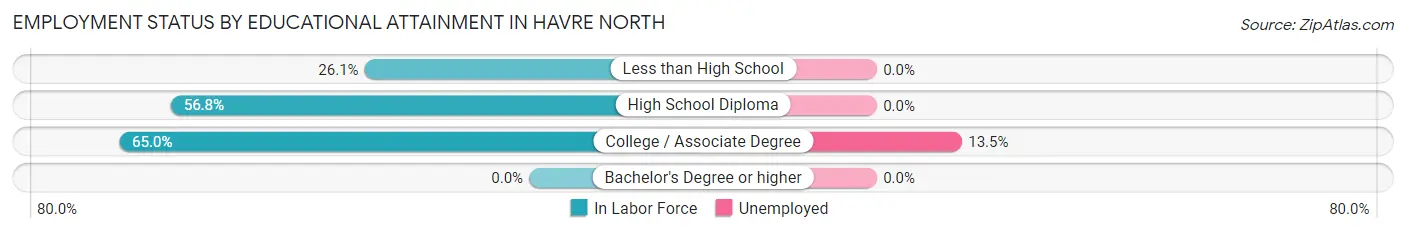
| Educational Attainment | In Labor Force | Unemployed |
| Less than High School | 36 (26.1%) | 0 (0.0%) |
| High School Diploma | 83 (56.8%) | 0 (0.0%) |
| College / Associate Degree | 89 (65.0%) | 18 (13.5%) |
| Bachelor's Degree or higher | 0 (0.0%) | 0 (0.0%) |
| Total | 208 (48.1%) | 25 (5.8%) |
Employment Occupations by Sex in Havre North
Management, Business, Science and Arts Occupations
The most common Management, Business, Science and Arts occupations in Havre North are Health Diagnosing & Treating (48 | 15.0%), and Management (13 | 4.1%).
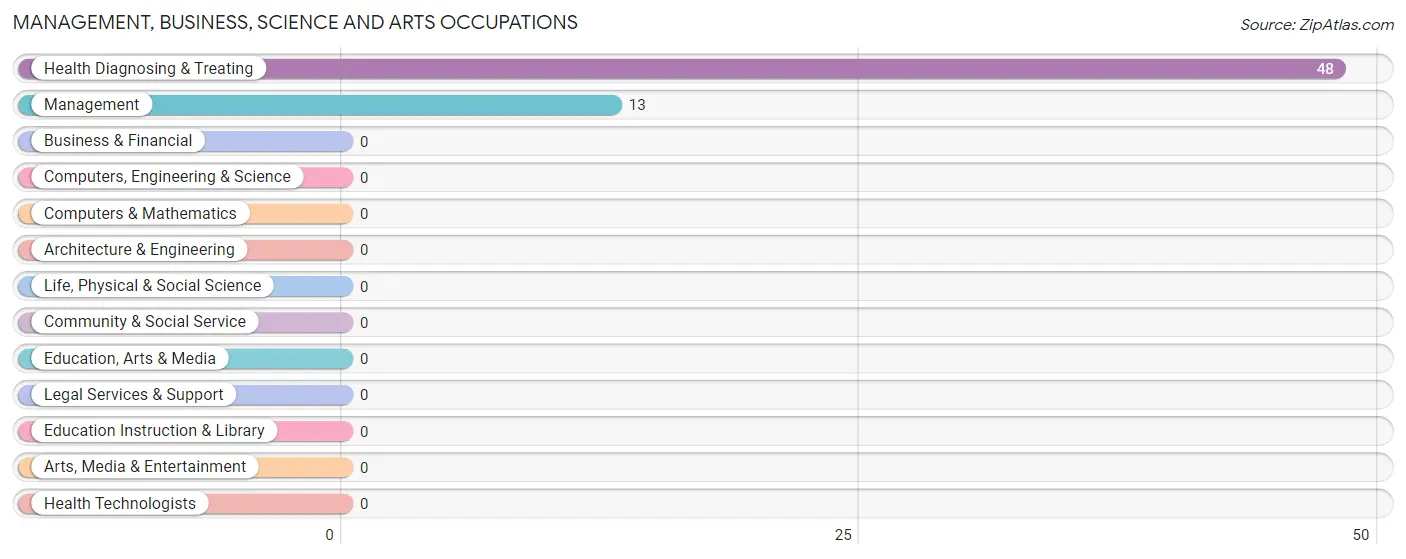
Management, Business, Science and Arts Occupations by Sex
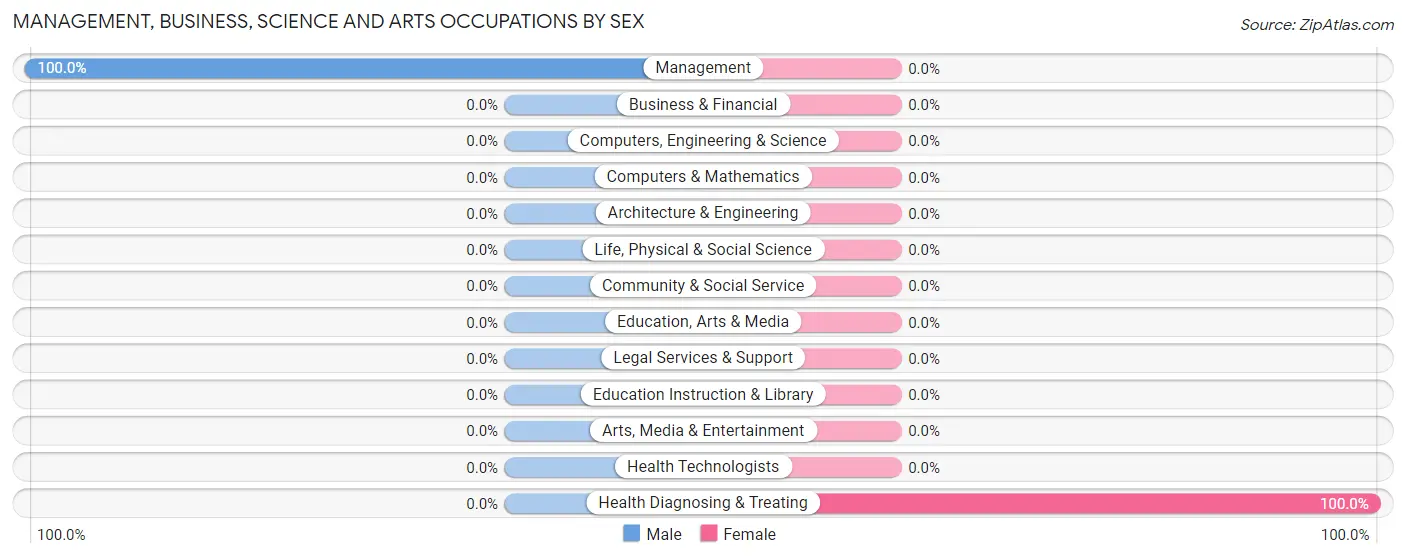
| Occupation | Male | Female |
| Management | 13 (100.0%) | 0 (0.0%) |
| Business & Financial | 0 (0.0%) | 0 (0.0%) |
| Computers, Engineering & Science | 0 (0.0%) | 0 (0.0%) |
| Computers & Mathematics | 0 (0.0%) | 0 (0.0%) |
| Architecture & Engineering | 0 (0.0%) | 0 (0.0%) |
| Life, Physical & Social Science | 0 (0.0%) | 0 (0.0%) |
| Community & Social Service | 0 (0.0%) | 0 (0.0%) |
| Education, Arts & Media | 0 (0.0%) | 0 (0.0%) |
| Legal Services & Support | 0 (0.0%) | 0 (0.0%) |
| Education Instruction & Library | 0 (0.0%) | 0 (0.0%) |
| Arts, Media & Entertainment | 0 (0.0%) | 0 (0.0%) |
| Health Diagnosing & Treating | 0 (0.0%) | 48 (100.0%) |
| Health Technologists | 0 (0.0%) | 0 (0.0%) |
| Total (Category) | 13 (21.3%) | 48 (78.7%) |
| Total (Overall) | 141 (44.2%) | 178 (55.8%) |
Services Occupations
The most common Services occupations in Havre North are Food Preparation & Serving (78 | 24.4%), and Cleaning & Maintenance (45 | 14.1%).
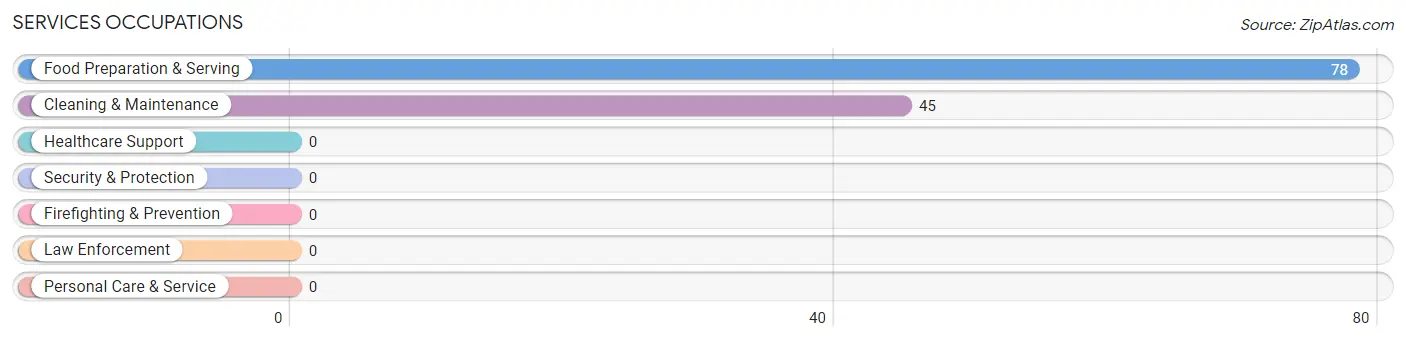
Services Occupations by Sex
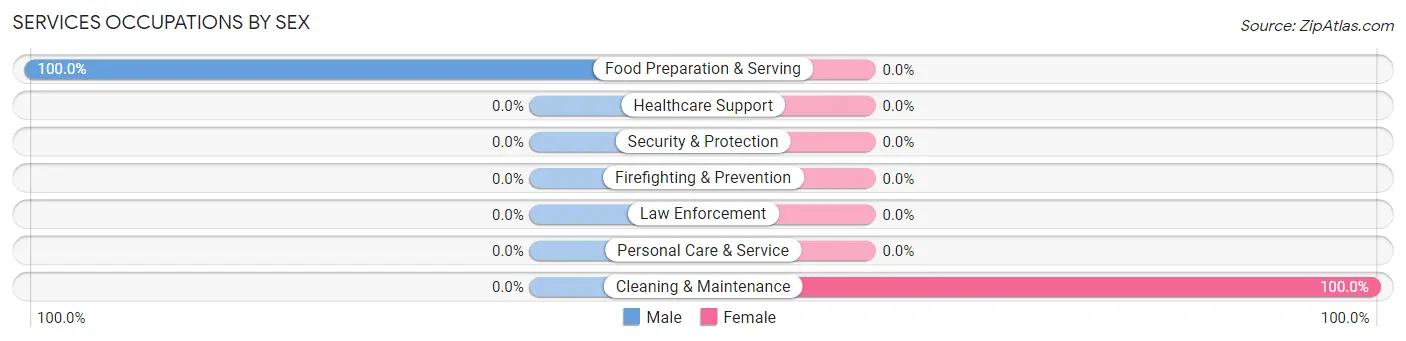
| Occupation | Male | Female |
| Healthcare Support | 0 (0.0%) | 0 (0.0%) |
| Security & Protection | 0 (0.0%) | 0 (0.0%) |
| Firefighting & Prevention | 0 (0.0%) | 0 (0.0%) |
| Law Enforcement | 0 (0.0%) | 0 (0.0%) |
| Food Preparation & Serving | 78 (100.0%) | 0 (0.0%) |
| Cleaning & Maintenance | 0 (0.0%) | 45 (100.0%) |
| Personal Care & Service | 0 (0.0%) | 0 (0.0%) |
| Total (Category) | 78 (63.4%) | 45 (36.6%) |
| Total (Overall) | 141 (44.2%) | 178 (55.8%) |
Sales and Office Occupations
The most common Sales and Office occupations in Havre North are , and Sales & Related (75 | 23.5%).
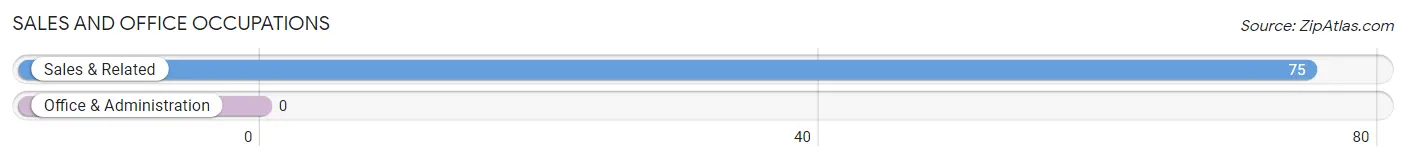
Sales and Office Occupations by Sex
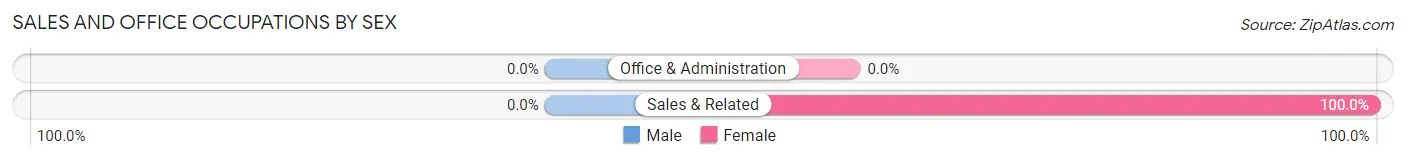
| Occupation | Male | Female |
| Sales & Related | 0 (0.0%) | 75 (100.0%) |
| Office & Administration | 0 (0.0%) | 0 (0.0%) |
| Total (Category) | 0 (0.0%) | 75 (100.0%) |
| Total (Overall) | 141 (44.2%) | 178 (55.8%) |
Natural Resources, Construction and Maintenance Occupations
The most common Natural Resources, Construction and Maintenance occupations in Havre North are , and Construction & Extraction (10 | 3.1%).
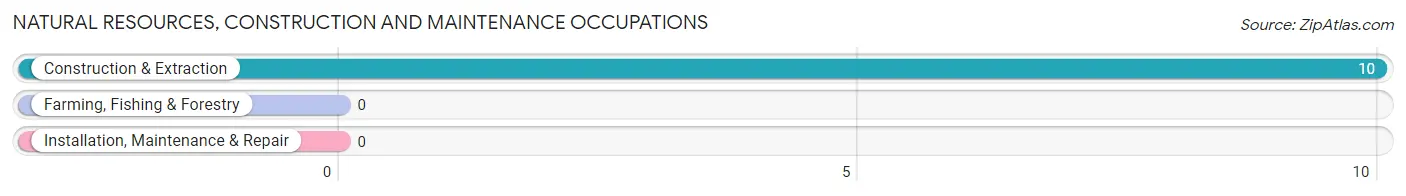
Natural Resources, Construction and Maintenance Occupations by Sex
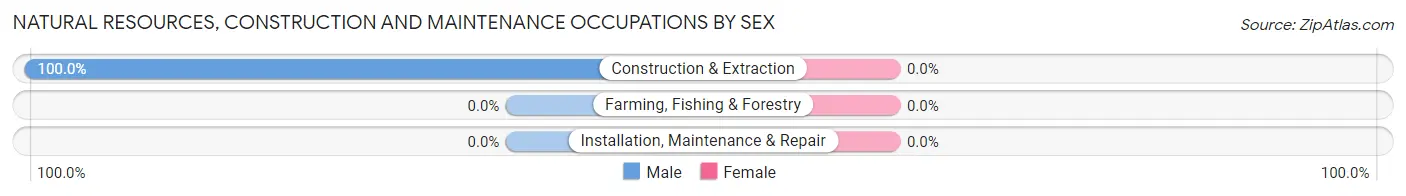
| Occupation | Male | Female |
| Farming, Fishing & Forestry | 0 (0.0%) | 0 (0.0%) |
| Construction & Extraction | 10 (100.0%) | 0 (0.0%) |
| Installation, Maintenance & Repair | 0 (0.0%) | 0 (0.0%) |
| Total (Category) | 10 (100.0%) | 0 (0.0%) |
| Total (Overall) | 141 (44.2%) | 178 (55.8%) |
Production, Transportation and Moving Occupations
The most common Production, Transportation and Moving occupations in Havre North are Material Moving (30 | 9.4%), Transportation (16 | 5.0%), and Production (4 | 1.3%).
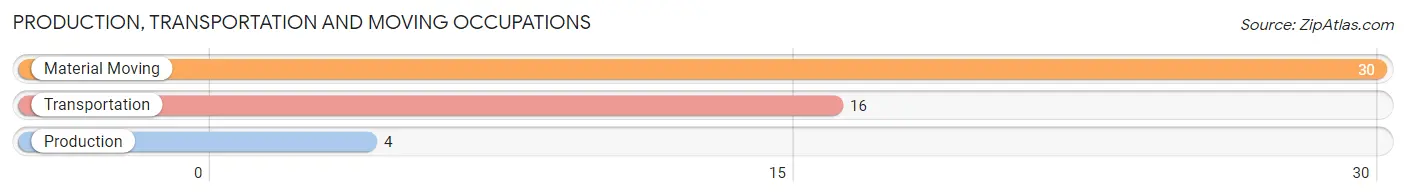
Production, Transportation and Moving Occupations by Sex
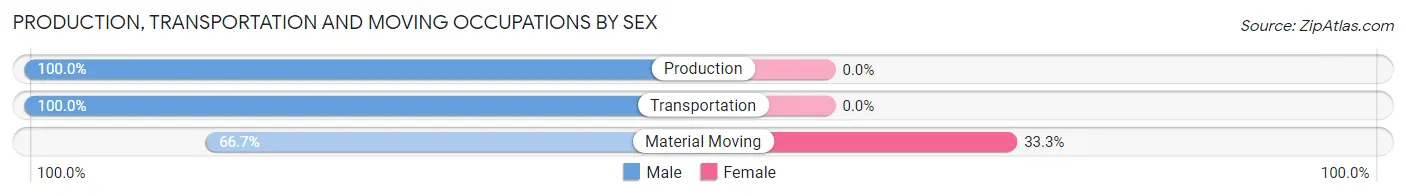
| Occupation | Male | Female |
| Production | 4 (100.0%) | 0 (0.0%) |
| Transportation | 16 (100.0%) | 0 (0.0%) |
| Material Moving | 20 (66.7%) | 10 (33.3%) |
| Total (Category) | 40 (80.0%) | 10 (20.0%) |
| Total (Overall) | 141 (44.2%) | 178 (55.8%) |
Employment Industries by Sex in Havre North
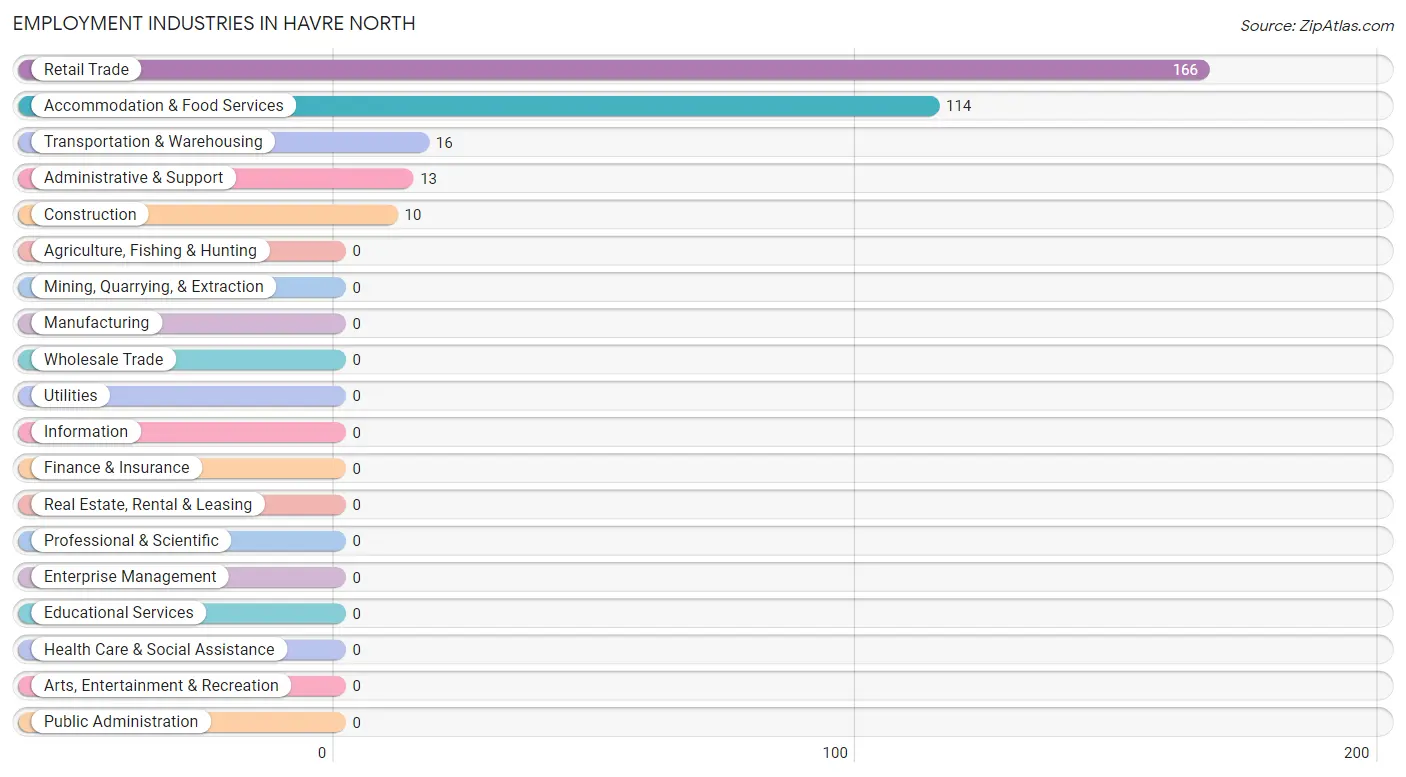
Employment Industries in Havre North
The major employment industries in Havre North include Retail Trade (166 | 52.0%), Accommodation & Food Services (114 | 35.7%), Transportation & Warehousing (16 | 5.0%), Administrative & Support (13 | 4.1%), and Construction (10 | 3.1%).
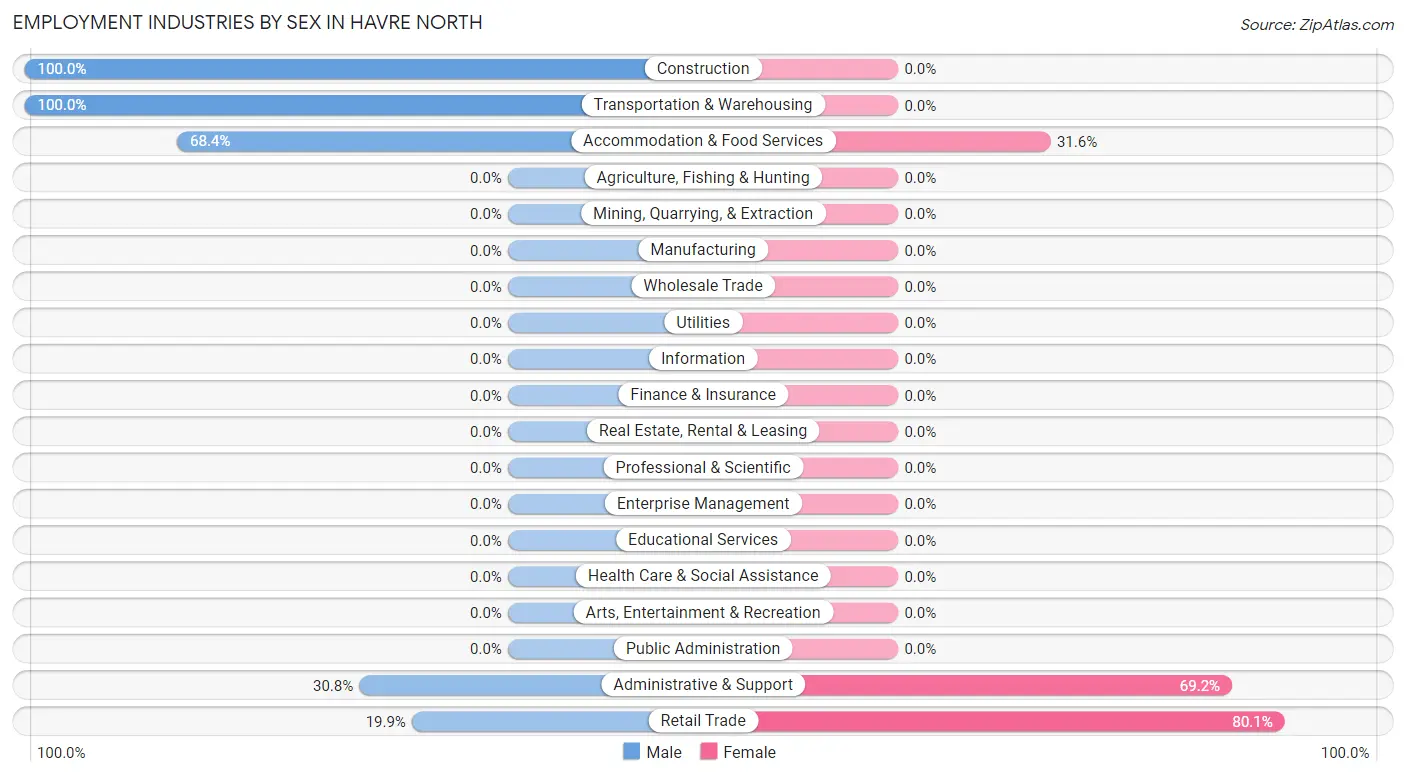
Employment Industries by Sex in Havre North
The Havre North industries that see more men than women are Construction (100.0%), Transportation & Warehousing (100.0%), and Accommodation & Food Services (68.4%), whereas the industries that tend to have a higher number of women are Retail Trade (80.1%), Administrative & Support (69.2%), and Accommodation & Food Services (31.6%).
| Industry | Male | Female |
| Agriculture, Fishing & Hunting | 0 (0.0%) | 0 (0.0%) |
| Mining, Quarrying, & Extraction | 0 (0.0%) | 0 (0.0%) |
| Construction | 10 (100.0%) | 0 (0.0%) |
| Manufacturing | 0 (0.0%) | 0 (0.0%) |
| Wholesale Trade | 0 (0.0%) | 0 (0.0%) |
| Retail Trade | 33 (19.9%) | 133 (80.1%) |
| Transportation & Warehousing | 16 (100.0%) | 0 (0.0%) |
| Utilities | 0 (0.0%) | 0 (0.0%) |
| Information | 0 (0.0%) | 0 (0.0%) |
| Finance & Insurance | 0 (0.0%) | 0 (0.0%) |
| Real Estate, Rental & Leasing | 0 (0.0%) | 0 (0.0%) |
| Professional & Scientific | 0 (0.0%) | 0 (0.0%) |
| Enterprise Management | 0 (0.0%) | 0 (0.0%) |
| Administrative & Support | 4 (30.8%) | 9 (69.2%) |
| Educational Services | 0 (0.0%) | 0 (0.0%) |
| Health Care & Social Assistance | 0 (0.0%) | 0 (0.0%) |
| Arts, Entertainment & Recreation | 0 (0.0%) | 0 (0.0%) |
| Accommodation & Food Services | 78 (68.4%) | 36 (31.6%) |
| Public Administration | 0 (0.0%) | 0 (0.0%) |
| Total | 141 (44.2%) | 178 (55.8%) |
Education in Havre North
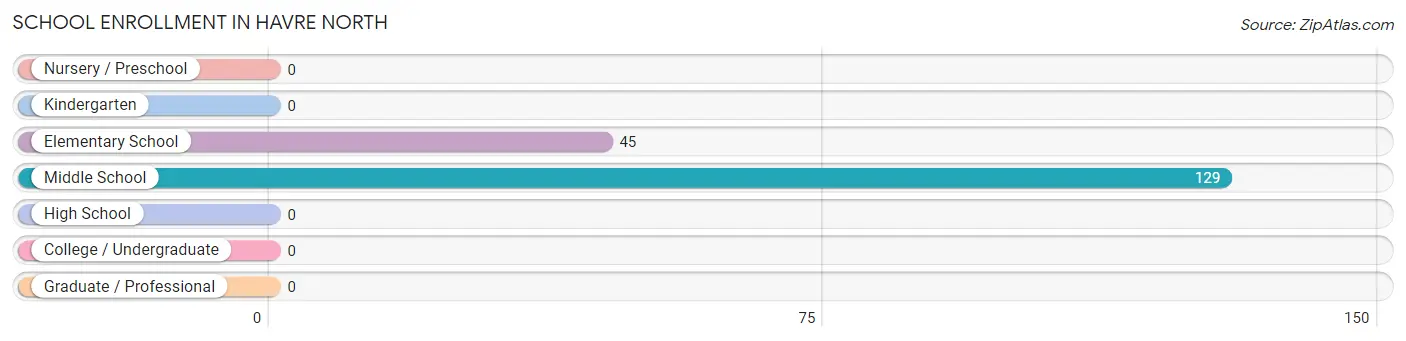
School Enrollment in Havre North
The most common levels of schooling among the 174 students in Havre North are middle school (129 | 74.1%), and elementary school (45 | 25.9%).
| School Level | # Students | % Students |
| Nursery / Preschool | 0 | 0.0% |
| Kindergarten | 0 | 0.0% |
| Elementary School | 45 | 25.9% |
| Middle School | 129 | 74.1% |
| High School | 0 | 0.0% |
| College / Undergraduate | 0 | 0.0% |
| Graduate / Professional | 0 | 0.0% |
| Total | 174 | 100.0% |
School Enrollment by Age by Funding Source in Havre North
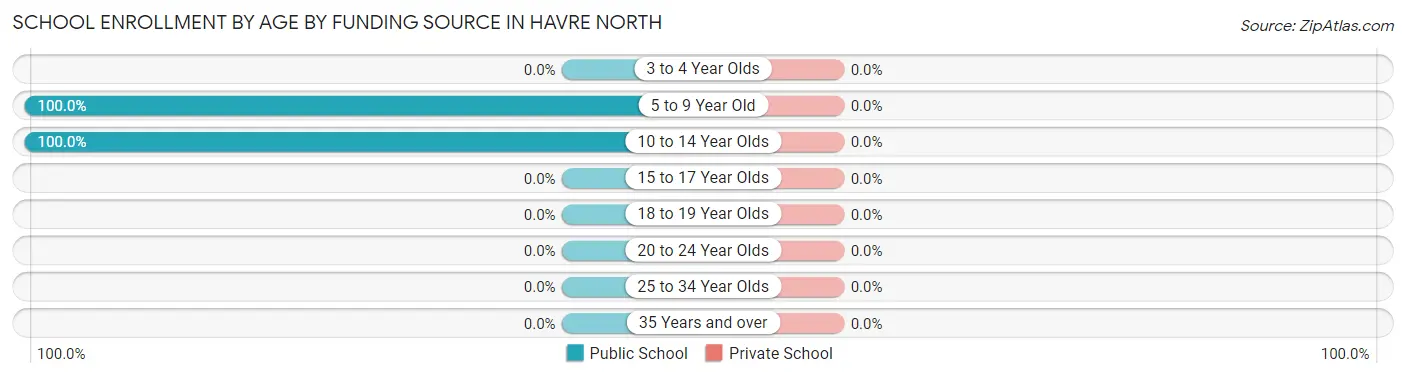
| Age Bracket | Public School | Private School |
| 3 to 4 Year Olds | 0 (0.0%) | 0 (0.0%) |
| 5 to 9 Year Old | 45 (100.0%) | 0 (0.0%) |
| 10 to 14 Year Olds | 129 (100.0%) | 0 (0.0%) |
| 15 to 17 Year Olds | 0 (0.0%) | 0 (0.0%) |
| 18 to 19 Year Olds | 0 (0.0%) | 0 (0.0%) |
| 20 to 24 Year Olds | 0 (0.0%) | 0 (0.0%) |
| 25 to 34 Year Olds | 0 (0.0%) | 0 (0.0%) |
| 35 Years and over | 0 (0.0%) | 0 (0.0%) |
| Total | 174 (100.0%) | 0 (0.0%) |
Educational Attainment by Field of Study in Havre North
Science & technology (20 | 30.8%), liberal arts & history (18 | 27.7%), psychology (10 | 15.4%), education (10 | 15.4%), and business (7 | 10.8%) are the most common fields of study among 65 individuals in Havre North who have obtained a bachelor's degree or higher.
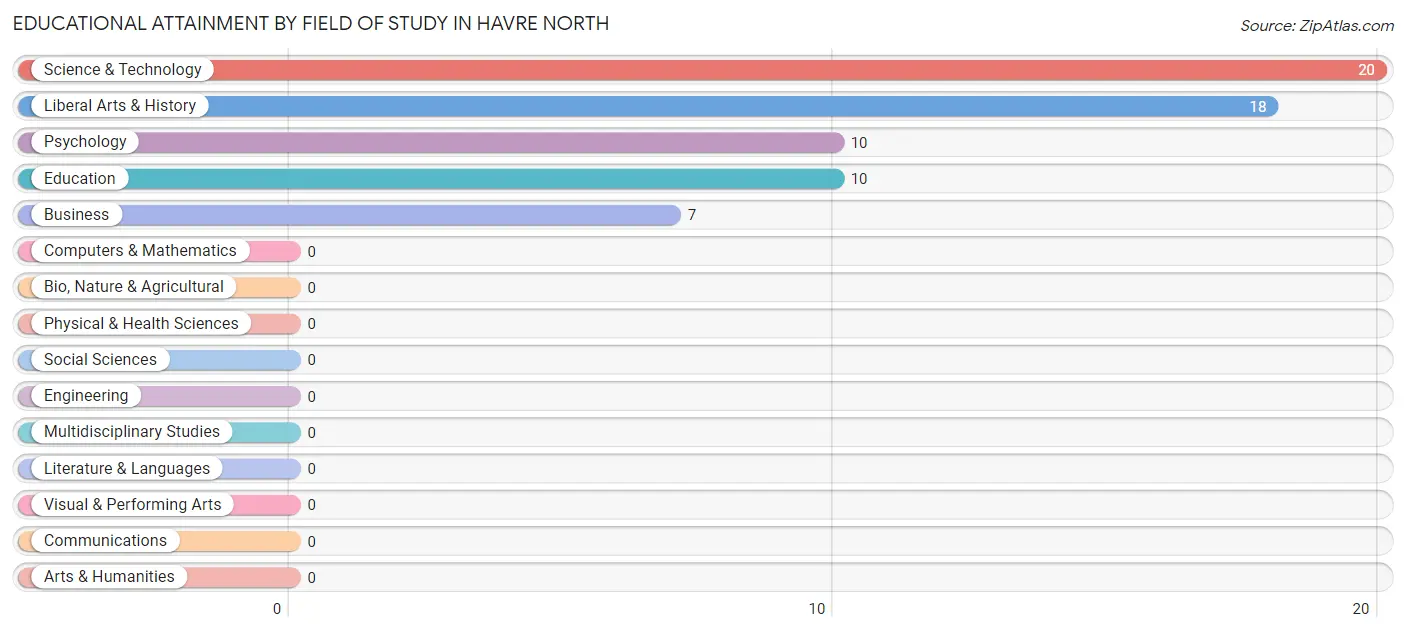
| Field of Study | # Graduates | % Graduates |
| Computers & Mathematics | 0 | 0.0% |
| Bio, Nature & Agricultural | 0 | 0.0% |
| Physical & Health Sciences | 0 | 0.0% |
| Psychology | 10 | 15.4% |
| Social Sciences | 0 | 0.0% |
| Engineering | 0 | 0.0% |
| Multidisciplinary Studies | 0 | 0.0% |
| Science & Technology | 20 | 30.8% |
| Business | 7 | 10.8% |
| Education | 10 | 15.4% |
| Literature & Languages | 0 | 0.0% |
| Liberal Arts & History | 18 | 27.7% |
| Visual & Performing Arts | 0 | 0.0% |
| Communications | 0 | 0.0% |
| Arts & Humanities | 0 | 0.0% |
| Total | 65 | 100.0% |
Transportation & Commute in Havre North
Vehicle Availability by Sex in Havre North
The most prevalent vehicle ownership categories in Havre North are males with 2 vehicles (77, accounting for 56.2%) and females with 2 vehicles (123, making up 43.3%).
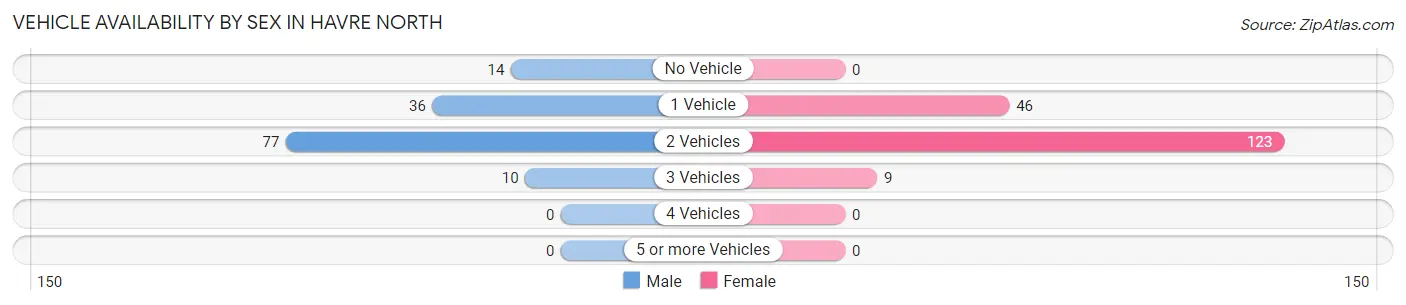
| Vehicles Available | Male | Female |
| No Vehicle | 14 (10.2%) | 0 (0.0%) |
| 1 Vehicle | 36 (26.3%) | 46 (25.8%) |
| 2 Vehicles | 77 (56.2%) | 123 (69.1%) |
| 3 Vehicles | 10 (7.3%) | 9 (5.1%) |
| 4 Vehicles | 0 (0.0%) | 0 (0.0%) |
| 5 or more Vehicles | 0 (0.0%) | 0 (0.0%) |
| Total | 137 (100.0%) | 178 (100.0%) |
Commute Time in Havre North
The most frequently occuring commute durations in Havre North are 20 to 24 minutes (132 commuters, 41.4%), 10 to 14 minutes (77 commuters, 24.1%), and 5 to 9 minutes (60 commuters, 18.8%).
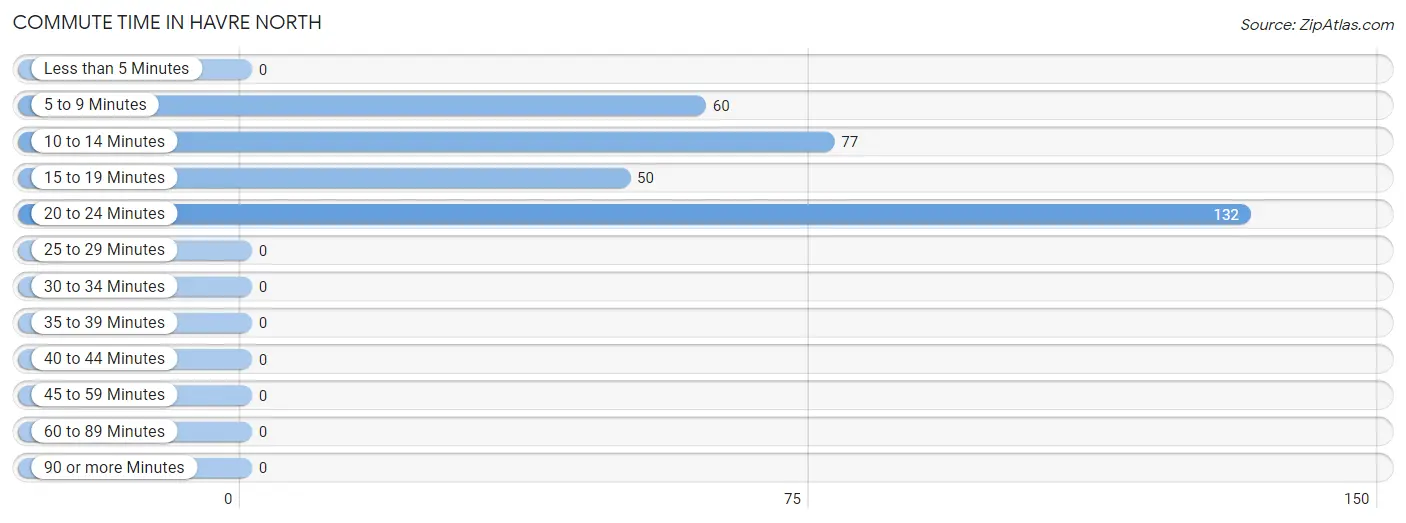
| Commute Time | # Commuters | % Commuters |
| Less than 5 Minutes | 0 | 0.0% |
| 5 to 9 Minutes | 60 | 18.8% |
| 10 to 14 Minutes | 77 | 24.1% |
| 15 to 19 Minutes | 50 | 15.7% |
| 20 to 24 Minutes | 132 | 41.4% |
| 25 to 29 Minutes | 0 | 0.0% |
| 30 to 34 Minutes | 0 | 0.0% |
| 35 to 39 Minutes | 0 | 0.0% |
| 40 to 44 Minutes | 0 | 0.0% |
| 45 to 59 Minutes | 0 | 0.0% |
| 60 to 89 Minutes | 0 | 0.0% |
| 90 or more Minutes | 0 | 0.0% |
Commute Time by Sex in Havre North
The most common commute times in Havre North are 10 to 14 minutes (77 commuters, 54.6%) for males and 20 to 24 minutes (132 commuters, 74.2%) for females.
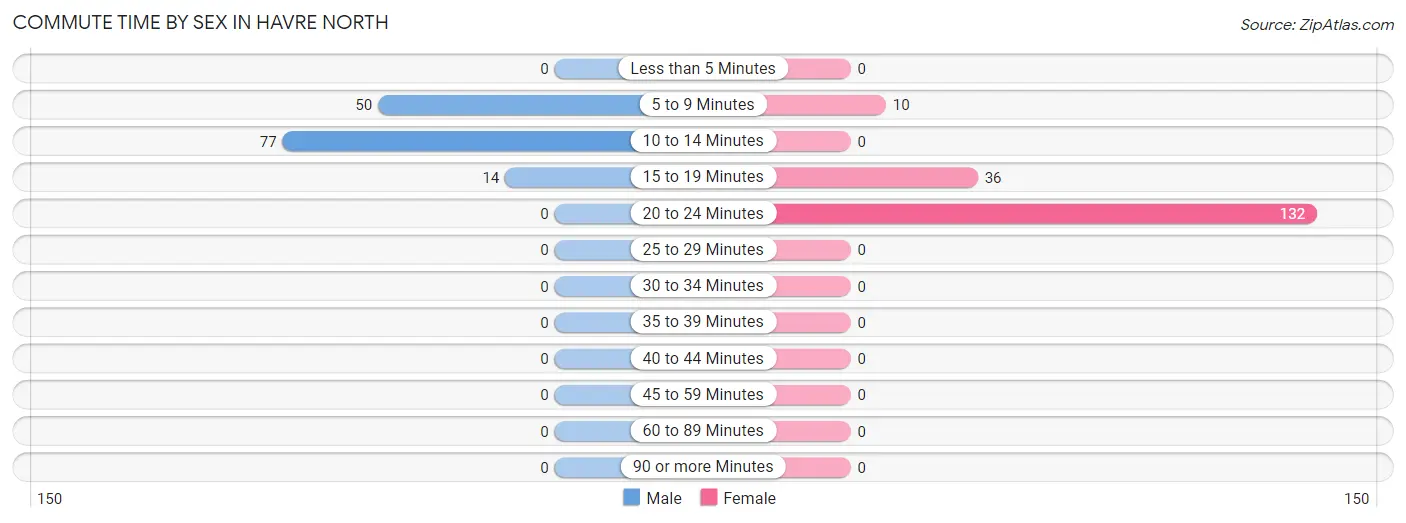
| Commute Time | Male | Female |
| Less than 5 Minutes | 0 (0.0%) | 0 (0.0%) |
| 5 to 9 Minutes | 50 (35.5%) | 10 (5.6%) |
| 10 to 14 Minutes | 77 (54.6%) | 0 (0.0%) |
| 15 to 19 Minutes | 14 (9.9%) | 36 (20.2%) |
| 20 to 24 Minutes | 0 (0.0%) | 132 (74.2%) |
| 25 to 29 Minutes | 0 (0.0%) | 0 (0.0%) |
| 30 to 34 Minutes | 0 (0.0%) | 0 (0.0%) |
| 35 to 39 Minutes | 0 (0.0%) | 0 (0.0%) |
| 40 to 44 Minutes | 0 (0.0%) | 0 (0.0%) |
| 45 to 59 Minutes | 0 (0.0%) | 0 (0.0%) |
| 60 to 89 Minutes | 0 (0.0%) | 0 (0.0%) |
| 90 or more Minutes | 0 (0.0%) | 0 (0.0%) |
Time of Departure to Work by Sex in Havre North
The most frequent times of departure to work in Havre North are 10:00 AM to 10:59 AM (64, 45.4%) for males and 12:00 PM to 3:59 PM (75, 42.1%) for females.
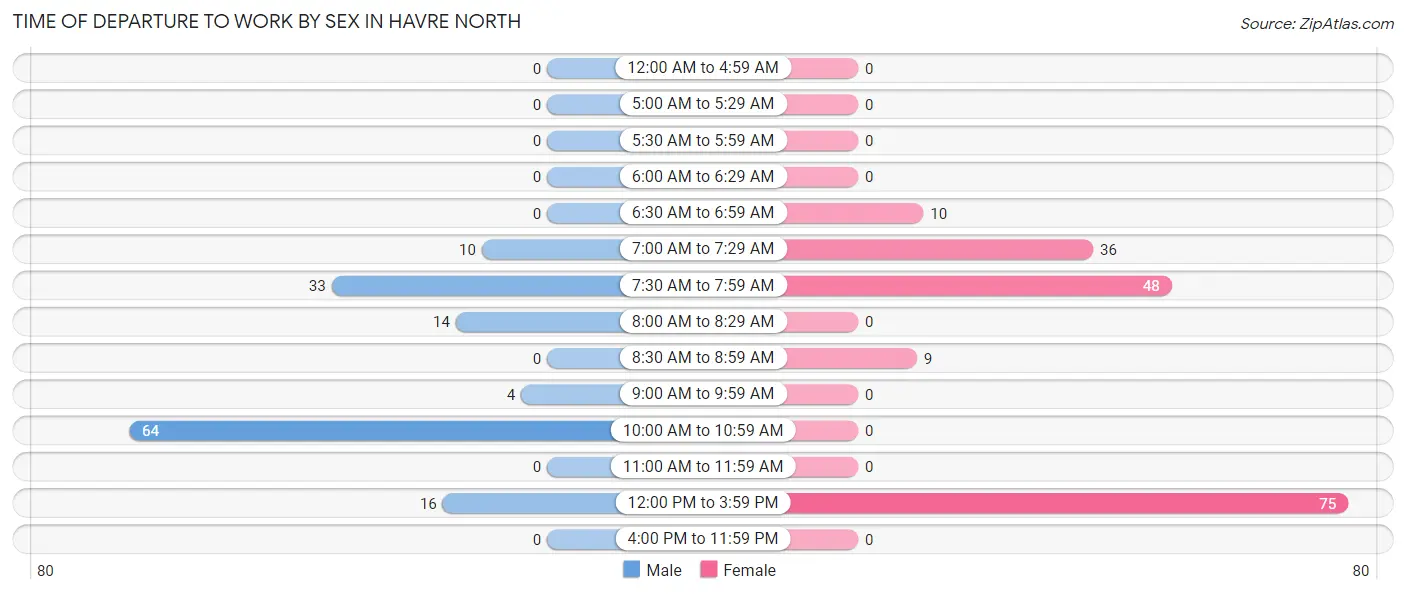
| Time of Departure | Male | Female |
| 12:00 AM to 4:59 AM | 0 (0.0%) | 0 (0.0%) |
| 5:00 AM to 5:29 AM | 0 (0.0%) | 0 (0.0%) |
| 5:30 AM to 5:59 AM | 0 (0.0%) | 0 (0.0%) |
| 6:00 AM to 6:29 AM | 0 (0.0%) | 0 (0.0%) |
| 6:30 AM to 6:59 AM | 0 (0.0%) | 10 (5.6%) |
| 7:00 AM to 7:29 AM | 10 (7.1%) | 36 (20.2%) |
| 7:30 AM to 7:59 AM | 33 (23.4%) | 48 (27.0%) |
| 8:00 AM to 8:29 AM | 14 (9.9%) | 0 (0.0%) |
| 8:30 AM to 8:59 AM | 0 (0.0%) | 9 (5.1%) |
| 9:00 AM to 9:59 AM | 4 (2.8%) | 0 (0.0%) |
| 10:00 AM to 10:59 AM | 64 (45.4%) | 0 (0.0%) |
| 11:00 AM to 11:59 AM | 0 (0.0%) | 0 (0.0%) |
| 12:00 PM to 3:59 PM | 16 (11.4%) | 75 (42.1%) |
| 4:00 PM to 11:59 PM | 0 (0.0%) | 0 (0.0%) |
| Total | 141 (100.0%) | 178 (100.0%) |
Housing Occupancy in Havre North
Occupancy by Ownership in Havre North
Of the total 370 dwellings in Havre North, owner-occupied units account for 140 (37.8%), while renter-occupied units make up 230 (62.2%).
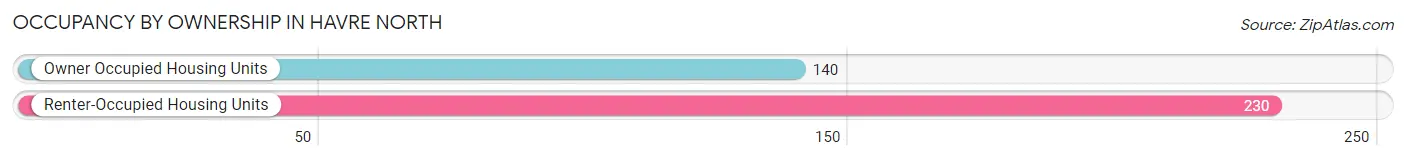
| Occupancy | # Housing Units | % Housing Units |
| Owner Occupied Housing Units | 140 | 37.8% |
| Renter-Occupied Housing Units | 230 | 62.2% |
| Total Occupied Housing Units | 370 | 100.0% |
Occupancy by Household Size in Havre North
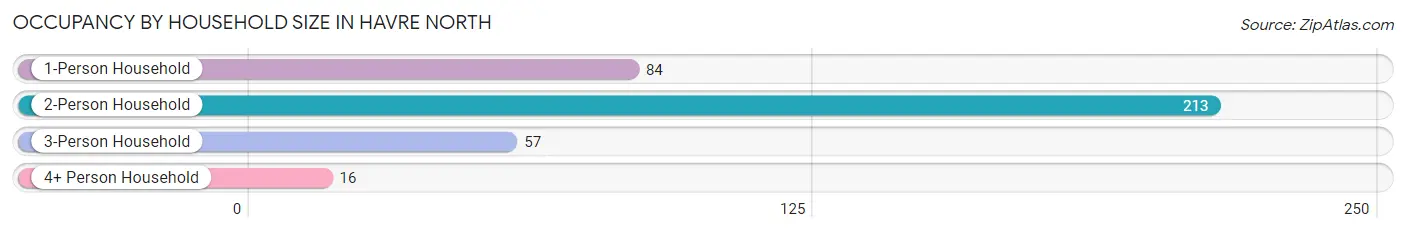
| Household Size | # Housing Units | % Housing Units |
| 1-Person Household | 84 | 22.7% |
| 2-Person Household | 213 | 57.6% |
| 3-Person Household | 57 | 15.4% |
| 4+ Person Household | 16 | 4.3% |
| Total Housing Units | 370 | 100.0% |
Occupancy by Ownership by Household Size in Havre North
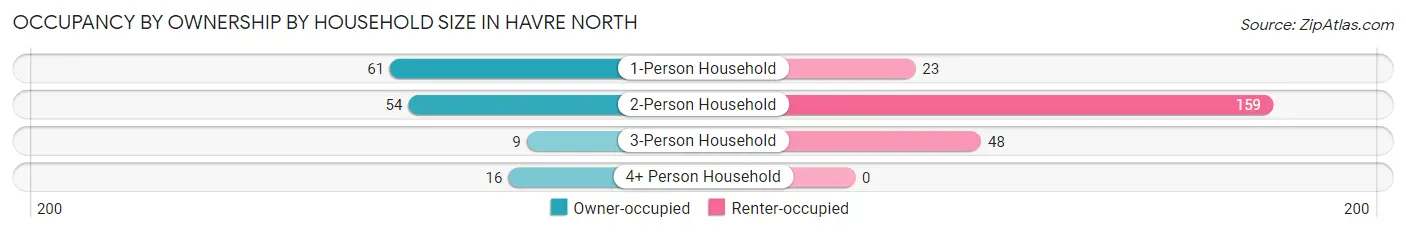
| Household Size | Owner-occupied | Renter-occupied |
| 1-Person Household | 61 (72.6%) | 23 (27.4%) |
| 2-Person Household | 54 (25.4%) | 159 (74.7%) |
| 3-Person Household | 9 (15.8%) | 48 (84.2%) |
| 4+ Person Household | 16 (100.0%) | 0 (0.0%) |
| Total Housing Units | 140 (37.8%) | 230 (62.2%) |
Occupancy by Educational Attainment in Havre North
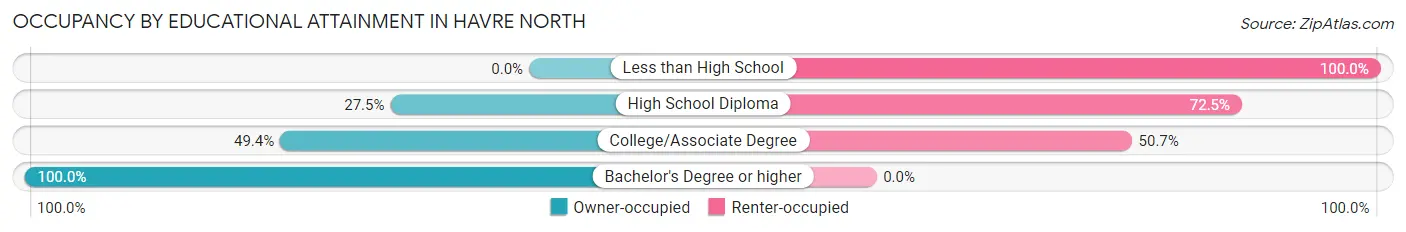
| Household Size | Owner-occupied | Renter-occupied |
| Less than High School | 0 (0.0%) | 36 (100.0%) |
| High School Diploma | 44 (27.5%) | 116 (72.5%) |
| College/Associate Degree | 76 (49.3%) | 78 (50.6%) |
| Bachelor's Degree or higher | 20 (100.0%) | 0 (0.0%) |
Occupancy by Age of Householder in Havre North
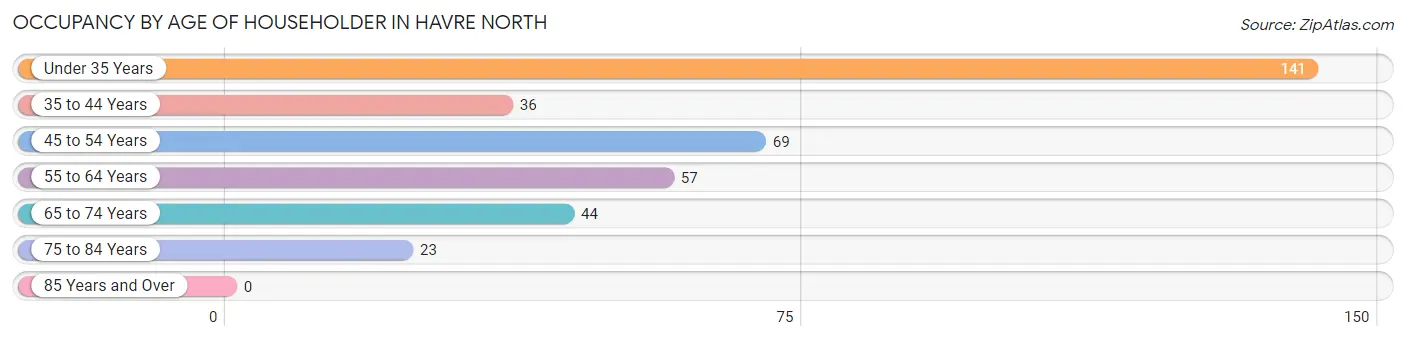
| Age Bracket | # Households | % Households |
| Under 35 Years | 141 | 38.1% |
| 35 to 44 Years | 36 | 9.7% |
| 45 to 54 Years | 69 | 18.6% |
| 55 to 64 Years | 57 | 15.4% |
| 65 to 74 Years | 44 | 11.9% |
| 75 to 84 Years | 23 | 6.2% |
| 85 Years and Over | 0 | 0.0% |
| Total | 370 | 100.0% |
Housing Finances in Havre North
Median Income by Occupancy in Havre North
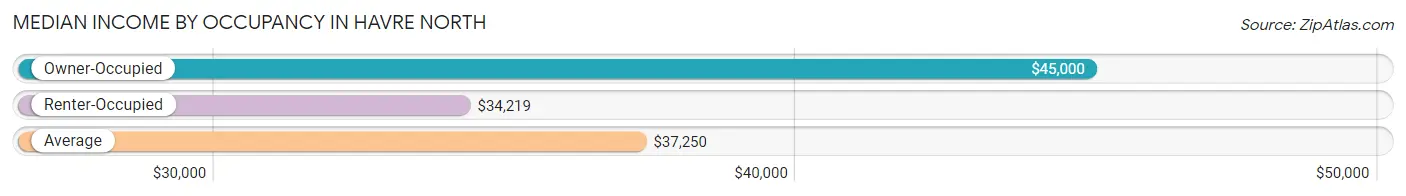
| Occupancy Type | # Households | Median Income |
| Owner-Occupied | 140 (37.8%) | $45,000 |
| Renter-Occupied | 230 (62.2%) | $34,219 |
| Average | 370 (100.0%) | $37,250 |
Occupancy by Householder Income Bracket in Havre North
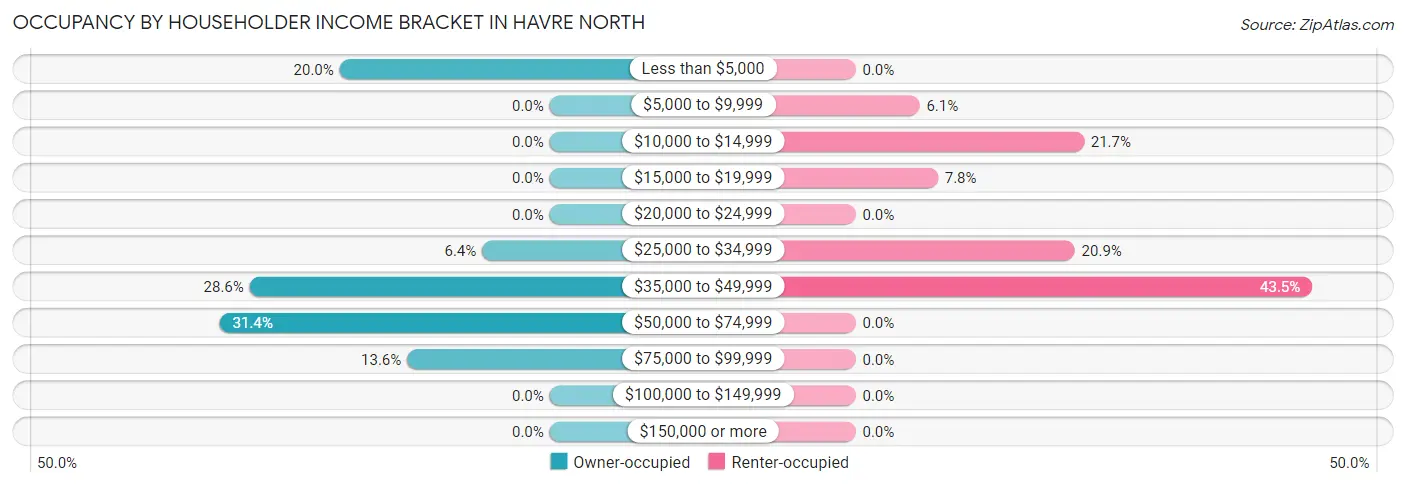
| Income Bracket | Owner-occupied | Renter-occupied |
| Less than $5,000 | 28 (20.0%) | 0 (0.0%) |
| $5,000 to $9,999 | 0 (0.0%) | 14 (6.1%) |
| $10,000 to $14,999 | 0 (0.0%) | 50 (21.7%) |
| $15,000 to $19,999 | 0 (0.0%) | 18 (7.8%) |
| $20,000 to $24,999 | 0 (0.0%) | 0 (0.0%) |
| $25,000 to $34,999 | 9 (6.4%) | 48 (20.9%) |
| $35,000 to $49,999 | 40 (28.6%) | 100 (43.5%) |
| $50,000 to $74,999 | 44 (31.4%) | 0 (0.0%) |
| $75,000 to $99,999 | 19 (13.6%) | 0 (0.0%) |
| $100,000 to $149,999 | 0 (0.0%) | 0 (0.0%) |
| $150,000 or more | 0 (0.0%) | 0 (0.0%) |
| Total | 140 (100.0%) | 230 (100.0%) |
Monthly Housing Cost Tiers in Havre North
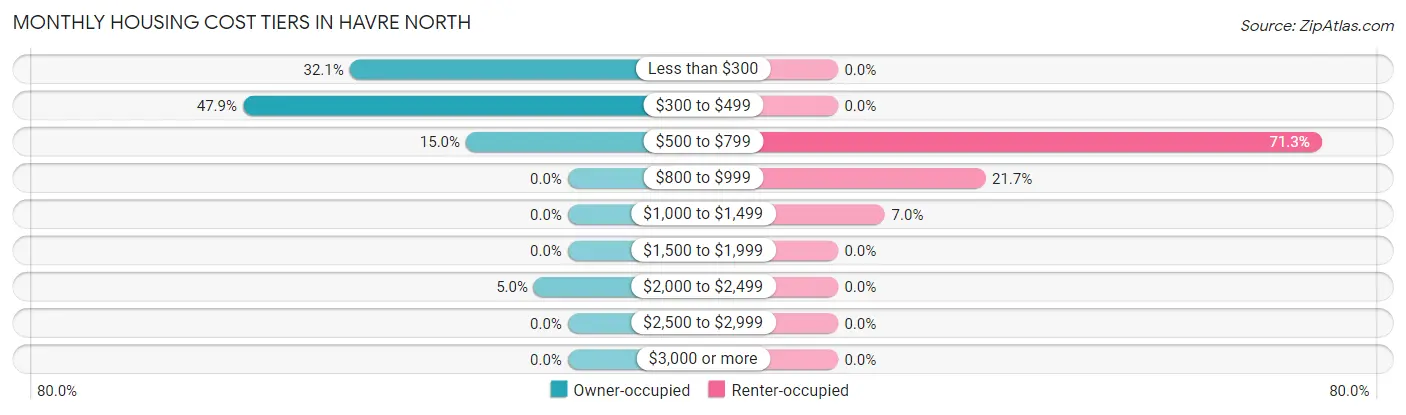
| Monthly Cost | Owner-occupied | Renter-occupied |
| Less than $300 | 45 (32.1%) | 0 (0.0%) |
| $300 to $499 | 67 (47.9%) | 0 (0.0%) |
| $500 to $799 | 21 (15.0%) | 164 (71.3%) |
| $800 to $999 | 0 (0.0%) | 50 (21.7%) |
| $1,000 to $1,499 | 0 (0.0%) | 16 (7.0%) |
| $1,500 to $1,999 | 0 (0.0%) | 0 (0.0%) |
| $2,000 to $2,499 | 7 (5.0%) | 0 (0.0%) |
| $2,500 to $2,999 | 0 (0.0%) | 0 (0.0%) |
| $3,000 or more | 0 (0.0%) | 0 (0.0%) |
| Total | 140 (100.0%) | 230 (100.0%) |
Physical Housing Characteristics in Havre North
Housing Structures in Havre North
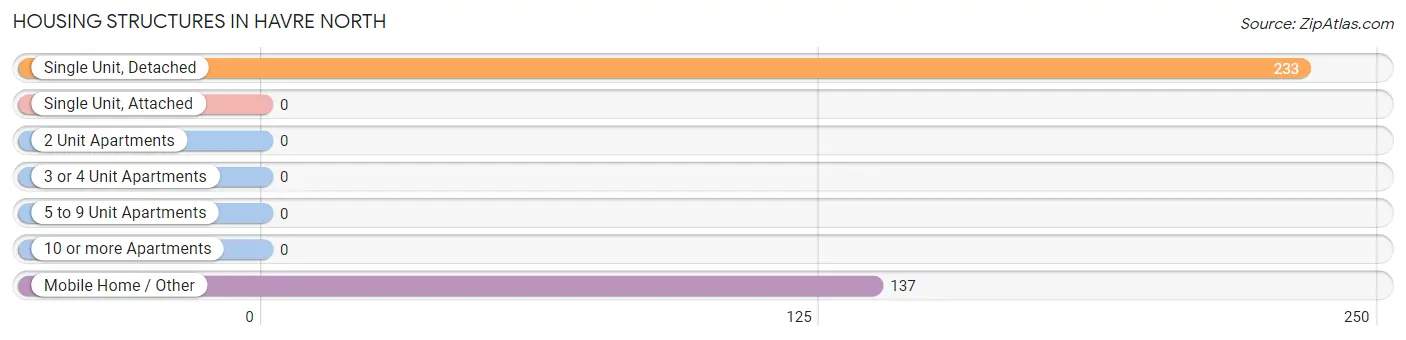
| Structure Type | # Housing Units | % Housing Units |
| Single Unit, Detached | 233 | 63.0% |
| Single Unit, Attached | 0 | 0.0% |
| 2 Unit Apartments | 0 | 0.0% |
| 3 or 4 Unit Apartments | 0 | 0.0% |
| 5 to 9 Unit Apartments | 0 | 0.0% |
| 10 or more Apartments | 0 | 0.0% |
| Mobile Home / Other | 137 | 37.0% |
| Total | 370 | 100.0% |
Housing Structures by Occupancy in Havre North
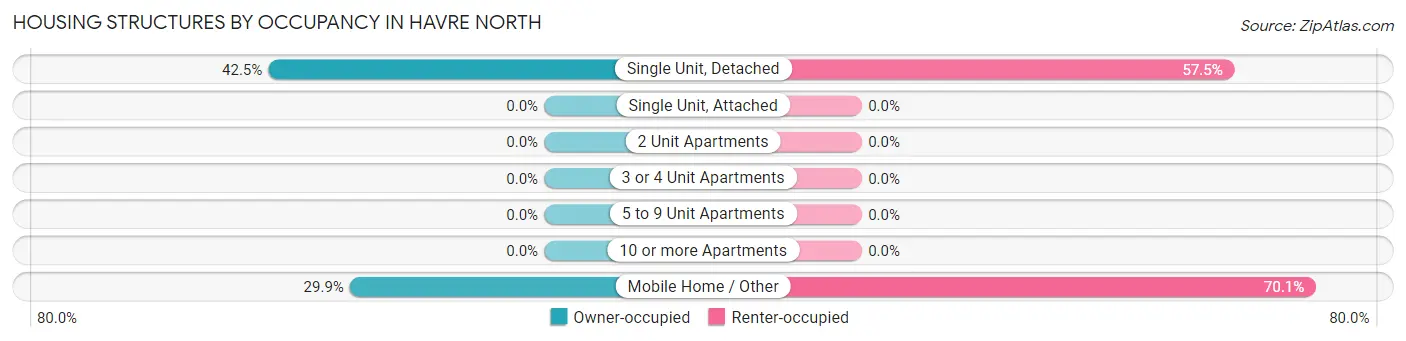
| Structure Type | Owner-occupied | Renter-occupied |
| Single Unit, Detached | 99 (42.5%) | 134 (57.5%) |
| Single Unit, Attached | 0 (0.0%) | 0 (0.0%) |
| 2 Unit Apartments | 0 (0.0%) | 0 (0.0%) |
| 3 or 4 Unit Apartments | 0 (0.0%) | 0 (0.0%) |
| 5 to 9 Unit Apartments | 0 (0.0%) | 0 (0.0%) |
| 10 or more Apartments | 0 (0.0%) | 0 (0.0%) |
| Mobile Home / Other | 41 (29.9%) | 96 (70.1%) |
| Total | 140 (37.8%) | 230 (62.2%) |
Housing Structures by Number of Rooms in Havre North
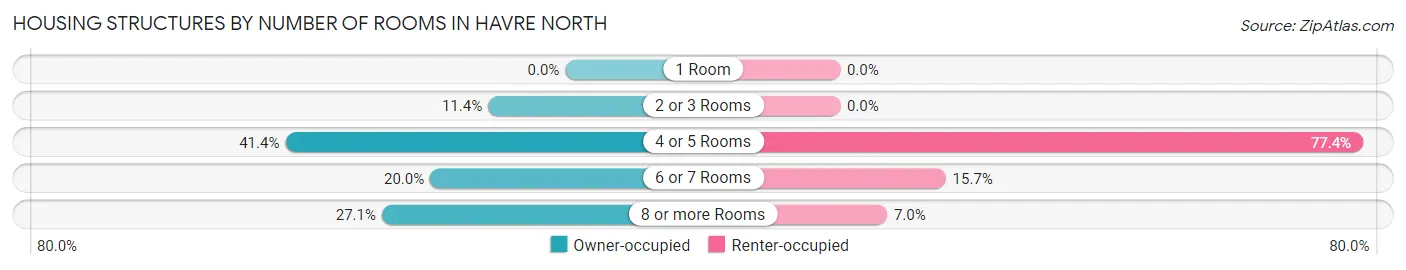
| Number of Rooms | Owner-occupied | Renter-occupied |
| 1 Room | 0 (0.0%) | 0 (0.0%) |
| 2 or 3 Rooms | 16 (11.4%) | 0 (0.0%) |
| 4 or 5 Rooms | 58 (41.4%) | 178 (77.4%) |
| 6 or 7 Rooms | 28 (20.0%) | 36 (15.7%) |
| 8 or more Rooms | 38 (27.1%) | 16 (7.0%) |
| Total | 140 (100.0%) | 230 (100.0%) |
Housing Structure by Heating Type in Havre North
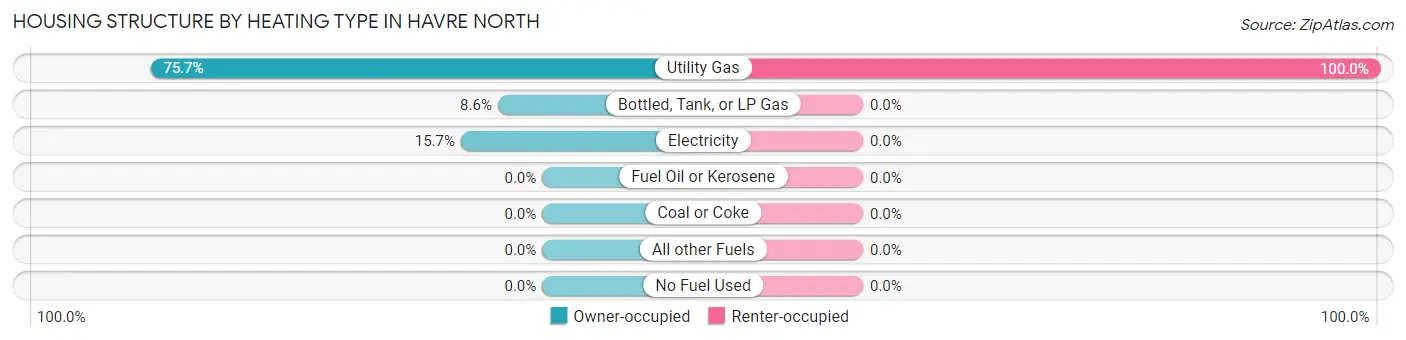
| Heating Type | Owner-occupied | Renter-occupied |
| Utility Gas | 106 (75.7%) | 230 (100.0%) |
| Bottled, Tank, or LP Gas | 12 (8.6%) | 0 (0.0%) |
| Electricity | 22 (15.7%) | 0 (0.0%) |
| Fuel Oil or Kerosene | 0 (0.0%) | 0 (0.0%) |
| Coal or Coke | 0 (0.0%) | 0 (0.0%) |
| All other Fuels | 0 (0.0%) | 0 (0.0%) |
| No Fuel Used | 0 (0.0%) | 0 (0.0%) |
| Total | 140 (100.0%) | 230 (100.0%) |
Household Vehicle Usage in Havre North
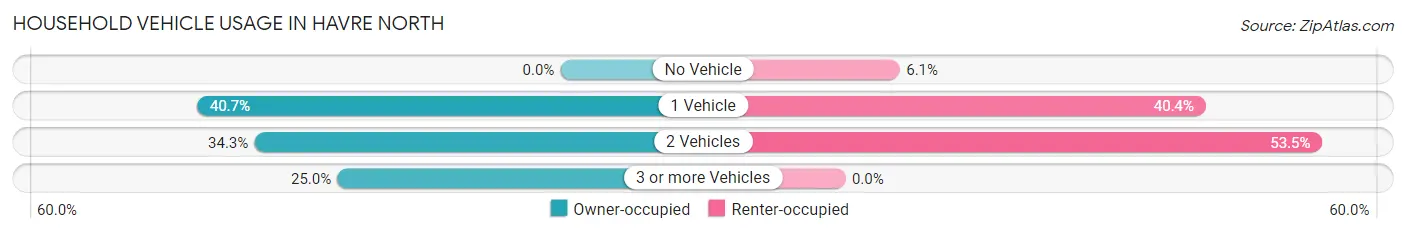
| Vehicles per Household | Owner-occupied | Renter-occupied |
| No Vehicle | 0 (0.0%) | 14 (6.1%) |
| 1 Vehicle | 57 (40.7%) | 93 (40.4%) |
| 2 Vehicles | 48 (34.3%) | 123 (53.5%) |
| 3 or more Vehicles | 35 (25.0%) | 0 (0.0%) |
| Total | 140 (100.0%) | 230 (100.0%) |
Real Estate & Mortgages in Havre North
Real Estate and Mortgage Overview in Havre North
| Characteristic | Without Mortgage | With Mortgage |
| Housing Units | 124 | 16 |
| Median Property Value | $129,300 | $0 |
| Median Household Income | $40,962 | $0 |
| Monthly Housing Costs | $322 | $0 |
| Real Estate Taxes | $1,300 | $0 |
Property Value by Mortgage Status in Havre North
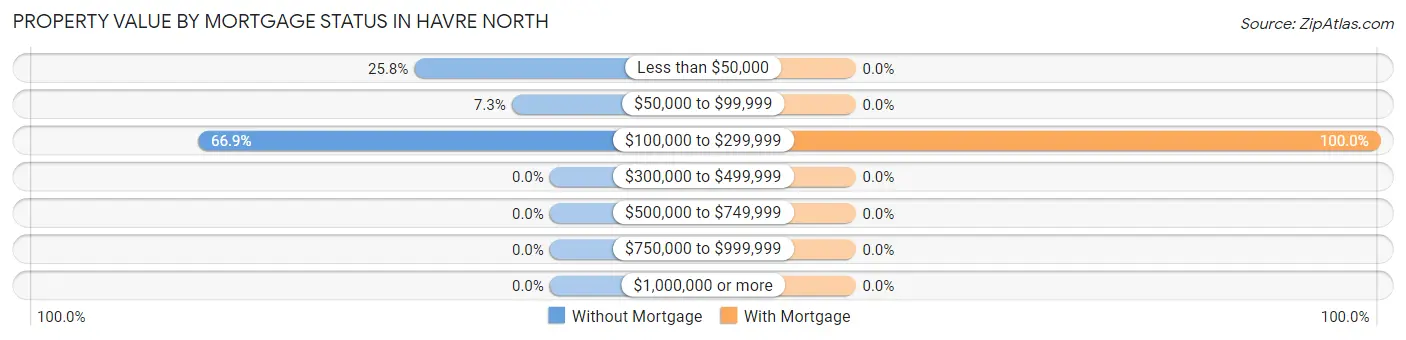
| Property Value | Without Mortgage | With Mortgage |
| Less than $50,000 | 32 (25.8%) | 0 (0.0%) |
| $50,000 to $99,999 | 9 (7.3%) | 0 (0.0%) |
| $100,000 to $299,999 | 83 (66.9%) | 16 (100.0%) |
| $300,000 to $499,999 | 0 (0.0%) | 0 (0.0%) |
| $500,000 to $749,999 | 0 (0.0%) | 0 (0.0%) |
| $750,000 to $999,999 | 0 (0.0%) | 0 (0.0%) |
| $1,000,000 or more | 0 (0.0%) | 0 (0.0%) |
| Total | 124 (100.0%) | 16 (100.0%) |
Household Income by Mortgage Status in Havre North
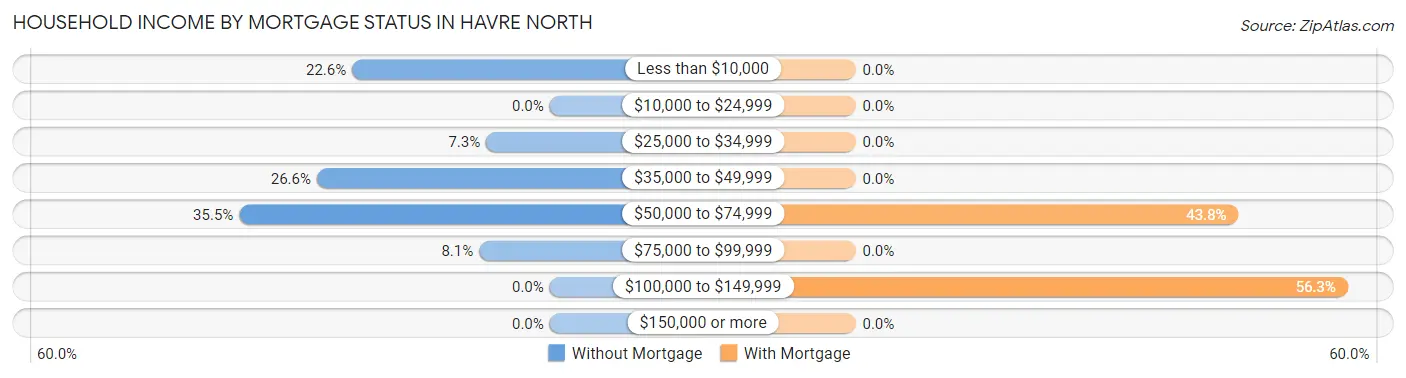
| Household Income | Without Mortgage | With Mortgage |
| Less than $10,000 | 28 (22.6%) | 0 (0.0%) |
| $10,000 to $24,999 | 0 (0.0%) | 0 (0.0%) |
| $25,000 to $34,999 | 9 (7.3%) | 0 (0.0%) |
| $35,000 to $49,999 | 33 (26.6%) | 0 (0.0%) |
| $50,000 to $74,999 | 44 (35.5%) | 7 (43.8%) |
| $75,000 to $99,999 | 10 (8.1%) | 0 (0.0%) |
| $100,000 to $149,999 | 0 (0.0%) | 9 (56.2%) |
| $150,000 or more | 0 (0.0%) | 0 (0.0%) |
| Total | 124 (100.0%) | 16 (100.0%) |
Property Value to Household Income Ratio in Havre North
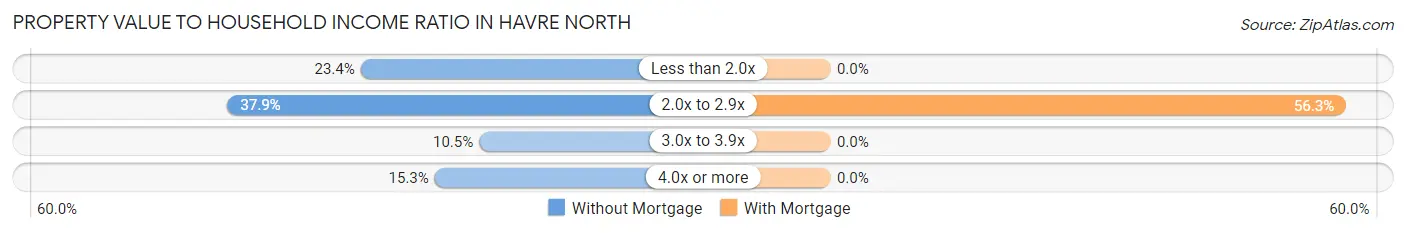
| Value-to-Income Ratio | Without Mortgage | With Mortgage |
| Less than 2.0x | 29 (23.4%) | 0 (0.0%) |
| 2.0x to 2.9x | 47 (37.9%) | 9 (56.2%) |
| 3.0x to 3.9x | 13 (10.5%) | 0 (0.0%) |
| 4.0x or more | 19 (15.3%) | 0 (0.0%) |
| Total | 124 (100.0%) | 16 (100.0%) |
Real Estate Taxes by Mortgage Status in Havre North
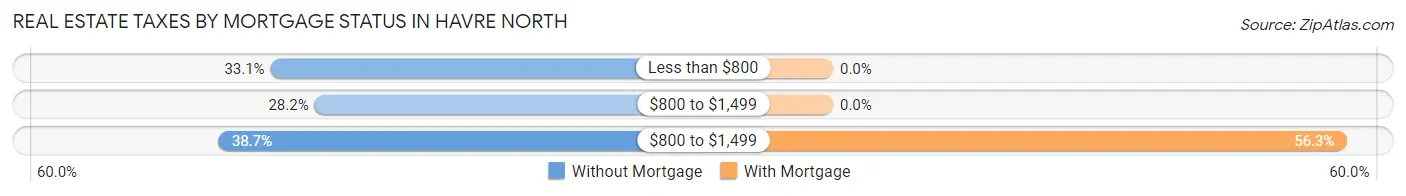
| Property Taxes | Without Mortgage | With Mortgage |
| Less than $800 | 41 (33.1%) | 0 (0.0%) |
| $800 to $1,499 | 35 (28.2%) | 0 (0.0%) |
| $800 to $1,499 | 48 (38.7%) | 9 (56.2%) |
| Total | 124 (100.0%) | 16 (100.0%) |
Health & Disability in Havre North
Health Insurance Coverage by Age in Havre North
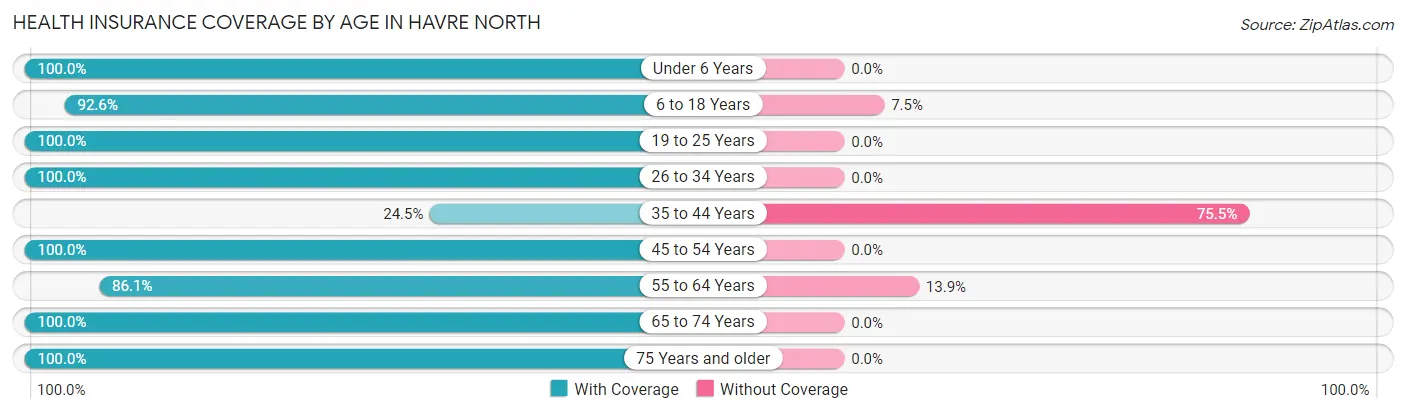
| Age Bracket | With Coverage | Without Coverage |
| Under 6 Years | 19 (100.0%) | 0 (0.0%) |
| 6 to 18 Years | 174 (92.5%) | 14 (7.4%) |
| 19 to 25 Years | 111 (100.0%) | 0 (0.0%) |
| 26 to 34 Years | 59 (100.0%) | 0 (0.0%) |
| 35 to 44 Years | 40 (24.5%) | 123 (75.5%) |
| 45 to 54 Years | 79 (100.0%) | 0 (0.0%) |
| 55 to 64 Years | 99 (86.1%) | 16 (13.9%) |
| 65 to 74 Years | 73 (100.0%) | 0 (0.0%) |
| 75 Years and older | 41 (100.0%) | 0 (0.0%) |
| Total | 695 (82.0%) | 153 (18.0%) |
Health Insurance Coverage by Citizenship Status in Havre North
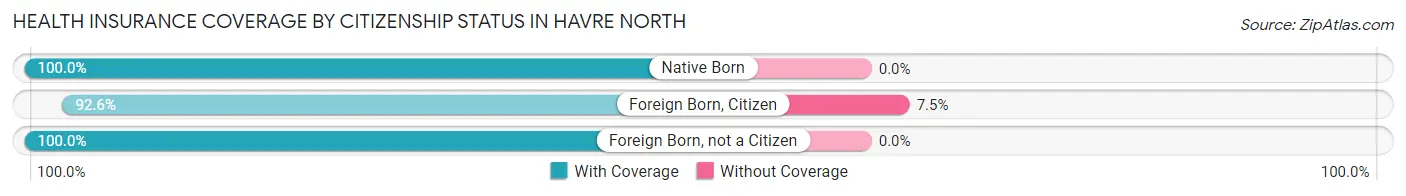
| Citizenship Status | With Coverage | Without Coverage |
| Native Born | 19 (100.0%) | 0 (0.0%) |
| Foreign Born, Citizen | 174 (92.5%) | 14 (7.4%) |
| Foreign Born, not a Citizen | 111 (100.0%) | 0 (0.0%) |
Health Insurance Coverage by Household Income in Havre North
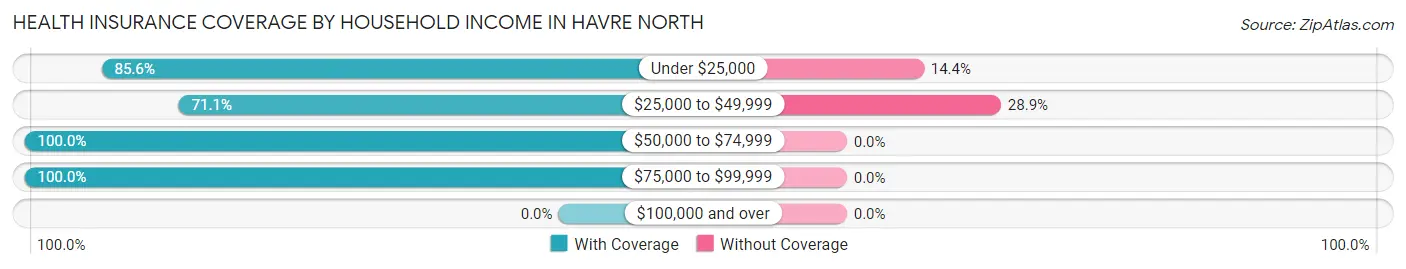
| Household Income | With Coverage | Without Coverage |
| Under $25,000 | 178 (85.6%) | 30 (14.4%) |
| $25,000 to $49,999 | 303 (71.1%) | 123 (28.9%) |
| $50,000 to $74,999 | 155 (100.0%) | 0 (0.0%) |
| $75,000 to $99,999 | 51 (100.0%) | 0 (0.0%) |
| $100,000 and over | 0 (0.0%) | 0 (0.0%) |
Public vs Private Health Insurance Coverage by Age in Havre North
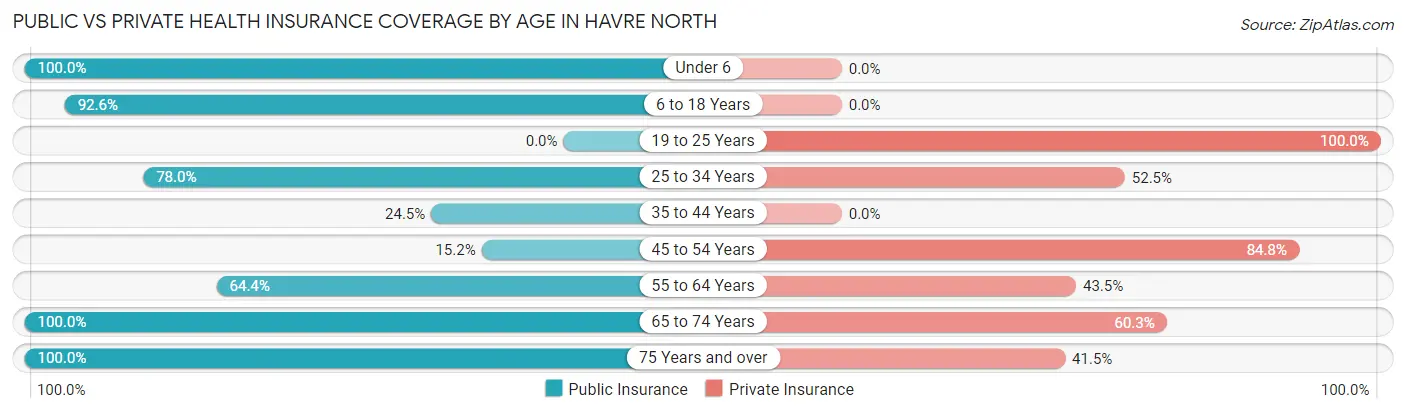
| Age Bracket | Public Insurance | Private Insurance |
| Under 6 | 19 (100.0%) | 0 (0.0%) |
| 6 to 18 Years | 174 (92.5%) | 0 (0.0%) |
| 19 to 25 Years | 0 (0.0%) | 111 (100.0%) |
| 25 to 34 Years | 46 (78.0%) | 31 (52.5%) |
| 35 to 44 Years | 40 (24.5%) | 0 (0.0%) |
| 45 to 54 Years | 12 (15.2%) | 67 (84.8%) |
| 55 to 64 Years | 74 (64.3%) | 50 (43.5%) |
| 65 to 74 Years | 73 (100.0%) | 44 (60.3%) |
| 75 Years and over | 41 (100.0%) | 17 (41.5%) |
| Total | 479 (56.5%) | 320 (37.7%) |
Disability Status by Sex by Age in Havre North
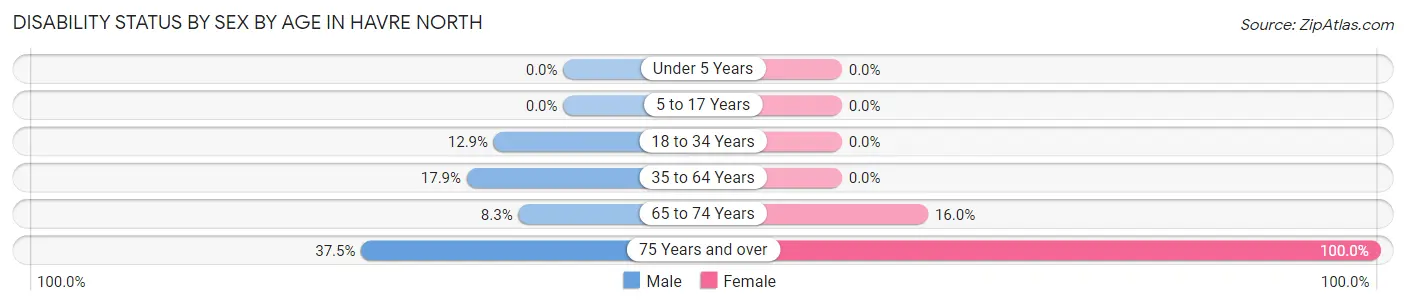
| Age Bracket | Male | Female |
| Under 5 Years | 0 (0.0%) | 0 (0.0%) |
| 5 to 17 Years | 0 (0.0%) | 0 (0.0%) |
| 18 to 34 Years | 12 (12.9%) | 0 (0.0%) |
| 35 to 64 Years | 36 (17.9%) | 0 (0.0%) |
| 65 to 74 Years | 4 (8.3%) | 4 (16.0%) |
| 75 Years and over | 9 (37.5%) | 17 (100.0%) |
Disability Class by Sex by Age in Havre North
Disability Class: Hearing Difficulty
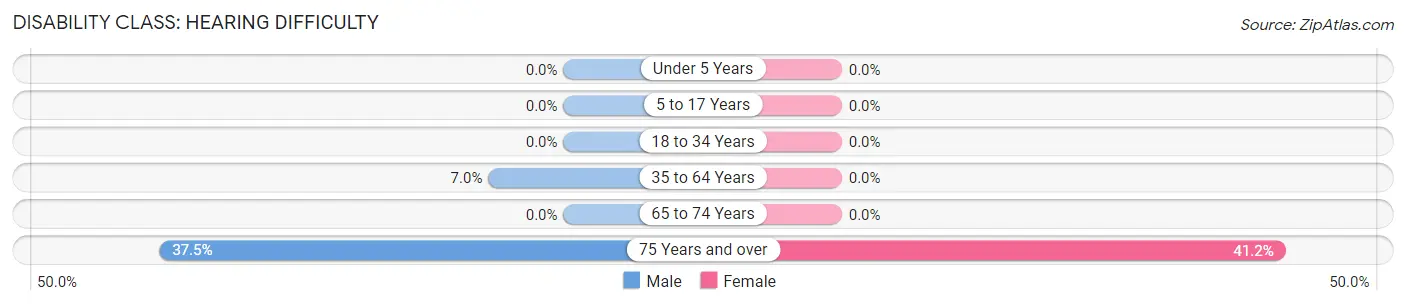
| Age Bracket | Male | Female |
| Under 5 Years | 0 (0.0%) | 0 (0.0%) |
| 5 to 17 Years | 0 (0.0%) | 0 (0.0%) |
| 18 to 34 Years | 0 (0.0%) | 0 (0.0%) |
| 35 to 64 Years | 14 (7.0%) | 0 (0.0%) |
| 65 to 74 Years | 0 (0.0%) | 0 (0.0%) |
| 75 Years and over | 9 (37.5%) | 7 (41.2%) |
Disability Class: Vision Difficulty
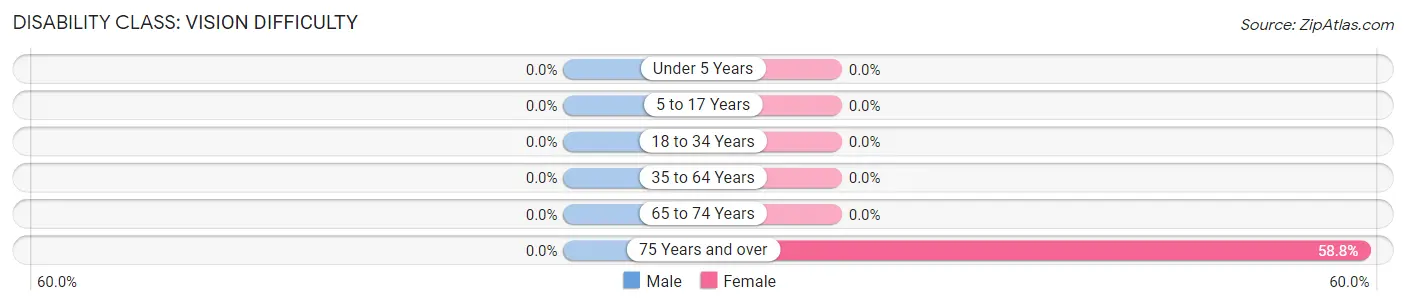
| Age Bracket | Male | Female |
| Under 5 Years | 0 (0.0%) | 0 (0.0%) |
| 5 to 17 Years | 0 (0.0%) | 0 (0.0%) |
| 18 to 34 Years | 0 (0.0%) | 0 (0.0%) |
| 35 to 64 Years | 0 (0.0%) | 0 (0.0%) |
| 65 to 74 Years | 0 (0.0%) | 0 (0.0%) |
| 75 Years and over | 0 (0.0%) | 10 (58.8%) |
Disability Class: Cognitive Difficulty
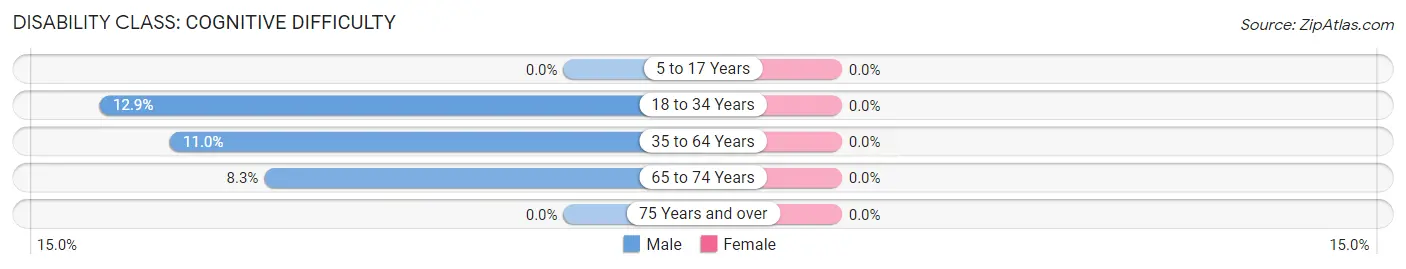
| Age Bracket | Male | Female |
| 5 to 17 Years | 0 (0.0%) | 0 (0.0%) |
| 18 to 34 Years | 12 (12.9%) | 0 (0.0%) |
| 35 to 64 Years | 22 (11.0%) | 0 (0.0%) |
| 65 to 74 Years | 4 (8.3%) | 0 (0.0%) |
| 75 Years and over | 0 (0.0%) | 0 (0.0%) |
Disability Class: Ambulatory Difficulty
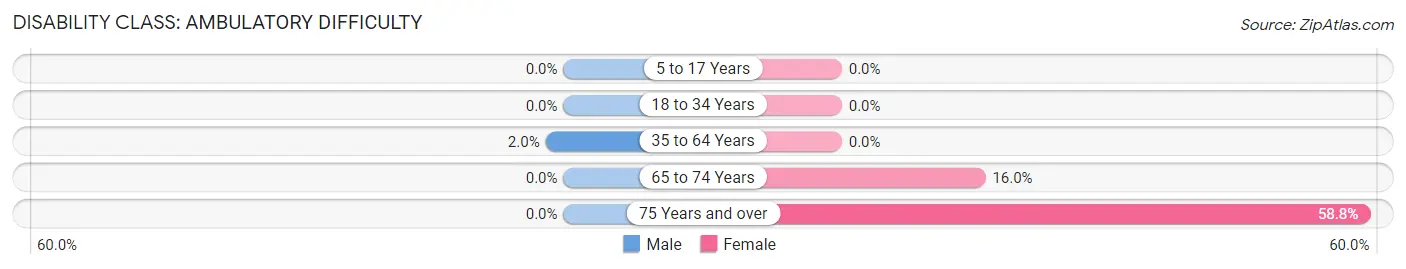
| Age Bracket | Male | Female |
| 5 to 17 Years | 0 (0.0%) | 0 (0.0%) |
| 18 to 34 Years | 0 (0.0%) | 0 (0.0%) |
| 35 to 64 Years | 4 (2.0%) | 0 (0.0%) |
| 65 to 74 Years | 0 (0.0%) | 4 (16.0%) |
| 75 Years and over | 0 (0.0%) | 10 (58.8%) |
Disability Class: Self-Care Difficulty
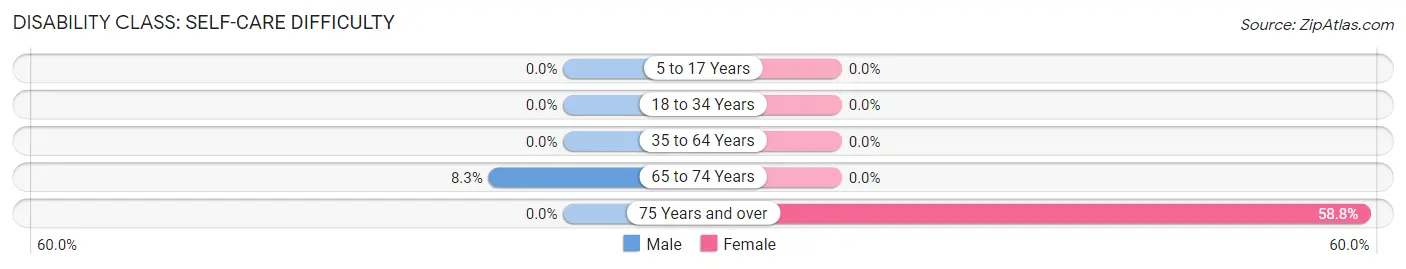
| Age Bracket | Male | Female |
| 5 to 17 Years | 0 (0.0%) | 0 (0.0%) |
| 18 to 34 Years | 0 (0.0%) | 0 (0.0%) |
| 35 to 64 Years | 0 (0.0%) | 0 (0.0%) |
| 65 to 74 Years | 4 (8.3%) | 0 (0.0%) |
| 75 Years and over | 0 (0.0%) | 10 (58.8%) |
Technology Access in Havre North
Computing Device Access in Havre North
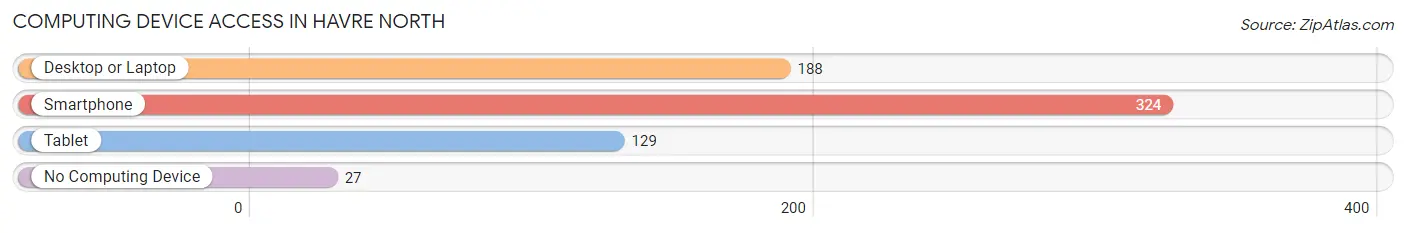
| Device Type | # Households | % Households |
| Desktop or Laptop | 188 | 50.8% |
| Smartphone | 324 | 87.6% |
| Tablet | 129 | 34.9% |
| No Computing Device | 27 | 7.3% |
| Total | 370 | 100.0% |
Internet Access in Havre North
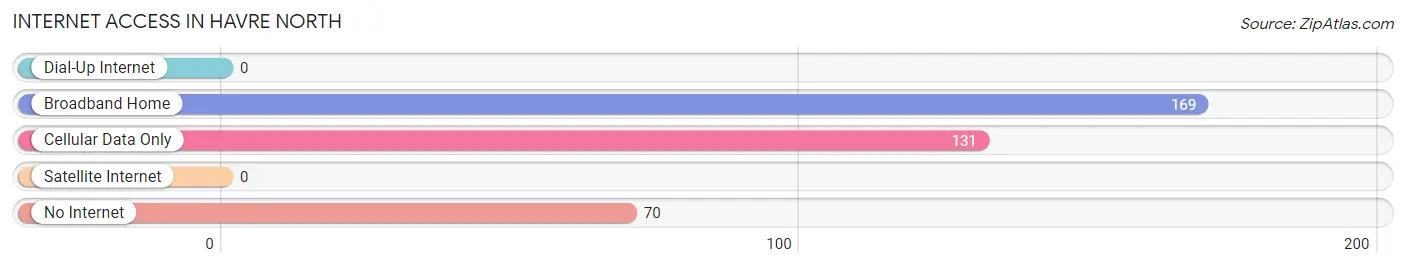
| Internet Type | # Households | % Households |
| Dial-Up Internet | 0 | 0.0% |
| Broadband Home | 169 | 45.7% |
| Cellular Data Only | 131 | 35.4% |
| Satellite Internet | 0 | 0.0% |
| No Internet | 70 | 18.9% |
| Total | 370 | 100.0% |
Havre North Summary
Havre North, Montana is a small town located in the northern part of the state, near the Canadian border. It is situated in Hill County, and is the county seat. The town has a population of just over 4,000 people, and is the largest town in the county.
Havre North is located in the northern part of the state, near the Canadian border. It is situated in Hill County, and is the county seat. The town has a population of just over 4,000 people, and is the largest town in the county. The town is located in the middle of the Great Plains, and is surrounded by rolling hills and prairies. The town is located on the Milk River, and is the gateway to the Rocky Mountains.
The town was founded in 1887, and was named after the nearby Havre River. The town was originally a trading post, and was the first settlement in the area. The town grew quickly, and soon became a major hub for the region. The town was the site of the first post office in the area, and was the first town in the state to have a telephone.
The economy of Havre North is largely based on agriculture and tourism. The town is home to several large farms, and is a major producer of wheat, barley, and other grains. The town is also home to several large ranches, and is a popular destination for hunters and fishermen. The town is also home to several small businesses, including restaurants, shops, and other services.
The town is served by the Havre North-Hill County Airport, which provides air service to the region. The town is also served by several bus lines, and is connected to the rest of the state by a network of highways.
The town is home to several schools, including Havre North High School, Havre North Middle School, and Havre North Elementary School. The town is also home to several churches, and is home to a number of cultural and recreational activities. The town is also home to several parks, including the Havre North City Park, and the Havre North State Park.
Havre North is a small town with a rich history and a vibrant economy. The town is home to a diverse population, and is a great place to live and work. The town is a great place to visit, and is a great place to call home.
Common Questions
What is Per Capita Income in Havre North?
Per Capita income in Havre North is $16,045.
What is the Median Family Income in Havre North?
Median Family Income in Havre North is $34,737.
What is the Median Household income in Havre North?
Median Household Income in Havre North is $37,250.
What is Income or Wage Gap in Havre North?
Income or Wage Gap in Havre North is 17.5%.
Women in Havre North earn 82.5 cents for every dollar earned by a man.
What is Inequality or Gini Index in Havre North?
Inequality or Gini Index in Havre North is 0.32.
What is the Total Population of Havre North?
Total Population of Havre North is 848.
What is the Total Male Population of Havre North?
Total Male Population of Havre North is 514.
What is the Total Female Population of Havre North?
Total Female Population of Havre North is 334.
What is the Ratio of Males per 100 Females in Havre North?
There are 153.89 Males per 100 Females in Havre North.
What is the Ratio of Females per 100 Males in Havre North?
There are 64.98 Females per 100 Males in Havre North.
What is the Median Population Age in Havre North?
Median Population Age in Havre North is 35.7 Years.
What is the Average Family Size in Havre North
Average Family Size in Havre North is 2.4 People.
What is the Average Household Size in Havre North
Average Household Size in Havre North is 2.3 People.
How Large is the Labor Force in Havre North?
There are 331 People in the Labor Forcein in Havre North.
What is the Percentage of People in the Labor Force in Havre North?
50.5% of People are in the Labor Force in Havre North.
What is the Unemployment Rate in Havre North?
Unemployment Rate in Havre North is 3.6%.