Rudyard, MT Map & Demographics
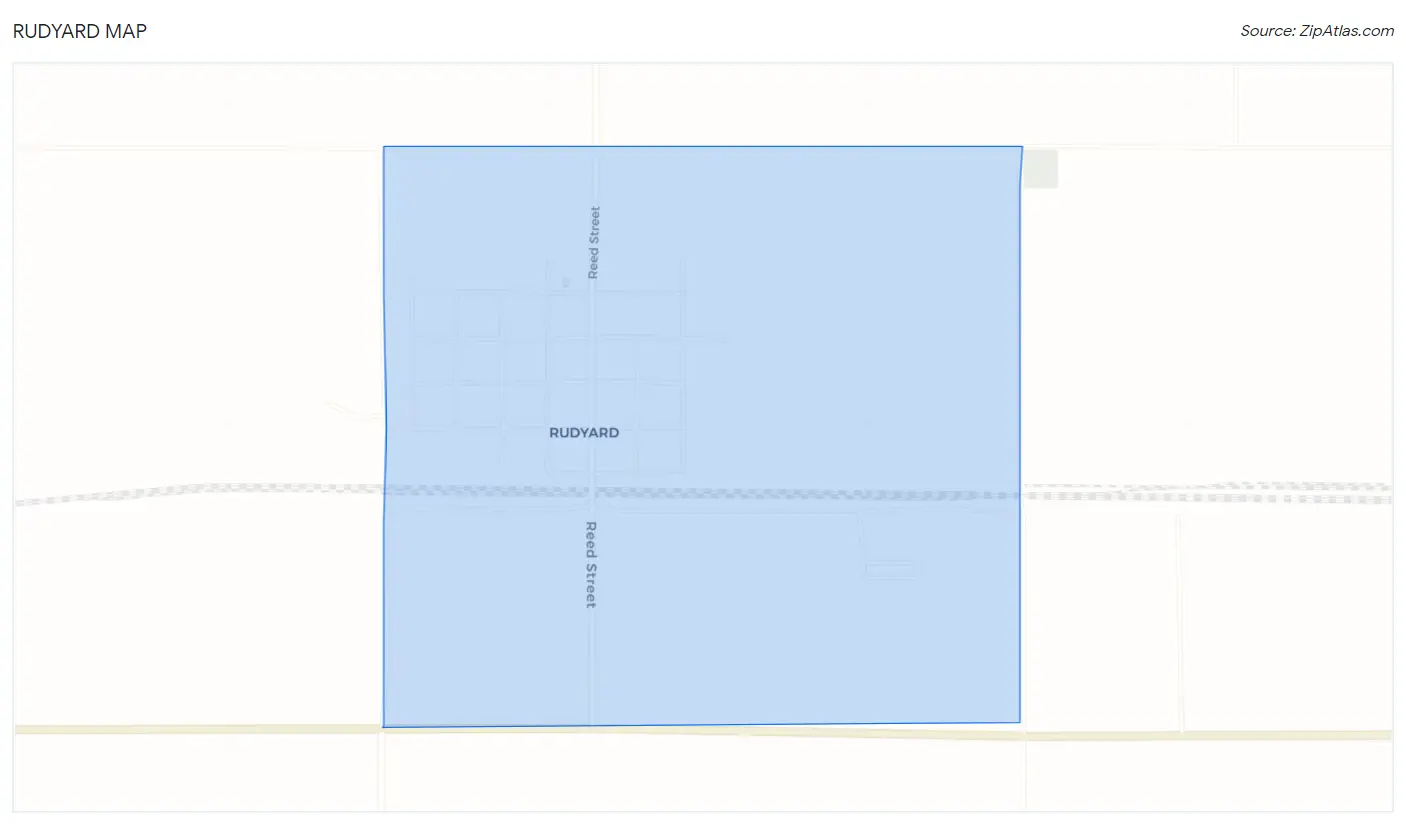
Rudyard Map
Rudyard Overview
$26,458
PER CAPITA INCOME
$67,813
AVG FAMILY INCOME
$69,750
AVG HOUSEHOLD INCOME
45.3%
WAGE / INCOME GAP [ % ]
54.7¢/ $1
WAGE / INCOME GAP [ $ ]
0.31
INEQUALITY / GINI INDEX
373
TOTAL POPULATION
206
MALE POPULATION
167
FEMALE POPULATION
123.35
MALES / 100 FEMALES
81.07
FEMALES / 100 MALES
29.8
MEDIAN AGE
3.6
AVG FAMILY SIZE
2.9
AVG HOUSEHOLD SIZE
176
LABOR FORCE [ PEOPLE ]
72.7%
PERCENT IN LABOR FORCE
Rudyard Zip Codes
Rudyard Area Codes
Income in Rudyard
Income Overview in Rudyard
Per Capita Income in Rudyard is $26,458, while median incomes of families and households are $67,813 and $69,750 respectively.
| Characteristic | Number | Measure |
| Per Capita Income | 373 | $26,458 |
| Median Family Income | 87 | $67,813 |
| Mean Family Income | 87 | $73,184 |
| Median Household Income | 131 | $69,750 |
| Mean Household Income | 131 | $79,205 |
| Income Deficit | 87 | $0 |
| Wage / Income Gap (%) | 373 | 45.26% |
| Wage / Income Gap ($) | 373 | 54.74¢ per $1 |
| Gini / Inequality Index | 373 | 0.31 |
Earnings by Sex in Rudyard
Average Earnings in Rudyard are $40,625, $46,429 for men and $25,417 for women, a difference of 45.3%.
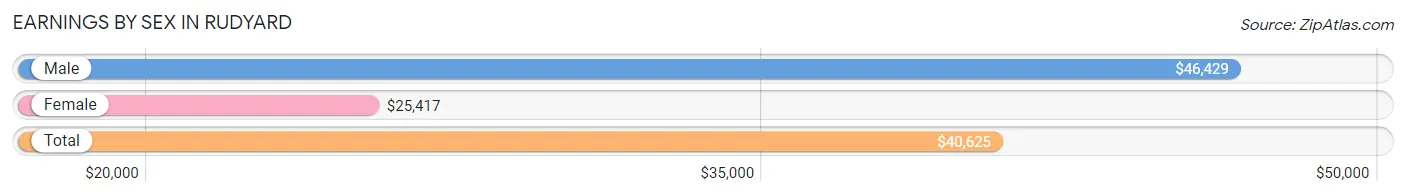
| Sex | Number | Average Earnings |
| Male | 90 (46.9%) | $46,429 |
| Female | 102 (53.1%) | $25,417 |
| Total | 192 (100.0%) | $40,625 |
Earnings by Sex by Income Bracket in Rudyard
The most common earnings brackets in Rudyard are $45,000 to $49,999 for men (21 | 23.3%) and $22,500 to $24,999 for women (29 | 28.4%).
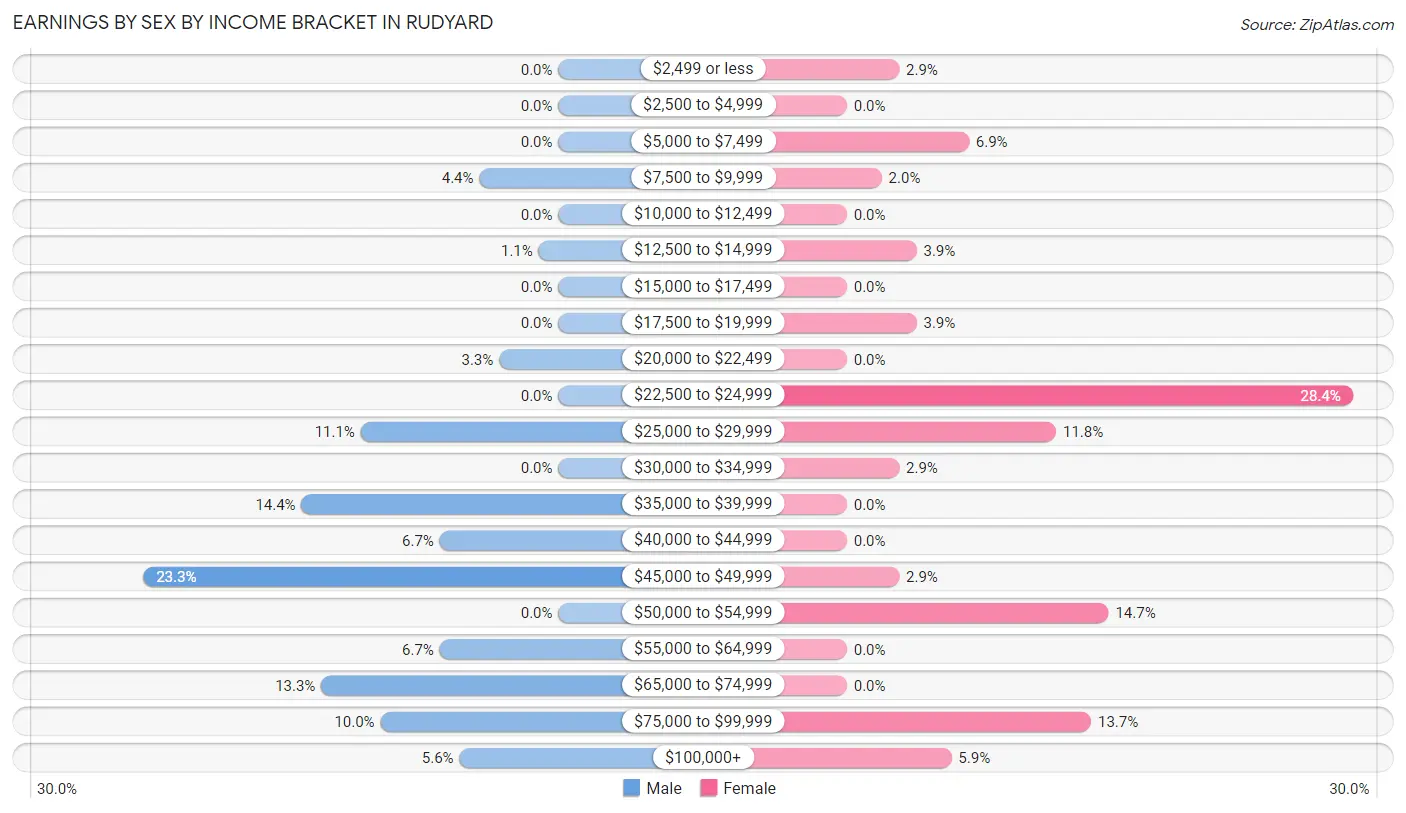
| Income | Male | Female |
| $2,499 or less | 0 (0.0%) | 3 (2.9%) |
| $2,500 to $4,999 | 0 (0.0%) | 0 (0.0%) |
| $5,000 to $7,499 | 0 (0.0%) | 7 (6.9%) |
| $7,500 to $9,999 | 4 (4.4%) | 2 (2.0%) |
| $10,000 to $12,499 | 0 (0.0%) | 0 (0.0%) |
| $12,500 to $14,999 | 1 (1.1%) | 4 (3.9%) |
| $15,000 to $17,499 | 0 (0.0%) | 0 (0.0%) |
| $17,500 to $19,999 | 0 (0.0%) | 4 (3.9%) |
| $20,000 to $22,499 | 3 (3.3%) | 0 (0.0%) |
| $22,500 to $24,999 | 0 (0.0%) | 29 (28.4%) |
| $25,000 to $29,999 | 10 (11.1%) | 12 (11.8%) |
| $30,000 to $34,999 | 0 (0.0%) | 3 (2.9%) |
| $35,000 to $39,999 | 13 (14.4%) | 0 (0.0%) |
| $40,000 to $44,999 | 6 (6.7%) | 0 (0.0%) |
| $45,000 to $49,999 | 21 (23.3%) | 3 (2.9%) |
| $50,000 to $54,999 | 0 (0.0%) | 15 (14.7%) |
| $55,000 to $64,999 | 6 (6.7%) | 0 (0.0%) |
| $65,000 to $74,999 | 12 (13.3%) | 0 (0.0%) |
| $75,000 to $99,999 | 9 (10.0%) | 14 (13.7%) |
| $100,000+ | 5 (5.6%) | 6 (5.9%) |
| Total | 90 (100.0%) | 102 (100.0%) |
Earnings by Sex by Educational Attainment in Rudyard
Average earnings in Rudyard are $46,875 for men and $25,729 for women, a difference of 45.1%. Men with an educational attainment of bachelor's degree enjoy the highest average annual earnings of $49,464, while those with high school diploma education earn the least with $45,804. Women with an educational attainment of bachelor's degree earn the most with the average annual earnings of $78,750, while those with high school diploma education have the smallest earnings of $23,162.
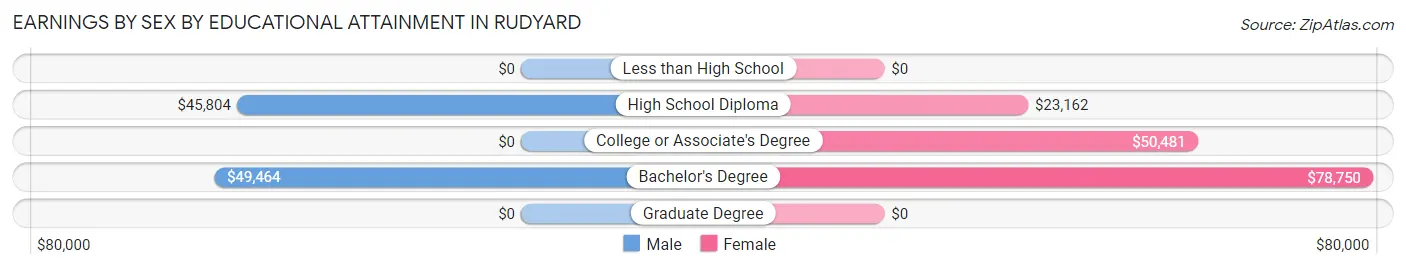
| Educational Attainment | Male Income | Female Income |
| Less than High School | - | - |
| High School Diploma | $45,804 | $23,162 |
| College or Associate's Degree | - | - |
| Bachelor's Degree | $49,464 | $78,750 |
| Graduate Degree | - | - |
| Total | $46,875 | $25,729 |
Family Income in Rudyard
Family Income Brackets in Rudyard
According to the Rudyard family income data, there are 19 families falling into the $50,000 to $74,999 income range, which is the most common income bracket and makes up 21.8% of all families.
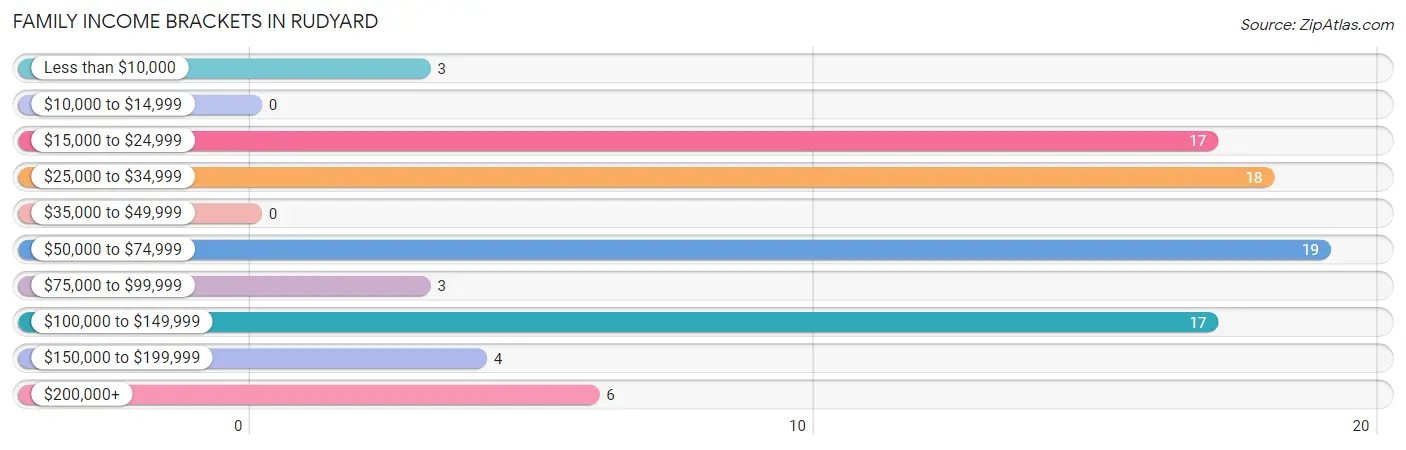
| Income Bracket | # Families | % Families |
| Less than $10,000 | 3 | 3.4% |
| $10,000 to $14,999 | 0 | 0.0% |
| $15,000 to $24,999 | 17 | 19.5% |
| $25,000 to $34,999 | 18 | 20.7% |
| $35,000 to $49,999 | 0 | 0.0% |
| $50,000 to $74,999 | 19 | 21.8% |
| $75,000 to $99,999 | 3 | 3.4% |
| $100,000 to $149,999 | 17 | 19.5% |
| $150,000 to $199,999 | 4 | 4.6% |
| $200,000+ | 6 | 6.9% |
Family Income by Famaliy Size in Rudyard
3-person families (24 | 27.6%) account for the highest median family income in Rudyard with $24,265 per family, while 3-person families (24 | 27.6%) have the highest median income of $8,088 per family member.
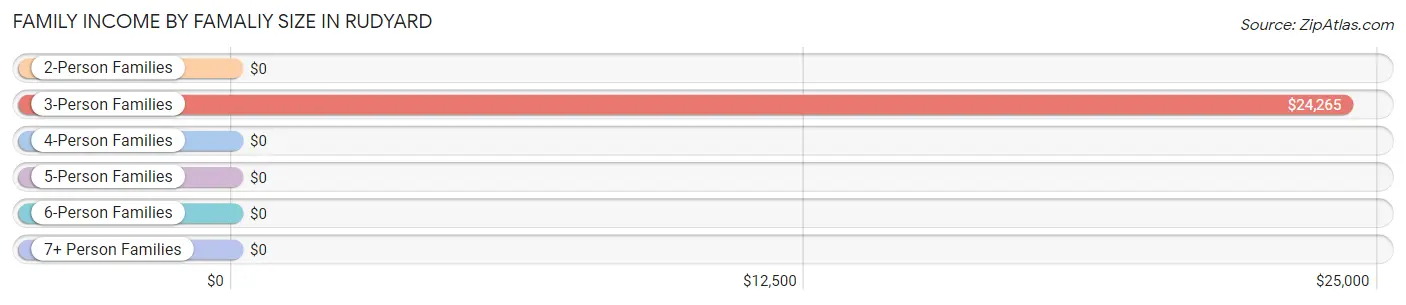
| Income Bracket | # Families | Median Income |
| 2-Person Families | 31 (35.6%) | $0 |
| 3-Person Families | 24 (27.6%) | $24,265 |
| 4-Person Families | 3 (3.5%) | $0 |
| 5-Person Families | 14 (16.1%) | $0 |
| 6-Person Families | 15 (17.2%) | $0 |
| 7+ Person Families | 0 (0.0%) | $0 |
| Total | 87 (100.0%) | $67,813 |
Family Income by Number of Earners in Rudyard
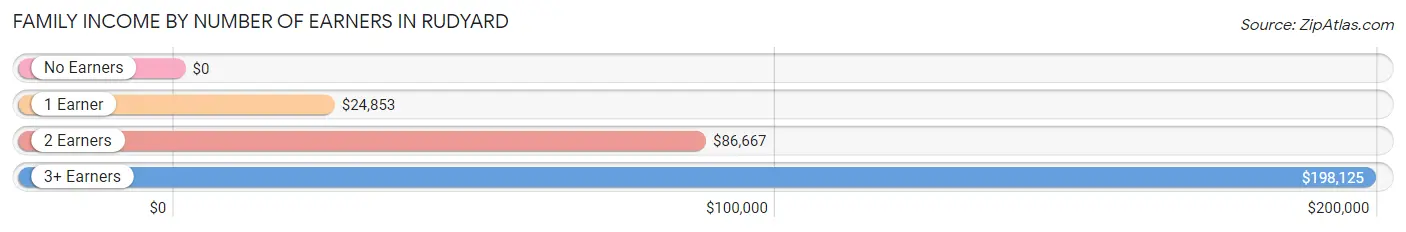
| Number of Earners | # Families | Median Income |
| No Earners | 6 (6.9%) | $0 |
| 1 Earner | 32 (36.8%) | $24,853 |
| 2 Earners | 42 (48.3%) | $86,667 |
| 3+ Earners | 7 (8.1%) | $198,125 |
| Total | 87 (100.0%) | $67,813 |
Household Income in Rudyard
Household Income Brackets in Rudyard
With 40 households falling in the category, the $50,000 to $74,999 income range is the most frequent in Rudyard, accounting for 30.5% of all households.
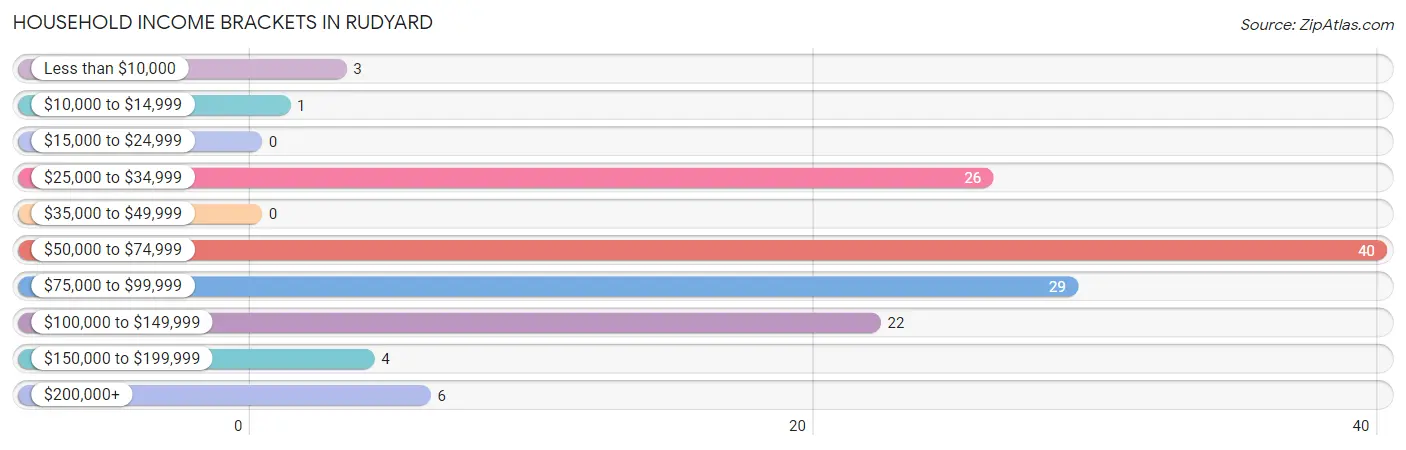
| Income Bracket | # Households | % Households |
| Less than $10,000 | 3 | 2.3% |
| $10,000 to $14,999 | 1 | 0.8% |
| $15,000 to $24,999 | 0 | 0.0% |
| $25,000 to $34,999 | 26 | 19.8% |
| $35,000 to $49,999 | 0 | 0.0% |
| $50,000 to $74,999 | 40 | 30.5% |
| $75,000 to $99,999 | 29 | 22.1% |
| $100,000 to $149,999 | 22 | 16.8% |
| $150,000 to $199,999 | 4 | 3.1% |
| $200,000+ | 6 | 4.6% |
Household Income by Householder Age in Rudyard
The median household income in Rudyard is $69,750, with the highest median household income of $106,875 found in the 45 to 64 years age bracket for the primary householder. A total of 41 households (31.3%) fall into this category.
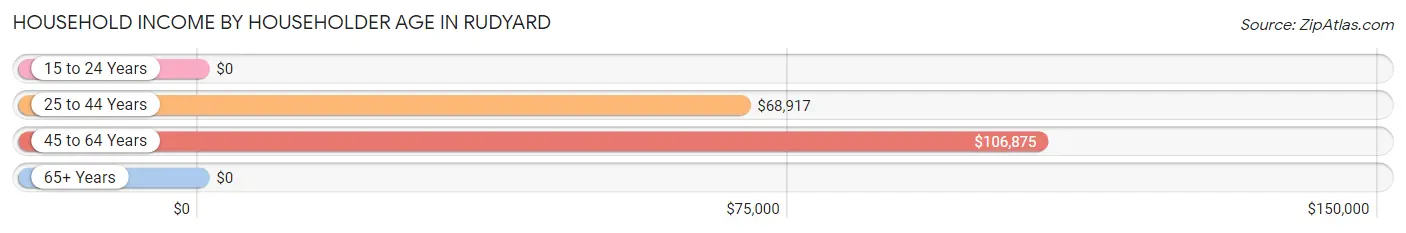
| Income Bracket | # Households | Median Income |
| 15 to 24 Years | 0 (0.0%) | $0 |
| 25 to 44 Years | 69 (52.7%) | $68,917 |
| 45 to 64 Years | 41 (31.3%) | $106,875 |
| 65+ Years | 21 (16.0%) | $0 |
| Total | 131 (100.0%) | $69,750 |
Poverty in Rudyard
Income Below Poverty by Sex and Age in Rudyard
With 1.9% poverty level for males and 3.7% for females among the residents of Rudyard, 75 year old and over males and 75 year old and over females are the most vulnerable to poverty, with 3 males (50.0%) and 4 females (36.4%) in their respective age groups living below the poverty level.
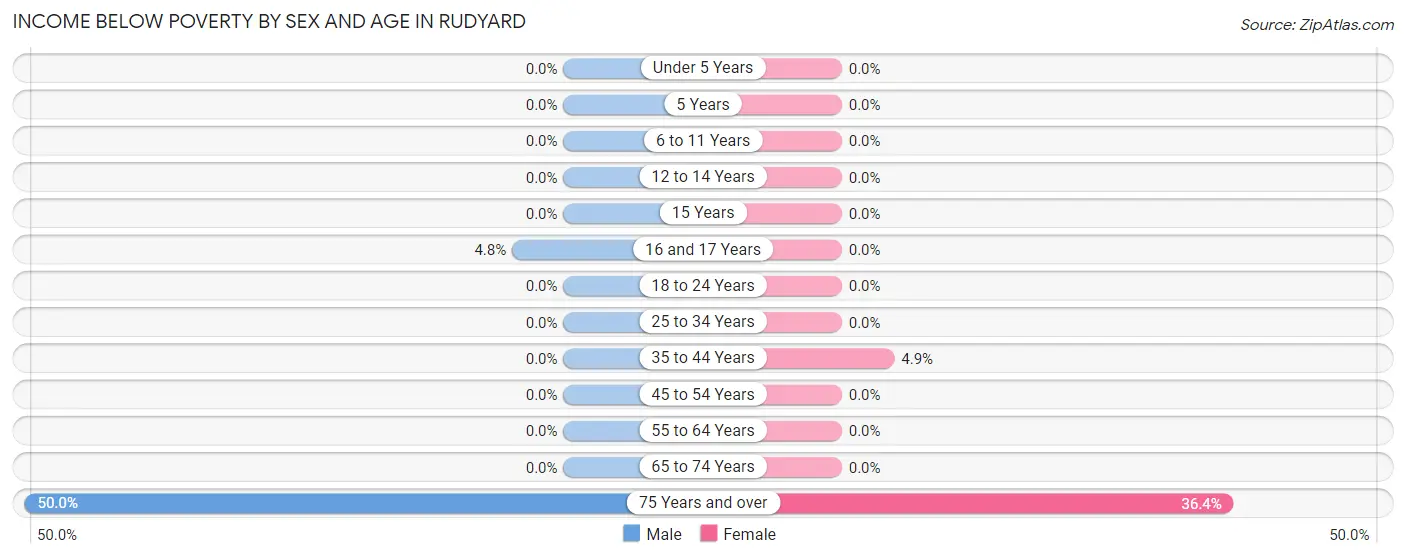
| Age Bracket | Male | Female |
| Under 5 Years | 0 (0.0%) | 0 (0.0%) |
| 5 Years | 0 (0.0%) | 0 (0.0%) |
| 6 to 11 Years | 0 (0.0%) | 0 (0.0%) |
| 12 to 14 Years | 0 (0.0%) | 0 (0.0%) |
| 15 Years | 0 (0.0%) | 0 (0.0%) |
| 16 and 17 Years | 1 (4.8%) | 0 (0.0%) |
| 18 to 24 Years | 0 (0.0%) | 0 (0.0%) |
| 25 to 34 Years | 0 (0.0%) | 0 (0.0%) |
| 35 to 44 Years | 0 (0.0%) | 2 (4.9%) |
| 45 to 54 Years | 0 (0.0%) | 0 (0.0%) |
| 55 to 64 Years | 0 (0.0%) | 0 (0.0%) |
| 65 to 74 Years | 0 (0.0%) | 0 (0.0%) |
| 75 Years and over | 3 (50.0%) | 4 (36.4%) |
| Total | 4 (1.9%) | 6 (3.7%) |
Income Above Poverty by Sex and Age in Rudyard
According to the poverty statistics in Rudyard, males aged under 5 years and females aged under 5 years are the age groups that are most secure financially, with 100.0% of males and 100.0% of females in these age groups living above the poverty line.
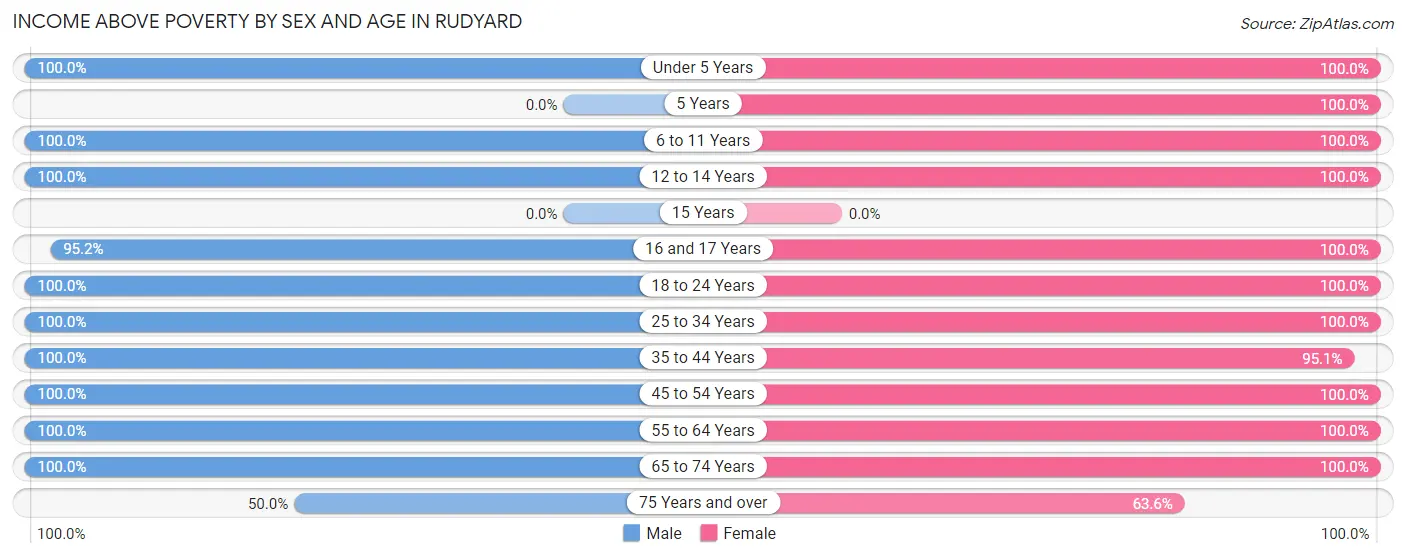
| Age Bracket | Male | Female |
| Under 5 Years | 15 (100.0%) | 7 (100.0%) |
| 5 Years | 0 (0.0%) | 3 (100.0%) |
| 6 to 11 Years | 74 (100.0%) | 10 (100.0%) |
| 12 to 14 Years | 4 (100.0%) | 14 (100.0%) |
| 15 Years | 0 (0.0%) | 0 (0.0%) |
| 16 and 17 Years | 20 (95.2%) | 10 (100.0%) |
| 18 to 24 Years | 1 (100.0%) | 3 (100.0%) |
| 25 to 34 Years | 24 (100.0%) | 14 (100.0%) |
| 35 to 44 Years | 21 (100.0%) | 39 (95.1%) |
| 45 to 54 Years | 19 (100.0%) | 16 (100.0%) |
| 55 to 64 Years | 14 (100.0%) | 32 (100.0%) |
| 65 to 74 Years | 7 (100.0%) | 2 (100.0%) |
| 75 Years and over | 3 (50.0%) | 7 (63.6%) |
| Total | 202 (98.1%) | 157 (96.3%) |
Income Below Poverty Among Married-Couple Families in Rudyard
The poverty statistics for married-couple families in Rudyard show that 5.8% or 3 of the total 52 families live below the poverty line. Families with no children have the highest poverty rate of 15.0%, comprising of 3 families. On the other hand, families with 1 or 2 children have the lowest poverty rate of 0.0%, which includes 0 families.
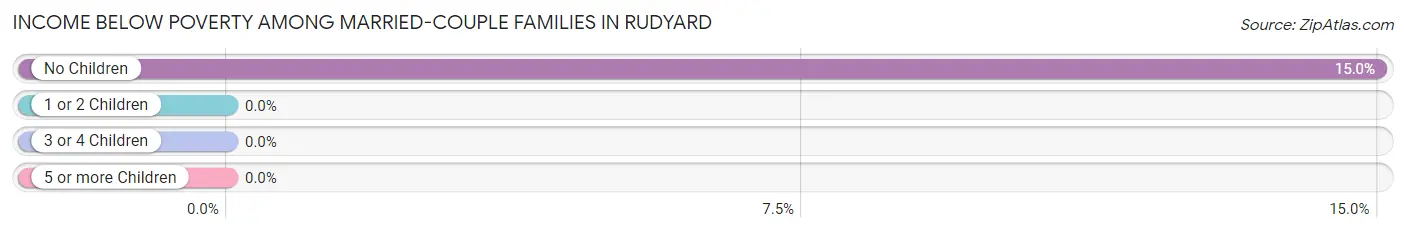
| Children | Above Poverty | Below Poverty |
| No Children | 17 (85.0%) | 3 (15.0%) |
| 1 or 2 Children | 5 (100.0%) | 0 (0.0%) |
| 3 or 4 Children | 27 (100.0%) | 0 (0.0%) |
| 5 or more Children | 0 (0.0%) | 0 (0.0%) |
| Total | 49 (94.2%) | 3 (5.8%) |
Income Below Poverty Among Single-Parent Households in Rudyard
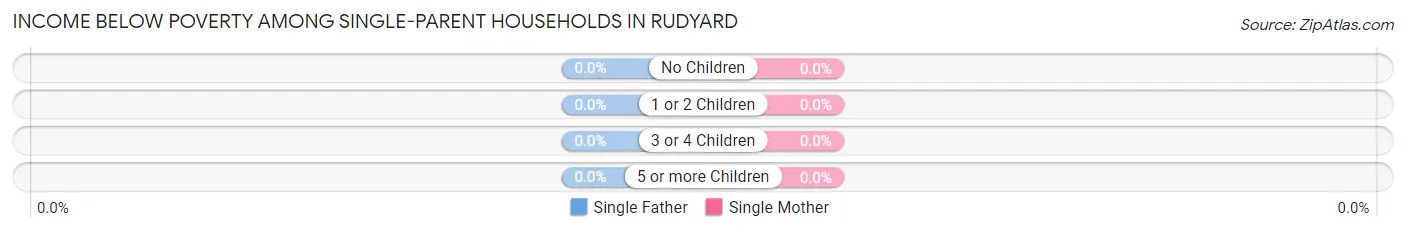
| Children | Single Father | Single Mother |
| No Children | 0 (0.0%) | 0 (0.0%) |
| 1 or 2 Children | 0 (0.0%) | 0 (0.0%) |
| 3 or 4 Children | 0 (0.0%) | 0 (0.0%) |
| 5 or more Children | 0 (0.0%) | 0 (0.0%) |
| Total | 0 (0.0%) | 0 (0.0%) |
Income Below Poverty Among Married-Couple vs Single-Parent Households in Rudyard
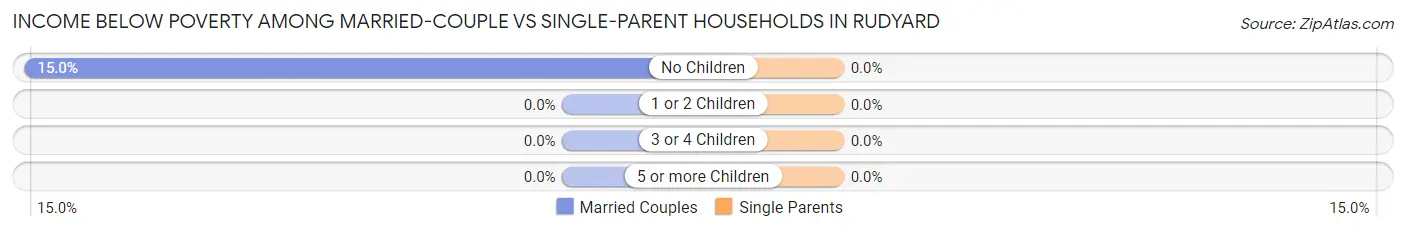
| Children | Married-Couple Families | Single-Parent Households |
| No Children | 3 (15.0%) | 0 (0.0%) |
| 1 or 2 Children | 0 (0.0%) | 0 (0.0%) |
| 3 or 4 Children | 0 (0.0%) | 0 (0.0%) |
| 5 or more Children | 0 (0.0%) | 0 (0.0%) |
| Total | 3 (5.8%) | 0 (0.0%) |
Race in Rudyard
The most populous races in Rudyard are White / Caucasian (368 | 98.7%), Hawaiian / Pacific (3 | 0.8%), and Native / Alaskan (2 | 0.5%).
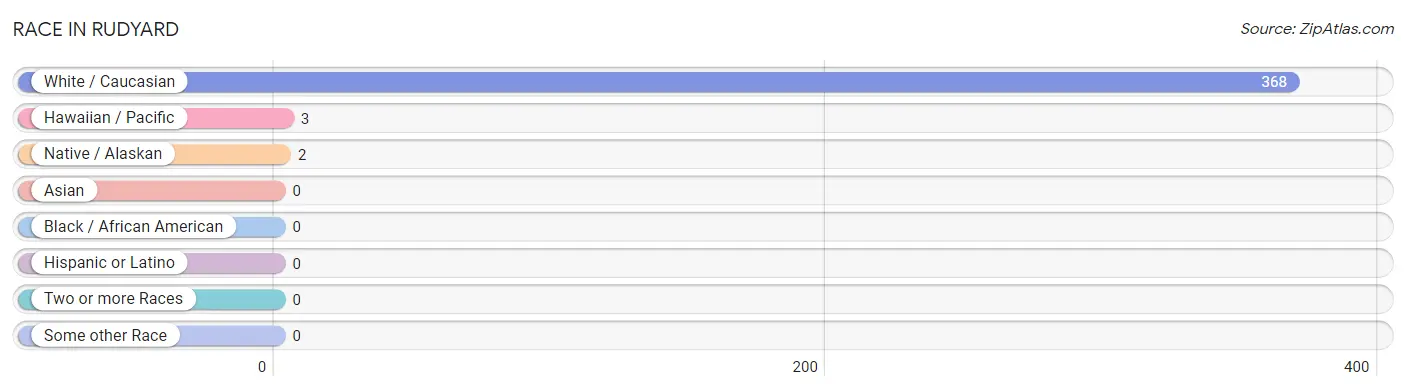
| Race | # Population | % Population |
| Asian | 0 | 0.0% |
| Black / African American | 0 | 0.0% |
| Hawaiian / Pacific | 3 | 0.8% |
| Hispanic or Latino | 0 | 0.0% |
| Native / Alaskan | 2 | 0.5% |
| White / Caucasian | 368 | 98.7% |
| Two or more Races | 0 | 0.0% |
| Some other Race | 0 | 0.0% |
| Total | 373 | 100.0% |
Ancestry in Rudyard
The most populous ancestries reported in Rudyard are German (116 | 31.1%), Scottish (79 | 21.2%), English (74 | 19.8%), Norwegian (74 | 19.8%), and Danish (18 | 4.8%), together accounting for 96.8% of all Rudyard residents.
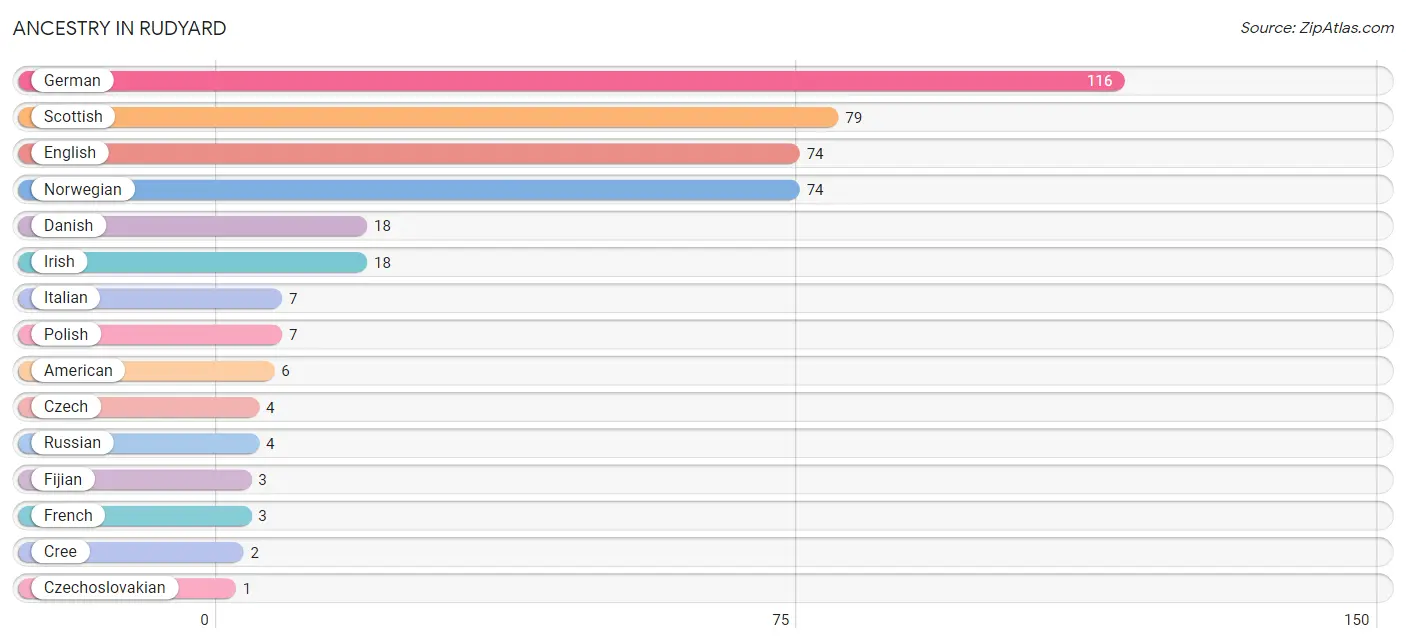
| Ancestry | # Population | % Population |
| American | 6 | 1.6% |
| Cree | 2 | 0.5% |
| Czech | 4 | 1.1% |
| Czechoslovakian | 1 | 0.3% |
| Danish | 18 | 4.8% |
| English | 74 | 19.8% |
| Fijian | 3 | 0.8% |
| French | 3 | 0.8% |
| German | 116 | 31.1% |
| Irish | 18 | 4.8% |
| Italian | 7 | 1.9% |
| Norwegian | 74 | 19.8% |
| Polish | 7 | 1.9% |
| Russian | 4 | 1.1% |
| Scottish | 79 | 21.2% | View All 15 Rows |
Immigrants in Rudyard

| Immigration Origin | # Population | % Population | View All 0 Rows |
Sex and Age in Rudyard
Sex and Age in Rudyard
The most populous age groups in Rudyard are 5 to 9 Years (57 | 27.7%) for men and 35 to 39 Years (38 | 22.8%) for women.
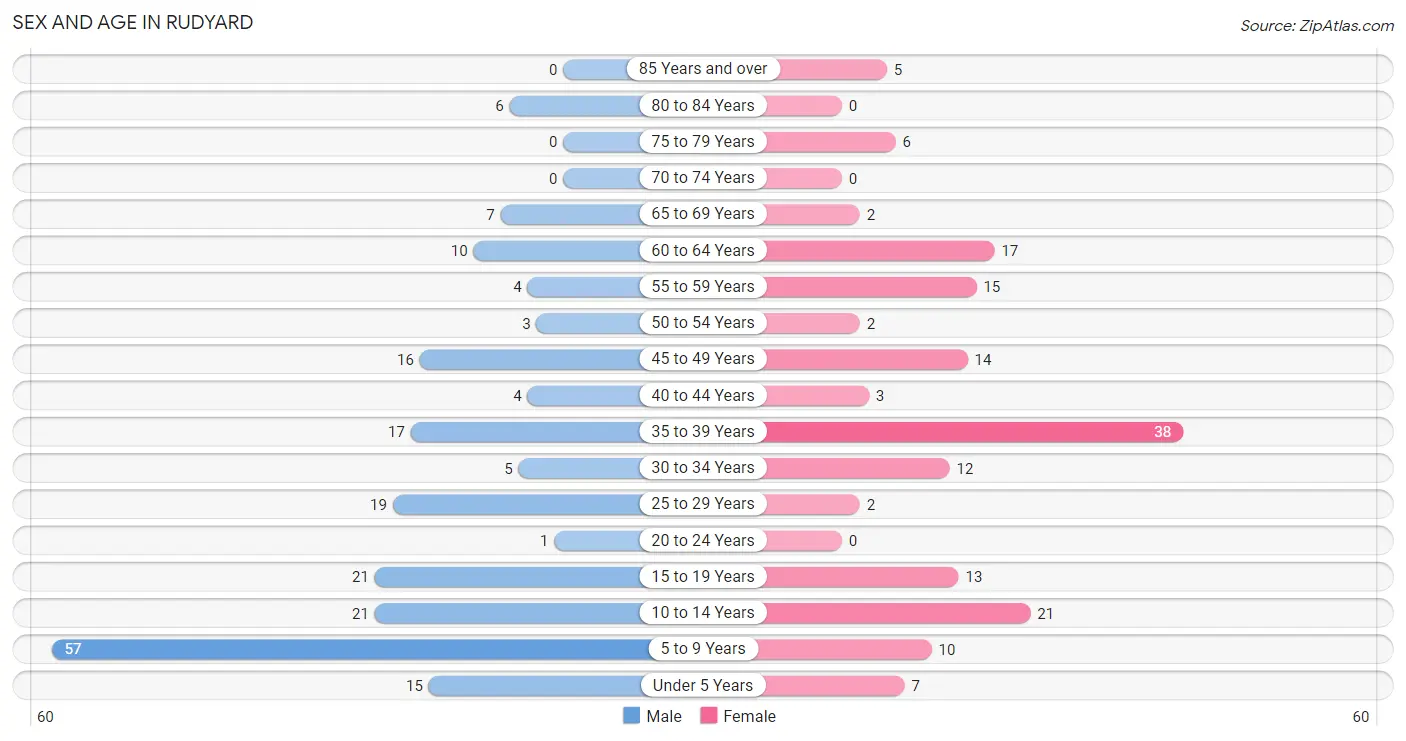
| Age Bracket | Male | Female |
| Under 5 Years | 15 (7.3%) | 7 (4.2%) |
| 5 to 9 Years | 57 (27.7%) | 10 (6.0%) |
| 10 to 14 Years | 21 (10.2%) | 21 (12.6%) |
| 15 to 19 Years | 21 (10.2%) | 13 (7.8%) |
| 20 to 24 Years | 1 (0.5%) | 0 (0.0%) |
| 25 to 29 Years | 19 (9.2%) | 2 (1.2%) |
| 30 to 34 Years | 5 (2.4%) | 12 (7.2%) |
| 35 to 39 Years | 17 (8.3%) | 38 (22.8%) |
| 40 to 44 Years | 4 (1.9%) | 3 (1.8%) |
| 45 to 49 Years | 16 (7.8%) | 14 (8.4%) |
| 50 to 54 Years | 3 (1.5%) | 2 (1.2%) |
| 55 to 59 Years | 4 (1.9%) | 15 (9.0%) |
| 60 to 64 Years | 10 (4.9%) | 17 (10.2%) |
| 65 to 69 Years | 7 (3.4%) | 2 (1.2%) |
| 70 to 74 Years | 0 (0.0%) | 0 (0.0%) |
| 75 to 79 Years | 0 (0.0%) | 6 (3.6%) |
| 80 to 84 Years | 6 (2.9%) | 0 (0.0%) |
| 85 Years and over | 0 (0.0%) | 5 (3.0%) |
| Total | 206 (100.0%) | 167 (100.0%) |
Families and Households in Rudyard
Median Family Size in Rudyard
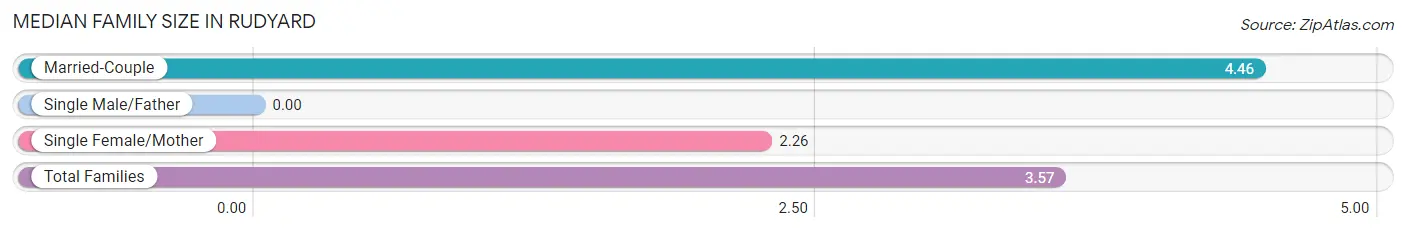
| Family Type | # Families | Family Size |
| Married-Couple | 52 (59.8%) | 4.46 |
| Single Male/Father | 0 (0.0%) | - |
| Single Female/Mother | 35 (40.2%) | 2.26 |
| Total Families | 87 (100.0%) | 3.57 |
Median Household Size in Rudyard
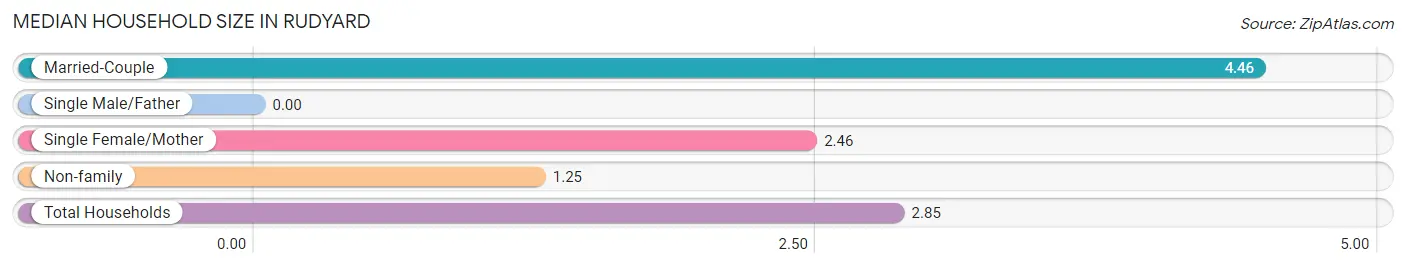
| Household Type | # Households | Household Size |
| Married-Couple | 52 (39.7%) | 4.46 |
| Single Male/Father | 0 (0.0%) | - |
| Single Female/Mother | 35 (26.7%) | 2.46 |
| Non-family | 44 (33.6%) | 1.25 |
| Total Households | 131 (100.0%) | 2.85 |
Household Size by Marriage Status in Rudyard
Out of a total of 131 households in Rudyard, 87 (66.4%) are family households, while 44 (33.6%) are nonfamily households. The most numerous type of family households are 2-person households, comprising 31, and the most common type of nonfamily households are 1-person households, comprising 38.
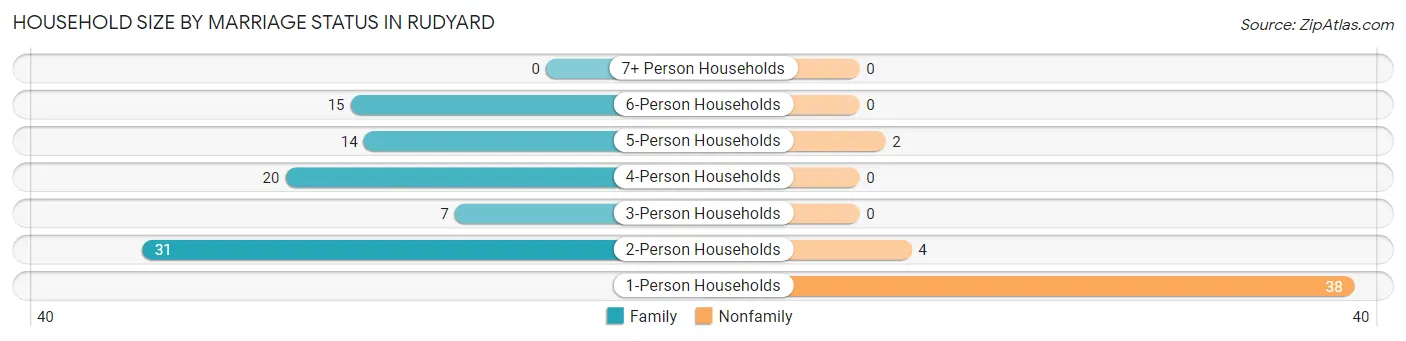
| Household Size | Family Households | Nonfamily Households |
| 1-Person Households | - | 38 (29.0%) |
| 2-Person Households | 31 (23.7%) | 4 (3.0%) |
| 3-Person Households | 7 (5.3%) | 0 (0.0%) |
| 4-Person Households | 20 (15.3%) | 0 (0.0%) |
| 5-Person Households | 14 (10.7%) | 2 (1.5%) |
| 6-Person Households | 15 (11.5%) | 0 (0.0%) |
| 7+ Person Households | 0 (0.0%) | 0 (0.0%) |
| Total | 87 (66.4%) | 44 (33.6%) |
Female Fertility in Rudyard
Fertility by Age in Rudyard
Average fertility rate in Rudyard is 183.0 births per 1,000 women. Women in the age bracket of 35 to 50 years have the highest fertility rate with 273.0 births per 1,000 women. Women in the age bracket of 35 to 50 years acount for 100.0% of all women with births.
| Age Bracket | Women with Births | Births / 1,000 Women |
| 15 to 19 years | 0 (0.0%) | 0.0 |
| 20 to 34 years | 0 (0.0%) | 0.0 |
| 35 to 50 years | 15 (100.0%) | 273.0 |
| Total | 15 (100.0%) | 183.0 |
Fertility by Age by Marriage Status in Rudyard
80.0% of women with births (15) in Rudyard are married. The highest percentage of unmarried women with births falls into 35 to 50 years age bracket with 20.0% of them unmarried at the time of birth, while the lowest percentage of unmarried women with births belong to 35 to 50 years age bracket with 20.0% of them unmarried.
| Age Bracket | Married | Unmarried |
| 15 to 19 years | 0 (0.0%) | 0 (0.0%) |
| 20 to 34 years | 0 (0.0%) | 0 (0.0%) |
| 35 to 50 years | 12 (80.0%) | 3 (20.0%) |
| Total | 12 (80.0%) | 3 (20.0%) |
Fertility by Education in Rudyard
| Educational Attainment | Women with Births | Births / 1,000 Women |
| Less than High School | 12 (80.0%) | 545.0 |
| High School Diploma | 0 (0.0%) | 0.0 |
| College or Associate's Degree | 3 (20.0%) | 300.0 |
| Bachelor's Degree | 0 (0.0%) | 0.0 |
| Graduate Degree | 0 (0.0%) | 0.0 |
| Total | 15 (100.0%) | 183.0 |
Fertility by Education by Marriage Status in Rudyard
20.0% of women with births in Rudyard are unmarried. Women with the educational attainment of less than high school are most likely to be married with 100.0% of them married at childbirth, while women with the educational attainment of college or associate's degree are least likely to be married with 100.0% of them unmarried at childbirth.
| Educational Attainment | Married | Unmarried |
| Less than High School | 12 (100.0%) | 0 (0.0%) |
| High School Diploma | 0 (0.0%) | 0 (0.0%) |
| College or Associate's Degree | 0 (0.0%) | 3 (100.0%) |
| Bachelor's Degree | 0 (0.0%) | 0 (0.0%) |
| Graduate Degree | 0 (0.0%) | 0 (0.0%) |
| Total | 12 (80.0%) | 3 (20.0%) |
Employment Characteristics in Rudyard
Employment by Class of Employer in Rudyard
Among the 176 employed individuals in Rudyard, private company employees (98 | 55.7%), local government employees (25 | 14.2%), and self-employed (incorporated) (20 | 11.4%) make up the most common classes of employment.
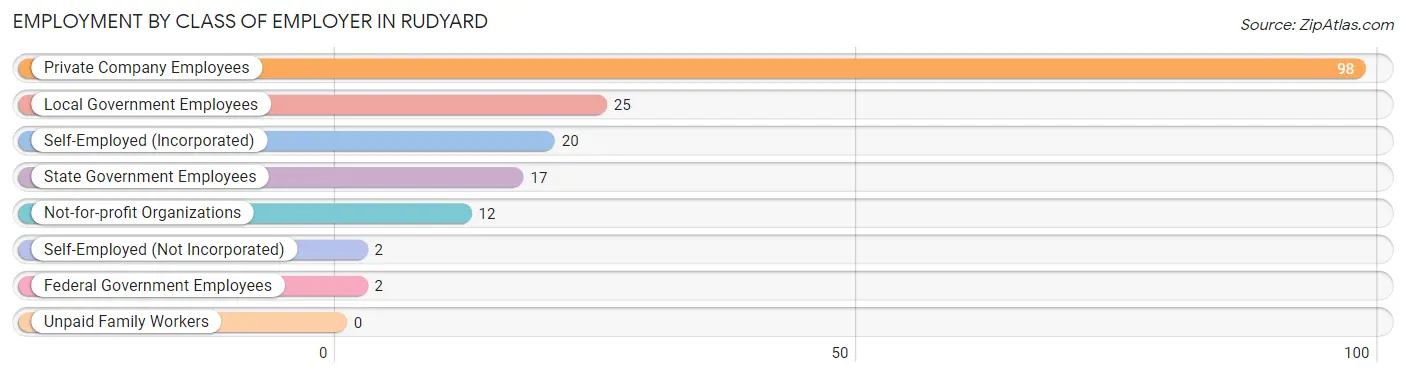
| Employer Class | # Employees | % Employees |
| Private Company Employees | 98 | 55.7% |
| Self-Employed (Incorporated) | 20 | 11.4% |
| Self-Employed (Not Incorporated) | 2 | 1.1% |
| Not-for-profit Organizations | 12 | 6.8% |
| Local Government Employees | 25 | 14.2% |
| State Government Employees | 17 | 9.7% |
| Federal Government Employees | 2 | 1.1% |
| Unpaid Family Workers | 0 | 0.0% |
| Total | 176 | 100.0% |
Employment Status by Age in Rudyard
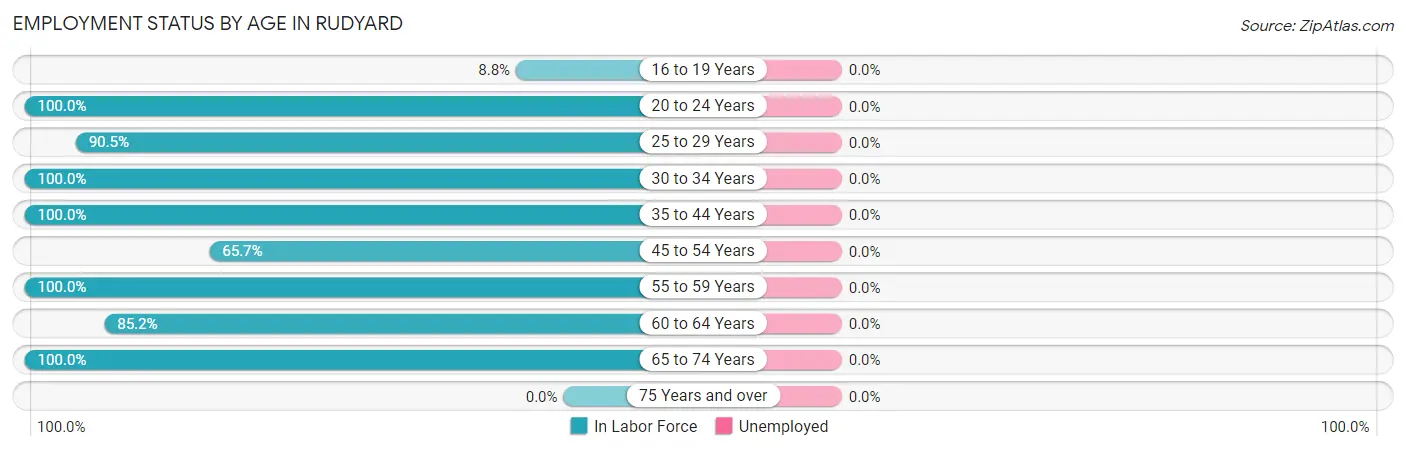
| Age Bracket | In Labor Force | Unemployed |
| 16 to 19 Years | 3 (8.8%) | 0 (0.0%) |
| 20 to 24 Years | 1 (100.0%) | 0 (0.0%) |
| 25 to 29 Years | 19 (90.5%) | 0 (0.0%) |
| 30 to 34 Years | 17 (100.0%) | 0 (0.0%) |
| 35 to 44 Years | 62 (100.0%) | 0 (0.0%) |
| 45 to 54 Years | 23 (65.7%) | 0 (0.0%) |
| 55 to 59 Years | 19 (100.0%) | 0 (0.0%) |
| 60 to 64 Years | 23 (85.2%) | 0 (0.0%) |
| 65 to 74 Years | 9 (100.0%) | 0 (0.0%) |
| 75 Years and over | 0 (0.0%) | 0 (0.0%) |
| Total | 176 (72.7%) | 0 (0.0%) |
Employment Status by Educational Attainment in Rudyard
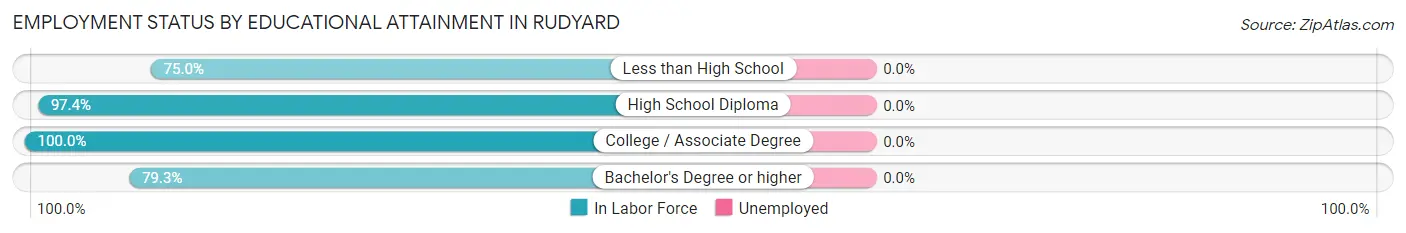
| Educational Attainment | In Labor Force | Unemployed |
| Less than High School | 12 (75.0%) | 0 (0.0%) |
| High School Diploma | 76 (97.4%) | 0 (0.0%) |
| College / Associate Degree | 29 (100.0%) | 0 (0.0%) |
| Bachelor's Degree or higher | 46 (79.3%) | 0 (0.0%) |
| Total | 163 (90.1%) | 0 (0.0%) |
Employment Occupations by Sex in Rudyard
Management, Business, Science and Arts Occupations
The most common Management, Business, Science and Arts occupations in Rudyard are Community & Social Service (15 | 8.5%), Education Instruction & Library (15 | 8.5%), Management (13 | 7.4%), Business & Financial (5 | 2.8%), and Health Diagnosing & Treating (3 | 1.7%).
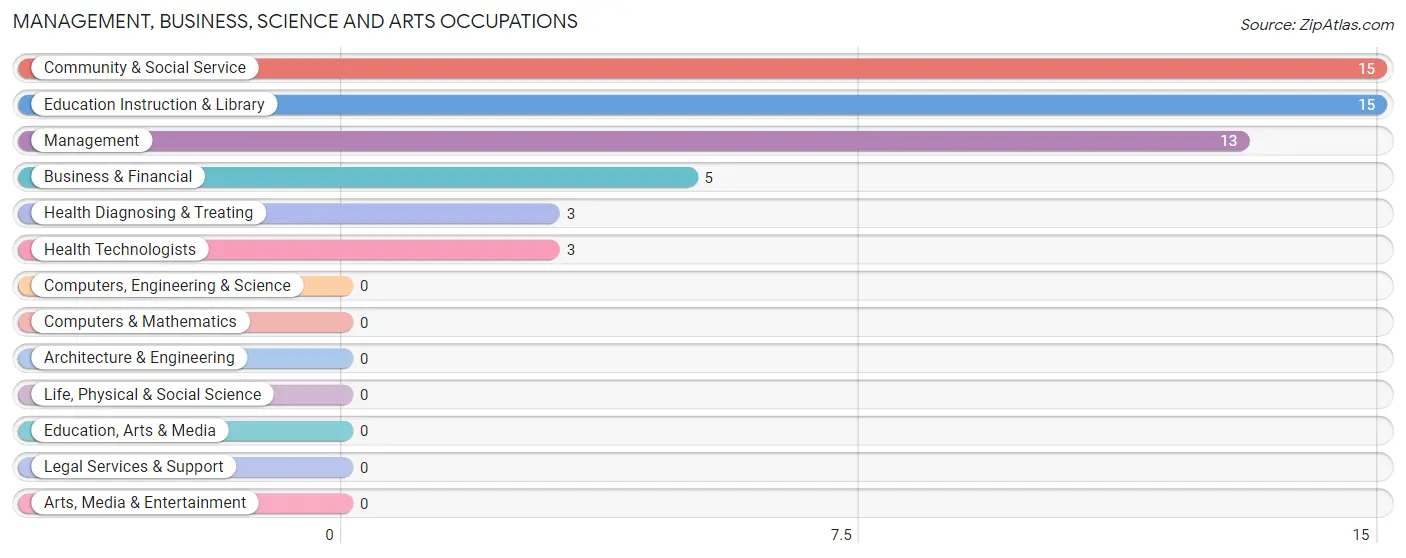
Management, Business, Science and Arts Occupations by Sex
Within the Management, Business, Science and Arts occupations in Rudyard, the most male-oriented occupations are Business & Financial (100.0%), Health Diagnosing & Treating (100.0%), and Health Technologists (100.0%), while the most female-oriented occupations are Management (46.2%), Community & Social Service (20.0%), and Education Instruction & Library (20.0%).
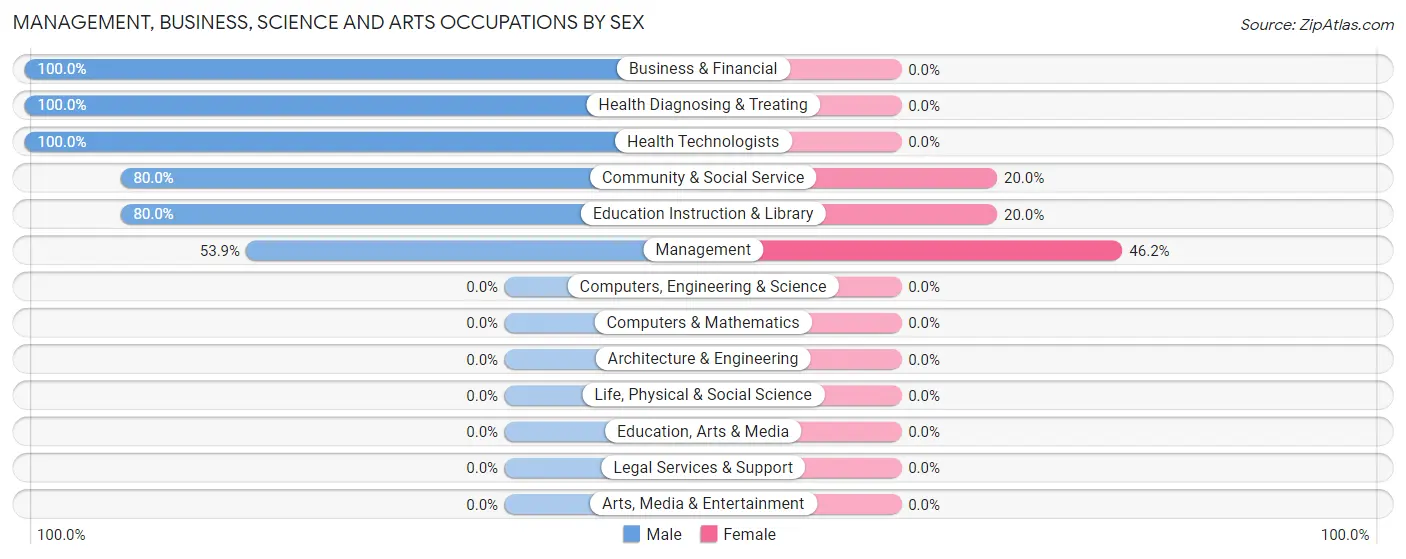
| Occupation | Male | Female |
| Management | 7 (53.8%) | 6 (46.2%) |
| Business & Financial | 5 (100.0%) | 0 (0.0%) |
| Computers, Engineering & Science | 0 (0.0%) | 0 (0.0%) |
| Computers & Mathematics | 0 (0.0%) | 0 (0.0%) |
| Architecture & Engineering | 0 (0.0%) | 0 (0.0%) |
| Life, Physical & Social Science | 0 (0.0%) | 0 (0.0%) |
| Community & Social Service | 12 (80.0%) | 3 (20.0%) |
| Education, Arts & Media | 0 (0.0%) | 0 (0.0%) |
| Legal Services & Support | 0 (0.0%) | 0 (0.0%) |
| Education Instruction & Library | 12 (80.0%) | 3 (20.0%) |
| Arts, Media & Entertainment | 0 (0.0%) | 0 (0.0%) |
| Health Diagnosing & Treating | 3 (100.0%) | 0 (0.0%) |
| Health Technologists | 3 (100.0%) | 0 (0.0%) |
| Total (Category) | 27 (75.0%) | 9 (25.0%) |
| Total (Overall) | 86 (48.9%) | 90 (51.1%) |
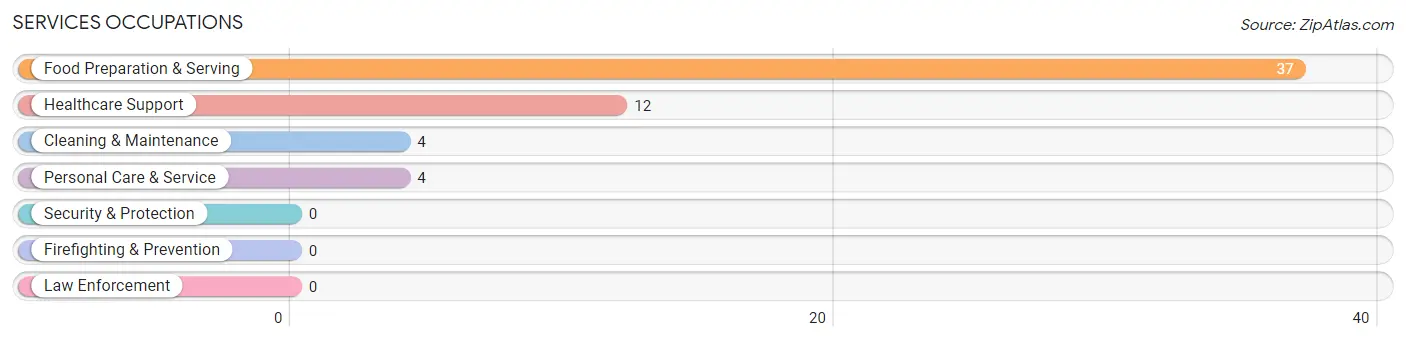
Services Occupations
The most common Services occupations in Rudyard are Food Preparation & Serving (37 | 21.0%), Healthcare Support (12 | 6.8%), Cleaning & Maintenance (4 | 2.3%), and Personal Care & Service (4 | 2.3%).
Services Occupations by Sex
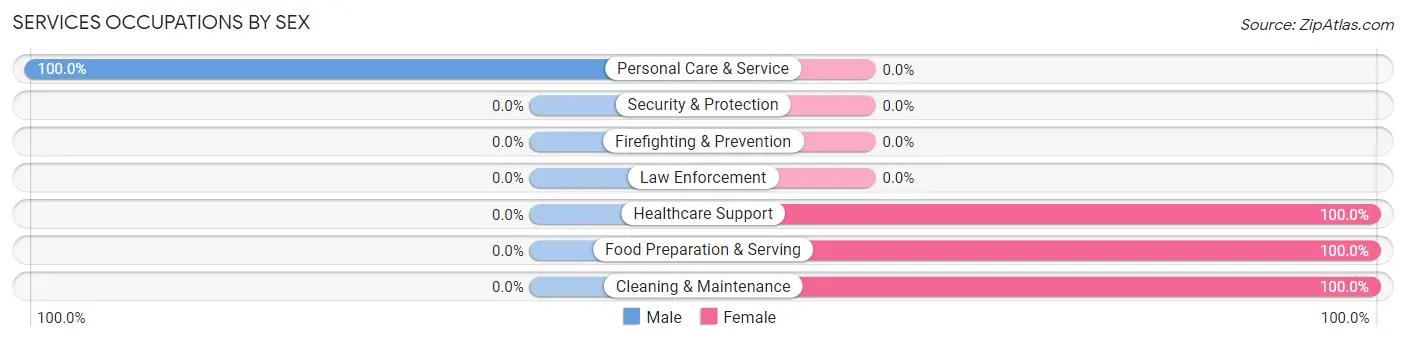
| Occupation | Male | Female |
| Healthcare Support | 0 (0.0%) | 12 (100.0%) |
| Security & Protection | 0 (0.0%) | 0 (0.0%) |
| Firefighting & Prevention | 0 (0.0%) | 0 (0.0%) |
| Law Enforcement | 0 (0.0%) | 0 (0.0%) |
| Food Preparation & Serving | 0 (0.0%) | 37 (100.0%) |
| Cleaning & Maintenance | 0 (0.0%) | 4 (100.0%) |
| Personal Care & Service | 4 (100.0%) | 0 (0.0%) |
| Total (Category) | 4 (7.0%) | 53 (93.0%) |
| Total (Overall) | 86 (48.9%) | 90 (51.1%) |
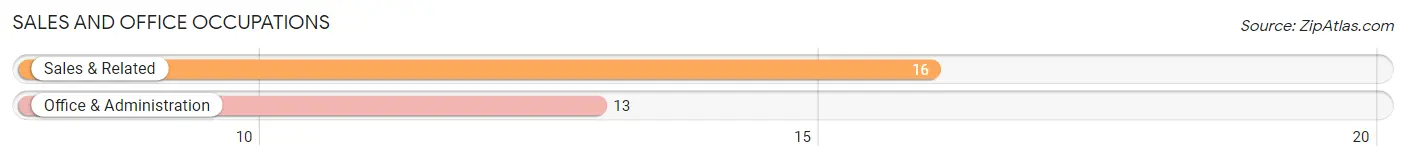
Sales and Office Occupations
The most common Sales and Office occupations in Rudyard are Sales & Related (16 | 9.1%), and Office & Administration (13 | 7.4%).
Sales and Office Occupations by Sex
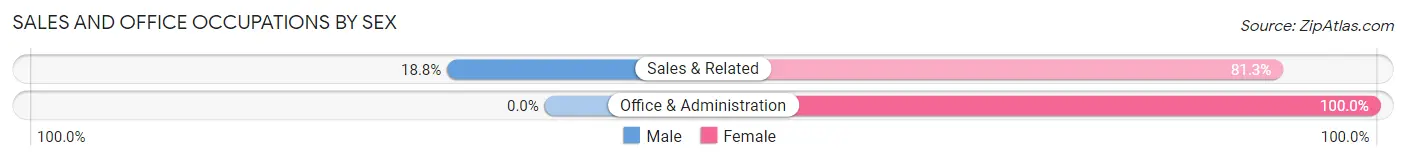
| Occupation | Male | Female |
| Sales & Related | 3 (18.8%) | 13 (81.2%) |
| Office & Administration | 0 (0.0%) | 13 (100.0%) |
| Total (Category) | 3 (10.3%) | 26 (89.7%) |
| Total (Overall) | 86 (48.9%) | 90 (51.1%) |
Natural Resources, Construction and Maintenance Occupations
The most common Natural Resources, Construction and Maintenance occupations in Rudyard are Farming, Fishing & Forestry (11 | 6.2%), Construction & Extraction (8 | 4.5%), and Installation, Maintenance & Repair (6 | 3.4%).
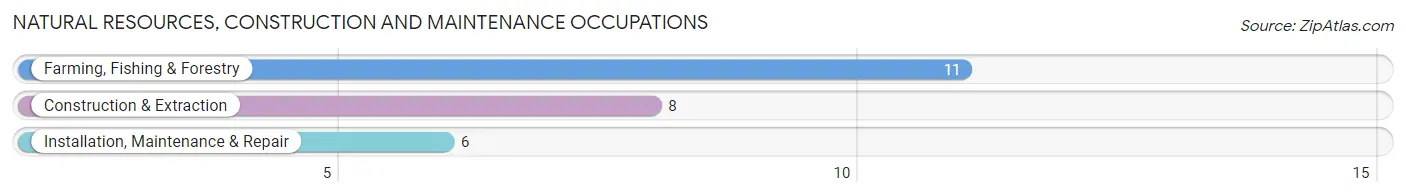
Natural Resources, Construction and Maintenance Occupations by Sex
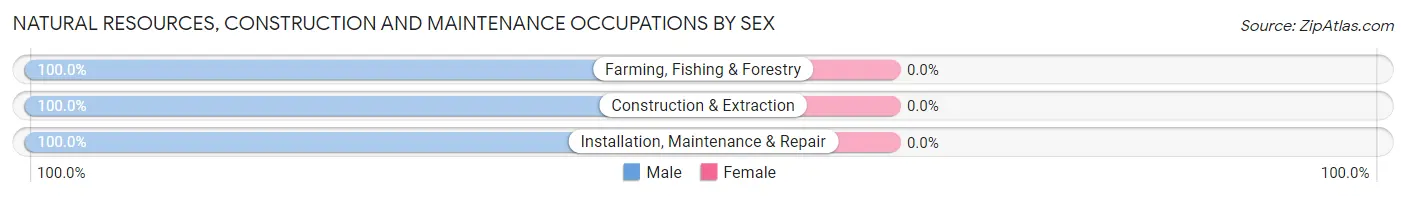
| Occupation | Male | Female |
| Farming, Fishing & Forestry | 11 (100.0%) | 0 (0.0%) |
| Construction & Extraction | 8 (100.0%) | 0 (0.0%) |
| Installation, Maintenance & Repair | 6 (100.0%) | 0 (0.0%) |
| Total (Category) | 25 (100.0%) | 0 (0.0%) |
| Total (Overall) | 86 (48.9%) | 90 (51.1%) |
Production, Transportation and Moving Occupations
The most common Production, Transportation and Moving occupations in Rudyard are Production (17 | 9.7%), Transportation (7 | 4.0%), and Material Moving (5 | 2.8%).
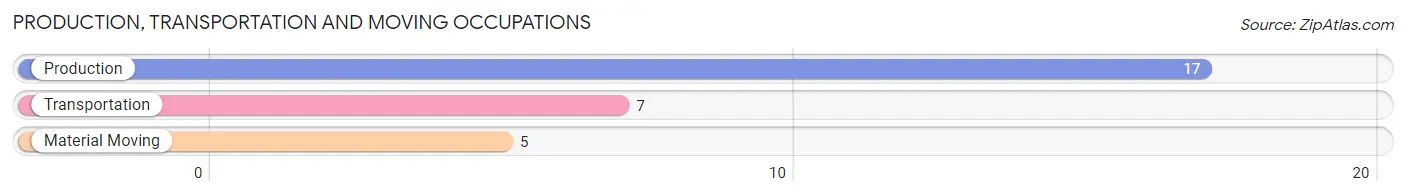
Production, Transportation and Moving Occupations by Sex
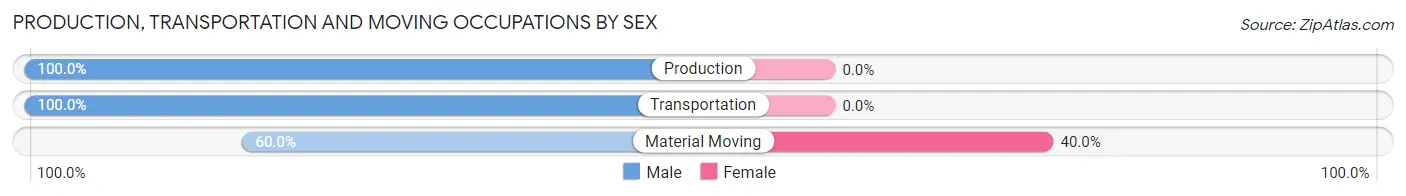
| Occupation | Male | Female |
| Production | 17 (100.0%) | 0 (0.0%) |
| Transportation | 7 (100.0%) | 0 (0.0%) |
| Material Moving | 3 (60.0%) | 2 (40.0%) |
| Total (Category) | 27 (93.1%) | 2 (6.9%) |
| Total (Overall) | 86 (48.9%) | 90 (51.1%) |
Employment Industries by Sex in Rudyard
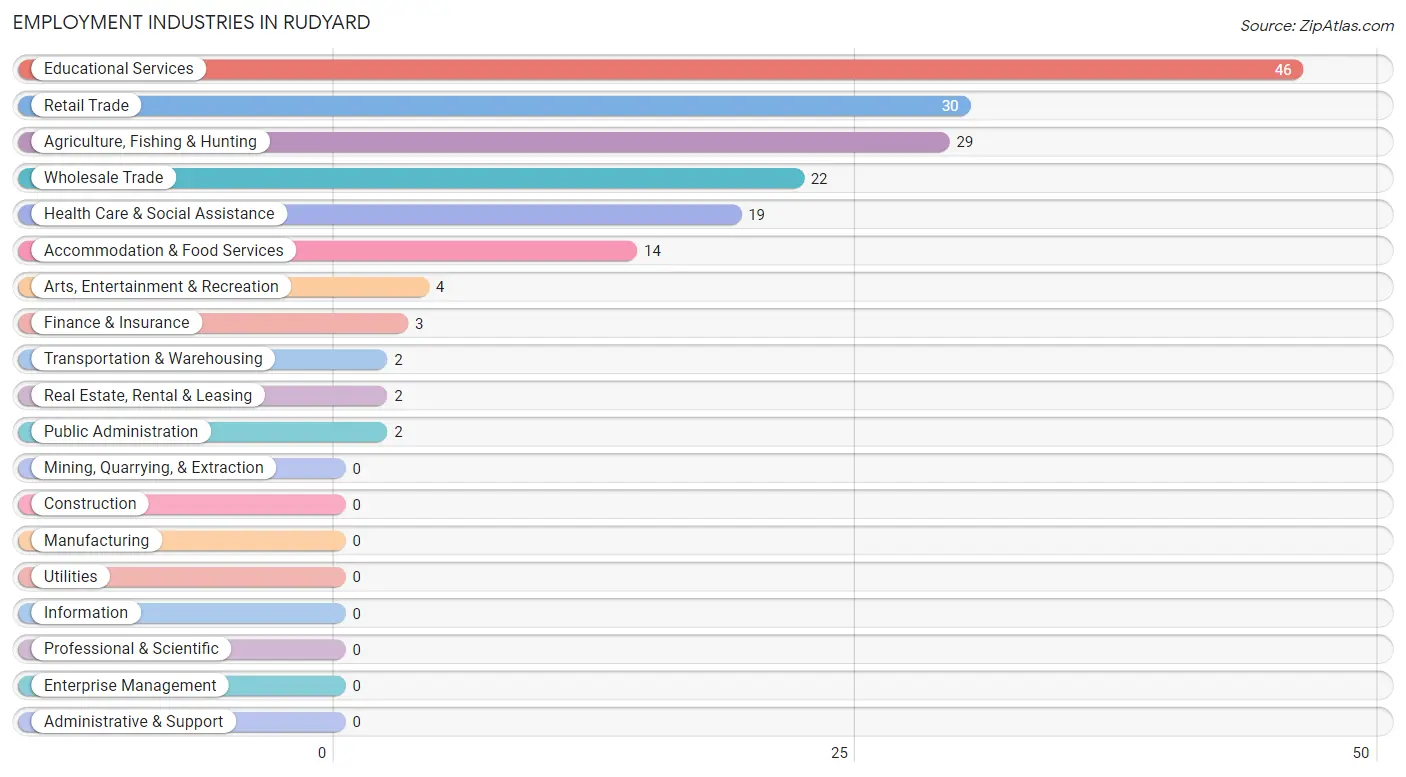
Employment Industries in Rudyard
The major employment industries in Rudyard include Educational Services (46 | 26.1%), Retail Trade (30 | 17.1%), Agriculture, Fishing & Hunting (29 | 16.5%), Wholesale Trade (22 | 12.5%), and Health Care & Social Assistance (19 | 10.8%).
Employment Industries by Sex in Rudyard
The Rudyard industries that see more men than women are Wholesale Trade (100.0%), Transportation & Warehousing (100.0%), and Arts, Entertainment & Recreation (100.0%), whereas the industries that tend to have a higher number of women are Finance & Insurance (100.0%), Real Estate, Rental & Leasing (100.0%), and Accommodation & Food Services (85.7%).
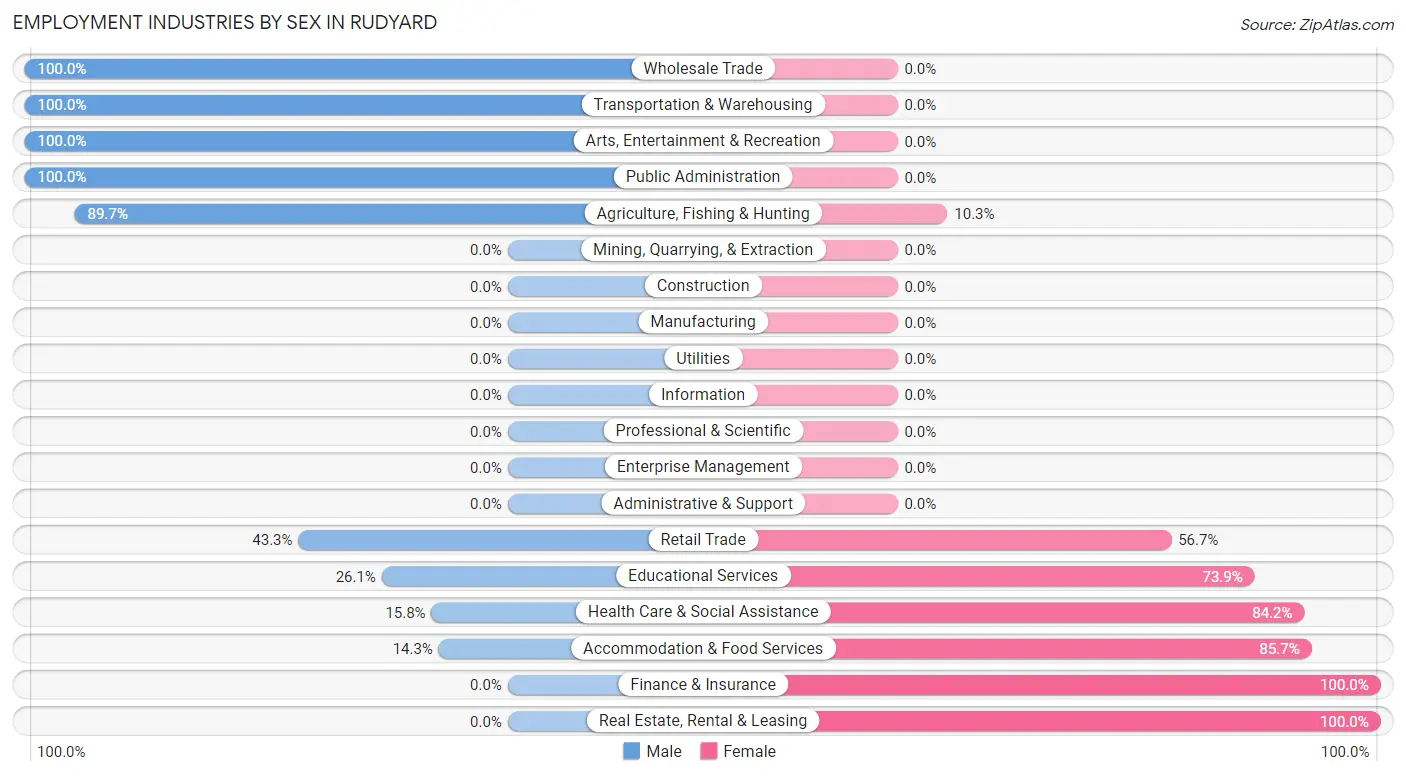
| Industry | Male | Female |
| Agriculture, Fishing & Hunting | 26 (89.7%) | 3 (10.3%) |
| Mining, Quarrying, & Extraction | 0 (0.0%) | 0 (0.0%) |
| Construction | 0 (0.0%) | 0 (0.0%) |
| Manufacturing | 0 (0.0%) | 0 (0.0%) |
| Wholesale Trade | 22 (100.0%) | 0 (0.0%) |
| Retail Trade | 13 (43.3%) | 17 (56.7%) |
| Transportation & Warehousing | 2 (100.0%) | 0 (0.0%) |
| Utilities | 0 (0.0%) | 0 (0.0%) |
| Information | 0 (0.0%) | 0 (0.0%) |
| Finance & Insurance | 0 (0.0%) | 3 (100.0%) |
| Real Estate, Rental & Leasing | 0 (0.0%) | 2 (100.0%) |
| Professional & Scientific | 0 (0.0%) | 0 (0.0%) |
| Enterprise Management | 0 (0.0%) | 0 (0.0%) |
| Administrative & Support | 0 (0.0%) | 0 (0.0%) |
| Educational Services | 12 (26.1%) | 34 (73.9%) |
| Health Care & Social Assistance | 3 (15.8%) | 16 (84.2%) |
| Arts, Entertainment & Recreation | 4 (100.0%) | 0 (0.0%) |
| Accommodation & Food Services | 2 (14.3%) | 12 (85.7%) |
| Public Administration | 2 (100.0%) | 0 (0.0%) |
| Total | 86 (48.9%) | 90 (51.1%) |
Education in Rudyard
School Enrollment in Rudyard
The most common levels of schooling among the 148 students in Rudyard are elementary school (70 | 47.3%), high school (33 | 22.3%), and middle school (23 | 15.5%).
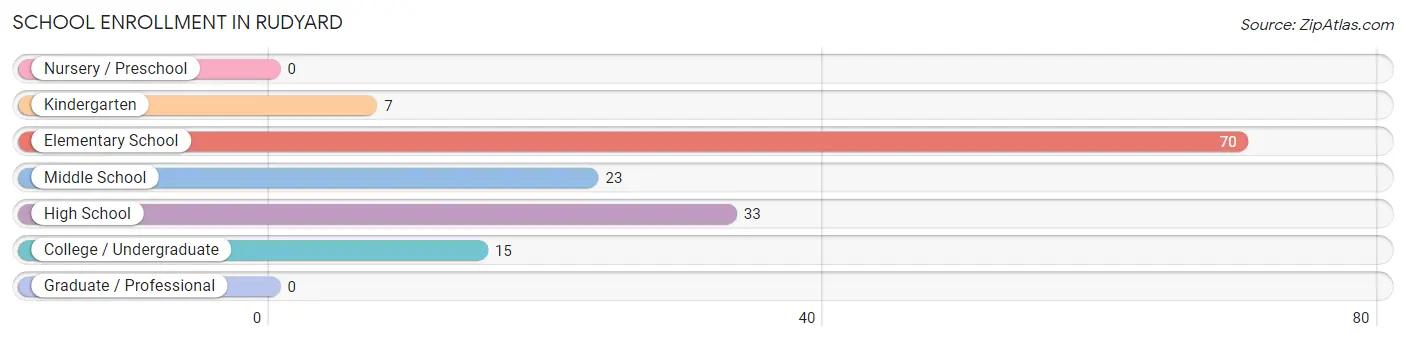
| School Level | # Students | % Students |
| Nursery / Preschool | 0 | 0.0% |
| Kindergarten | 7 | 4.7% |
| Elementary School | 70 | 47.3% |
| Middle School | 23 | 15.5% |
| High School | 33 | 22.3% |
| College / Undergraduate | 15 | 10.1% |
| Graduate / Professional | 0 | 0.0% |
| Total | 148 | 100.0% |
School Enrollment by Age by Funding Source in Rudyard
Out of a total of 148 students who are enrolled in schools in Rudyard, 3 (2.0%) attend a private institution, while the remaining 145 (98.0%) are enrolled in public schools. The age group of 18 to 19 year olds has the highest likelihood of being enrolled in private schools, with 3 (100.0% in the age bracket) enrolled. Conversely, the age group of 5 to 9 year old has the lowest likelihood of being enrolled in a private school, with 60 (100.0% in the age bracket) attending a public institution.
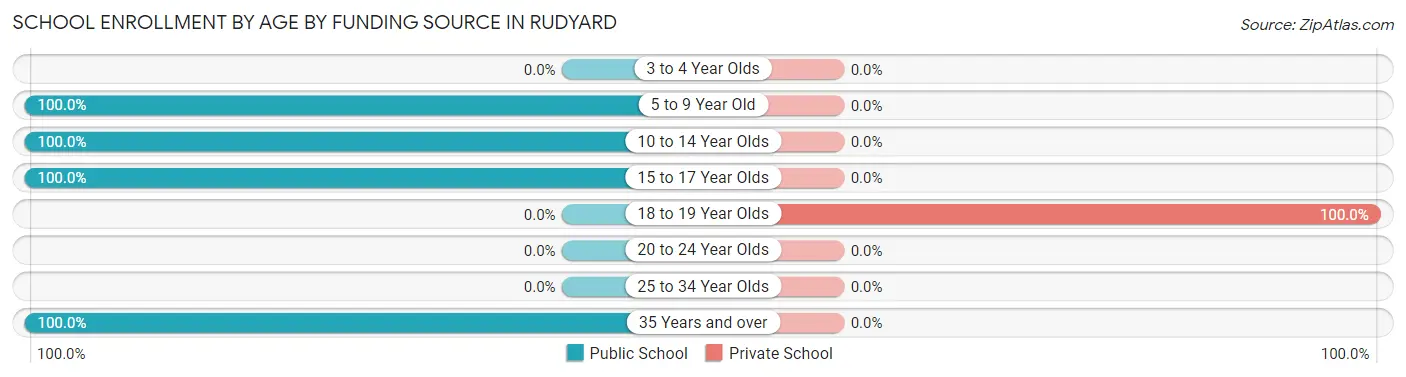
| Age Bracket | Public School | Private School |
| 3 to 4 Year Olds | 0 (0.0%) | 0 (0.0%) |
| 5 to 9 Year Old | 60 (100.0%) | 0 (0.0%) |
| 10 to 14 Year Olds | 42 (100.0%) | 0 (0.0%) |
| 15 to 17 Year Olds | 31 (100.0%) | 0 (0.0%) |
| 18 to 19 Year Olds | 0 (0.0%) | 3 (100.0%) |
| 20 to 24 Year Olds | 0 (0.0%) | 0 (0.0%) |
| 25 to 34 Year Olds | 0 (0.0%) | 0 (0.0%) |
| 35 Years and over | 12 (100.0%) | 0 (0.0%) |
| Total | 145 (98.0%) | 3 (2.0%) |
Educational Attainment by Field of Study in Rudyard
Education (30 | 38.0%), liberal arts & history (19 | 24.0%), bio, nature & agricultural (10 | 12.7%), science & technology (5 | 6.3%), and physical & health sciences (4 | 5.1%) are the most common fields of study among 79 individuals in Rudyard who have obtained a bachelor's degree or higher.
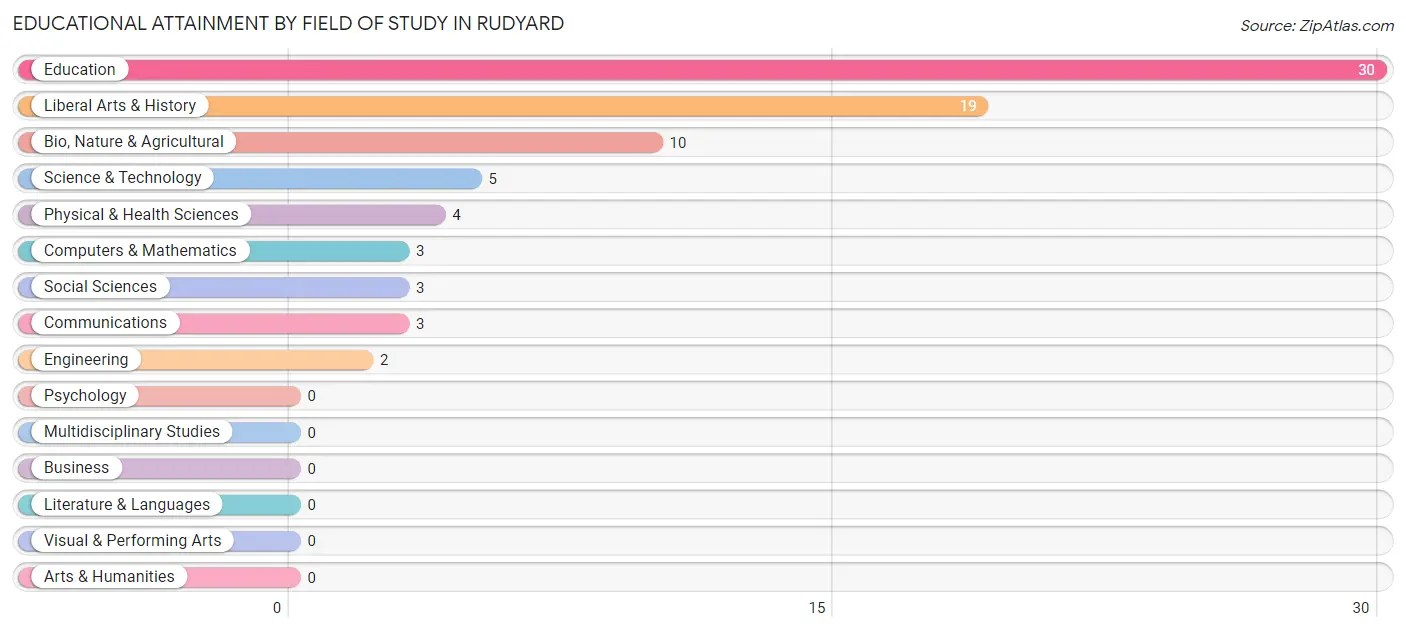
| Field of Study | # Graduates | % Graduates |
| Computers & Mathematics | 3 | 3.8% |
| Bio, Nature & Agricultural | 10 | 12.7% |
| Physical & Health Sciences | 4 | 5.1% |
| Psychology | 0 | 0.0% |
| Social Sciences | 3 | 3.8% |
| Engineering | 2 | 2.5% |
| Multidisciplinary Studies | 0 | 0.0% |
| Science & Technology | 5 | 6.3% |
| Business | 0 | 0.0% |
| Education | 30 | 38.0% |
| Literature & Languages | 0 | 0.0% |
| Liberal Arts & History | 19 | 24.0% |
| Visual & Performing Arts | 0 | 0.0% |
| Communications | 3 | 3.8% |
| Arts & Humanities | 0 | 0.0% |
| Total | 79 | 100.0% |
Transportation & Commute in Rudyard
Vehicle Availability by Sex in Rudyard
The most prevalent vehicle ownership categories in Rudyard are males with 2 vehicles (37, accounting for 43.0%) and females with 2 vehicles (43, making up 41.1%).
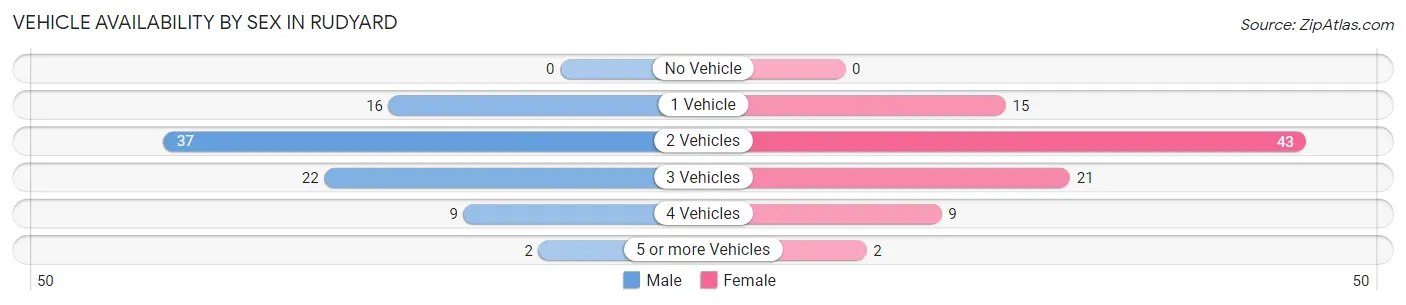
| Vehicles Available | Male | Female |
| No Vehicle | 0 (0.0%) | 0 (0.0%) |
| 1 Vehicle | 16 (18.6%) | 15 (16.7%) |
| 2 Vehicles | 37 (43.0%) | 43 (47.8%) |
| 3 Vehicles | 22 (25.6%) | 21 (23.3%) |
| 4 Vehicles | 9 (10.5%) | 9 (10.0%) |
| 5 or more Vehicles | 2 (2.3%) | 2 (2.2%) |
| Total | 86 (100.0%) | 90 (100.0%) |
Commute Time in Rudyard
The most frequently occuring commute durations in Rudyard are less than 5 minutes (31 commuters, 19.6%), 20 to 24 minutes (28 commuters, 17.7%), and 15 to 19 minutes (26 commuters, 16.5%).
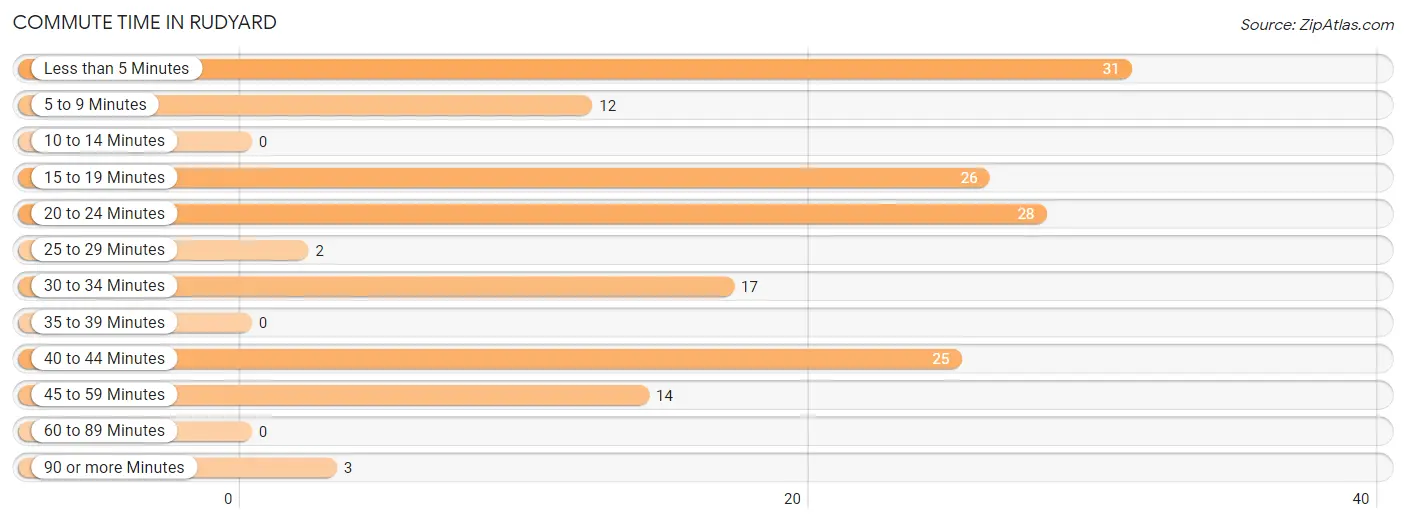
| Commute Time | # Commuters | % Commuters |
| Less than 5 Minutes | 31 | 19.6% |
| 5 to 9 Minutes | 12 | 7.6% |
| 10 to 14 Minutes | 0 | 0.0% |
| 15 to 19 Minutes | 26 | 16.5% |
| 20 to 24 Minutes | 28 | 17.7% |
| 25 to 29 Minutes | 2 | 1.3% |
| 30 to 34 Minutes | 17 | 10.8% |
| 35 to 39 Minutes | 0 | 0.0% |
| 40 to 44 Minutes | 25 | 15.8% |
| 45 to 59 Minutes | 14 | 8.9% |
| 60 to 89 Minutes | 0 | 0.0% |
| 90 or more Minutes | 3 | 1.9% |
Commute Time by Sex in Rudyard
The most common commute times in Rudyard are less than 5 minutes (22 commuters, 25.6%) for males and 40 to 44 minutes (17 commuters, 23.6%) for females.
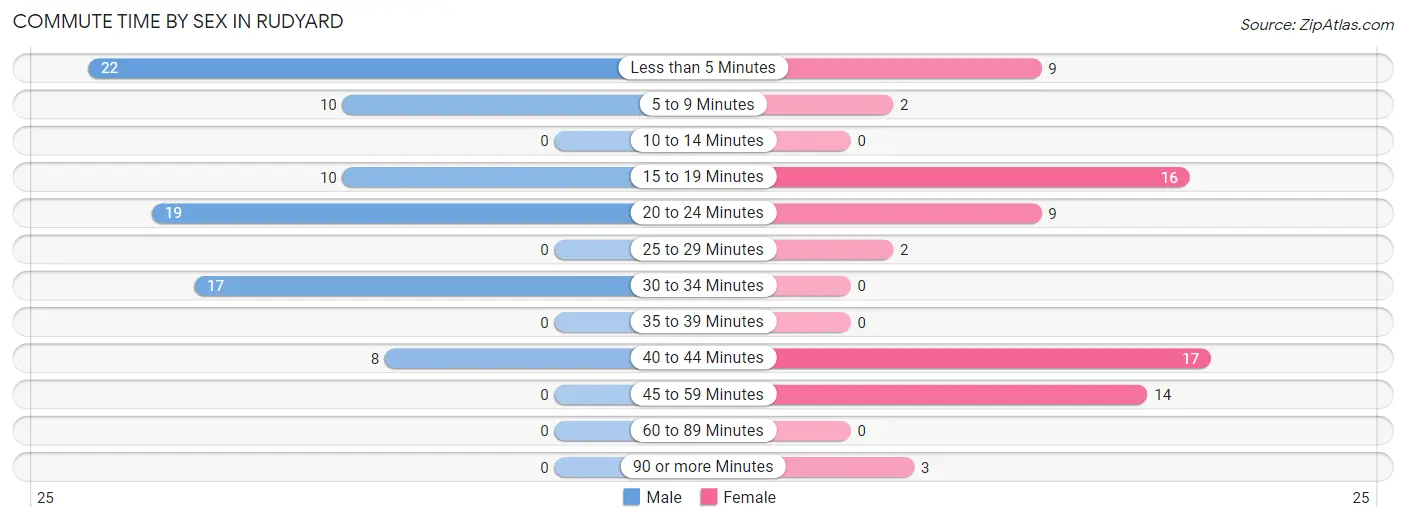
| Commute Time | Male | Female |
| Less than 5 Minutes | 22 (25.6%) | 9 (12.5%) |
| 5 to 9 Minutes | 10 (11.6%) | 2 (2.8%) |
| 10 to 14 Minutes | 0 (0.0%) | 0 (0.0%) |
| 15 to 19 Minutes | 10 (11.6%) | 16 (22.2%) |
| 20 to 24 Minutes | 19 (22.1%) | 9 (12.5%) |
| 25 to 29 Minutes | 0 (0.0%) | 2 (2.8%) |
| 30 to 34 Minutes | 17 (19.8%) | 0 (0.0%) |
| 35 to 39 Minutes | 0 (0.0%) | 0 (0.0%) |
| 40 to 44 Minutes | 8 (9.3%) | 17 (23.6%) |
| 45 to 59 Minutes | 0 (0.0%) | 14 (19.4%) |
| 60 to 89 Minutes | 0 (0.0%) | 0 (0.0%) |
| 90 or more Minutes | 0 (0.0%) | 3 (4.2%) |
Time of Departure to Work by Sex in Rudyard
The most frequent times of departure to work in Rudyard are 7:30 AM to 7:59 AM (29, 33.7%) for males and 6:00 AM to 6:29 AM (33, 45.8%) for females.
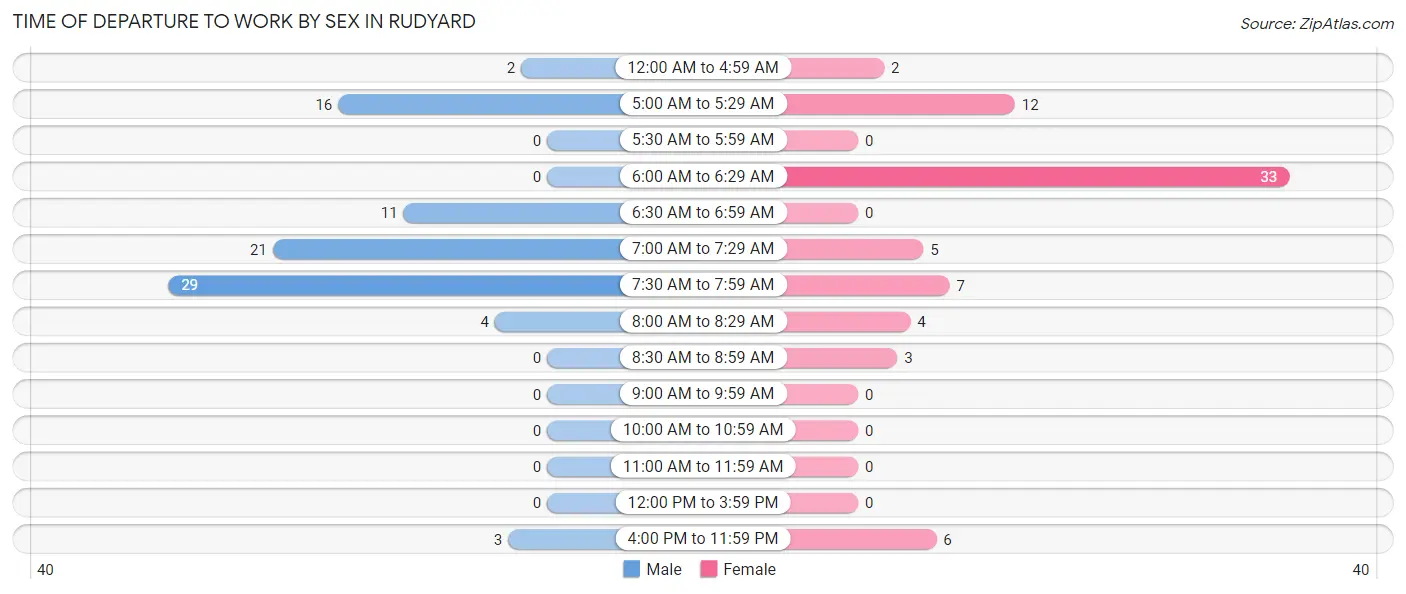
| Time of Departure | Male | Female |
| 12:00 AM to 4:59 AM | 2 (2.3%) | 2 (2.8%) |
| 5:00 AM to 5:29 AM | 16 (18.6%) | 12 (16.7%) |
| 5:30 AM to 5:59 AM | 0 (0.0%) | 0 (0.0%) |
| 6:00 AM to 6:29 AM | 0 (0.0%) | 33 (45.8%) |
| 6:30 AM to 6:59 AM | 11 (12.8%) | 0 (0.0%) |
| 7:00 AM to 7:29 AM | 21 (24.4%) | 5 (6.9%) |
| 7:30 AM to 7:59 AM | 29 (33.7%) | 7 (9.7%) |
| 8:00 AM to 8:29 AM | 4 (4.6%) | 4 (5.6%) |
| 8:30 AM to 8:59 AM | 0 (0.0%) | 3 (4.2%) |
| 9:00 AM to 9:59 AM | 0 (0.0%) | 0 (0.0%) |
| 10:00 AM to 10:59 AM | 0 (0.0%) | 0 (0.0%) |
| 11:00 AM to 11:59 AM | 0 (0.0%) | 0 (0.0%) |
| 12:00 PM to 3:59 PM | 0 (0.0%) | 0 (0.0%) |
| 4:00 PM to 11:59 PM | 3 (3.5%) | 6 (8.3%) |
| Total | 86 (100.0%) | 72 (100.0%) |
Housing Occupancy in Rudyard
Occupancy by Ownership in Rudyard
Of the total 131 dwellings in Rudyard, owner-occupied units account for 75 (57.3%), while renter-occupied units make up 56 (42.7%).
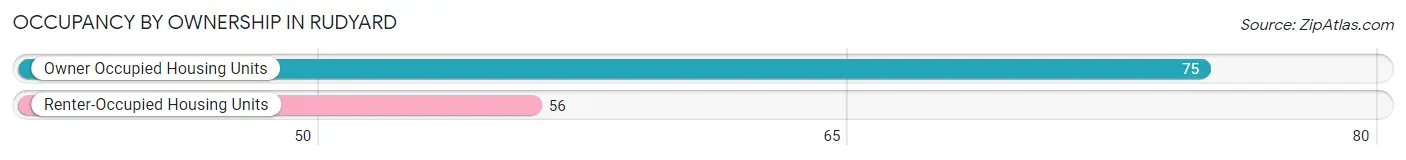
| Occupancy | # Housing Units | % Housing Units |
| Owner Occupied Housing Units | 75 | 57.3% |
| Renter-Occupied Housing Units | 56 | 42.7% |
| Total Occupied Housing Units | 131 | 100.0% |
Occupancy by Household Size in Rudyard
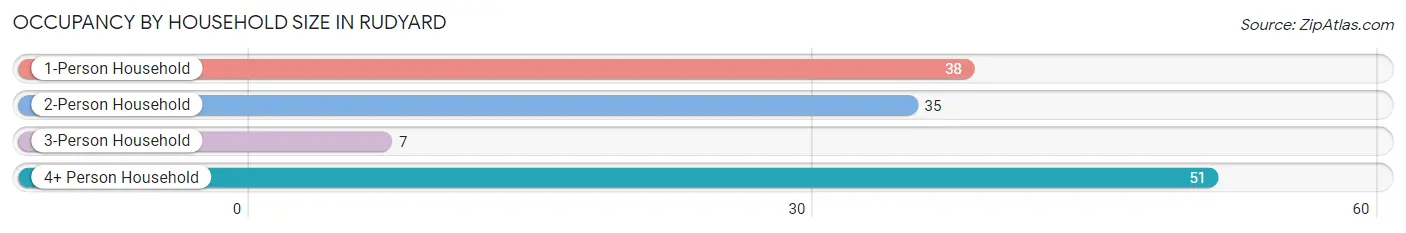
| Household Size | # Housing Units | % Housing Units |
| 1-Person Household | 38 | 29.0% |
| 2-Person Household | 35 | 26.7% |
| 3-Person Household | 7 | 5.3% |
| 4+ Person Household | 51 | 38.9% |
| Total Housing Units | 131 | 100.0% |
Occupancy by Ownership by Household Size in Rudyard
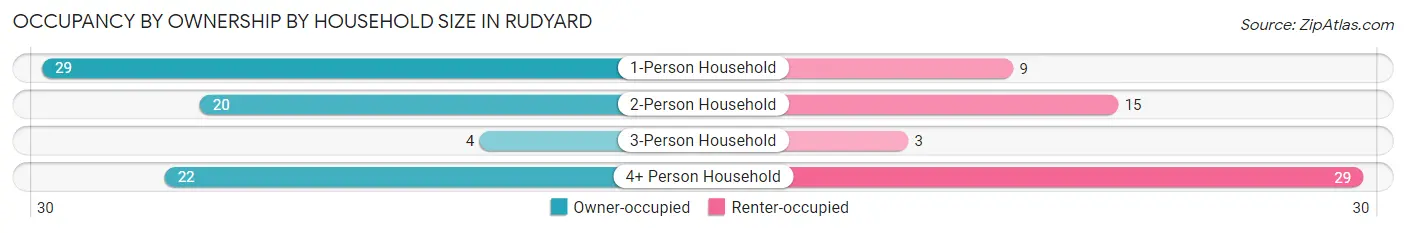
| Household Size | Owner-occupied | Renter-occupied |
| 1-Person Household | 29 (76.3%) | 9 (23.7%) |
| 2-Person Household | 20 (57.1%) | 15 (42.9%) |
| 3-Person Household | 4 (57.1%) | 3 (42.9%) |
| 4+ Person Household | 22 (43.1%) | 29 (56.9%) |
| Total Housing Units | 75 (57.3%) | 56 (42.7%) |
Occupancy by Educational Attainment in Rudyard
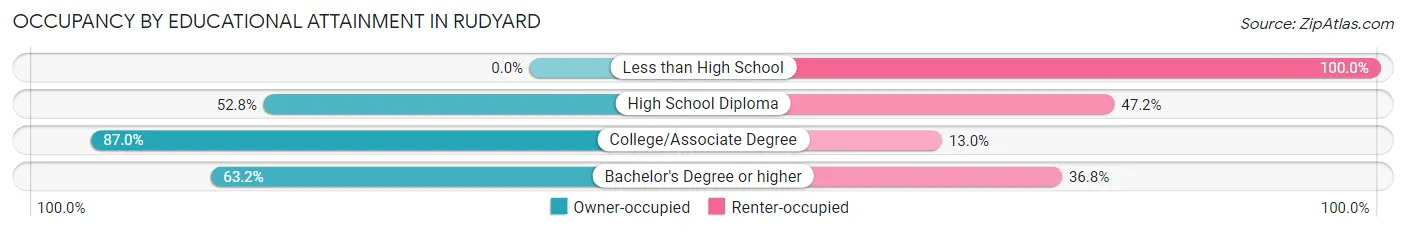
| Household Size | Owner-occupied | Renter-occupied |
| Less than High School | 0 (0.0%) | 15 (100.0%) |
| High School Diploma | 19 (52.8%) | 17 (47.2%) |
| College/Associate Degree | 20 (87.0%) | 3 (13.0%) |
| Bachelor's Degree or higher | 36 (63.2%) | 21 (36.8%) |
Occupancy by Age of Householder in Rudyard
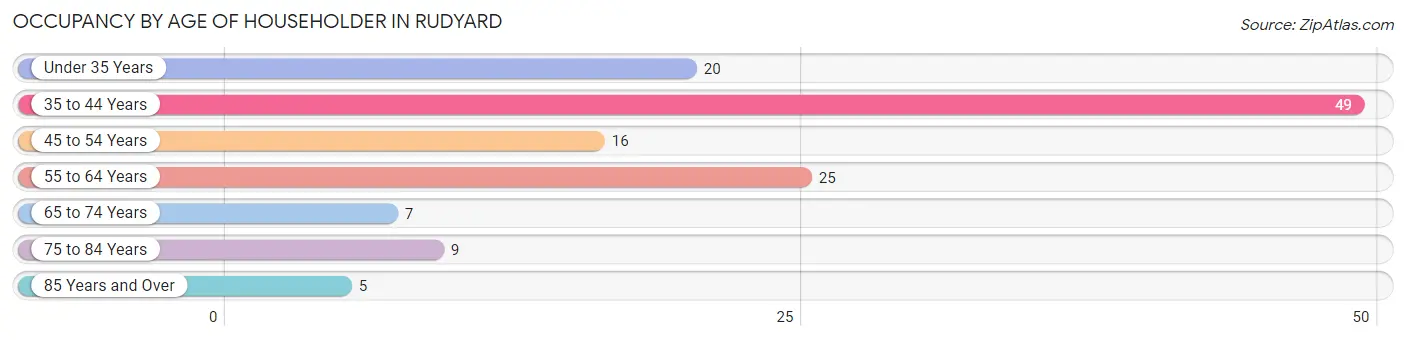
| Age Bracket | # Households | % Households |
| Under 35 Years | 20 | 15.3% |
| 35 to 44 Years | 49 | 37.4% |
| 45 to 54 Years | 16 | 12.2% |
| 55 to 64 Years | 25 | 19.1% |
| 65 to 74 Years | 7 | 5.3% |
| 75 to 84 Years | 9 | 6.9% |
| 85 Years and Over | 5 | 3.8% |
| Total | 131 | 100.0% |
Housing Finances in Rudyard
Median Income by Occupancy in Rudyard
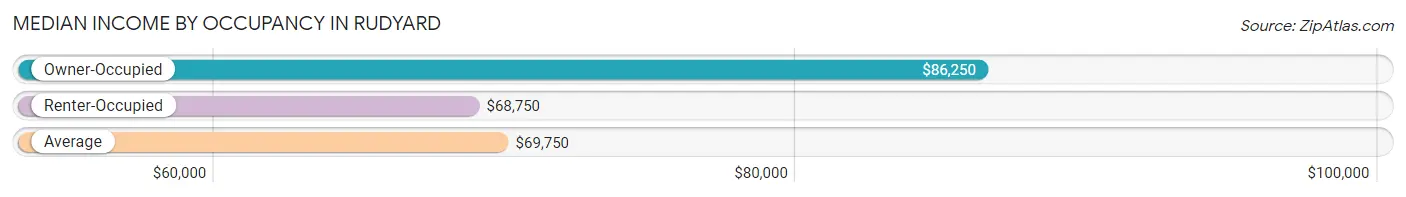
| Occupancy Type | # Households | Median Income |
| Owner-Occupied | 75 (57.3%) | $86,250 |
| Renter-Occupied | 56 (42.7%) | $68,750 |
| Average | 131 (100.0%) | $69,750 |
Occupancy by Householder Income Bracket in Rudyard
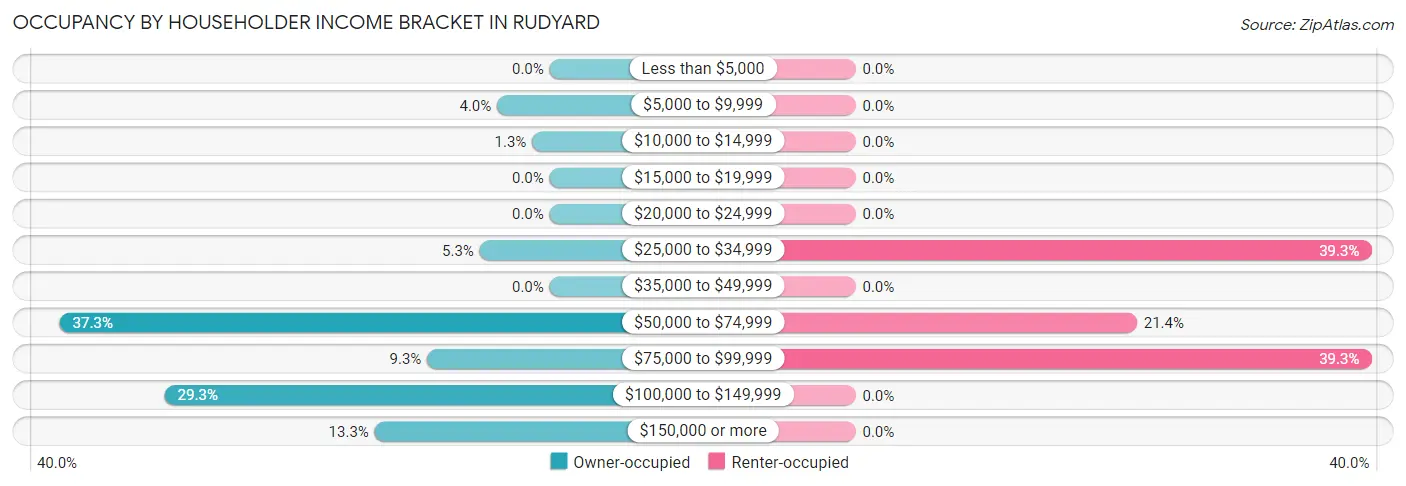
| Income Bracket | Owner-occupied | Renter-occupied |
| Less than $5,000 | 0 (0.0%) | 0 (0.0%) |
| $5,000 to $9,999 | 3 (4.0%) | 0 (0.0%) |
| $10,000 to $14,999 | 1 (1.3%) | 0 (0.0%) |
| $15,000 to $19,999 | 0 (0.0%) | 0 (0.0%) |
| $20,000 to $24,999 | 0 (0.0%) | 0 (0.0%) |
| $25,000 to $34,999 | 4 (5.3%) | 22 (39.3%) |
| $35,000 to $49,999 | 0 (0.0%) | 0 (0.0%) |
| $50,000 to $74,999 | 28 (37.3%) | 12 (21.4%) |
| $75,000 to $99,999 | 7 (9.3%) | 22 (39.3%) |
| $100,000 to $149,999 | 22 (29.3%) | 0 (0.0%) |
| $150,000 or more | 10 (13.3%) | 0 (0.0%) |
| Total | 75 (100.0%) | 56 (100.0%) |
Monthly Housing Cost Tiers in Rudyard
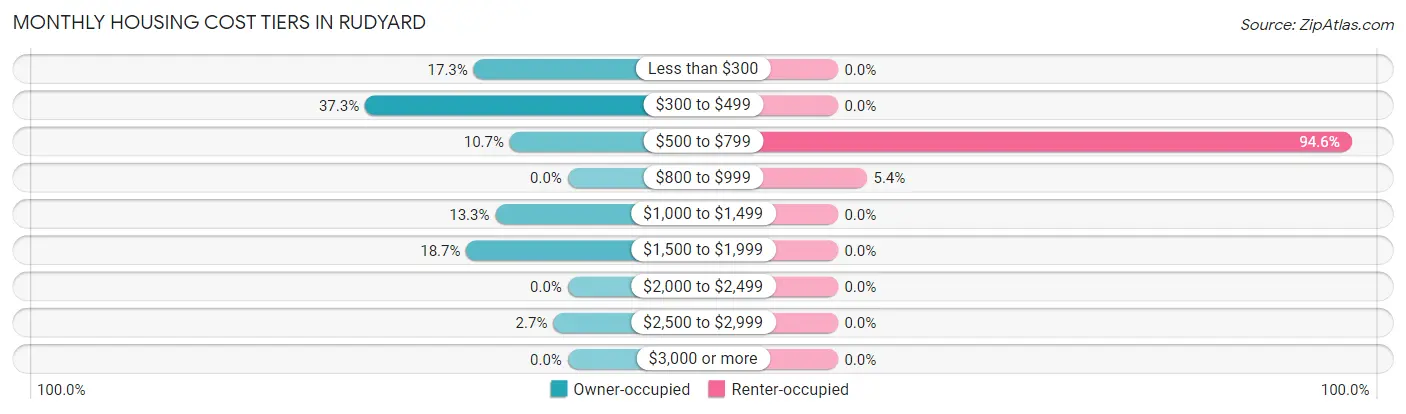
| Monthly Cost | Owner-occupied | Renter-occupied |
| Less than $300 | 13 (17.3%) | 0 (0.0%) |
| $300 to $499 | 28 (37.3%) | 0 (0.0%) |
| $500 to $799 | 8 (10.7%) | 53 (94.6%) |
| $800 to $999 | 0 (0.0%) | 3 (5.4%) |
| $1,000 to $1,499 | 10 (13.3%) | 0 (0.0%) |
| $1,500 to $1,999 | 14 (18.7%) | 0 (0.0%) |
| $2,000 to $2,499 | 0 (0.0%) | 0 (0.0%) |
| $2,500 to $2,999 | 2 (2.7%) | 0 (0.0%) |
| $3,000 or more | 0 (0.0%) | 0 (0.0%) |
| Total | 75 (100.0%) | 56 (100.0%) |
Physical Housing Characteristics in Rudyard
Housing Structures in Rudyard
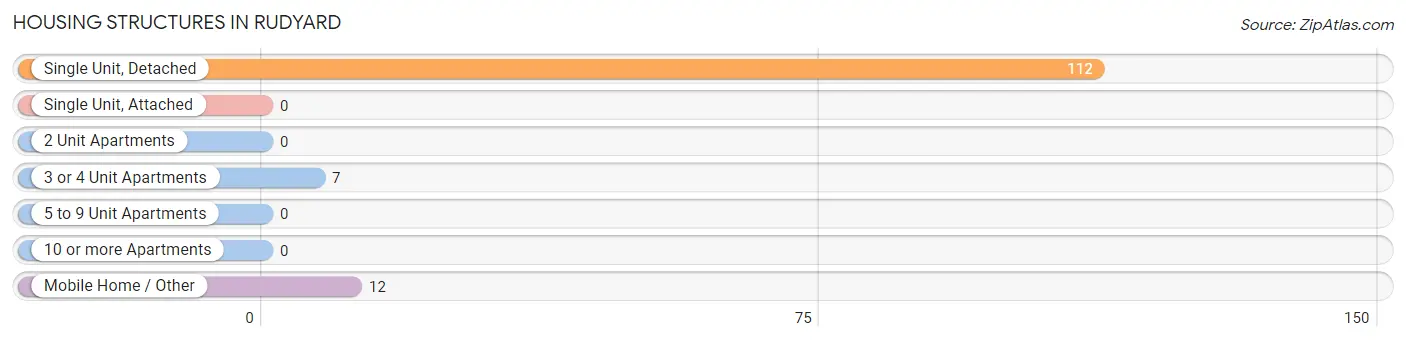
| Structure Type | # Housing Units | % Housing Units |
| Single Unit, Detached | 112 | 85.5% |
| Single Unit, Attached | 0 | 0.0% |
| 2 Unit Apartments | 0 | 0.0% |
| 3 or 4 Unit Apartments | 7 | 5.3% |
| 5 to 9 Unit Apartments | 0 | 0.0% |
| 10 or more Apartments | 0 | 0.0% |
| Mobile Home / Other | 12 | 9.2% |
| Total | 131 | 100.0% |
Housing Structures by Occupancy in Rudyard
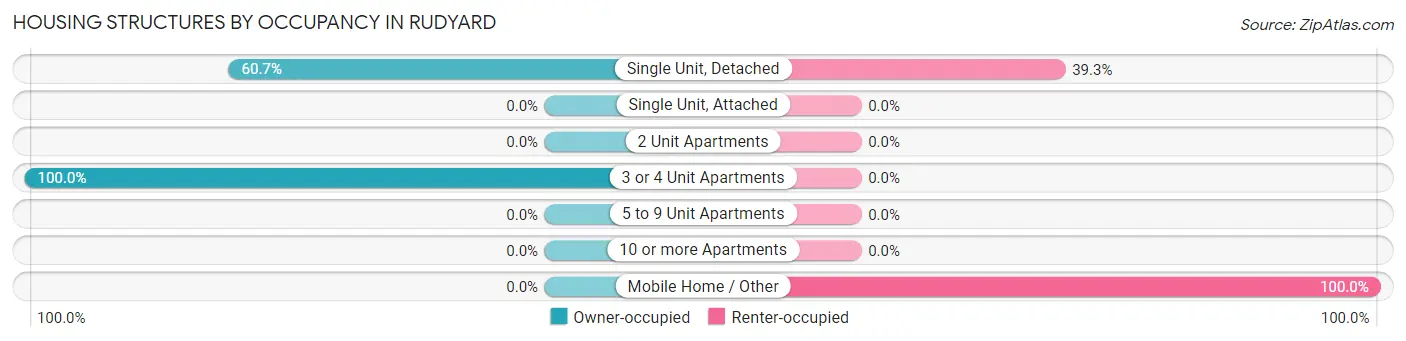
| Structure Type | Owner-occupied | Renter-occupied |
| Single Unit, Detached | 68 (60.7%) | 44 (39.3%) |
| Single Unit, Attached | 0 (0.0%) | 0 (0.0%) |
| 2 Unit Apartments | 0 (0.0%) | 0 (0.0%) |
| 3 or 4 Unit Apartments | 7 (100.0%) | 0 (0.0%) |
| 5 to 9 Unit Apartments | 0 (0.0%) | 0 (0.0%) |
| 10 or more Apartments | 0 (0.0%) | 0 (0.0%) |
| Mobile Home / Other | 0 (0.0%) | 12 (100.0%) |
| Total | 75 (57.3%) | 56 (42.7%) |
Housing Structures by Number of Rooms in Rudyard
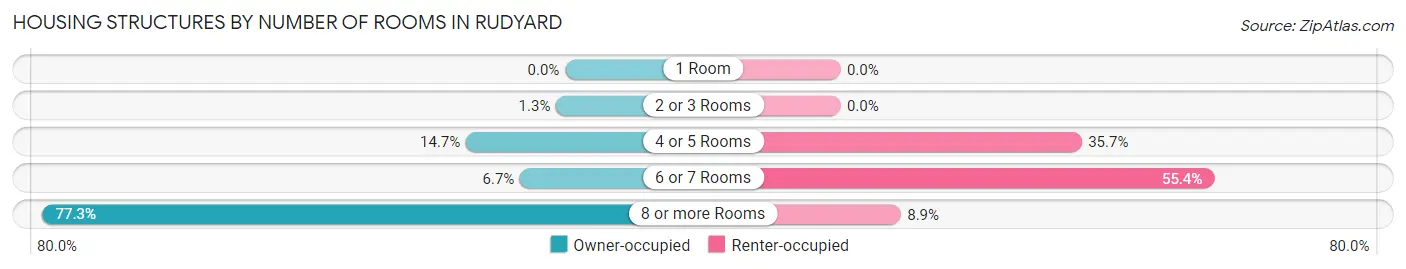
| Number of Rooms | Owner-occupied | Renter-occupied |
| 1 Room | 0 (0.0%) | 0 (0.0%) |
| 2 or 3 Rooms | 1 (1.3%) | 0 (0.0%) |
| 4 or 5 Rooms | 11 (14.7%) | 20 (35.7%) |
| 6 or 7 Rooms | 5 (6.7%) | 31 (55.4%) |
| 8 or more Rooms | 58 (77.3%) | 5 (8.9%) |
| Total | 75 (100.0%) | 56 (100.0%) |
Housing Structure by Heating Type in Rudyard
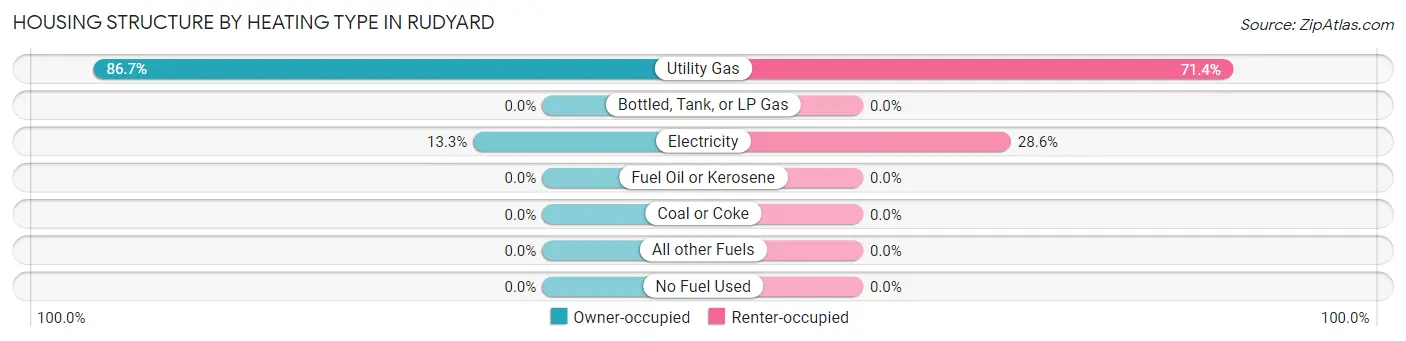
| Heating Type | Owner-occupied | Renter-occupied |
| Utility Gas | 65 (86.7%) | 40 (71.4%) |
| Bottled, Tank, or LP Gas | 0 (0.0%) | 0 (0.0%) |
| Electricity | 10 (13.3%) | 16 (28.6%) |
| Fuel Oil or Kerosene | 0 (0.0%) | 0 (0.0%) |
| Coal or Coke | 0 (0.0%) | 0 (0.0%) |
| All other Fuels | 0 (0.0%) | 0 (0.0%) |
| No Fuel Used | 0 (0.0%) | 0 (0.0%) |
| Total | 75 (100.0%) | 56 (100.0%) |
Household Vehicle Usage in Rudyard
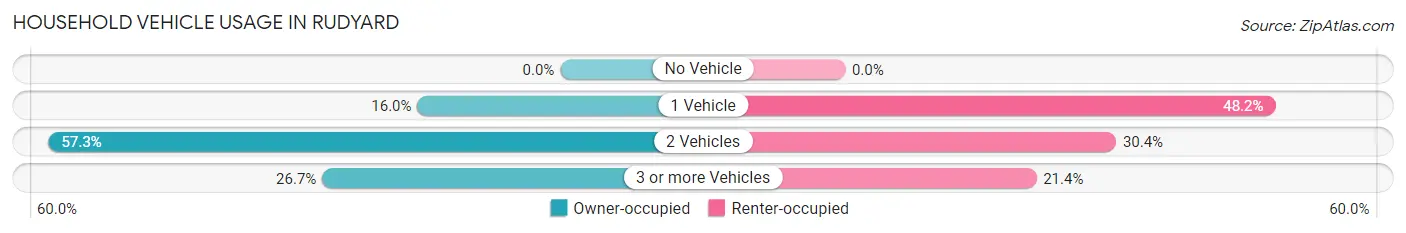
| Vehicles per Household | Owner-occupied | Renter-occupied |
| No Vehicle | 0 (0.0%) | 0 (0.0%) |
| 1 Vehicle | 12 (16.0%) | 27 (48.2%) |
| 2 Vehicles | 43 (57.3%) | 17 (30.4%) |
| 3 or more Vehicles | 20 (26.7%) | 12 (21.4%) |
| Total | 75 (100.0%) | 56 (100.0%) |
Real Estate & Mortgages in Rudyard
Real Estate and Mortgage Overview in Rudyard
| Characteristic | Without Mortgage | With Mortgage |
| Housing Units | 45 | 30 |
| Median Property Value | $79,200 | $183,900 |
| Median Household Income | $106,875 | $2 |
| Monthly Housing Costs | $346 | $0 |
| Real Estate Taxes | $833 | $0 |
Property Value by Mortgage Status in Rudyard
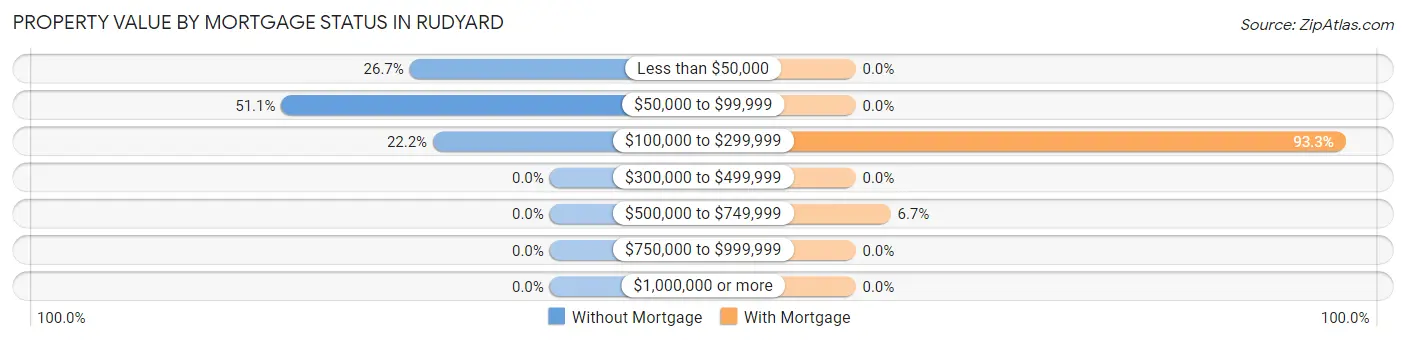
| Property Value | Without Mortgage | With Mortgage |
| Less than $50,000 | 12 (26.7%) | 0 (0.0%) |
| $50,000 to $99,999 | 23 (51.1%) | 0 (0.0%) |
| $100,000 to $299,999 | 10 (22.2%) | 28 (93.3%) |
| $300,000 to $499,999 | 0 (0.0%) | 0 (0.0%) |
| $500,000 to $749,999 | 0 (0.0%) | 2 (6.7%) |
| $750,000 to $999,999 | 0 (0.0%) | 0 (0.0%) |
| $1,000,000 or more | 0 (0.0%) | 0 (0.0%) |
| Total | 45 (100.0%) | 30 (100.0%) |
Household Income by Mortgage Status in Rudyard
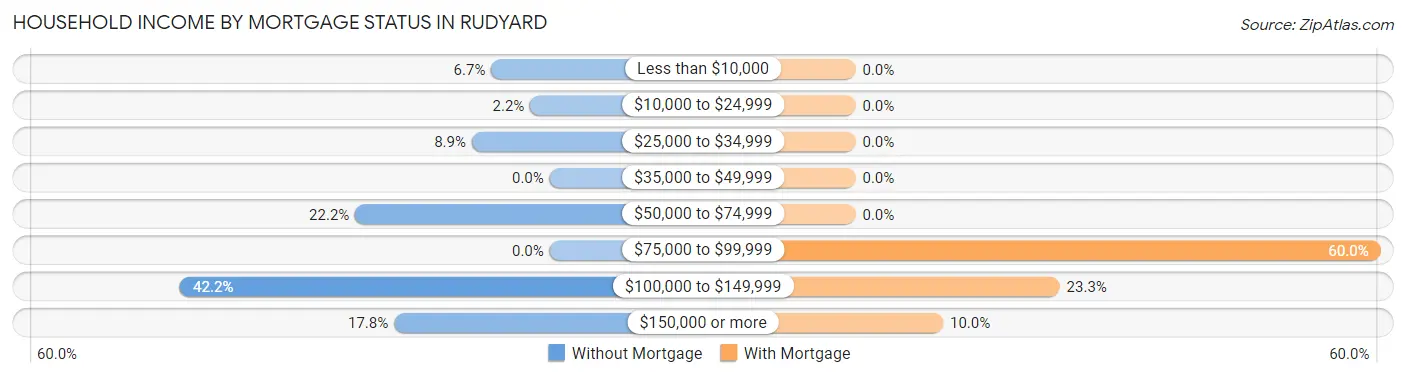
| Household Income | Without Mortgage | With Mortgage |
| Less than $10,000 | 3 (6.7%) | 0 (0.0%) |
| $10,000 to $24,999 | 1 (2.2%) | 0 (0.0%) |
| $25,000 to $34,999 | 4 (8.9%) | 0 (0.0%) |
| $35,000 to $49,999 | 0 (0.0%) | 0 (0.0%) |
| $50,000 to $74,999 | 10 (22.2%) | 0 (0.0%) |
| $75,000 to $99,999 | 0 (0.0%) | 18 (60.0%) |
| $100,000 to $149,999 | 19 (42.2%) | 7 (23.3%) |
| $150,000 or more | 8 (17.8%) | 3 (10.0%) |
| Total | 45 (100.0%) | 30 (100.0%) |
Property Value to Household Income Ratio in Rudyard
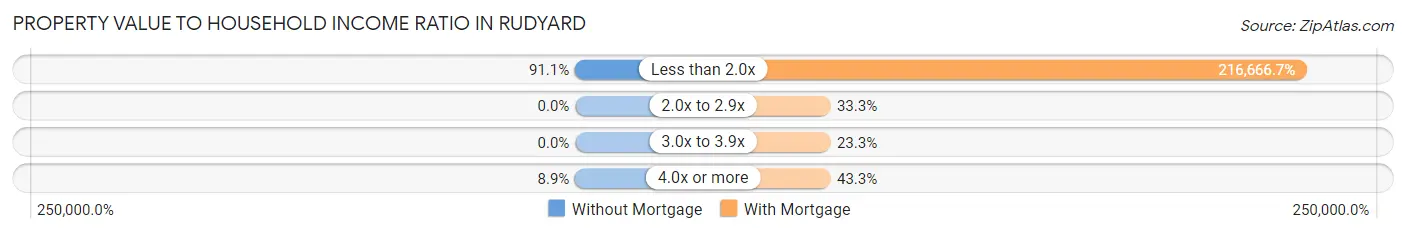
| Value-to-Income Ratio | Without Mortgage | With Mortgage |
| Less than 2.0x | 41 (91.1%) | 65,000 (216,666.7%) |
| 2.0x to 2.9x | 0 (0.0%) | 10 (33.3%) |
| 3.0x to 3.9x | 0 (0.0%) | 7 (23.3%) |
| 4.0x or more | 4 (8.9%) | 13 (43.3%) |
| Total | 45 (100.0%) | 30 (100.0%) |
Real Estate Taxes by Mortgage Status in Rudyard
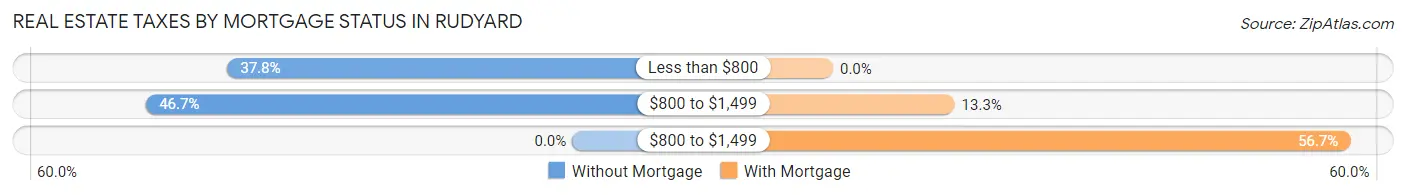
| Property Taxes | Without Mortgage | With Mortgage |
| Less than $800 | 17 (37.8%) | 0 (0.0%) |
| $800 to $1,499 | 21 (46.7%) | 4 (13.3%) |
| $800 to $1,499 | 0 (0.0%) | 17 (56.7%) |
| Total | 45 (100.0%) | 30 (100.0%) |
Health & Disability in Rudyard
Health Insurance Coverage by Age in Rudyard
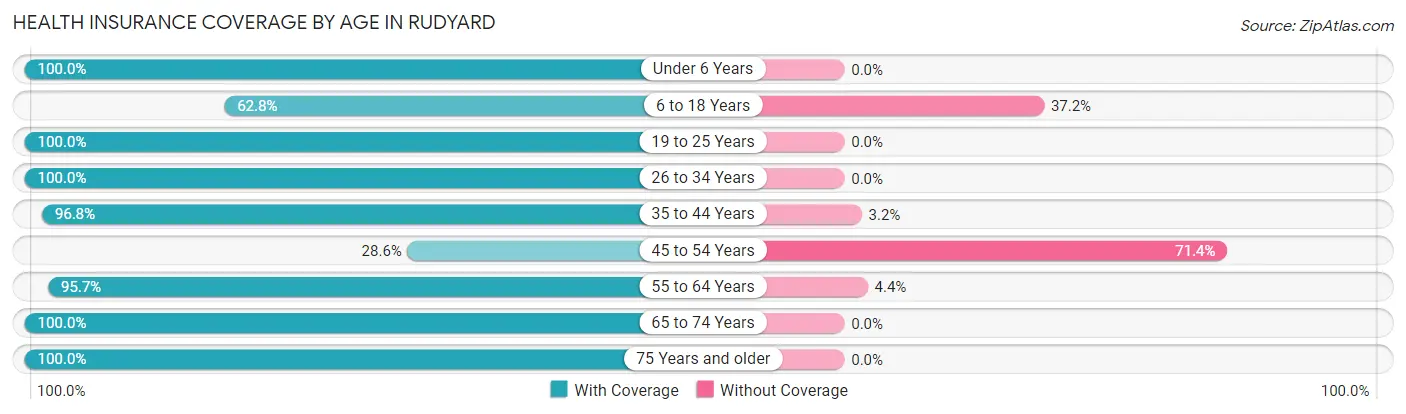
| Age Bracket | With Coverage | Without Coverage |
| Under 6 Years | 25 (100.0%) | 0 (0.0%) |
| 6 to 18 Years | 86 (62.8%) | 51 (37.2%) |
| 19 to 25 Years | 18 (100.0%) | 0 (0.0%) |
| 26 to 34 Years | 24 (100.0%) | 0 (0.0%) |
| 35 to 44 Years | 60 (96.8%) | 2 (3.2%) |
| 45 to 54 Years | 10 (28.6%) | 25 (71.4%) |
| 55 to 64 Years | 44 (95.7%) | 2 (4.3%) |
| 65 to 74 Years | 9 (100.0%) | 0 (0.0%) |
| 75 Years and older | 17 (100.0%) | 0 (0.0%) |
| Total | 293 (78.5%) | 80 (21.4%) |
Health Insurance Coverage by Citizenship Status in Rudyard
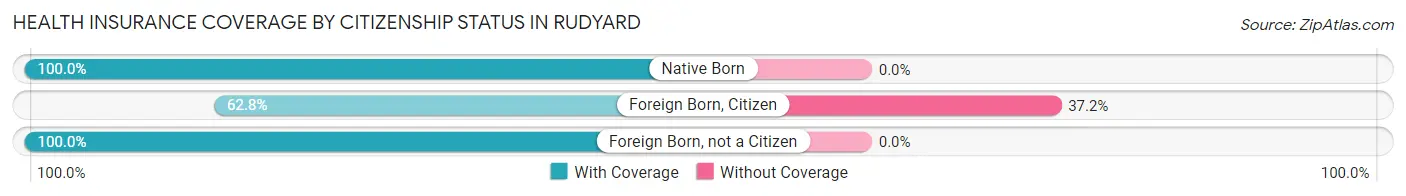
| Citizenship Status | With Coverage | Without Coverage |
| Native Born | 25 (100.0%) | 0 (0.0%) |
| Foreign Born, Citizen | 86 (62.8%) | 51 (37.2%) |
| Foreign Born, not a Citizen | 18 (100.0%) | 0 (0.0%) |
Health Insurance Coverage by Household Income in Rudyard
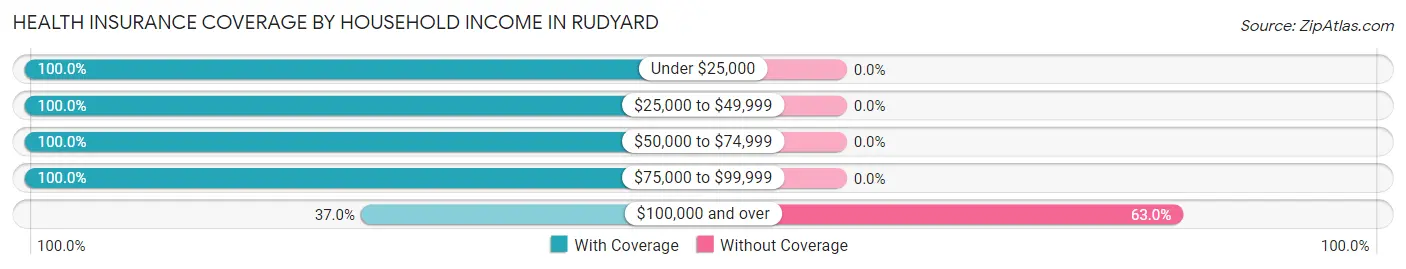
| Household Income | With Coverage | Without Coverage |
| Under $25,000 | 7 (100.0%) | 0 (0.0%) |
| $25,000 to $49,999 | 39 (100.0%) | 0 (0.0%) |
| $50,000 to $74,999 | 117 (100.0%) | 0 (0.0%) |
| $75,000 to $99,999 | 83 (100.0%) | 0 (0.0%) |
| $100,000 and over | 47 (37.0%) | 80 (63.0%) |
Public vs Private Health Insurance Coverage by Age in Rudyard
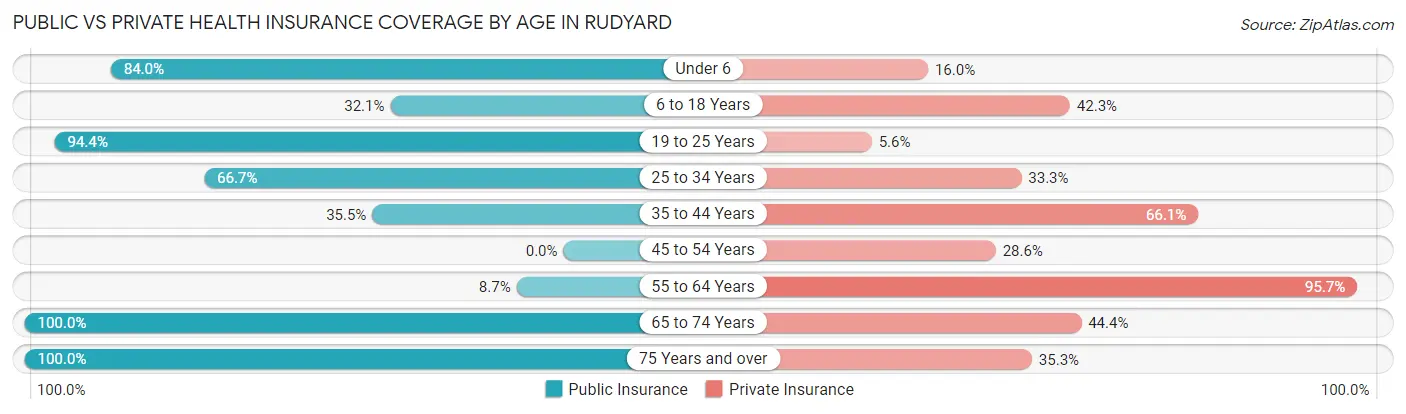
| Age Bracket | Public Insurance | Private Insurance |
| Under 6 | 21 (84.0%) | 4 (16.0%) |
| 6 to 18 Years | 44 (32.1%) | 58 (42.3%) |
| 19 to 25 Years | 17 (94.4%) | 1 (5.6%) |
| 25 to 34 Years | 16 (66.7%) | 8 (33.3%) |
| 35 to 44 Years | 22 (35.5%) | 41 (66.1%) |
| 45 to 54 Years | 0 (0.0%) | 10 (28.6%) |
| 55 to 64 Years | 4 (8.7%) | 44 (95.7%) |
| 65 to 74 Years | 9 (100.0%) | 4 (44.4%) |
| 75 Years and over | 17 (100.0%) | 6 (35.3%) |
| Total | 150 (40.2%) | 176 (47.2%) |
Disability Status by Sex by Age in Rudyard
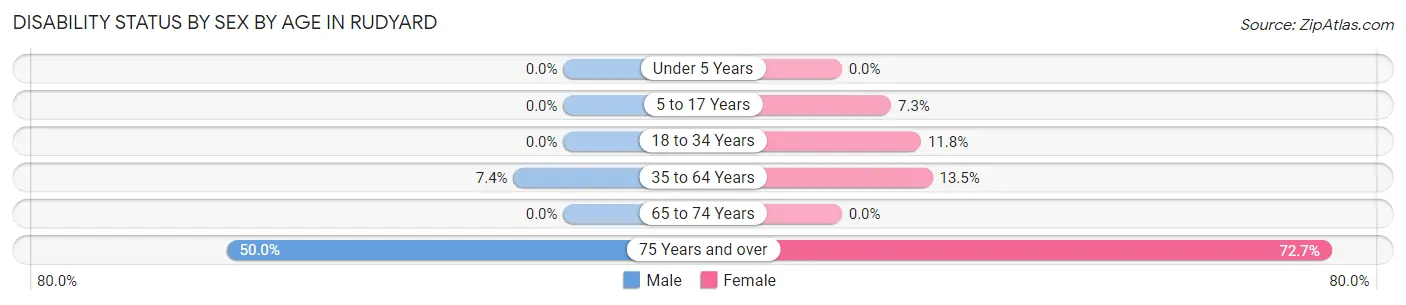
| Age Bracket | Male | Female |
| Under 5 Years | 0 (0.0%) | 0 (0.0%) |
| 5 to 17 Years | 0 (0.0%) | 3 (7.3%) |
| 18 to 34 Years | 0 (0.0%) | 2 (11.8%) |
| 35 to 64 Years | 4 (7.4%) | 12 (13.5%) |
| 65 to 74 Years | 0 (0.0%) | 0 (0.0%) |
| 75 Years and over | 3 (50.0%) | 8 (72.7%) |
Disability Class by Sex by Age in Rudyard
Disability Class: Hearing Difficulty
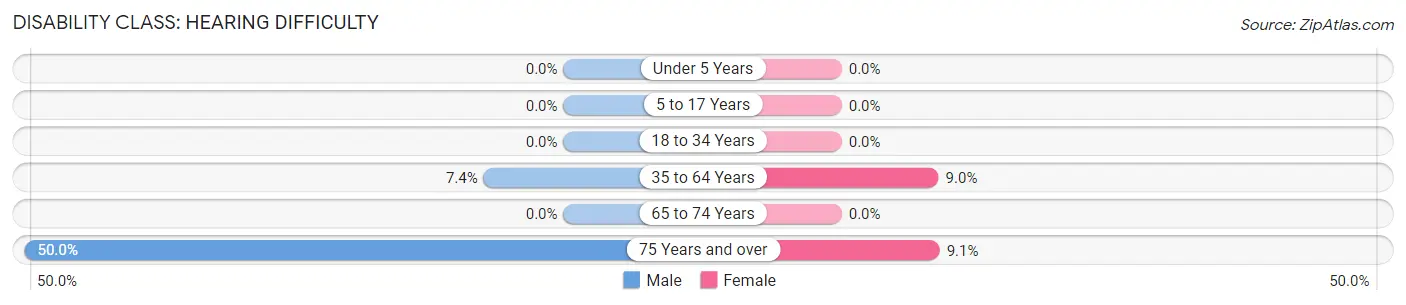
| Age Bracket | Male | Female |
| Under 5 Years | 0 (0.0%) | 0 (0.0%) |
| 5 to 17 Years | 0 (0.0%) | 0 (0.0%) |
| 18 to 34 Years | 0 (0.0%) | 0 (0.0%) |
| 35 to 64 Years | 4 (7.4%) | 8 (9.0%) |
| 65 to 74 Years | 0 (0.0%) | 0 (0.0%) |
| 75 Years and over | 3 (50.0%) | 1 (9.1%) |
Disability Class: Vision Difficulty
| Age Bracket | Male | Female |
| Under 5 Years | 0 (0.0%) | 0 (0.0%) |
| 5 to 17 Years | 0 (0.0%) | 0 (0.0%) |
| 18 to 34 Years | 0 (0.0%) | 0 (0.0%) |
| 35 to 64 Years | 0 (0.0%) | 0 (0.0%) |
| 65 to 74 Years | 0 (0.0%) | 0 (0.0%) |
| 75 Years and over | 0 (0.0%) | 0 (0.0%) |
Disability Class: Cognitive Difficulty
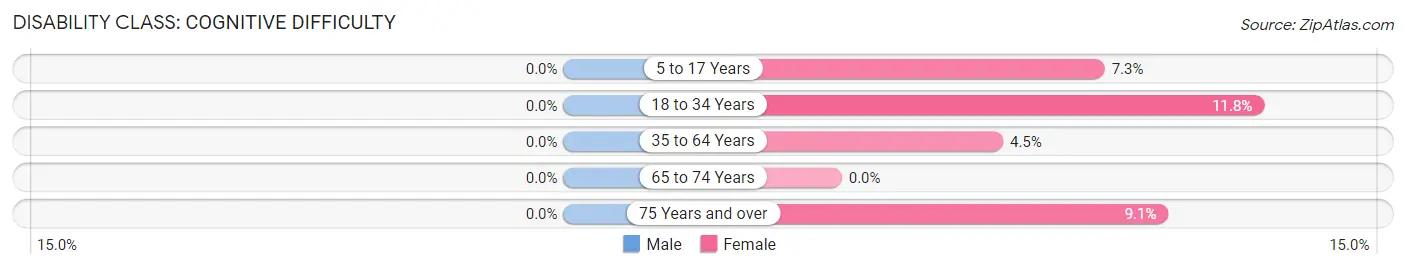
| Age Bracket | Male | Female |
| 5 to 17 Years | 0 (0.0%) | 3 (7.3%) |
| 18 to 34 Years | 0 (0.0%) | 2 (11.8%) |
| 35 to 64 Years | 0 (0.0%) | 4 (4.5%) |
| 65 to 74 Years | 0 (0.0%) | 0 (0.0%) |
| 75 Years and over | 0 (0.0%) | 1 (9.1%) |
Disability Class: Ambulatory Difficulty
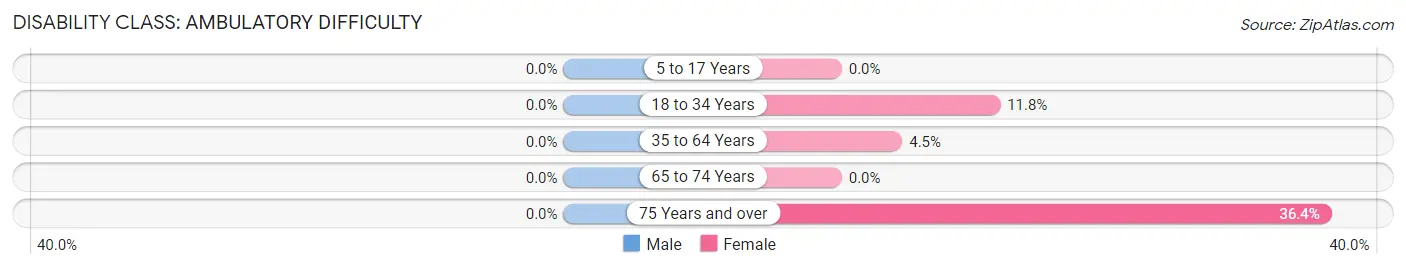
| Age Bracket | Male | Female |
| 5 to 17 Years | 0 (0.0%) | 0 (0.0%) |
| 18 to 34 Years | 0 (0.0%) | 2 (11.8%) |
| 35 to 64 Years | 0 (0.0%) | 4 (4.5%) |
| 65 to 74 Years | 0 (0.0%) | 0 (0.0%) |
| 75 Years and over | 0 (0.0%) | 4 (36.4%) |
Disability Class: Self-Care Difficulty
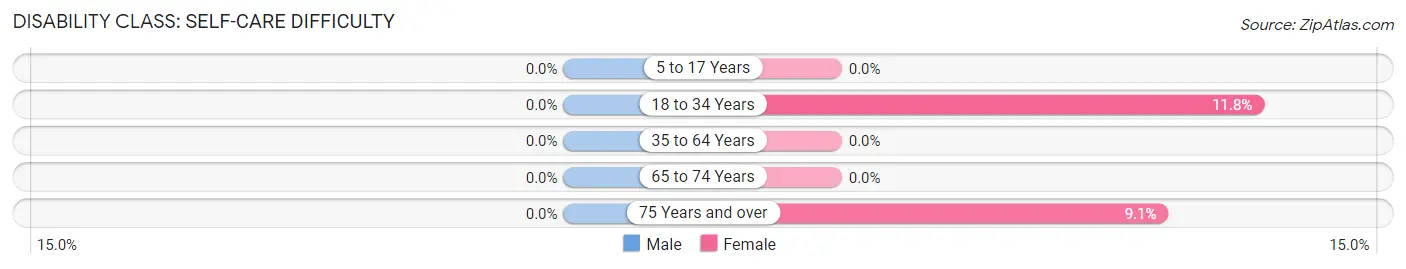
| Age Bracket | Male | Female |
| 5 to 17 Years | 0 (0.0%) | 0 (0.0%) |
| 18 to 34 Years | 0 (0.0%) | 2 (11.8%) |
| 35 to 64 Years | 0 (0.0%) | 0 (0.0%) |
| 65 to 74 Years | 0 (0.0%) | 0 (0.0%) |
| 75 Years and over | 0 (0.0%) | 1 (9.1%) |
Technology Access in Rudyard
Computing Device Access in Rudyard
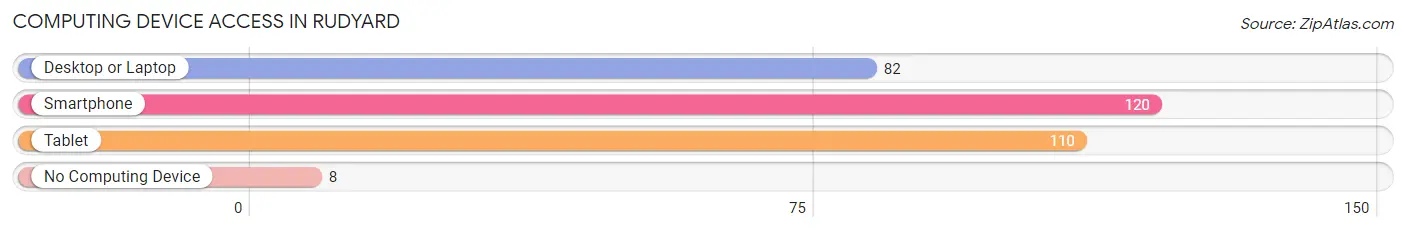
| Device Type | # Households | % Households |
| Desktop or Laptop | 82 | 62.6% |
| Smartphone | 120 | 91.6% |
| Tablet | 110 | 84.0% |
| No Computing Device | 8 | 6.1% |
| Total | 131 | 100.0% |
Internet Access in Rudyard
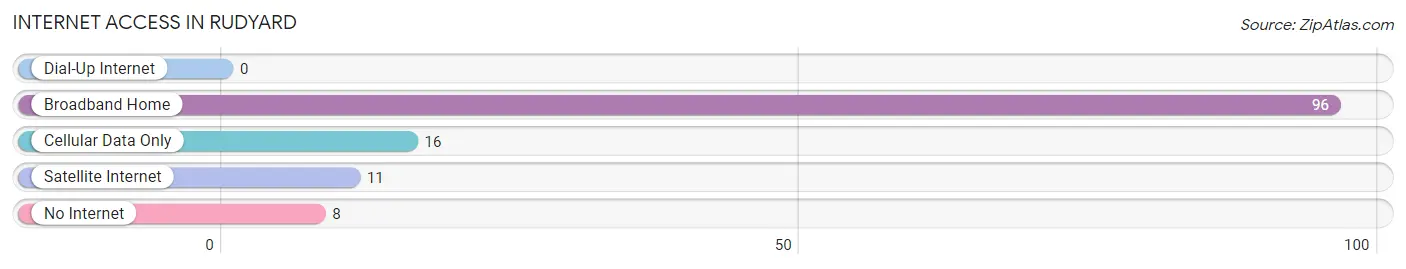
| Internet Type | # Households | % Households |
| Dial-Up Internet | 0 | 0.0% |
| Broadband Home | 96 | 73.3% |
| Cellular Data Only | 16 | 12.2% |
| Satellite Internet | 11 | 8.4% |
| No Internet | 8 | 6.1% |
| Total | 131 | 100.0% |
Rudyard Summary
Rudyard, Montana is a small town located in Hill County, in the north-central part of the state. It is situated on the banks of the Milk River, and is surrounded by rolling hills and prairies. The town was founded in 1887, and was named after Rudyard Kipling, the famous English author.
Rudyard is located in an area of Montana known as the Hi-Line, which is a region of the state that is known for its agricultural production. The town is home to a variety of businesses, including a grain elevator, a lumber yard, a feed store, and a variety of other small businesses. The town also has a post office, a library, and a museum.
The population of Rudyard was estimated to be 545 in 2000, with a median age of 37. The population is predominantly white, with a small percentage of Native Americans and African Americans. The median household income in 2000 was $30,000, and the median home value was $50,000.
Rudyard is located in an area of Montana that is known for its agricultural production. The town is home to a variety of farms, including wheat, barley, and hay farms. The town is also home to a variety of livestock, including cattle, sheep, and horses. The town is also home to a variety of small businesses, including a grain elevator, a lumber yard, a feed store, and a variety of other small businesses.
The economy of Rudyard is largely based on agriculture and small businesses. The town is home to a variety of small businesses, including a grain elevator, a lumber yard, a feed store, and a variety of other small businesses. The town is also home to a variety of farms, including wheat, barley, and hay farms. The town is also home to a variety of livestock, including cattle, sheep, and horses.
Rudyard is a small town with a rich history and a vibrant economy. The town is home to a variety of businesses, including a grain elevator, a lumber yard, a feed store, and a variety of other small businesses. The town is also home to a variety of farms, including wheat, barley, and hay farms. The town is also home to a variety of livestock, including cattle, sheep, and horses. The town is also home to a variety of small businesses, including a grain elevator, a lumber yard, a feed store, and a variety of other small businesses. The town is also home to a variety of cultural and recreational activities, including a museum, a library, and a variety of parks and trails. The town is also home to a variety of churches, including the First Presbyterian Church, the First Baptist Church, and the First Methodist Church.
Common Questions
What is Per Capita Income in Rudyard?
Per Capita income in Rudyard is $26,458.
What is the Median Family Income in Rudyard?
Median Family Income in Rudyard is $67,813.
What is the Median Household income in Rudyard?
Median Household Income in Rudyard is $69,750.
What is Income or Wage Gap in Rudyard?
Income or Wage Gap in Rudyard is 45.3%.
Women in Rudyard earn 54.7 cents for every dollar earned by a man.
What is Inequality or Gini Index in Rudyard?
Inequality or Gini Index in Rudyard is 0.31.
What is the Total Population of Rudyard?
Total Population of Rudyard is 373.
What is the Total Male Population of Rudyard?
Total Male Population of Rudyard is 206.
What is the Total Female Population of Rudyard?
Total Female Population of Rudyard is 167.
What is the Ratio of Males per 100 Females in Rudyard?
There are 123.35 Males per 100 Females in Rudyard.
What is the Ratio of Females per 100 Males in Rudyard?
There are 81.07 Females per 100 Males in Rudyard.
What is the Median Population Age in Rudyard?
Median Population Age in Rudyard is 29.8 Years.
What is the Average Family Size in Rudyard
Average Family Size in Rudyard is 3.6 People.
What is the Average Household Size in Rudyard
Average Household Size in Rudyard is 2.9 People.
How Large is the Labor Force in Rudyard?
There are 176 People in the Labor Forcein in Rudyard.
What is the Percentage of People in the Labor Force in Rudyard?
72.7% of People are in the Labor Force in Rudyard.