Zip Codes with the Highest Percentage of Population Employed in Food Preparation & Serving in Montana
RELATED REPORTS & OPTIONS
Food Preparation & Serving
Montana
Compare Zip Codes
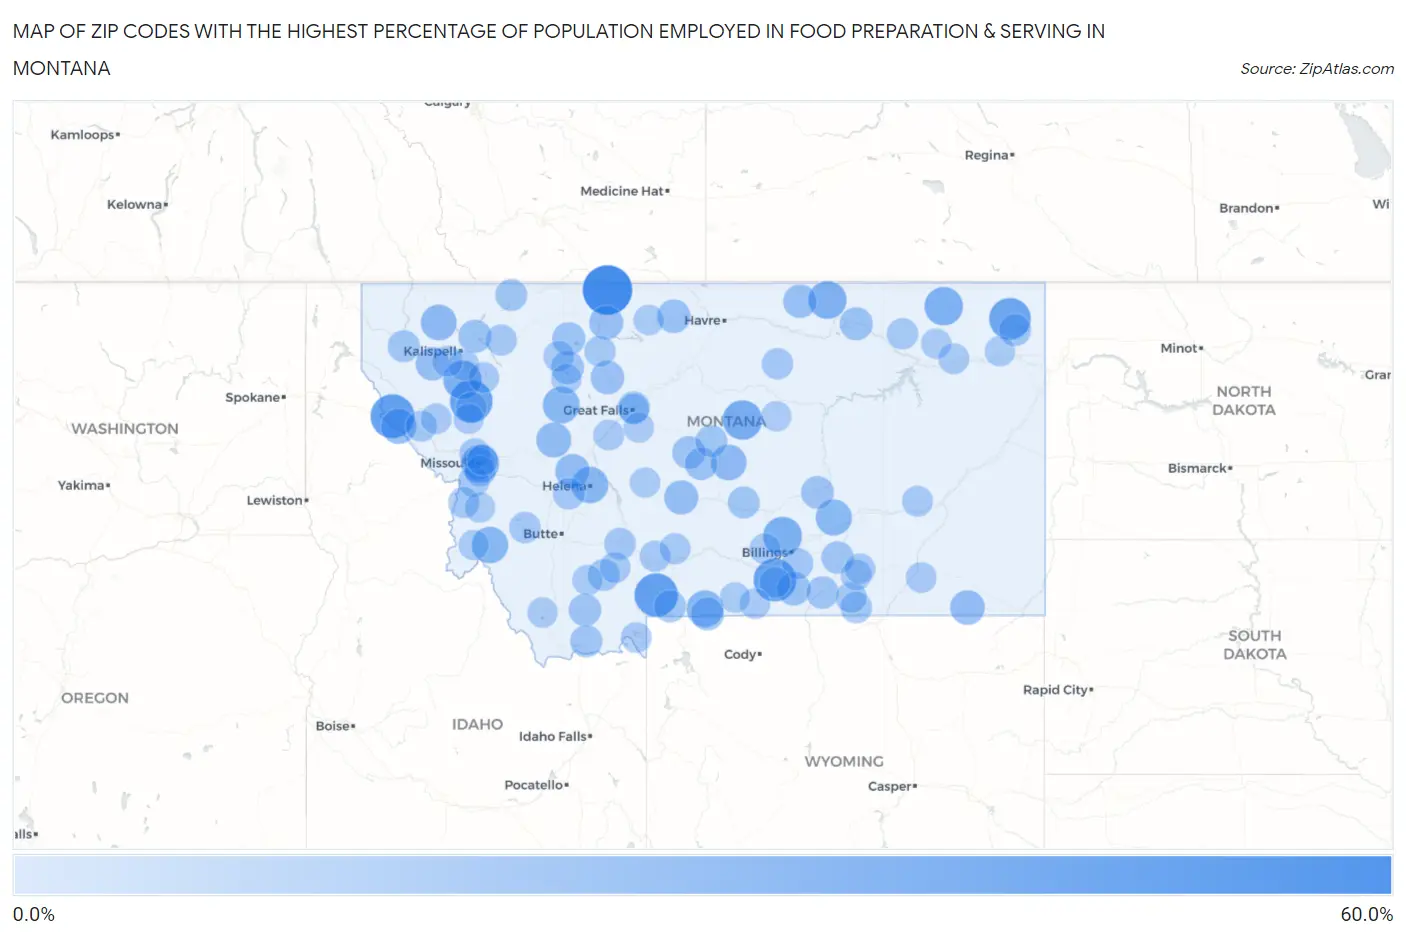
Map of Zip Codes with the Highest Percentage of Population Employed in Food Preparation & Serving in Montana
0.0%
60.0%
Zip Codes with the Highest Percentage of Population Employed in Food Preparation & Serving in Montana
| Zip Code | % Employed | vs State | vs National | |
| 1. | 59484 | 53.3% | 6.7%(+46.6)#1 | 5.3%(+48.0)#45 |
| 2. | 59830 | 39.3% | 6.7%(+32.6)#2 | 5.3%(+34.0)#109 |
| 3. | 59027 | 38.4% | 6.7%(+31.7)#3 | 5.3%(+33.1)#112 |
| 4. | 59026 | 37.0% | 6.7%(+30.2)#4 | 5.3%(+31.7)#131 |
| 5. | 59855 | 36.4% | 6.7%(+29.6)#5 | 5.3%(+31.1)#133 |
| 6. | 59258 | 34.1% | 6.7%(+27.4)#6 | 5.3%(+28.9)#162 |
| 7. | 59451 | 28.9% | 6.7%(+22.2)#7 | 5.3%(+23.7)#233 |
| 8. | 59002 | 27.5% | 6.7%(+20.8)#8 | 5.3%(+22.2)#253 |
| 9. | 59914 | 26.5% | 6.7%(+19.7)#9 | 5.3%(+21.2)#273 |
| 10. | 59253 | 26.3% | 6.7%(+19.6)#10 | 5.3%(+21.0)#277 |
| 11. | 59537 | 25.4% | 6.7%(+18.7)#11 | 5.3%(+20.1)#302 |
| 12. | 59812 | 25.3% | 6.7%(+18.6)#12 | 5.3%(+20.0)#304 |
| 13. | 59410 | 22.5% | 6.7%(+15.8)#13 | 5.3%(+17.2)#402 |
| 14. | 59020 | 22.4% | 6.7%(+15.7)#14 | 5.3%(+17.2)#406 |
| 15. | 59625 | 21.8% | 6.7%(+15.1)#15 | 5.3%(+16.5)#426 |
| 16. | 59871 | 21.7% | 6.7%(+15.0)#16 | 5.3%(+16.4)#431 |
| 17. | 59024 | 20.7% | 6.7%(+14.0)#17 | 5.3%(+15.4)#469 |
| 18. | 59927 | 19.9% | 6.7%(+13.2)#18 | 5.3%(+14.6)#512 |
| 19. | 59464 | 19.7% | 6.7%(+12.9)#19 | 5.3%(+14.4)#526 |
| 20. | 59842 | 19.1% | 6.7%(+12.4)#20 | 5.3%(+13.8)#557 |
| 21. | 59639 | 18.3% | 6.7%(+11.5)#21 | 5.3%(+13.0)#631 |
| 22. | 59314 | 17.1% | 6.7%(+10.4)#22 | 5.3%(+11.8)#737 |
| 23. | 59640 | 17.1% | 6.7%(+10.4)#23 | 5.3%(+11.8)#738 |
| 24. | 59053 | 16.1% | 6.7%(+9.34)#24 | 5.3%(+10.8)#859 |
| 25. | 59474 | 15.5% | 6.7%(+8.82)#25 | 5.3%(+10.3)#912 |
| 26. | 59925 | 15.2% | 6.7%(+8.44)#26 | 5.3%(+9.88)#960 |
| 27. | 59433 | 14.9% | 6.7%(+8.16)#27 | 5.3%(+9.60)#998 |
| 28. | 59066 | 14.8% | 6.7%(+8.06)#28 | 5.3%(+9.50)#1,010 |
| 29. | 59542 | 14.7% | 6.7%(+7.98)#29 | 5.3%(+9.42)#1,028 |
| 30. | 59540 | 14.7% | 6.7%(+7.96)#30 | 5.3%(+9.40)#1,035 |
| 31. | 59486 | 13.9% | 6.7%(+7.22)#31 | 5.3%(+8.66)#1,174 |
| 32. | 59261 | 13.7% | 6.7%(+7.02)#32 | 5.3%(+8.45)#1,223 |
| 33. | 59081 | 13.7% | 6.7%(+7.00)#33 | 5.3%(+8.44)#1,227 |
| 34. | 59419 | 13.6% | 6.7%(+6.92)#34 | 5.3%(+8.35)#1,248 |
| 35. | 59919 | 13.5% | 6.7%(+6.82)#35 | 5.3%(+8.25)#1,267 |
| 36. | 59479 | 13.2% | 6.7%(+6.45)#36 | 5.3%(+7.89)#1,345 |
| 37. | 59059 | 13.1% | 6.7%(+6.39)#37 | 5.3%(+7.83)#1,368 |
| 38. | 59452 | 12.7% | 6.7%(+5.93)#38 | 5.3%(+7.37)#1,482 |
| 39. | 59710 | 12.4% | 6.7%(+5.67)#39 | 5.3%(+7.10)#1,544 |
| 40. | 59801 | 12.3% | 6.7%(+5.55)#40 | 5.3%(+6.98)#1,576 |
| 41. | 59035 | 12.2% | 6.7%(+5.52)#41 | 5.3%(+6.96)#1,583 |
| 42. | 59034 | 12.1% | 6.7%(+5.41)#42 | 5.3%(+6.84)#1,620 |
| 43. | 59414 | 11.9% | 6.7%(+5.22)#43 | 5.3%(+6.66)#1,687 |
| 44. | 59739 | 11.7% | 6.7%(+4.93)#44 | 5.3%(+6.36)#1,793 |
| 45. | 59030 | 11.4% | 6.7%(+4.72)#45 | 5.3%(+6.16)#1,860 |
| 46. | 59923 | 11.2% | 6.7%(+4.52)#46 | 5.3%(+5.95)#1,942 |
| 47. | 59462 | 11.1% | 6.7%(+4.39)#47 | 5.3%(+5.83)#2,003 |
| 48. | 59242 | 11.1% | 6.7%(+4.39)#48 | 5.3%(+5.83)#2,006 |
| 49. | 59074 | 11.0% | 6.7%(+4.26)#49 | 5.3%(+5.70)#2,064 |
| 50. | 59411 | 10.9% | 6.7%(+4.17)#50 | 5.3%(+5.61)#2,106 |
| 51. | 59740 | 10.8% | 6.7%(+4.10)#51 | 5.3%(+5.54)#2,145 |
| 52. | 59728 | 10.4% | 6.7%(+3.67)#52 | 5.3%(+5.11)#2,375 |
| 53. | 59752 | 10.4% | 6.7%(+3.66)#53 | 5.3%(+5.10)#2,384 |
| 54. | 59089 | 10.0% | 6.7%(+3.28)#54 | 5.3%(+4.71)#2,633 |
| 55. | 59101 | 9.8% | 6.7%(+3.12)#55 | 5.3%(+4.56)#2,758 |
| 56. | 59711 | 9.8% | 6.7%(+3.09)#56 | 5.3%(+4.52)#2,792 |
| 57. | 59527 | 9.7% | 6.7%(+2.93)#57 | 5.3%(+4.37)#2,926 |
| 58. | 59916 | 9.4% | 6.7%(+2.71)#58 | 5.3%(+4.15)#3,108 |
| 59. | 59231 | 9.4% | 6.7%(+2.69)#59 | 5.3%(+4.13)#3,128 |
| 60. | 59833 | 9.4% | 6.7%(+2.67)#60 | 5.3%(+4.11)#3,147 |
| 61. | 59875 | 9.2% | 6.7%(+2.51)#61 | 5.3%(+3.94)#3,293 |
| 62. | 59050 | 9.1% | 6.7%(+2.37)#62 | 5.3%(+3.80)#3,424 |
| 63. | 59715 | 9.0% | 6.7%(+2.32)#63 | 5.3%(+3.75)#3,487 |
| 64. | 59808 | 9.0% | 6.7%(+2.27)#64 | 5.3%(+3.71)#3,537 |
| 65. | 59866 | 9.0% | 6.7%(+2.24)#65 | 5.3%(+3.68)#3,560 |
| 66. | 59803 | 8.9% | 6.7%(+2.21)#66 | 5.3%(+3.65)#3,588 |
| 67. | 59425 | 8.9% | 6.7%(+2.19)#67 | 5.3%(+3.62)#3,609 |
| 68. | 59018 | 8.9% | 6.7%(+2.18)#68 | 5.3%(+3.62)#3,617 |
| 69. | 59802 | 8.9% | 6.7%(+2.16)#69 | 5.3%(+3.59)#3,638 |
| 70. | 59029 | 8.8% | 6.7%(+2.04)#70 | 5.3%(+3.48)#3,771 |
| 71. | 59745 | 8.7% | 6.7%(+1.97)#71 | 5.3%(+3.41)#3,856 |
| 72. | 59864 | 8.7% | 6.7%(+1.94)#72 | 5.3%(+3.38)#3,902 |
| 73. | 59057 | 8.6% | 6.7%(+1.91)#73 | 5.3%(+3.34)#3,928 |
| 74. | 59031 | 8.6% | 6.7%(+1.90)#74 | 5.3%(+3.33)#3,937 |
| 75. | 59347 | 8.6% | 6.7%(+1.88)#75 | 5.3%(+3.32)#3,964 |
| 76. | 59201 | 8.5% | 6.7%(+1.75)#76 | 5.3%(+3.19)#4,100 |
| 77. | 59432 | 8.5% | 6.7%(+1.73)#77 | 5.3%(+3.16)#4,116 |
| 78. | 59932 | 8.4% | 6.7%(+1.73)#78 | 5.3%(+3.16)#4,118 |
| 79. | 59421 | 8.4% | 6.7%(+1.69)#79 | 5.3%(+3.13)#4,156 |
| 80. | 59920 | 8.4% | 6.7%(+1.64)#80 | 5.3%(+3.07)#4,230 |
| 81. | 59856 | 8.3% | 6.7%(+1.61)#81 | 5.3%(+3.05)#4,267 |
| 82. | 59758 | 8.1% | 6.7%(+1.35)#82 | 5.3%(+2.79)#4,623 |
| 83. | 59003 | 8.0% | 6.7%(+1.31)#83 | 5.3%(+2.74)#4,687 |
| 84. | 59911 | 8.0% | 6.7%(+1.25)#84 | 5.3%(+2.69)#4,769 |
| 85. | 59022 | 8.0% | 6.7%(+1.24)#85 | 5.3%(+2.67)#4,787 |
| 86. | 59007 | 7.9% | 6.7%(+1.20)#86 | 5.3%(+2.63)#4,854 |
| 87. | 59401 | 7.9% | 6.7%(+1.19)#87 | 5.3%(+2.63)#4,866 |
| 88. | 59522 | 7.7% | 6.7%(+1.00)#88 | 5.3%(+2.44)#5,180 |
| 89. | 59749 | 7.6% | 6.7%(+0.881)#89 | 5.3%(+2.32)#5,377 |
| 90. | 59828 | 7.6% | 6.7%(+0.879)#90 | 5.3%(+2.31)#5,379 |
| 91. | 59213 | 7.6% | 6.7%(+0.842)#91 | 5.3%(+2.28)#5,444 |
| 92. | 59471 | 7.6% | 6.7%(+0.834)#92 | 5.3%(+2.27)#5,456 |
| 93. | 59725 | 7.5% | 6.7%(+0.805)#93 | 5.3%(+2.24)#5,505 |
| 94. | 59824 | 7.5% | 6.7%(+0.759)#94 | 5.3%(+2.19)#5,593 |
| 95. | 59645 | 7.4% | 6.7%(+0.703)#95 | 5.3%(+2.14)#5,700 |
| 96. | 59422 | 7.4% | 6.7%(+0.689)#96 | 5.3%(+2.12)#5,724 |
| 97. | 59225 | 7.4% | 6.7%(+0.686)#97 | 5.3%(+2.12)#5,734 |
| 98. | 59068 | 7.3% | 6.7%(+0.622)#98 | 5.3%(+2.06)#5,858 |
| 99. | 59405 | 7.3% | 6.7%(+0.598)#99 | 5.3%(+2.03)#5,888 |
| 100. | 59827 | 7.3% | 6.7%(+0.596)#100 | 5.3%(+2.03)#5,893 |
Common Questions
What are the Top 10 Zip Codes with the Highest Percentage of Population Employed in Food Preparation & Serving in Montana?
Top 10 Zip Codes with the Highest Percentage of Population Employed in Food Preparation & Serving in Montana are:
What zip code has the Highest Percentage of Population Employed in Food Preparation & Serving in Montana?
59484 has the Highest Percentage of Population Employed in Food Preparation & Serving in Montana with 53.3%.
What is the Percentage of Population Employed in Food Preparation & Serving in the State of Montana?
Percentage of Population Employed in Food Preparation & Serving in Montana is 6.7%.
What is the Percentage of Population Employed in Food Preparation & Serving in the United States?
Percentage of Population Employed in Food Preparation & Serving in the United States is 5.3%.