Wheatland, MT Map & Demographics
Wheatland Map
Wheatland Overview
$45,039
PER CAPITA INCOME
$91,731
AVG FAMILY INCOME
$105,500
AVG HOUSEHOLD INCOME
53.3%
WAGE / INCOME GAP [ % ]
46.7¢/ $1
WAGE / INCOME GAP [ $ ]
0.37
INEQUALITY / GINI INDEX
1,017
TOTAL POPULATION
454
MALE POPULATION
563
FEMALE POPULATION
80.64
MALES / 100 FEMALES
124.01
FEMALES / 100 MALES
44.2
MEDIAN AGE
3.0
AVG FAMILY SIZE
3.1
AVG HOUSEHOLD SIZE
618
LABOR FORCE [ PEOPLE ]
71.1%
PERCENT IN LABOR FORCE
Income in Wheatland
Income Overview in Wheatland
Per Capita Income in Wheatland is $45,039, while median incomes of families and households are $91,731 and $105,500 respectively.
| Characteristic | Number | Measure |
| Per Capita Income | 1,017 | $45,039 |
| Median Family Income | 302 | $91,731 |
| Mean Family Income | 302 | $108,796 |
| Median Household Income | 326 | $105,500 |
| Mean Household Income | 326 | $115,619 |
| Income Deficit | 302 | $0 |
| Wage / Income Gap (%) | 1,017 | 53.32% |
| Wage / Income Gap ($) | 1,017 | 46.68¢ per $1 |
| Gini / Inequality Index | 1,017 | 0.37 |
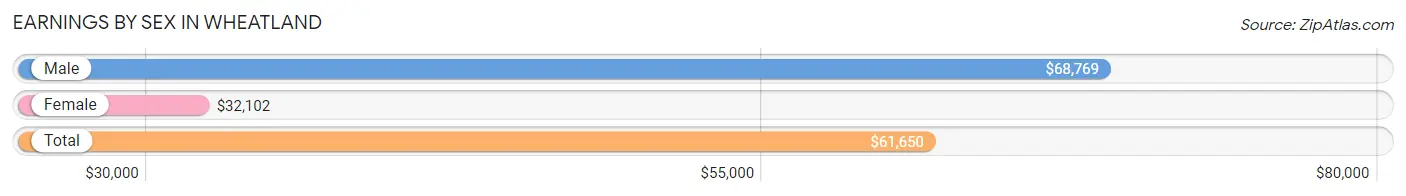
Earnings by Sex in Wheatland
Average Earnings in Wheatland are $61,650, $68,769 for men and $32,102 for women, a difference of 53.3%.
| Sex | Number | Average Earnings |
| Male | 404 (60.6%) | $68,769 |
| Female | 263 (39.4%) | $32,102 |
| Total | 667 (100.0%) | $61,650 |
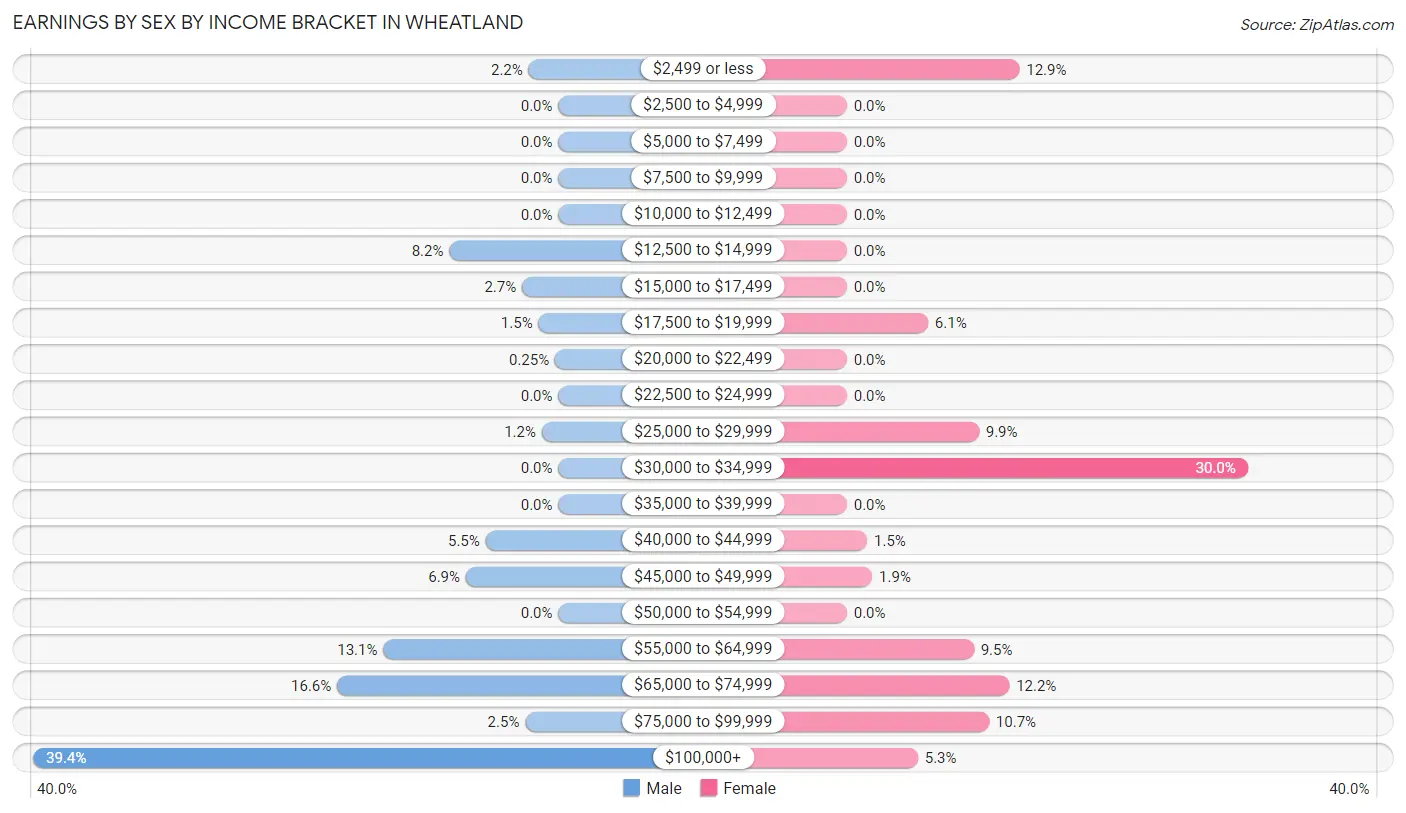
Earnings by Sex by Income Bracket in Wheatland
The most common earnings brackets in Wheatland are $100,000+ for men (159 | 39.4%) and $30,000 to $34,999 for women (79 | 30.0%).
| Income | Male | Female |
| $2,499 or less | 9 (2.2%) | 34 (12.9%) |
| $2,500 to $4,999 | 0 (0.0%) | 0 (0.0%) |
| $5,000 to $7,499 | 0 (0.0%) | 0 (0.0%) |
| $7,500 to $9,999 | 0 (0.0%) | 0 (0.0%) |
| $10,000 to $12,499 | 0 (0.0%) | 0 (0.0%) |
| $12,500 to $14,999 | 33 (8.2%) | 0 (0.0%) |
| $15,000 to $17,499 | 11 (2.7%) | 0 (0.0%) |
| $17,500 to $19,999 | 6 (1.5%) | 16 (6.1%) |
| $20,000 to $22,499 | 1 (0.3%) | 0 (0.0%) |
| $22,500 to $24,999 | 0 (0.0%) | 0 (0.0%) |
| $25,000 to $29,999 | 5 (1.2%) | 26 (9.9%) |
| $30,000 to $34,999 | 0 (0.0%) | 79 (30.0%) |
| $35,000 to $39,999 | 0 (0.0%) | 0 (0.0%) |
| $40,000 to $44,999 | 22 (5.4%) | 4 (1.5%) |
| $45,000 to $49,999 | 28 (6.9%) | 5 (1.9%) |
| $50,000 to $54,999 | 0 (0.0%) | 0 (0.0%) |
| $55,000 to $64,999 | 53 (13.1%) | 25 (9.5%) |
| $65,000 to $74,999 | 67 (16.6%) | 32 (12.2%) |
| $75,000 to $99,999 | 10 (2.5%) | 28 (10.6%) |
| $100,000+ | 159 (39.4%) | 14 (5.3%) |
| Total | 404 (100.0%) | 263 (100.0%) |
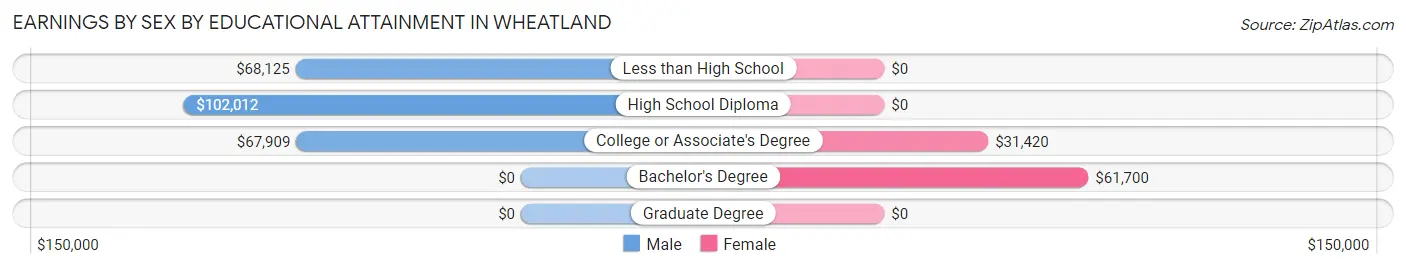
Earnings by Sex by Educational Attainment in Wheatland
Average earnings in Wheatland are $69,552 for men and $32,102 for women, a difference of 53.8%. Men with an educational attainment of high school diploma enjoy the highest average annual earnings of $102,012, while those with college or associate's degree education earn the least with $67,909. Women with an educational attainment of bachelor's degree earn the most with the average annual earnings of $61,700, while those with college or associate's degree education have the smallest earnings of $31,420.
| Educational Attainment | Male Income | Female Income |
| Less than High School | $68,125 | $0 |
| High School Diploma | $102,012 | $0 |
| College or Associate's Degree | $67,909 | $31,420 |
| Bachelor's Degree | - | - |
| Graduate Degree | - | - |
| Total | $69,552 | $32,102 |
Family Income in Wheatland
Family Income Brackets in Wheatland
According to the Wheatland family income data, there are 90 families falling into the $100,000 to $149,999 income range, which is the most common income bracket and makes up 29.8% of all families.
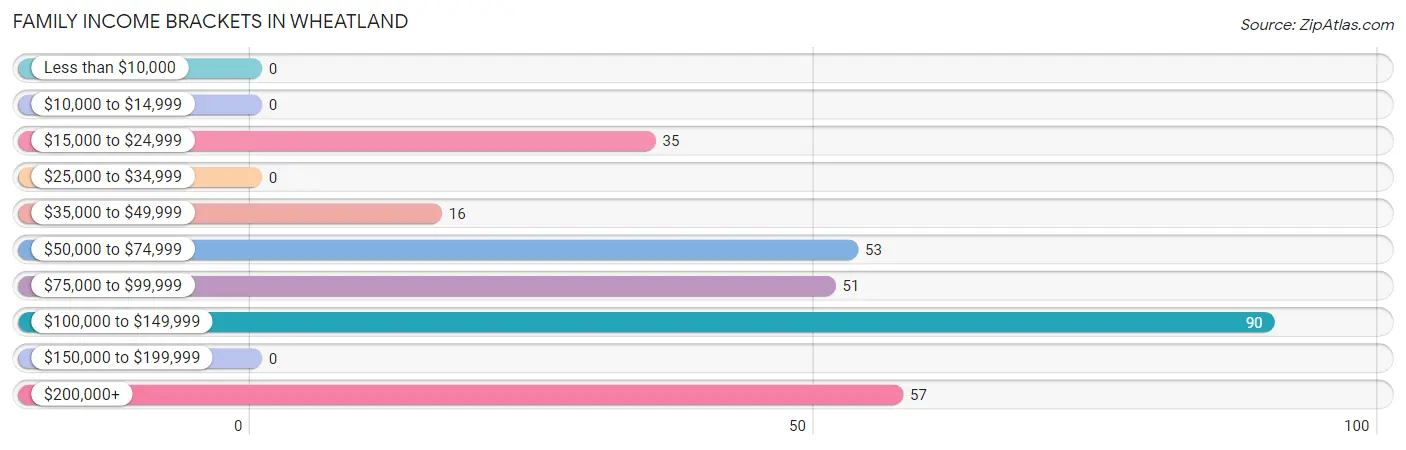
| Income Bracket | # Families | % Families |
| Less than $10,000 | 0 | 0.0% |
| $10,000 to $14,999 | 0 | 0.0% |
| $15,000 to $24,999 | 35 | 11.6% |
| $25,000 to $34,999 | 0 | 0.0% |
| $35,000 to $49,999 | 16 | 5.3% |
| $50,000 to $74,999 | 53 | 17.5% |
| $75,000 to $99,999 | 51 | 16.9% |
| $100,000 to $149,999 | 90 | 29.8% |
| $150,000 to $199,999 | 0 | 0.0% |
| $200,000+ | 57 | 18.9% |
Family Income by Famaliy Size in Wheatland
3-person families (64 | 21.2%) account for the highest median family income in Wheatland with $210,000 per family, while 3-person families (64 | 21.2%) have the highest median income of $70,000 per family member.
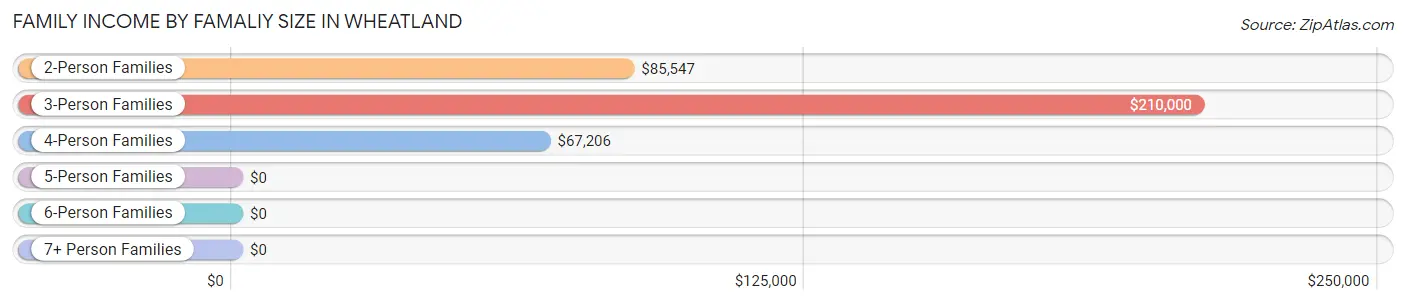
| Income Bracket | # Families | Median Income |
| 2-Person Families | 175 (58.0%) | $85,547 |
| 3-Person Families | 64 (21.2%) | $210,000 |
| 4-Person Families | 42 (13.9%) | $67,206 |
| 5-Person Families | 10 (3.3%) | $0 |
| 6-Person Families | 11 (3.6%) | $0 |
| 7+ Person Families | 0 (0.0%) | $0 |
| Total | 302 (100.0%) | $91,731 |
Family Income by Number of Earners in Wheatland
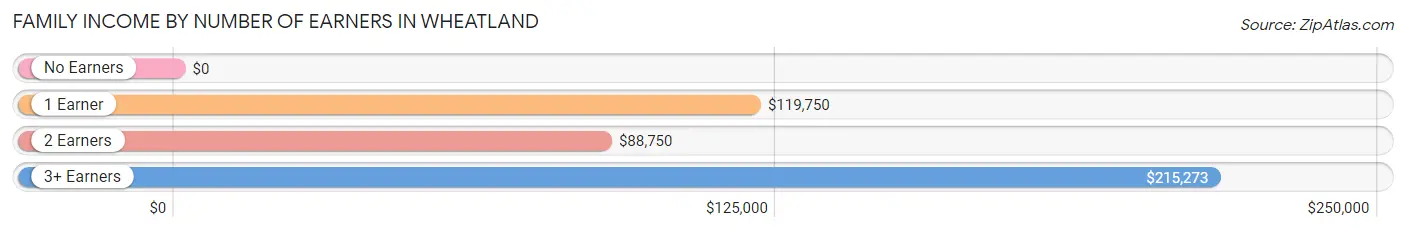
| Number of Earners | # Families | Median Income |
| No Earners | 45 (14.9%) | $0 |
| 1 Earner | 76 (25.2%) | $119,750 |
| 2 Earners | 124 (41.1%) | $88,750 |
| 3+ Earners | 57 (18.9%) | $215,273 |
| Total | 302 (100.0%) | $91,731 |
Household Income in Wheatland
Household Income Brackets in Wheatland
With 90 households falling in the category, the $100,000 to $149,999 income range is the most frequent in Wheatland, accounting for 27.6% of all households.
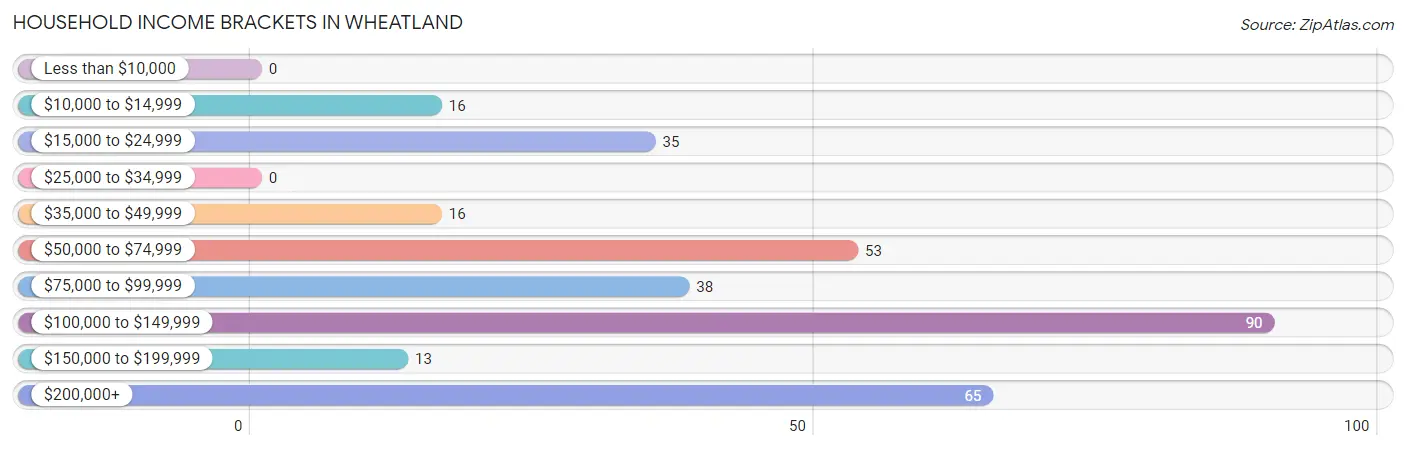
| Income Bracket | # Households | % Households |
| Less than $10,000 | 0 | 0.0% |
| $10,000 to $14,999 | 16 | 4.9% |
| $15,000 to $24,999 | 35 | 10.7% |
| $25,000 to $34,999 | 0 | 0.0% |
| $35,000 to $49,999 | 16 | 4.9% |
| $50,000 to $74,999 | 53 | 16.3% |
| $75,000 to $99,999 | 38 | 11.7% |
| $100,000 to $149,999 | 90 | 27.6% |
| $150,000 to $199,999 | 13 | 4.0% |
| $200,000+ | 65 | 19.9% |
Household Income by Householder Age in Wheatland
The median household income in Wheatland is $105,500, with the highest median household income of $141,453 found in the 45 to 64 years age bracket for the primary householder. A total of 161 households (49.4%) fall into this category.
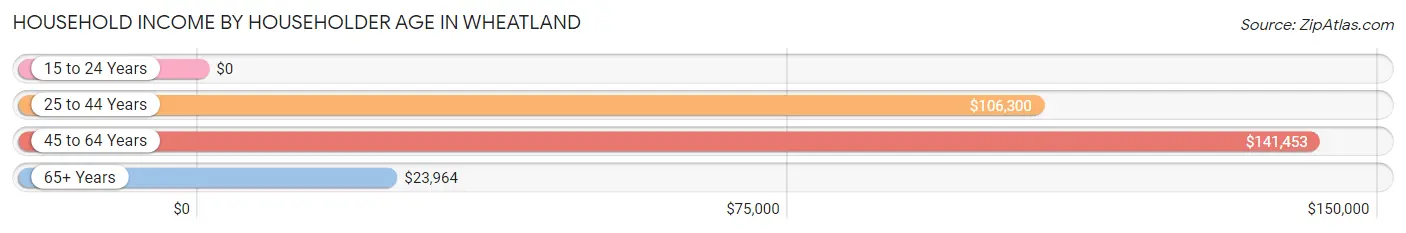
| Income Bracket | # Households | Median Income |
| 15 to 24 Years | 0 (0.0%) | $0 |
| 25 to 44 Years | 92 (28.2%) | $106,300 |
| 45 to 64 Years | 161 (49.4%) | $141,453 |
| 65+ Years | 73 (22.4%) | $23,964 |
| Total | 326 (100.0%) | $105,500 |
Poverty in Wheatland
Income Below Poverty by Sex and Age in Wheatland
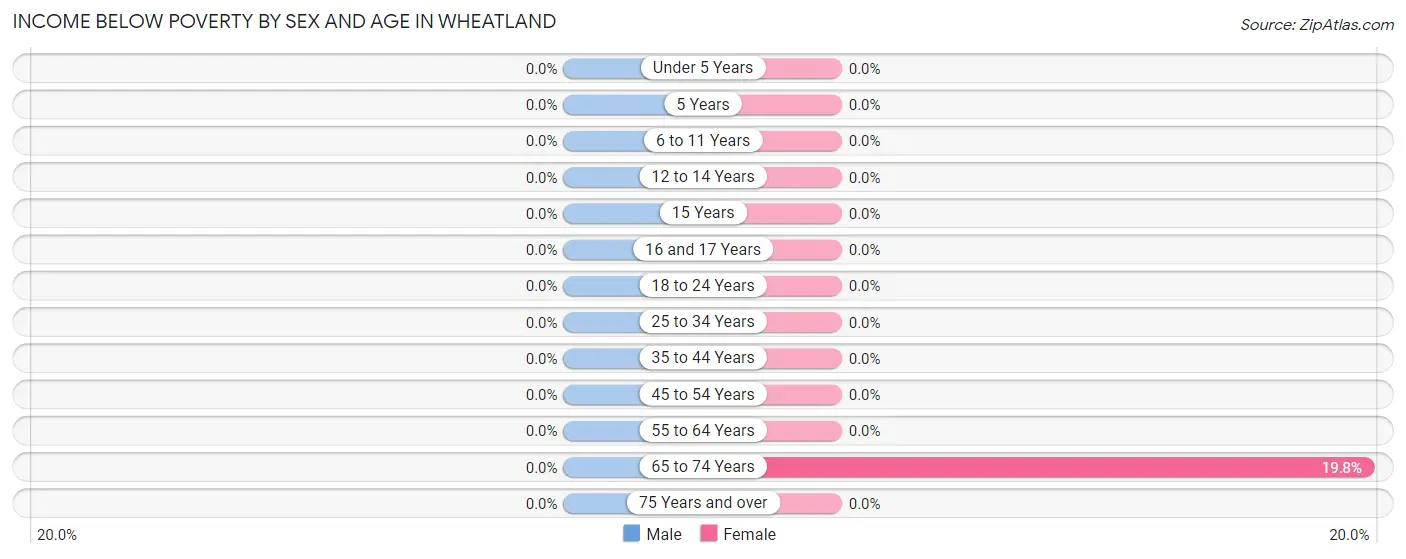
| Age Bracket | Male | Female |
| Under 5 Years | 0 (0.0%) | 0 (0.0%) |
| 5 Years | 0 (0.0%) | 0 (0.0%) |
| 6 to 11 Years | 0 (0.0%) | 0 (0.0%) |
| 12 to 14 Years | 0 (0.0%) | 0 (0.0%) |
| 15 Years | 0 (0.0%) | 0 (0.0%) |
| 16 and 17 Years | 0 (0.0%) | 0 (0.0%) |
| 18 to 24 Years | 0 (0.0%) | 0 (0.0%) |
| 25 to 34 Years | 0 (0.0%) | 0 (0.0%) |
| 35 to 44 Years | 0 (0.0%) | 0 (0.0%) |
| 45 to 54 Years | 0 (0.0%) | 0 (0.0%) |
| 55 to 64 Years | 0 (0.0%) | 0 (0.0%) |
| 65 to 74 Years | 0 (0.0%) | 16 (19.8%) |
| 75 Years and over | 0 (0.0%) | 0 (0.0%) |
| Total | 0 (0.0%) | 16 (2.8%) |
Income Above Poverty by Sex and Age in Wheatland
According to the poverty statistics in Wheatland, males aged under 5 years and females aged under 5 years are the age groups that are most secure financially, with 100.0% of males and 100.0% of females in these age groups living above the poverty line.
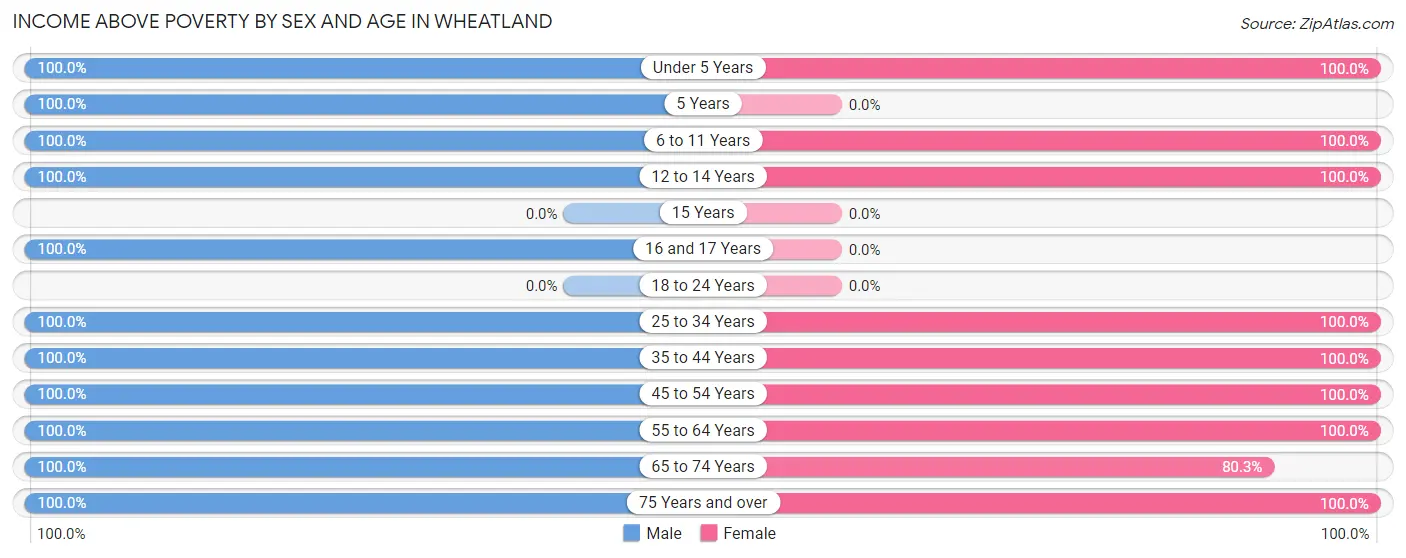
| Age Bracket | Male | Female |
| Under 5 Years | 8 (100.0%) | 55 (100.0%) |
| 5 Years | 10 (100.0%) | 0 (0.0%) |
| 6 to 11 Years | 12 (100.0%) | 48 (100.0%) |
| 12 to 14 Years | 10 (100.0%) | 5 (100.0%) |
| 15 Years | 0 (0.0%) | 0 (0.0%) |
| 16 and 17 Years | 42 (100.0%) | 0 (0.0%) |
| 18 to 24 Years | 0 (0.0%) | 0 (0.0%) |
| 25 to 34 Years | 96 (100.0%) | 115 (100.0%) |
| 35 to 44 Years | 35 (100.0%) | 95 (100.0%) |
| 45 to 54 Years | 96 (100.0%) | 106 (100.0%) |
| 55 to 64 Years | 83 (100.0%) | 46 (100.0%) |
| 65 to 74 Years | 52 (100.0%) | 65 (80.2%) |
| 75 Years and over | 10 (100.0%) | 12 (100.0%) |
| Total | 454 (100.0%) | 547 (97.2%) |
Income Below Poverty Among Married-Couple Families in Wheatland
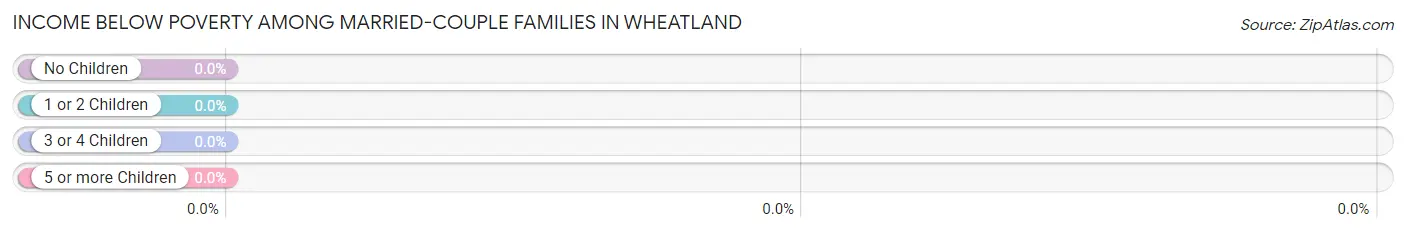
| Children | Above Poverty | Below Poverty |
| No Children | 172 (100.0%) | 0 (0.0%) |
| 1 or 2 Children | 74 (100.0%) | 0 (0.0%) |
| 3 or 4 Children | 21 (100.0%) | 0 (0.0%) |
| 5 or more Children | 0 (0.0%) | 0 (0.0%) |
| Total | 267 (100.0%) | 0 (0.0%) |
Income Below Poverty Among Single-Parent Households in Wheatland
| Children | Single Father | Single Mother |
| No Children | 0 (0.0%) | 0 (0.0%) |
| 1 or 2 Children | 0 (0.0%) | 0 (0.0%) |
| 3 or 4 Children | 0 (0.0%) | 0 (0.0%) |
| 5 or more Children | 0 (0.0%) | 0 (0.0%) |
| Total | 0 (0.0%) | 0 (0.0%) |
Income Below Poverty Among Married-Couple vs Single-Parent Households in Wheatland
| Children | Married-Couple Families | Single-Parent Households |
| No Children | 0 (0.0%) | 0 (0.0%) |
| 1 or 2 Children | 0 (0.0%) | 0 (0.0%) |
| 3 or 4 Children | 0 (0.0%) | 0 (0.0%) |
| 5 or more Children | 0 (0.0%) | 0 (0.0%) |
| Total | 0 (0.0%) | 0 (0.0%) |
Race in Wheatland
The most populous races in Wheatland are White / Caucasian (962 | 94.6%), Hispanic or Latino (55 | 5.4%), and Two or more Races (55 | 5.4%).
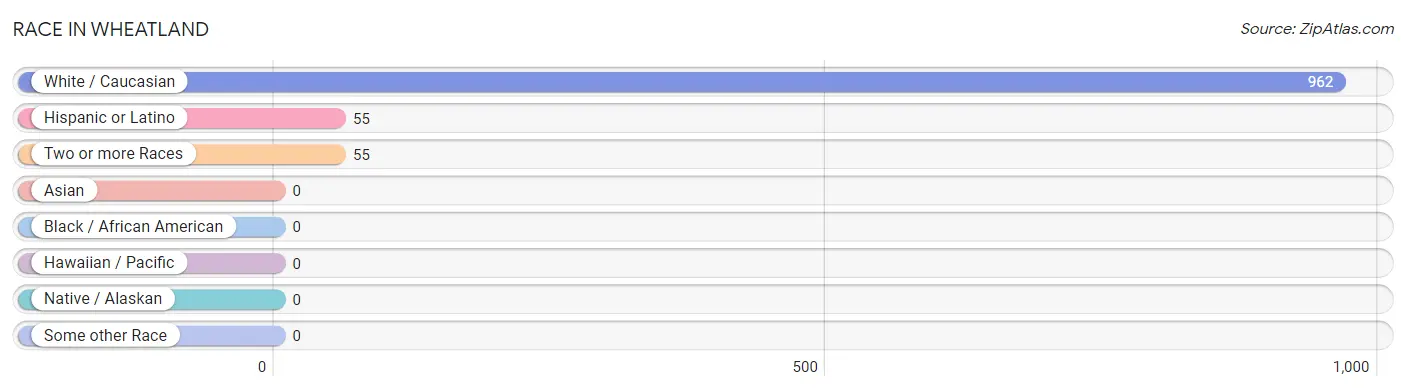
| Race | # Population | % Population |
| Asian | 0 | 0.0% |
| Black / African American | 0 | 0.0% |
| Hawaiian / Pacific | 0 | 0.0% |
| Hispanic or Latino | 55 | 5.4% |
| Native / Alaskan | 0 | 0.0% |
| White / Caucasian | 962 | 94.6% |
| Two or more Races | 55 | 5.4% |
| Some other Race | 0 | 0.0% |
| Total | 1,017 | 100.0% |
Ancestry in Wheatland
The most populous ancestries reported in Wheatland are German (285 | 28.0%), Irish (232 | 22.8%), English (138 | 13.6%), Norwegian (113 | 11.1%), and Mexican (55 | 5.4%), together accounting for 80.9% of all Wheatland residents.
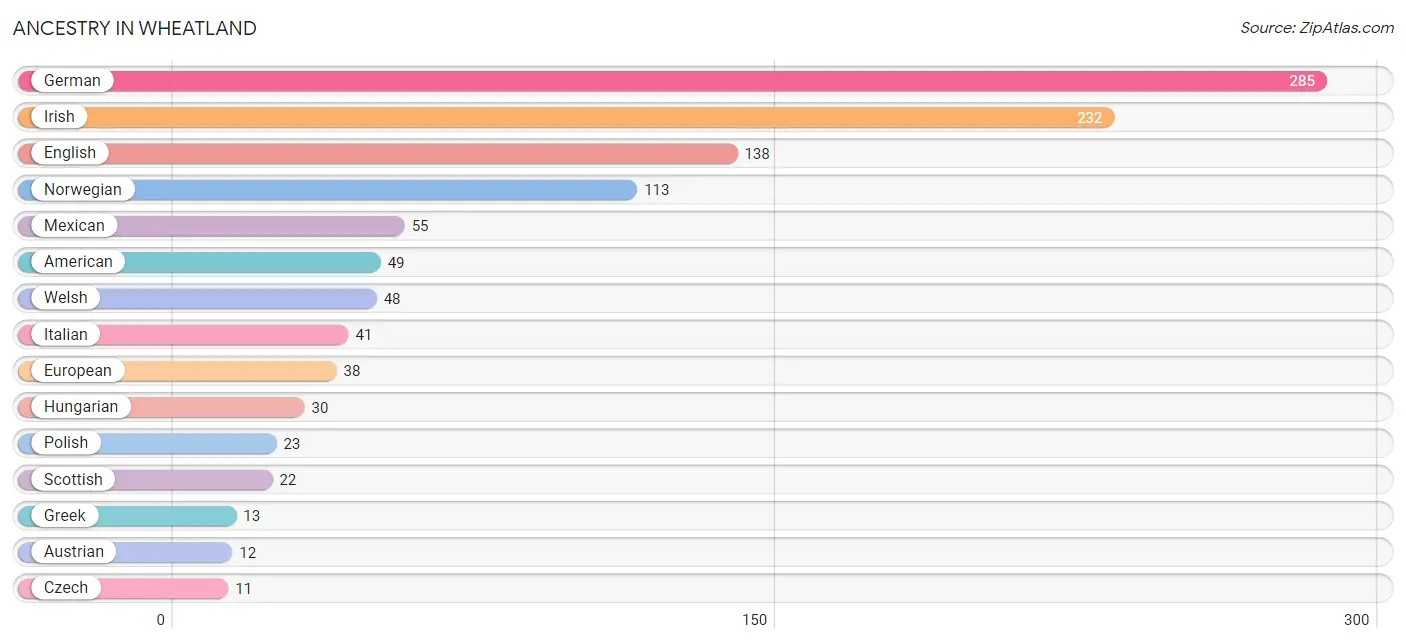
| Ancestry | # Population | % Population |
| American | 49 | 4.8% |
| Austrian | 12 | 1.2% |
| Belgian | 7 | 0.7% |
| Czech | 11 | 1.1% |
| English | 138 | 13.6% |
| European | 38 | 3.7% |
| German | 285 | 28.0% |
| Greek | 13 | 1.3% |
| Hungarian | 30 | 2.9% |
| Irish | 232 | 22.8% |
| Italian | 41 | 4.0% |
| Mexican | 55 | 5.4% |
| Norwegian | 113 | 11.1% |
| Polish | 23 | 2.3% |
| Scotch-Irish | 11 | 1.1% |
| Scottish | 22 | 2.2% |
| Swiss | 8 | 0.8% |
| Welsh | 48 | 4.7% | View All 18 Rows |
Immigrants in Wheatland

| Immigration Origin | # Population | % Population | View All 0 Rows |
Sex and Age in Wheatland
Sex and Age in Wheatland
The most populous age groups in Wheatland are 30 to 34 Years (96 | 21.1%) for men and 30 to 34 Years (115 | 20.4%) for women.
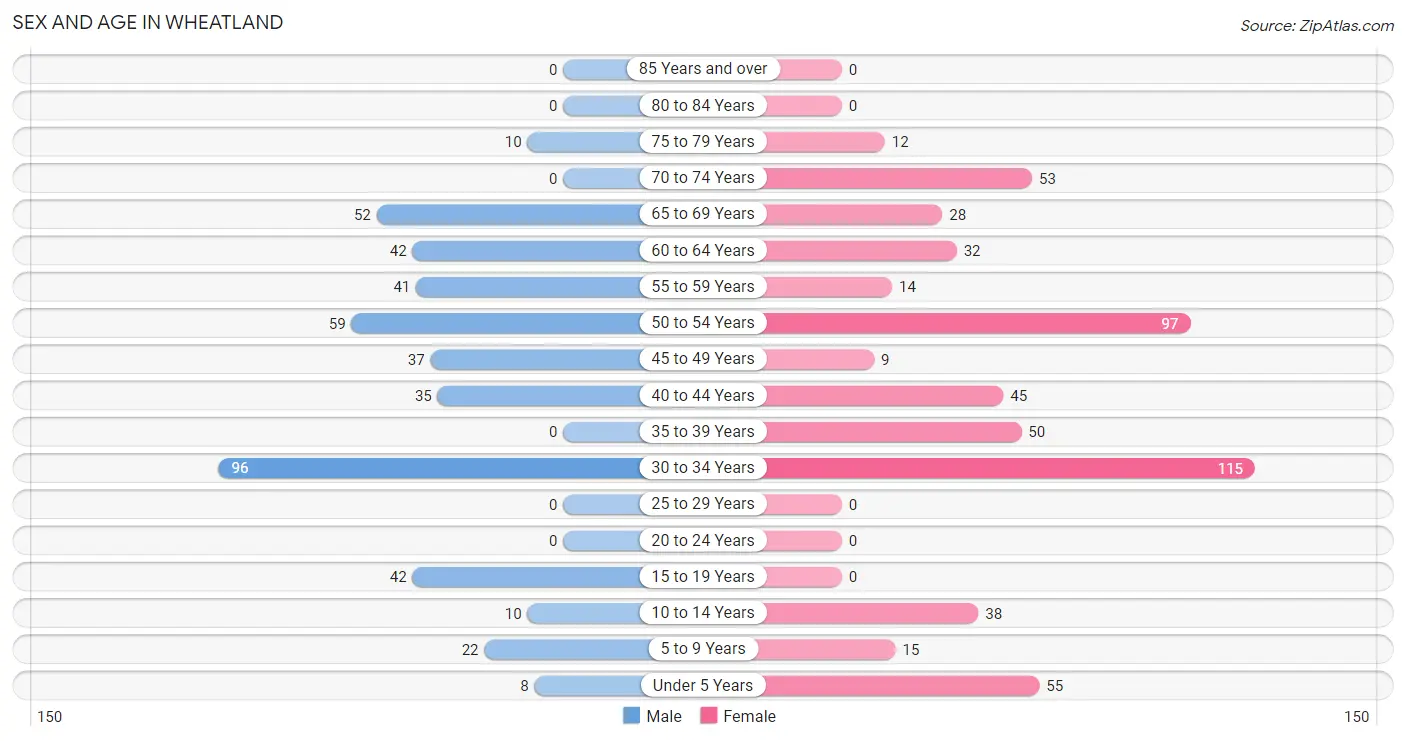
| Age Bracket | Male | Female |
| Under 5 Years | 8 (1.8%) | 55 (9.8%) |
| 5 to 9 Years | 22 (4.9%) | 15 (2.7%) |
| 10 to 14 Years | 10 (2.2%) | 38 (6.8%) |
| 15 to 19 Years | 42 (9.2%) | 0 (0.0%) |
| 20 to 24 Years | 0 (0.0%) | 0 (0.0%) |
| 25 to 29 Years | 0 (0.0%) | 0 (0.0%) |
| 30 to 34 Years | 96 (21.1%) | 115 (20.4%) |
| 35 to 39 Years | 0 (0.0%) | 50 (8.9%) |
| 40 to 44 Years | 35 (7.7%) | 45 (8.0%) |
| 45 to 49 Years | 37 (8.2%) | 9 (1.6%) |
| 50 to 54 Years | 59 (13.0%) | 97 (17.2%) |
| 55 to 59 Years | 41 (9.0%) | 14 (2.5%) |
| 60 to 64 Years | 42 (9.2%) | 32 (5.7%) |
| 65 to 69 Years | 52 (11.5%) | 28 (5.0%) |
| 70 to 74 Years | 0 (0.0%) | 53 (9.4%) |
| 75 to 79 Years | 10 (2.2%) | 12 (2.1%) |
| 80 to 84 Years | 0 (0.0%) | 0 (0.0%) |
| 85 Years and over | 0 (0.0%) | 0 (0.0%) |
| Total | 454 (100.0%) | 563 (100.0%) |
Families and Households in Wheatland
Median Family Size in Wheatland
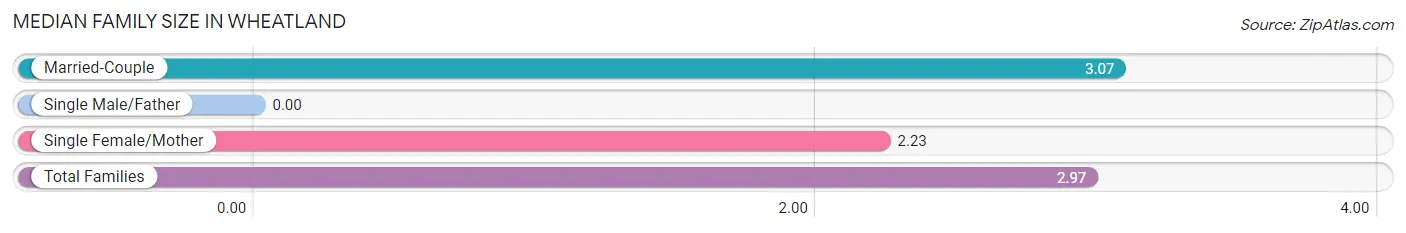
| Family Type | # Families | Family Size |
| Married-Couple | 267 (88.4%) | 3.07 |
| Single Male/Father | 0 (0.0%) | - |
| Single Female/Mother | 35 (11.6%) | 2.23 |
| Total Families | 302 (100.0%) | 2.97 |
Median Household Size in Wheatland
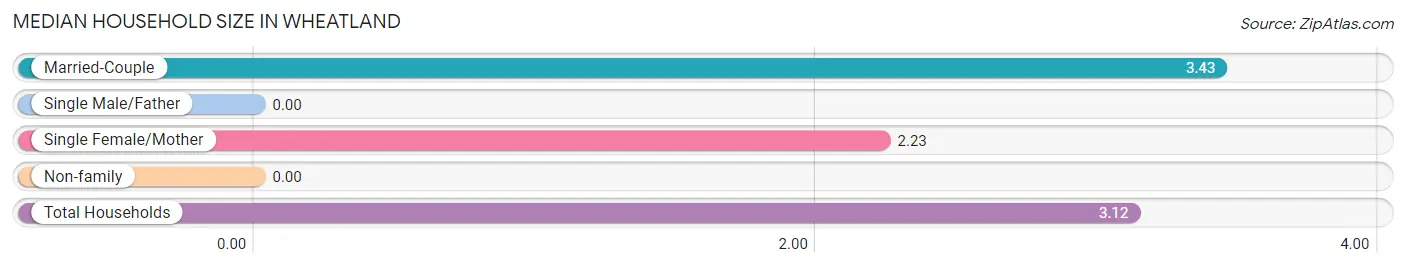
| Household Type | # Households | Household Size |
| Married-Couple | 267 (81.9%) | 3.43 |
| Single Male/Father | 0 (0.0%) | - |
| Single Female/Mother | 35 (10.7%) | 2.23 |
| Non-family | 24 (7.4%) | - |
| Total Households | 326 (100.0%) | 3.12 |
Household Size by Marriage Status in Wheatland
Out of a total of 326 households in Wheatland, 302 (92.6%) are family households, while 24 (7.4%) are nonfamily households. The most numerous type of family households are 2-person households, comprising 175, and the most common type of nonfamily households are 1-person households, comprising 24.
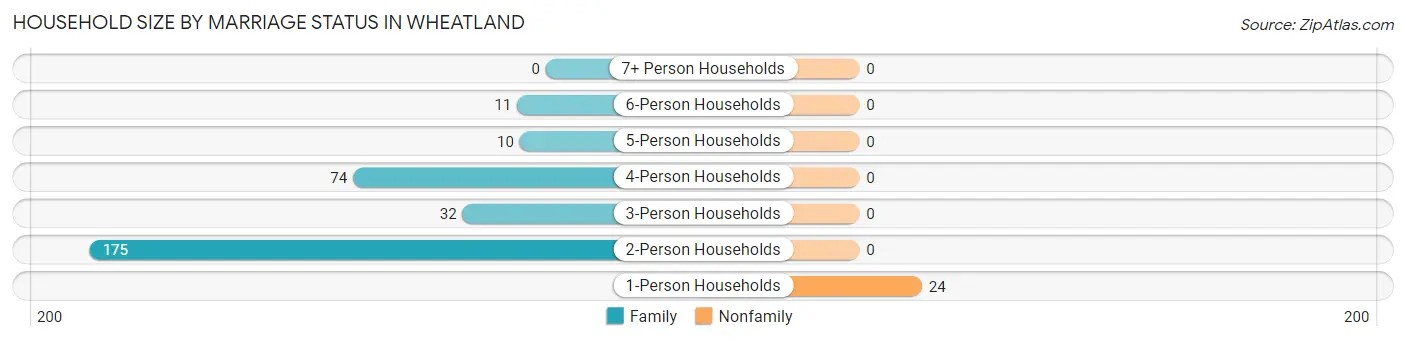
| Household Size | Family Households | Nonfamily Households |
| 1-Person Households | - | 24 (7.4%) |
| 2-Person Households | 175 (53.7%) | 0 (0.0%) |
| 3-Person Households | 32 (9.8%) | 0 (0.0%) |
| 4-Person Households | 74 (22.7%) | 0 (0.0%) |
| 5-Person Households | 10 (3.1%) | 0 (0.0%) |
| 6-Person Households | 11 (3.4%) | 0 (0.0%) |
| 7+ Person Households | 0 (0.0%) | 0 (0.0%) |
| Total | 302 (92.6%) | 24 (7.4%) |
Female Fertility in Wheatland
Fertility by Age in Wheatland
Average fertility rate in Wheatland is 110.0 births per 1,000 women. Women in the age bracket of 20 to 34 years have the highest fertility rate with 113.0 births per 1,000 women. Women in the age bracket of 20 to 34 years acount for 54.2% of all women with births.
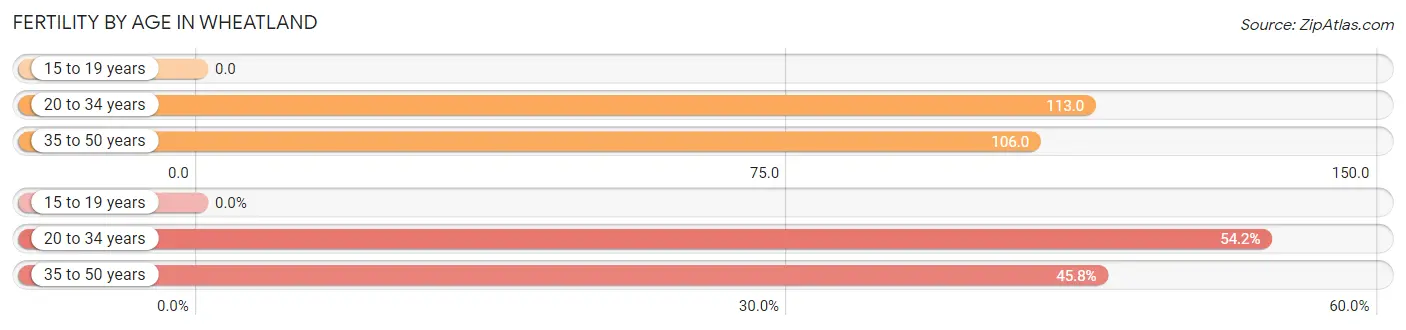
| Age Bracket | Women with Births | Births / 1,000 Women |
| 15 to 19 years | 0 (0.0%) | 0.0 |
| 20 to 34 years | 13 (54.2%) | 113.0 |
| 35 to 50 years | 11 (45.8%) | 106.0 |
| Total | 24 (100.0%) | 110.0 |
Fertility by Age by Marriage Status in Wheatland
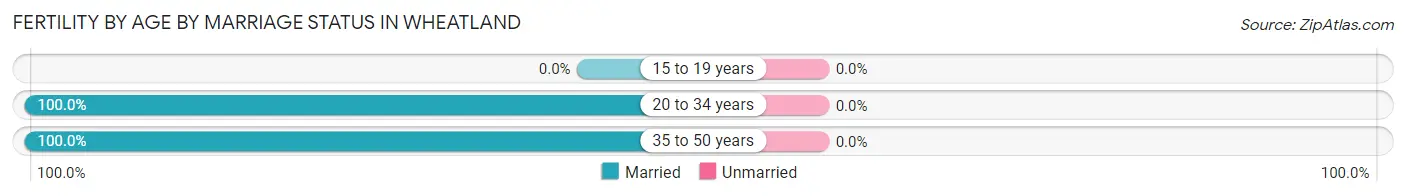
| Age Bracket | Married | Unmarried |
| 15 to 19 years | 0 (0.0%) | 0 (0.0%) |
| 20 to 34 years | 13 (100.0%) | 0 (0.0%) |
| 35 to 50 years | 11 (100.0%) | 0 (0.0%) |
| Total | 24 (100.0%) | 0 (0.0%) |
Fertility by Education in Wheatland
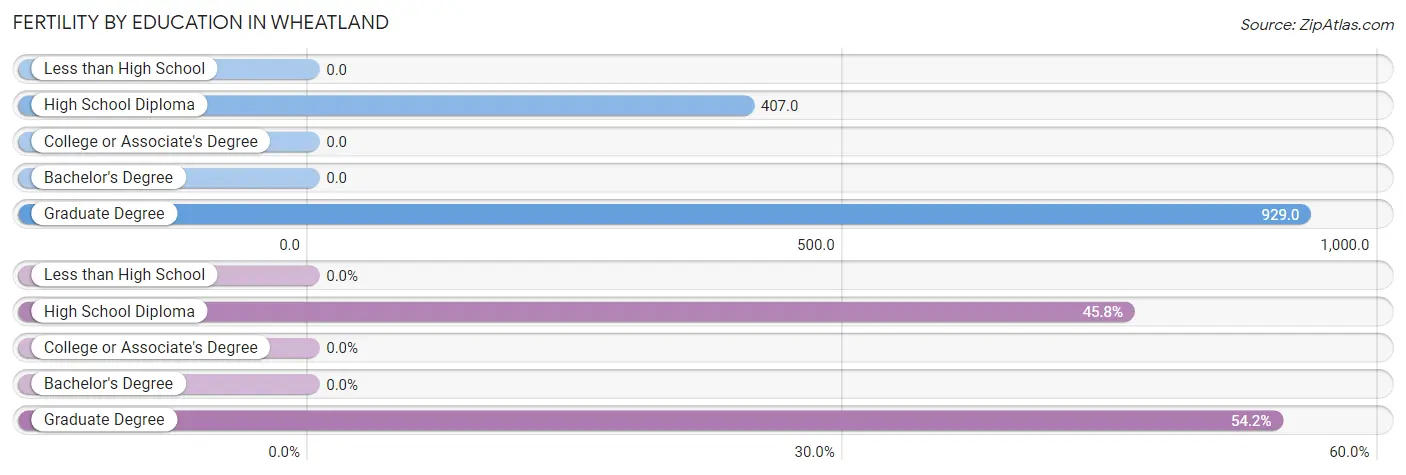
| Educational Attainment | Women with Births | Births / 1,000 Women |
| Less than High School | 0 (0.0%) | 0.0 |
| High School Diploma | 11 (45.8%) | 407.0 |
| College or Associate's Degree | 0 (0.0%) | 0.0 |
| Bachelor's Degree | 0 (0.0%) | 0.0 |
| Graduate Degree | 13 (54.2%) | 929.0 |
| Total | 24 (100.0%) | 110.0 |
Fertility by Education by Marriage Status in Wheatland
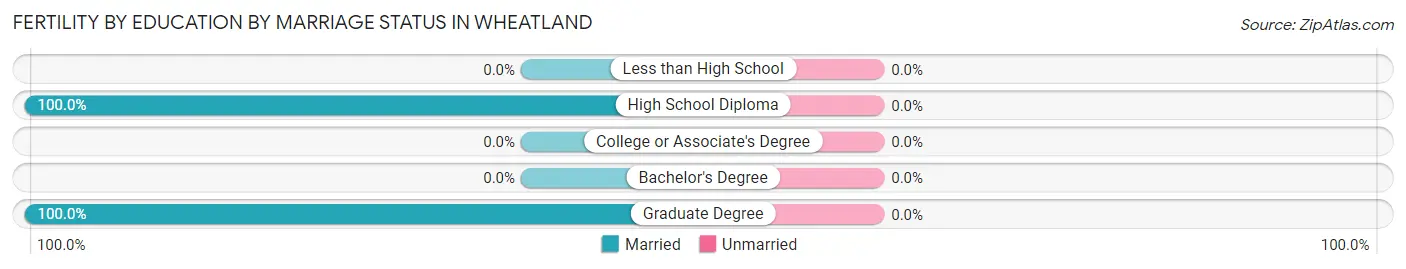
| Educational Attainment | Married | Unmarried |
| Less than High School | 0 (0.0%) | 0 (0.0%) |
| High School Diploma | 11 (100.0%) | 0 (0.0%) |
| College or Associate's Degree | 0 (0.0%) | 0 (0.0%) |
| Bachelor's Degree | 0 (0.0%) | 0 (0.0%) |
| Graduate Degree | 13 (100.0%) | 0 (0.0%) |
| Total | 24 (100.0%) | 0 (0.0%) |
Employment Characteristics in Wheatland
Employment by Class of Employer in Wheatland
Among the 618 employed individuals in Wheatland, private company employees (472 | 76.4%), self-employed (incorporated) (57 | 9.2%), and local government employees (56 | 9.1%) make up the most common classes of employment.
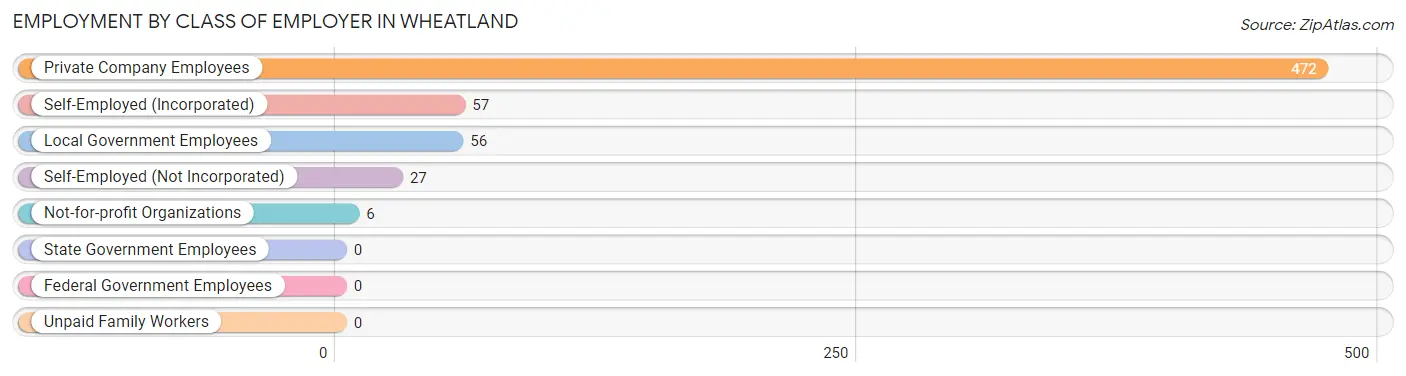
| Employer Class | # Employees | % Employees |
| Private Company Employees | 472 | 76.4% |
| Self-Employed (Incorporated) | 57 | 9.2% |
| Self-Employed (Not Incorporated) | 27 | 4.4% |
| Not-for-profit Organizations | 6 | 1.0% |
| Local Government Employees | 56 | 9.1% |
| State Government Employees | 0 | 0.0% |
| Federal Government Employees | 0 | 0.0% |
| Unpaid Family Workers | 0 | 0.0% |
| Total | 618 | 100.0% |
Employment Status by Age in Wheatland
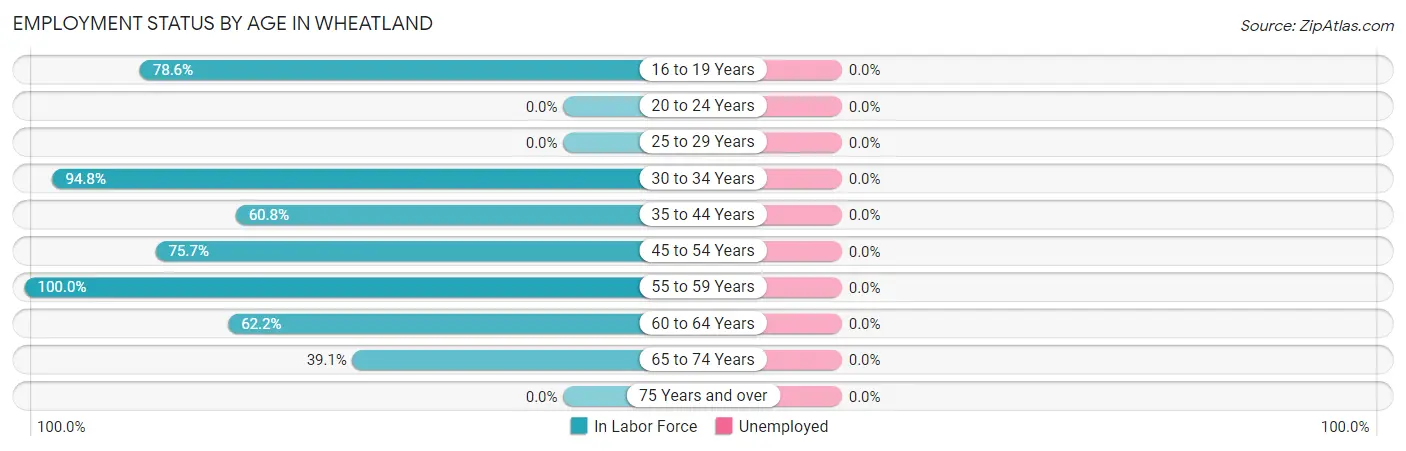
| Age Bracket | In Labor Force | Unemployed |
| 16 to 19 Years | 33 (78.6%) | 0 (0.0%) |
| 20 to 24 Years | 0 (0.0%) | 0 (0.0%) |
| 25 to 29 Years | 0 (0.0%) | 0 (0.0%) |
| 30 to 34 Years | 200 (94.8%) | 0 (0.0%) |
| 35 to 44 Years | 79 (60.8%) | 0 (0.0%) |
| 45 to 54 Years | 153 (75.7%) | 0 (0.0%) |
| 55 to 59 Years | 55 (100.0%) | 0 (0.0%) |
| 60 to 64 Years | 46 (62.2%) | 0 (0.0%) |
| 65 to 74 Years | 52 (39.1%) | 0 (0.0%) |
| 75 Years and over | 0 (0.0%) | 0 (0.0%) |
| Total | 618 (71.1%) | 0 (0.0%) |
Employment Status by Educational Attainment in Wheatland
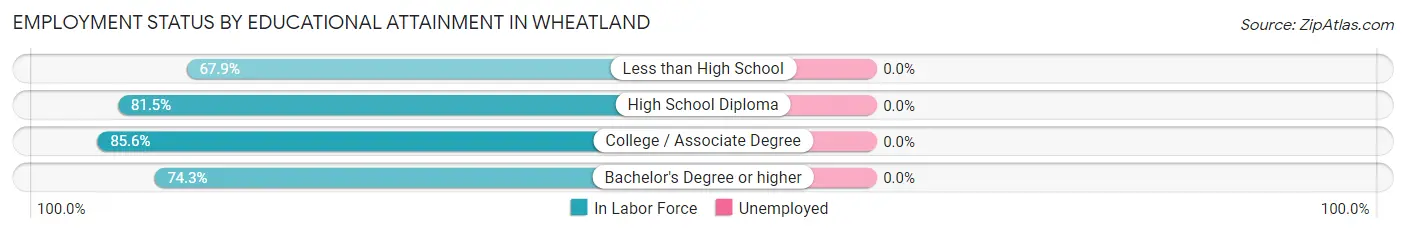
| Educational Attainment | In Labor Force | Unemployed |
| Less than High School | 36 (67.9%) | 0 (0.0%) |
| High School Diploma | 75 (81.5%) | 0 (0.0%) |
| College / Associate Degree | 231 (85.6%) | 0 (0.0%) |
| Bachelor's Degree or higher | 191 (74.3%) | 0 (0.0%) |
| Total | 533 (79.3%) | 0 (0.0%) |
Employment Occupations by Sex in Wheatland
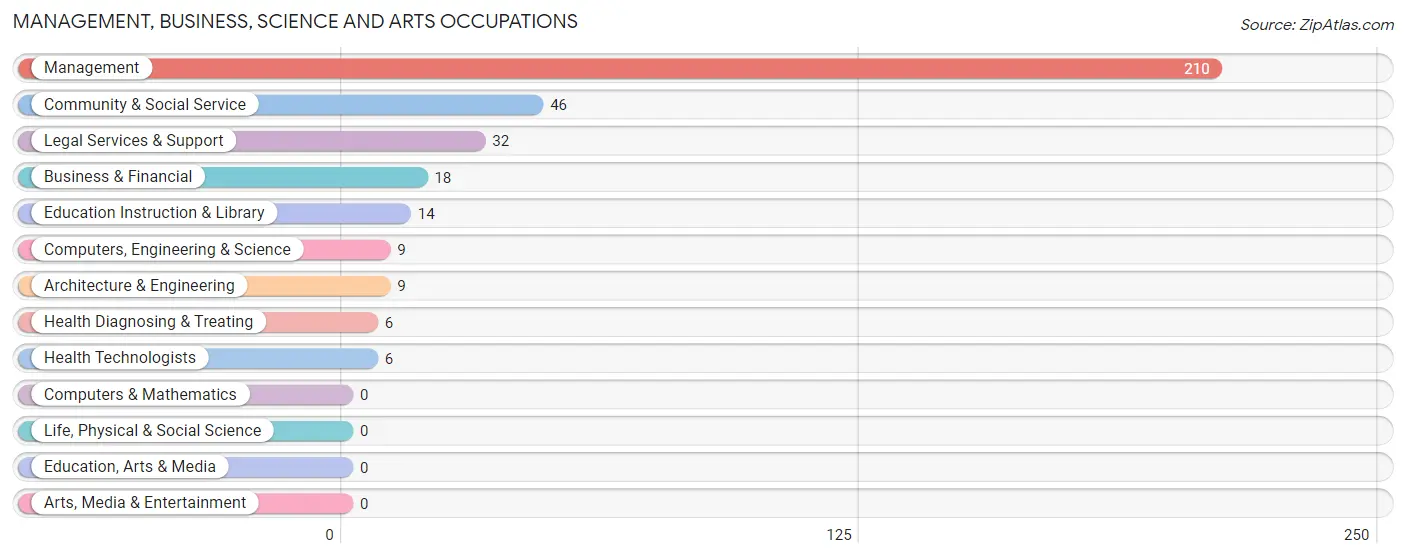
Management, Business, Science and Arts Occupations
The most common Management, Business, Science and Arts occupations in Wheatland are Management (210 | 34.0%), Community & Social Service (46 | 7.4%), Legal Services & Support (32 | 5.2%), Business & Financial (18 | 2.9%), and Education Instruction & Library (14 | 2.3%).
Management, Business, Science and Arts Occupations by Sex
Within the Management, Business, Science and Arts occupations in Wheatland, the most male-oriented occupations are Business & Financial (100.0%), Computers, Engineering & Science (100.0%), and Architecture & Engineering (100.0%), while the most female-oriented occupations are Community & Social Service (100.0%), Legal Services & Support (100.0%), and Education Instruction & Library (100.0%).
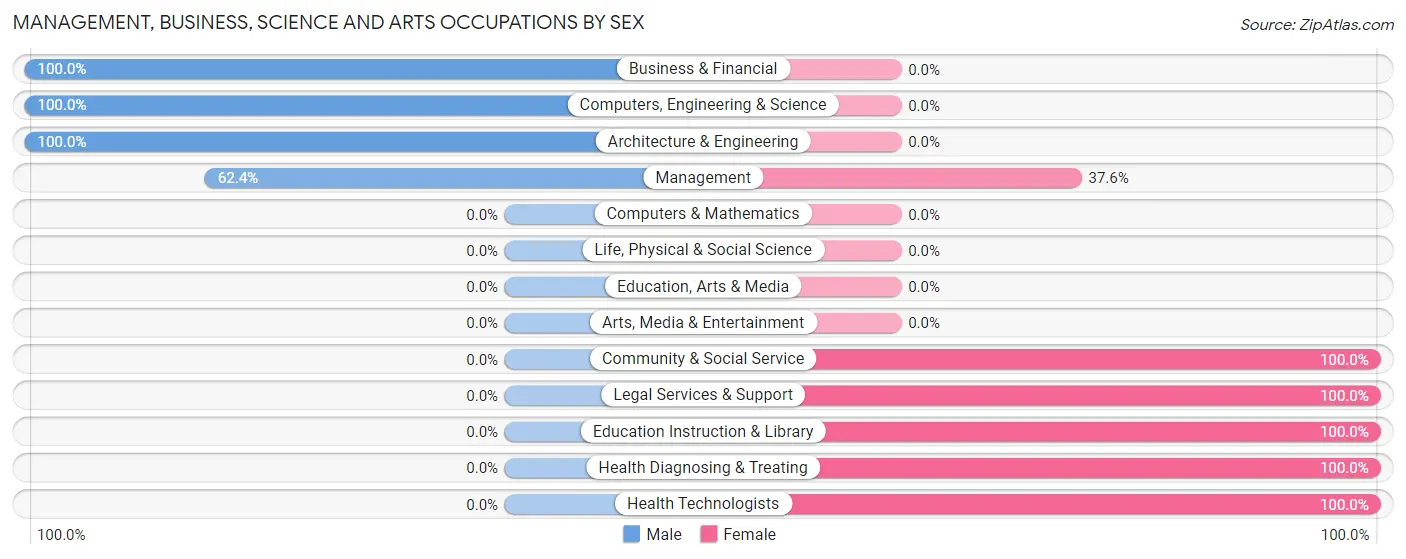
| Occupation | Male | Female |
| Management | 131 (62.4%) | 79 (37.6%) |
| Business & Financial | 18 (100.0%) | 0 (0.0%) |
| Computers, Engineering & Science | 9 (100.0%) | 0 (0.0%) |
| Computers & Mathematics | 0 (0.0%) | 0 (0.0%) |
| Architecture & Engineering | 9 (100.0%) | 0 (0.0%) |
| Life, Physical & Social Science | 0 (0.0%) | 0 (0.0%) |
| Community & Social Service | 0 (0.0%) | 46 (100.0%) |
| Education, Arts & Media | 0 (0.0%) | 0 (0.0%) |
| Legal Services & Support | 0 (0.0%) | 32 (100.0%) |
| Education Instruction & Library | 0 (0.0%) | 14 (100.0%) |
| Arts, Media & Entertainment | 0 (0.0%) | 0 (0.0%) |
| Health Diagnosing & Treating | 0 (0.0%) | 6 (100.0%) |
| Health Technologists | 0 (0.0%) | 6 (100.0%) |
| Total (Category) | 158 (54.7%) | 131 (45.3%) |
| Total (Overall) | 389 (62.9%) | 229 (37.1%) |
Services Occupations
The most common Services occupations in Wheatland are Food Preparation & Serving (154 | 24.9%), and Healthcare Support (4 | 0.6%).
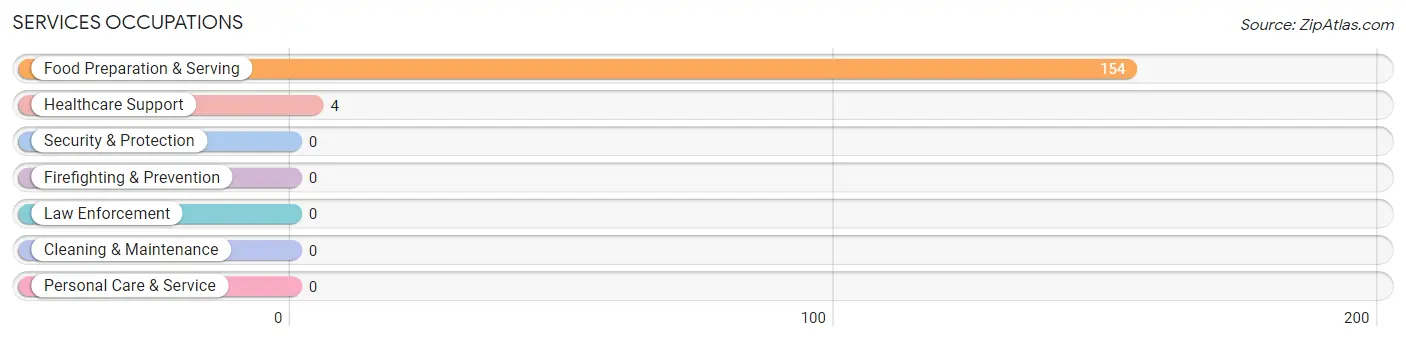
Services Occupations by Sex
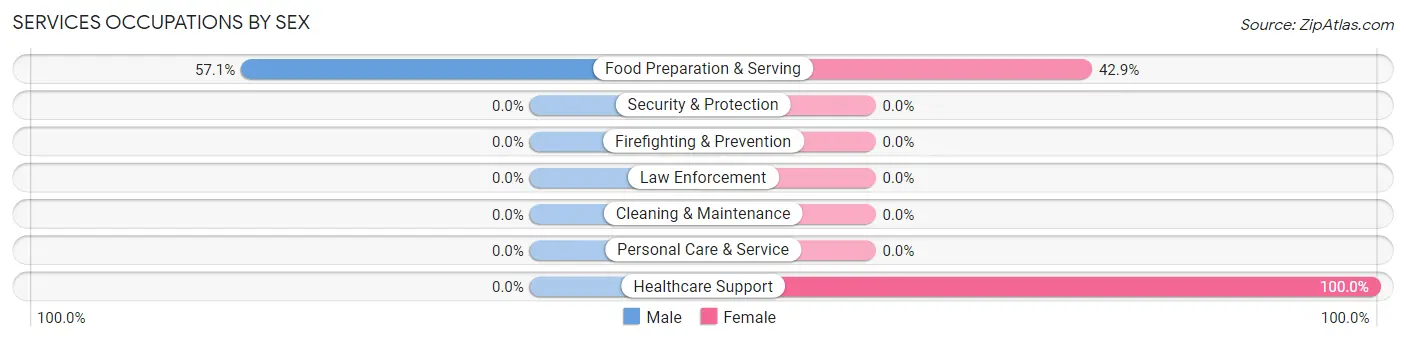
| Occupation | Male | Female |
| Healthcare Support | 0 (0.0%) | 4 (100.0%) |
| Security & Protection | 0 (0.0%) | 0 (0.0%) |
| Firefighting & Prevention | 0 (0.0%) | 0 (0.0%) |
| Law Enforcement | 0 (0.0%) | 0 (0.0%) |
| Food Preparation & Serving | 88 (57.1%) | 66 (42.9%) |
| Cleaning & Maintenance | 0 (0.0%) | 0 (0.0%) |
| Personal Care & Service | 0 (0.0%) | 0 (0.0%) |
| Total (Category) | 88 (55.7%) | 70 (44.3%) |
| Total (Overall) | 389 (62.9%) | 229 (37.1%) |
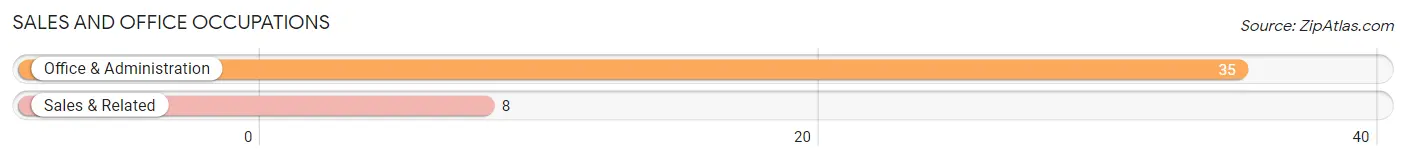
Sales and Office Occupations
The most common Sales and Office occupations in Wheatland are Office & Administration (35 | 5.7%), and Sales & Related (8 | 1.3%).
Sales and Office Occupations by Sex

| Occupation | Male | Female |
| Sales & Related | 0 (0.0%) | 8 (100.0%) |
| Office & Administration | 19 (54.3%) | 16 (45.7%) |
| Total (Category) | 19 (44.2%) | 24 (55.8%) |
| Total (Overall) | 389 (62.9%) | 229 (37.1%) |
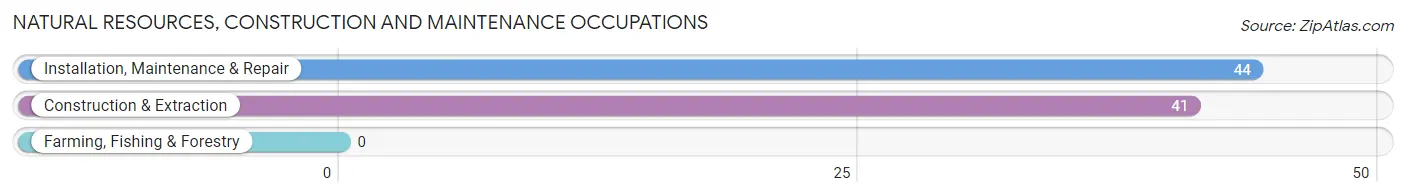
Natural Resources, Construction and Maintenance Occupations
The most common Natural Resources, Construction and Maintenance occupations in Wheatland are Installation, Maintenance & Repair (44 | 7.1%), and Construction & Extraction (41 | 6.6%).
Natural Resources, Construction and Maintenance Occupations by Sex
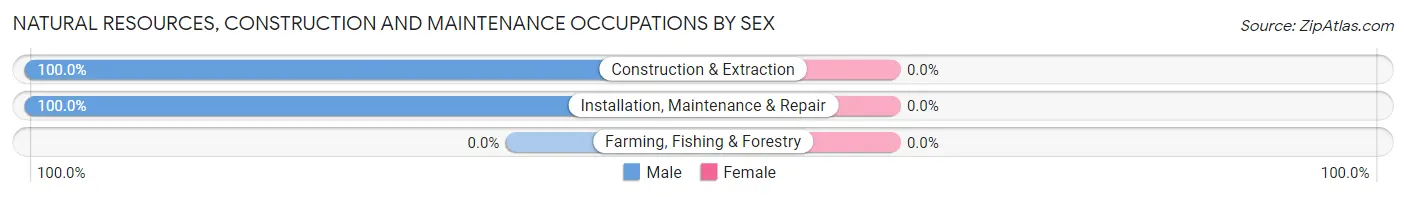
| Occupation | Male | Female |
| Farming, Fishing & Forestry | 0 (0.0%) | 0 (0.0%) |
| Construction & Extraction | 41 (100.0%) | 0 (0.0%) |
| Installation, Maintenance & Repair | 44 (100.0%) | 0 (0.0%) |
| Total (Category) | 85 (100.0%) | 0 (0.0%) |
| Total (Overall) | 389 (62.9%) | 229 (37.1%) |
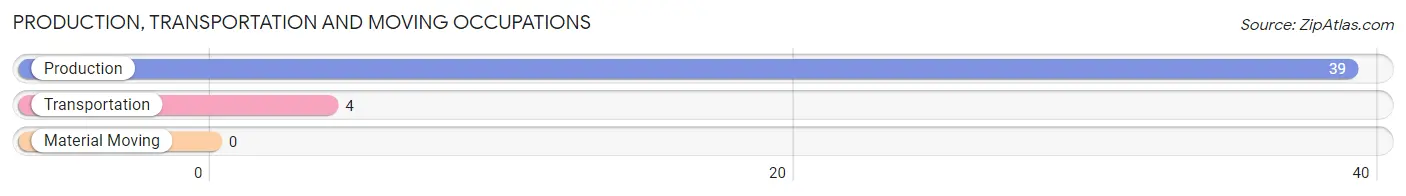
Production, Transportation and Moving Occupations
The most common Production, Transportation and Moving occupations in Wheatland are Production (39 | 6.3%), and Transportation (4 | 0.6%).
Production, Transportation and Moving Occupations by Sex
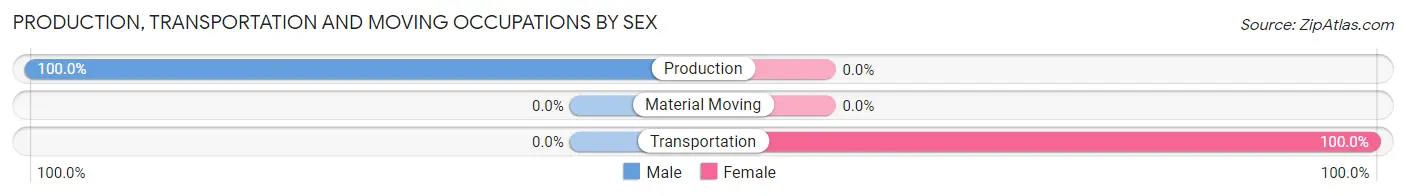
| Occupation | Male | Female |
| Production | 39 (100.0%) | 0 (0.0%) |
| Transportation | 0 (0.0%) | 4 (100.0%) |
| Material Moving | 0 (0.0%) | 0 (0.0%) |
| Total (Category) | 39 (90.7%) | 4 (9.3%) |
| Total (Overall) | 389 (62.9%) | 229 (37.1%) |
Employment Industries by Sex in Wheatland
Employment Industries in Wheatland
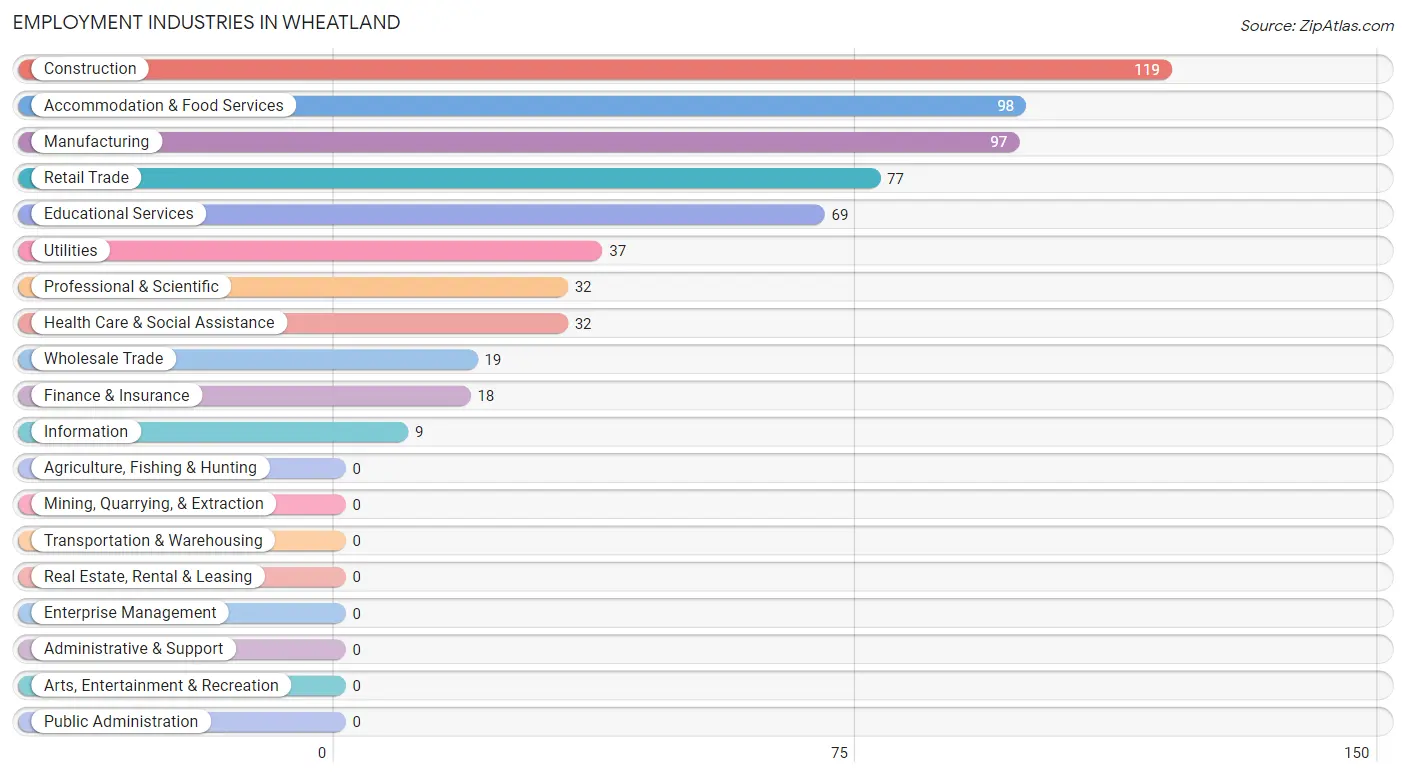
The major employment industries in Wheatland include Construction (119 | 19.3%), Accommodation & Food Services (98 | 15.9%), Manufacturing (97 | 15.7%), Retail Trade (77 | 12.5%), and Educational Services (69 | 11.2%).
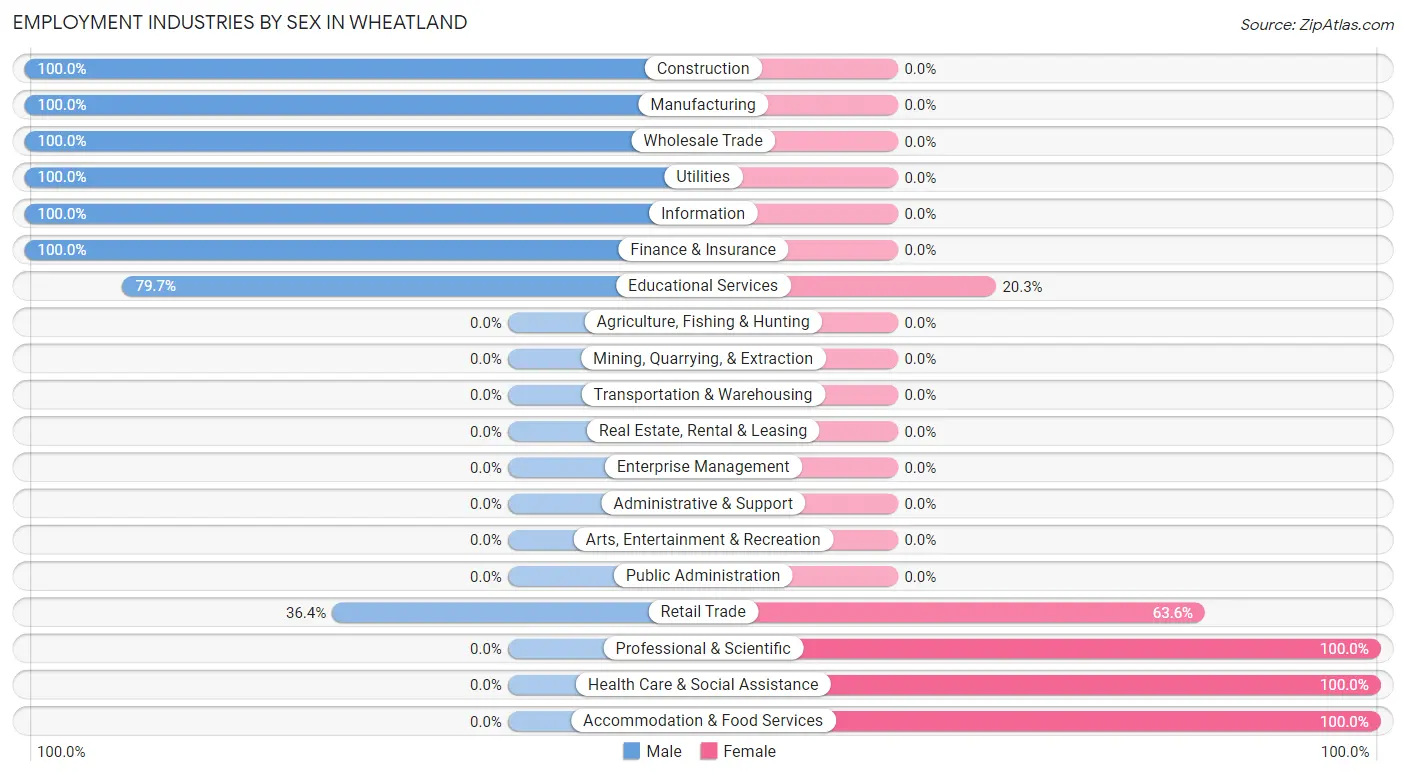
Employment Industries by Sex in Wheatland
The Wheatland industries that see more men than women are Construction (100.0%), Manufacturing (100.0%), and Wholesale Trade (100.0%), whereas the industries that tend to have a higher number of women are Professional & Scientific (100.0%), Health Care & Social Assistance (100.0%), and Accommodation & Food Services (100.0%).
| Industry | Male | Female |
| Agriculture, Fishing & Hunting | 0 (0.0%) | 0 (0.0%) |
| Mining, Quarrying, & Extraction | 0 (0.0%) | 0 (0.0%) |
| Construction | 119 (100.0%) | 0 (0.0%) |
| Manufacturing | 97 (100.0%) | 0 (0.0%) |
| Wholesale Trade | 19 (100.0%) | 0 (0.0%) |
| Retail Trade | 28 (36.4%) | 49 (63.6%) |
| Transportation & Warehousing | 0 (0.0%) | 0 (0.0%) |
| Utilities | 37 (100.0%) | 0 (0.0%) |
| Information | 9 (100.0%) | 0 (0.0%) |
| Finance & Insurance | 18 (100.0%) | 0 (0.0%) |
| Real Estate, Rental & Leasing | 0 (0.0%) | 0 (0.0%) |
| Professional & Scientific | 0 (0.0%) | 32 (100.0%) |
| Enterprise Management | 0 (0.0%) | 0 (0.0%) |
| Administrative & Support | 0 (0.0%) | 0 (0.0%) |
| Educational Services | 55 (79.7%) | 14 (20.3%) |
| Health Care & Social Assistance | 0 (0.0%) | 32 (100.0%) |
| Arts, Entertainment & Recreation | 0 (0.0%) | 0 (0.0%) |
| Accommodation & Food Services | 0 (0.0%) | 98 (100.0%) |
| Public Administration | 0 (0.0%) | 0 (0.0%) |
| Total | 389 (62.9%) | 229 (37.1%) |
Education in Wheatland
School Enrollment in Wheatland
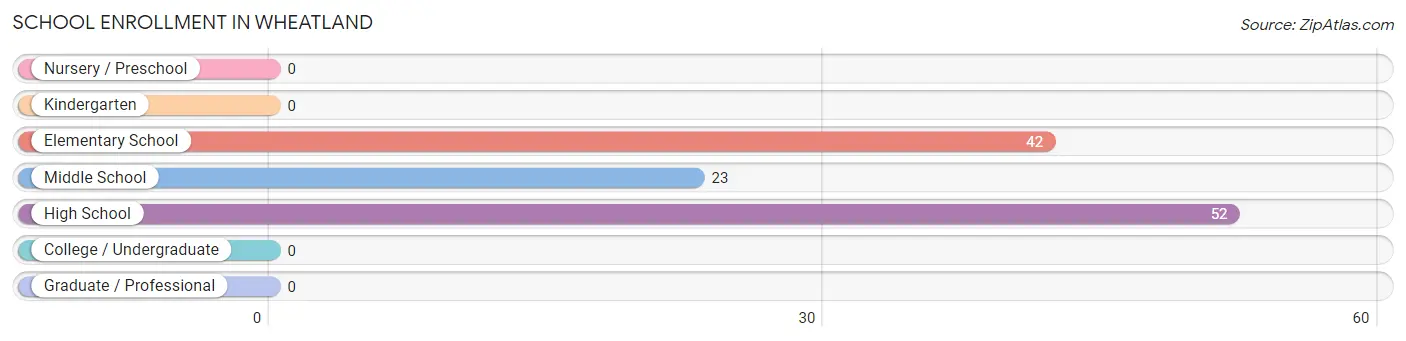
The most common levels of schooling among the 117 students in Wheatland are high school (52 | 44.4%), elementary school (42 | 35.9%), and middle school (23 | 19.7%).
| School Level | # Students | % Students |
| Nursery / Preschool | 0 | 0.0% |
| Kindergarten | 0 | 0.0% |
| Elementary School | 42 | 35.9% |
| Middle School | 23 | 19.7% |
| High School | 52 | 44.4% |
| College / Undergraduate | 0 | 0.0% |
| Graduate / Professional | 0 | 0.0% |
| Total | 117 | 100.0% |
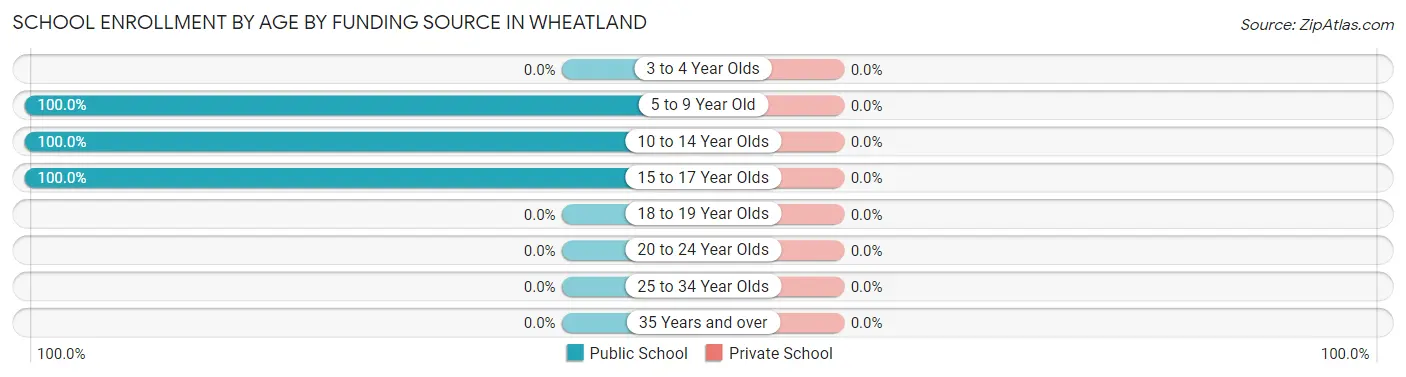
School Enrollment by Age by Funding Source in Wheatland
| Age Bracket | Public School | Private School |
| 3 to 4 Year Olds | 0 (0.0%) | 0 (0.0%) |
| 5 to 9 Year Old | 27 (100.0%) | 0 (0.0%) |
| 10 to 14 Year Olds | 48 (100.0%) | 0 (0.0%) |
| 15 to 17 Year Olds | 42 (100.0%) | 0 (0.0%) |
| 18 to 19 Year Olds | 0 (0.0%) | 0 (0.0%) |
| 20 to 24 Year Olds | 0 (0.0%) | 0 (0.0%) |
| 25 to 34 Year Olds | 0 (0.0%) | 0 (0.0%) |
| 35 Years and over | 0 (0.0%) | 0 (0.0%) |
| Total | 117 (100.0%) | 0 (0.0%) |
Educational Attainment by Field of Study in Wheatland
Business (63 | 24.5%), education (51 | 19.8%), engineering (43 | 16.7%), arts & humanities (41 | 16.0%), and visual & performing arts (25 | 9.7%) are the most common fields of study among 257 individuals in Wheatland who have obtained a bachelor's degree or higher.
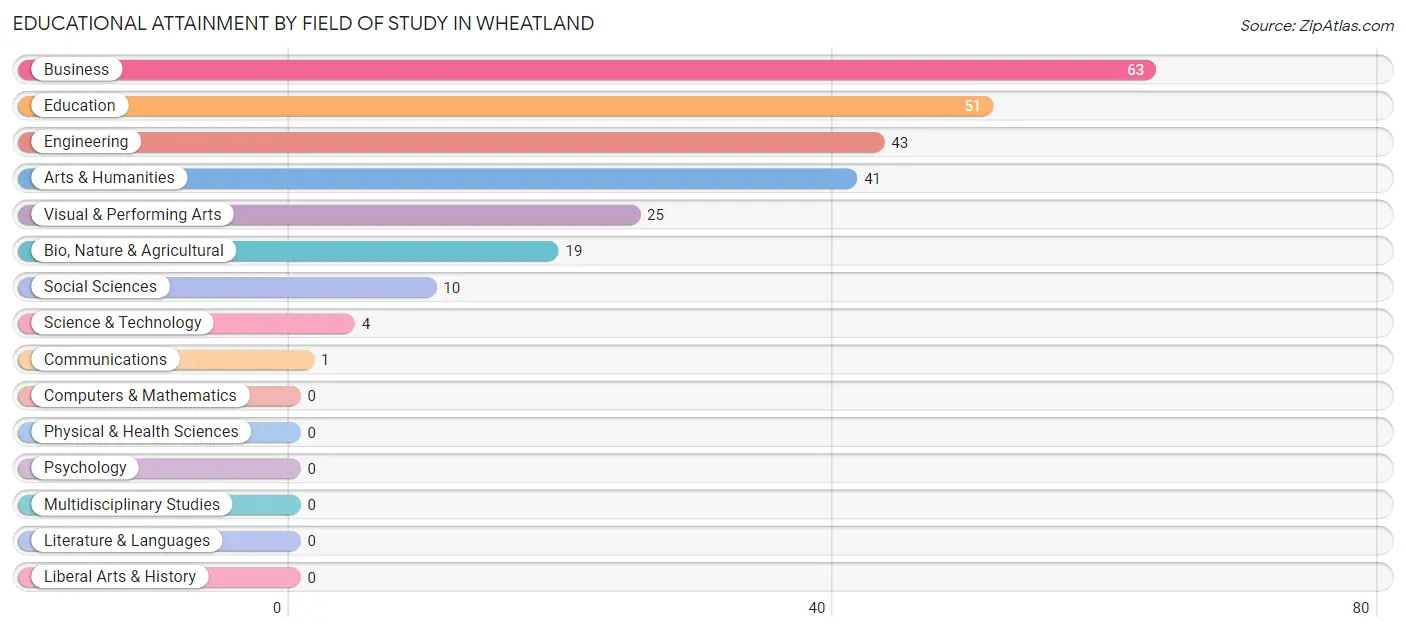
| Field of Study | # Graduates | % Graduates |
| Computers & Mathematics | 0 | 0.0% |
| Bio, Nature & Agricultural | 19 | 7.4% |
| Physical & Health Sciences | 0 | 0.0% |
| Psychology | 0 | 0.0% |
| Social Sciences | 10 | 3.9% |
| Engineering | 43 | 16.7% |
| Multidisciplinary Studies | 0 | 0.0% |
| Science & Technology | 4 | 1.6% |
| Business | 63 | 24.5% |
| Education | 51 | 19.8% |
| Literature & Languages | 0 | 0.0% |
| Liberal Arts & History | 0 | 0.0% |
| Visual & Performing Arts | 25 | 9.7% |
| Communications | 1 | 0.4% |
| Arts & Humanities | 41 | 16.0% |
| Total | 257 | 100.0% |
Transportation & Commute in Wheatland
Vehicle Availability by Sex in Wheatland
The most prevalent vehicle ownership categories in Wheatland are males with 3 vehicles (144, accounting for 37.0%) and females with 3 vehicles (134, making up 62.9%).
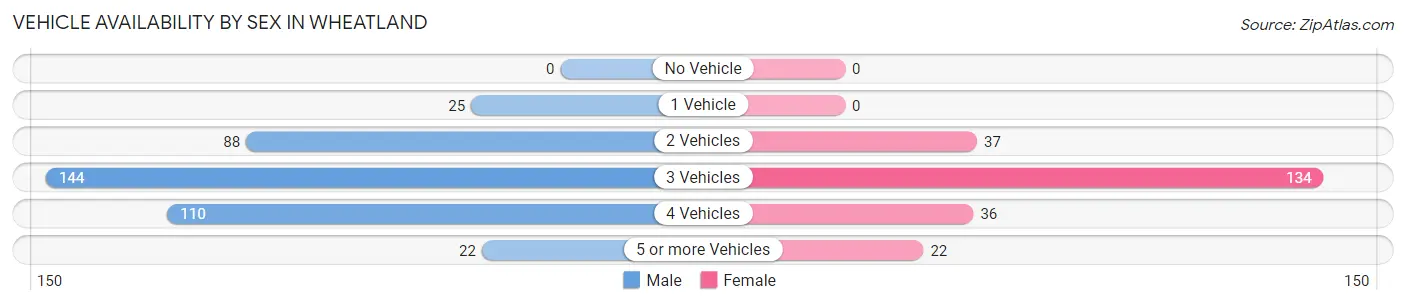
| Vehicles Available | Male | Female |
| No Vehicle | 0 (0.0%) | 0 (0.0%) |
| 1 Vehicle | 25 (6.4%) | 0 (0.0%) |
| 2 Vehicles | 88 (22.6%) | 37 (16.2%) |
| 3 Vehicles | 144 (37.0%) | 134 (58.5%) |
| 4 Vehicles | 110 (28.3%) | 36 (15.7%) |
| 5 or more Vehicles | 22 (5.7%) | 22 (9.6%) |
| Total | 389 (100.0%) | 229 (100.0%) |
Commute Time in Wheatland
The most frequently occuring commute durations in Wheatland are 5 to 9 minutes (150 commuters, 28.0%), 15 to 19 minutes (110 commuters, 20.6%), and 30 to 34 minutes (110 commuters, 20.6%).
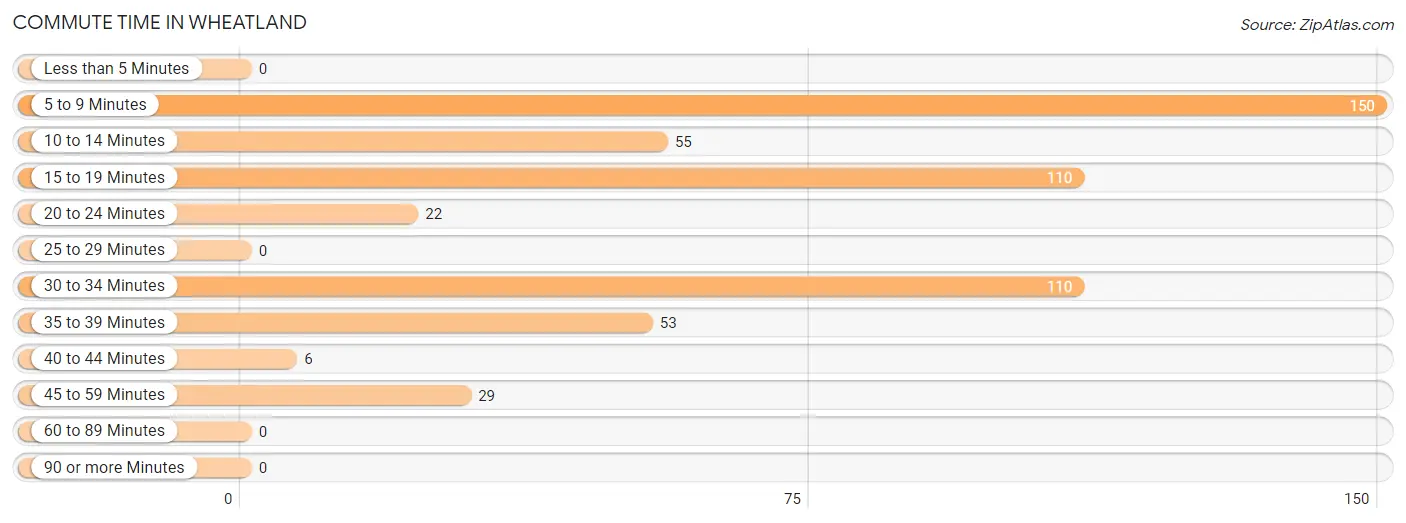
| Commute Time | # Commuters | % Commuters |
| Less than 5 Minutes | 0 | 0.0% |
| 5 to 9 Minutes | 150 | 28.0% |
| 10 to 14 Minutes | 55 | 10.3% |
| 15 to 19 Minutes | 110 | 20.6% |
| 20 to 24 Minutes | 22 | 4.1% |
| 25 to 29 Minutes | 0 | 0.0% |
| 30 to 34 Minutes | 110 | 20.6% |
| 35 to 39 Minutes | 53 | 9.9% |
| 40 to 44 Minutes | 6 | 1.1% |
| 45 to 59 Minutes | 29 | 5.4% |
| 60 to 89 Minutes | 0 | 0.0% |
| 90 or more Minutes | 0 | 0.0% |
Commute Time by Sex in Wheatland
The most common commute times in Wheatland are 15 to 19 minutes (106 commuters, 29.9%) for males and 5 to 9 minutes (98 commuters, 54.4%) for females.
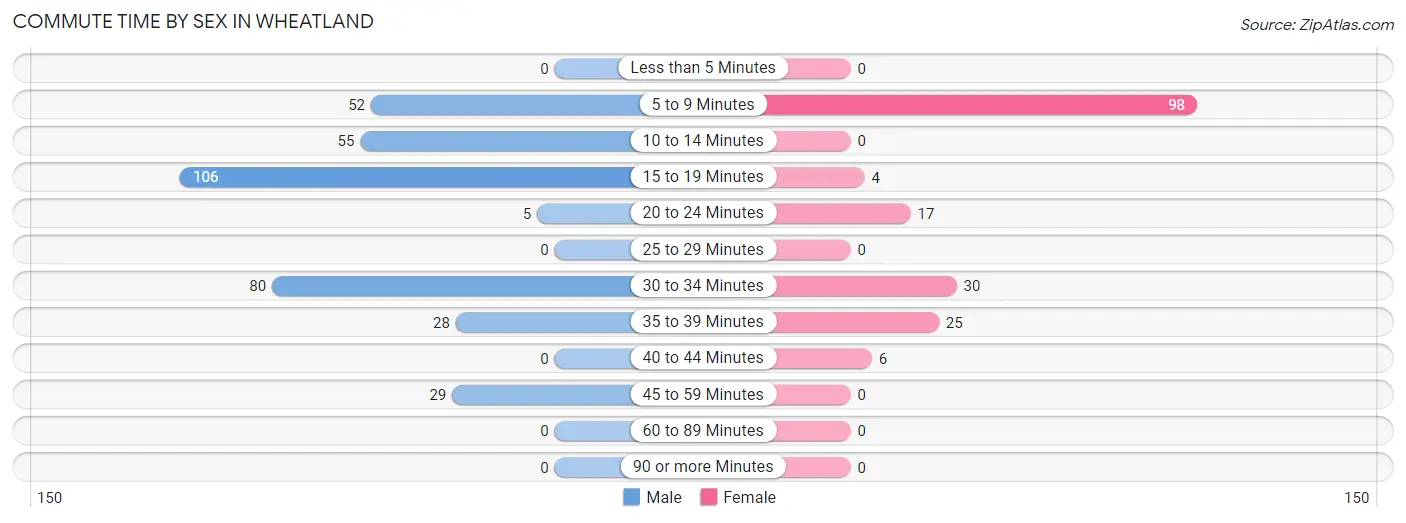
| Commute Time | Male | Female |
| Less than 5 Minutes | 0 (0.0%) | 0 (0.0%) |
| 5 to 9 Minutes | 52 (14.6%) | 98 (54.4%) |
| 10 to 14 Minutes | 55 (15.5%) | 0 (0.0%) |
| 15 to 19 Minutes | 106 (29.9%) | 4 (2.2%) |
| 20 to 24 Minutes | 5 (1.4%) | 17 (9.4%) |
| 25 to 29 Minutes | 0 (0.0%) | 0 (0.0%) |
| 30 to 34 Minutes | 80 (22.5%) | 30 (16.7%) |
| 35 to 39 Minutes | 28 (7.9%) | 25 (13.9%) |
| 40 to 44 Minutes | 0 (0.0%) | 6 (3.3%) |
| 45 to 59 Minutes | 29 (8.2%) | 0 (0.0%) |
| 60 to 89 Minutes | 0 (0.0%) | 0 (0.0%) |
| 90 or more Minutes | 0 (0.0%) | 0 (0.0%) |
Time of Departure to Work by Sex in Wheatland
The most frequent times of departure to work in Wheatland are 7:00 AM to 7:29 AM (124, 34.9%) for males and 6:00 AM to 6:29 AM (70, 38.9%) for females.
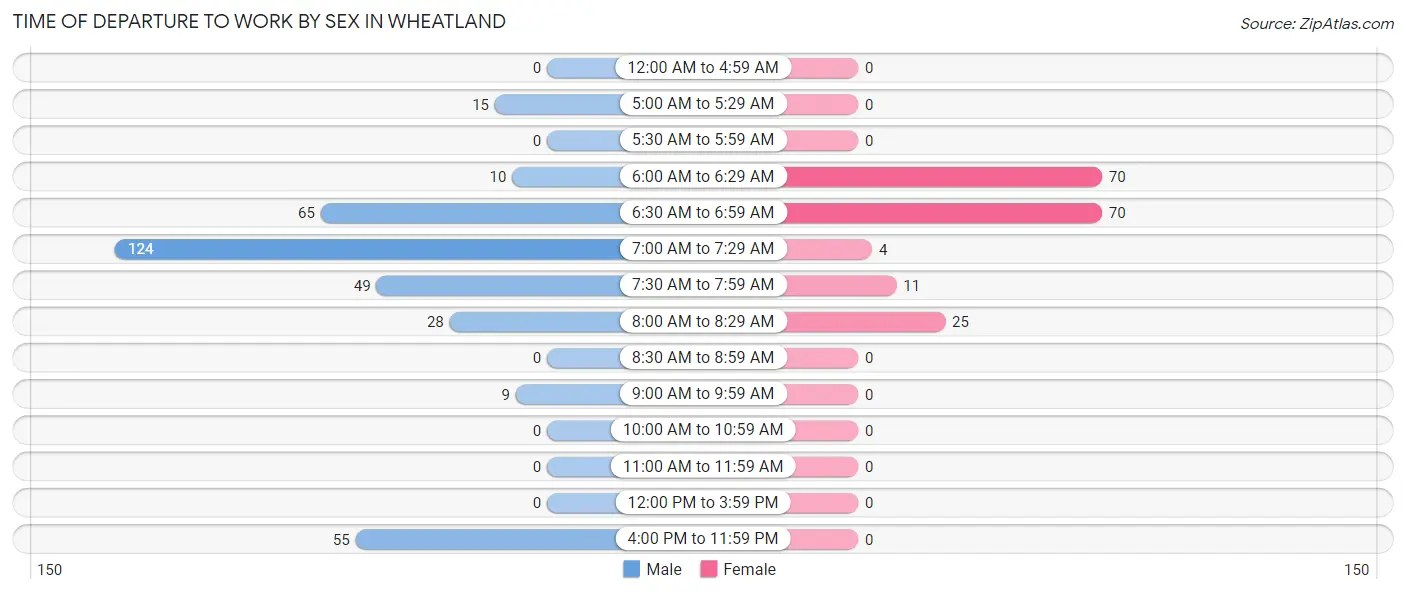
| Time of Departure | Male | Female |
| 12:00 AM to 4:59 AM | 0 (0.0%) | 0 (0.0%) |
| 5:00 AM to 5:29 AM | 15 (4.2%) | 0 (0.0%) |
| 5:30 AM to 5:59 AM | 0 (0.0%) | 0 (0.0%) |
| 6:00 AM to 6:29 AM | 10 (2.8%) | 70 (38.9%) |
| 6:30 AM to 6:59 AM | 65 (18.3%) | 70 (38.9%) |
| 7:00 AM to 7:29 AM | 124 (34.9%) | 4 (2.2%) |
| 7:30 AM to 7:59 AM | 49 (13.8%) | 11 (6.1%) |
| 8:00 AM to 8:29 AM | 28 (7.9%) | 25 (13.9%) |
| 8:30 AM to 8:59 AM | 0 (0.0%) | 0 (0.0%) |
| 9:00 AM to 9:59 AM | 9 (2.5%) | 0 (0.0%) |
| 10:00 AM to 10:59 AM | 0 (0.0%) | 0 (0.0%) |
| 11:00 AM to 11:59 AM | 0 (0.0%) | 0 (0.0%) |
| 12:00 PM to 3:59 PM | 0 (0.0%) | 0 (0.0%) |
| 4:00 PM to 11:59 PM | 55 (15.5%) | 0 (0.0%) |
| Total | 355 (100.0%) | 180 (100.0%) |
Housing Occupancy in Wheatland
Occupancy by Ownership in Wheatland
Of the total 326 dwellings in Wheatland, owner-occupied units account for 326 (100.0%), while renter-occupied units make up 0 (0.0%).
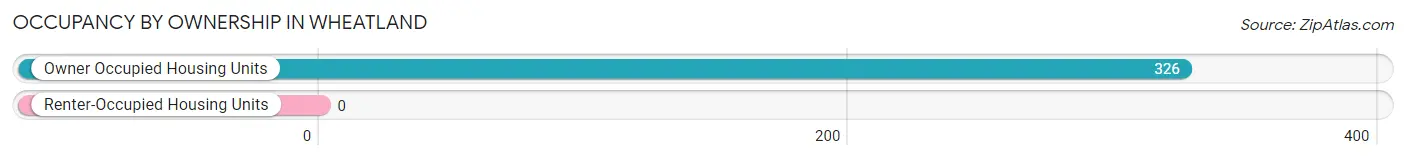
| Occupancy | # Housing Units | % Housing Units |
| Owner Occupied Housing Units | 326 | 100.0% |
| Renter-Occupied Housing Units | 0 | 0.0% |
| Total Occupied Housing Units | 326 | 100.0% |
Occupancy by Household Size in Wheatland
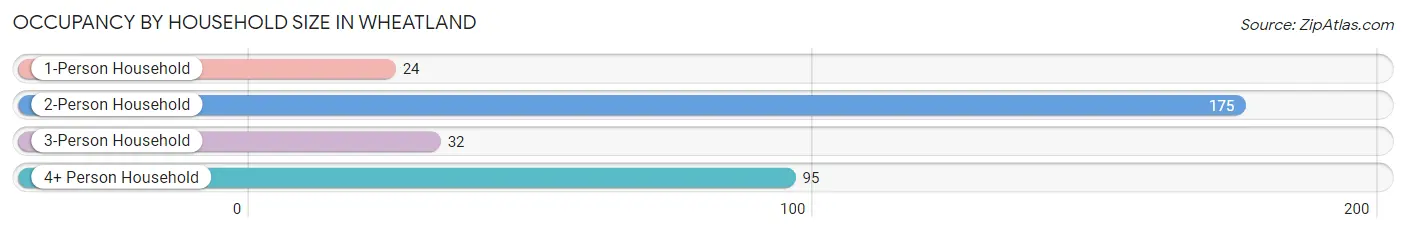
| Household Size | # Housing Units | % Housing Units |
| 1-Person Household | 24 | 7.4% |
| 2-Person Household | 175 | 53.7% |
| 3-Person Household | 32 | 9.8% |
| 4+ Person Household | 95 | 29.1% |
| Total Housing Units | 326 | 100.0% |
Occupancy by Ownership by Household Size in Wheatland
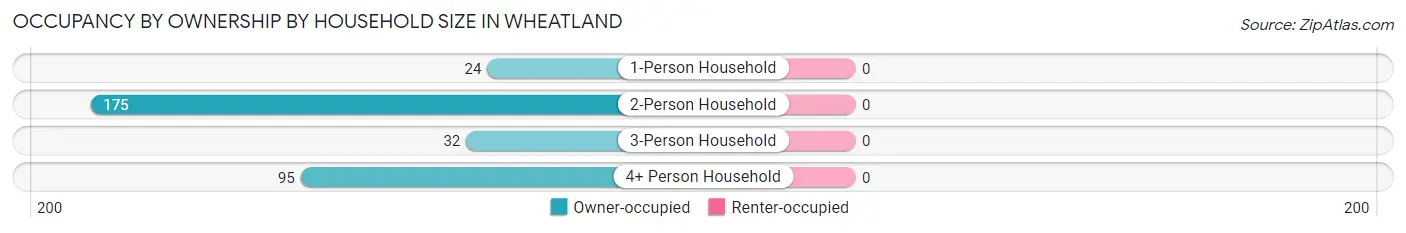
| Household Size | Owner-occupied | Renter-occupied |
| 1-Person Household | 24 (100.0%) | 0 (0.0%) |
| 2-Person Household | 175 (100.0%) | 0 (0.0%) |
| 3-Person Household | 32 (100.0%) | 0 (0.0%) |
| 4+ Person Household | 95 (100.0%) | 0 (0.0%) |
| Total Housing Units | 326 (100.0%) | 0 (0.0%) |
Occupancy by Educational Attainment in Wheatland
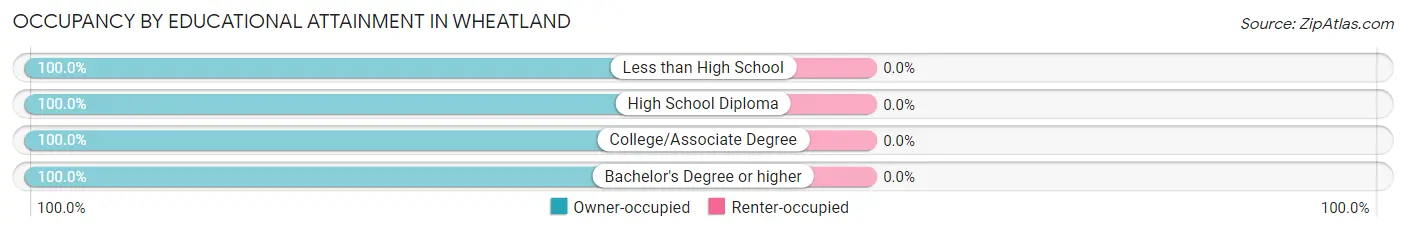
| Household Size | Owner-occupied | Renter-occupied |
| Less than High School | 17 (100.0%) | 0 (0.0%) |
| High School Diploma | 60 (100.0%) | 0 (0.0%) |
| College/Associate Degree | 118 (100.0%) | 0 (0.0%) |
| Bachelor's Degree or higher | 131 (100.0%) | 0 (0.0%) |
Occupancy by Age of Householder in Wheatland
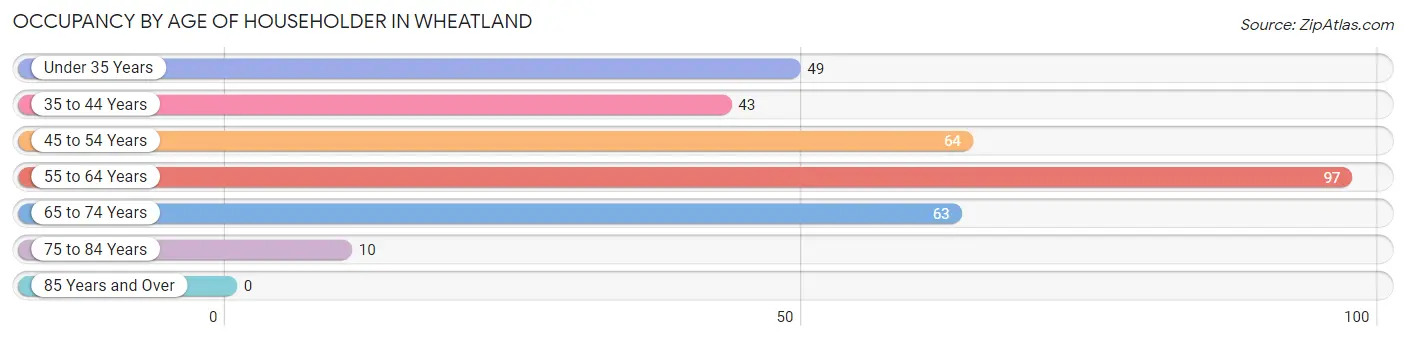
| Age Bracket | # Households | % Households |
| Under 35 Years | 49 | 15.0% |
| 35 to 44 Years | 43 | 13.2% |
| 45 to 54 Years | 64 | 19.6% |
| 55 to 64 Years | 97 | 29.7% |
| 65 to 74 Years | 63 | 19.3% |
| 75 to 84 Years | 10 | 3.1% |
| 85 Years and Over | 0 | 0.0% |
| Total | 326 | 100.0% |
Housing Finances in Wheatland
Median Income by Occupancy in Wheatland
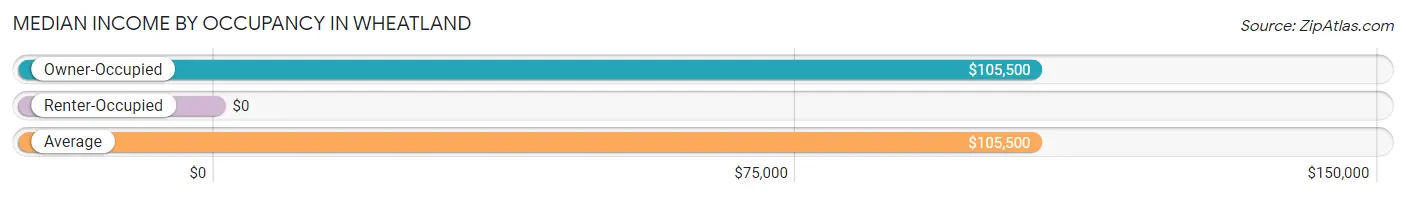
| Occupancy Type | # Households | Median Income |
| Owner-Occupied | 326 (100.0%) | $105,500 |
| Renter-Occupied | 0 (0.0%) | $0 |
| Average | 326 (100.0%) | $105,500 |
Occupancy by Householder Income Bracket in Wheatland
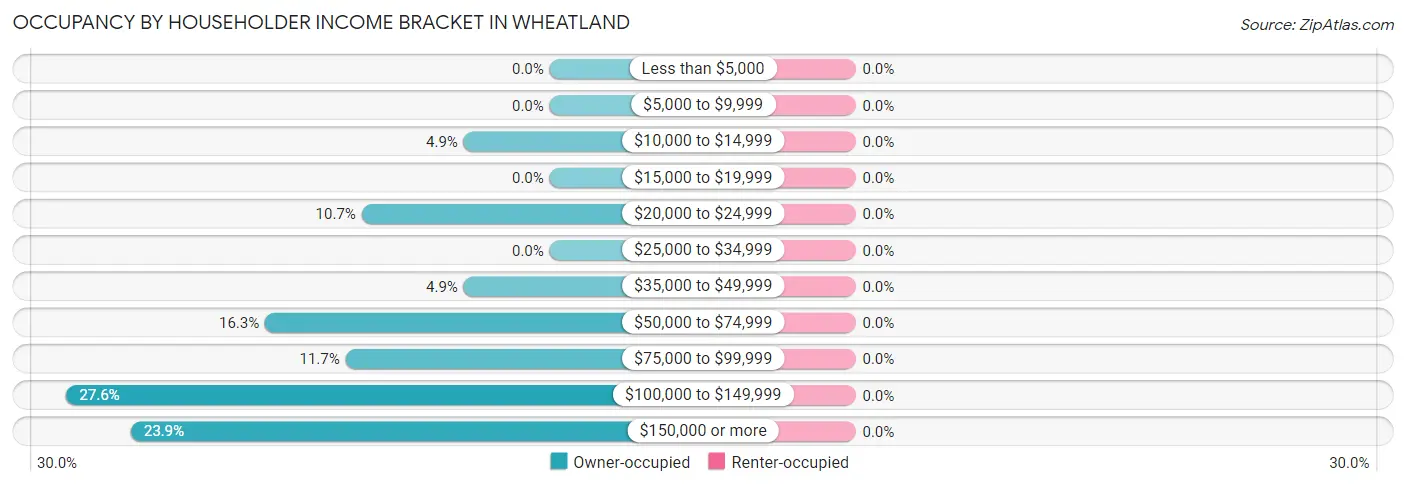
| Income Bracket | Owner-occupied | Renter-occupied |
| Less than $5,000 | 0 (0.0%) | 0 (0.0%) |
| $5,000 to $9,999 | 0 (0.0%) | 0 (0.0%) |
| $10,000 to $14,999 | 16 (4.9%) | 0 (0.0%) |
| $15,000 to $19,999 | 0 (0.0%) | 0 (0.0%) |
| $20,000 to $24,999 | 35 (10.7%) | 0 (0.0%) |
| $25,000 to $34,999 | 0 (0.0%) | 0 (0.0%) |
| $35,000 to $49,999 | 16 (4.9%) | 0 (0.0%) |
| $50,000 to $74,999 | 53 (16.3%) | 0 (0.0%) |
| $75,000 to $99,999 | 38 (11.7%) | 0 (0.0%) |
| $100,000 to $149,999 | 90 (27.6%) | 0 (0.0%) |
| $150,000 or more | 78 (23.9%) | 0 (0.0%) |
| Total | 326 (100.0%) | 0 (0.0%) |
Monthly Housing Cost Tiers in Wheatland
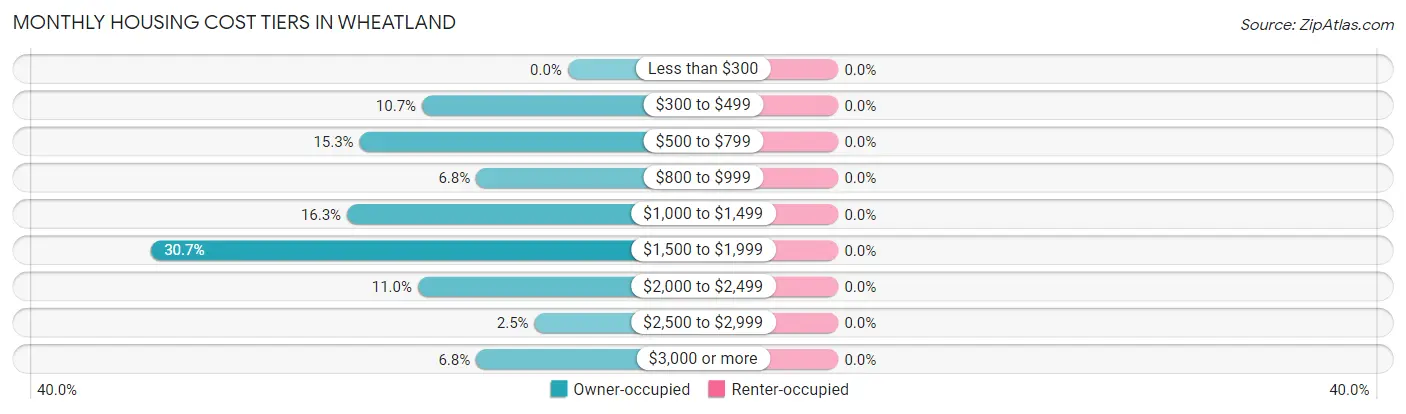
| Monthly Cost | Owner-occupied | Renter-occupied |
| Less than $300 | 0 (0.0%) | 0 (0.0%) |
| $300 to $499 | 35 (10.7%) | 0 (0.0%) |
| $500 to $799 | 50 (15.3%) | 0 (0.0%) |
| $800 to $999 | 22 (6.8%) | 0 (0.0%) |
| $1,000 to $1,499 | 53 (16.3%) | 0 (0.0%) |
| $1,500 to $1,999 | 100 (30.7%) | 0 (0.0%) |
| $2,000 to $2,499 | 36 (11.0%) | 0 (0.0%) |
| $2,500 to $2,999 | 8 (2.5%) | 0 (0.0%) |
| $3,000 or more | 22 (6.8%) | 0 (0.0%) |
| Total | 326 (100.0%) | 0 (0.0%) |
Physical Housing Characteristics in Wheatland
Housing Structures in Wheatland
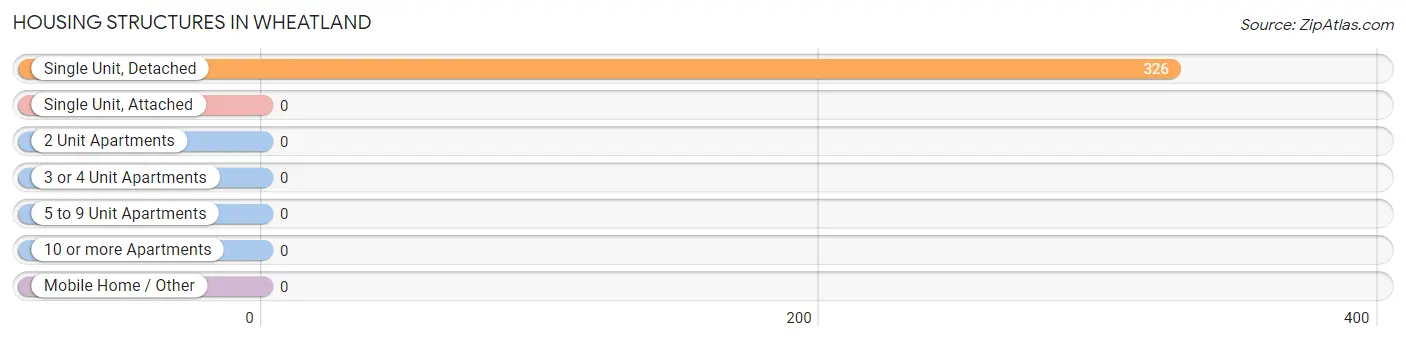
| Structure Type | # Housing Units | % Housing Units |
| Single Unit, Detached | 326 | 100.0% |
| Single Unit, Attached | 0 | 0.0% |
| 2 Unit Apartments | 0 | 0.0% |
| 3 or 4 Unit Apartments | 0 | 0.0% |
| 5 to 9 Unit Apartments | 0 | 0.0% |
| 10 or more Apartments | 0 | 0.0% |
| Mobile Home / Other | 0 | 0.0% |
| Total | 326 | 100.0% |
Housing Structures by Occupancy in Wheatland
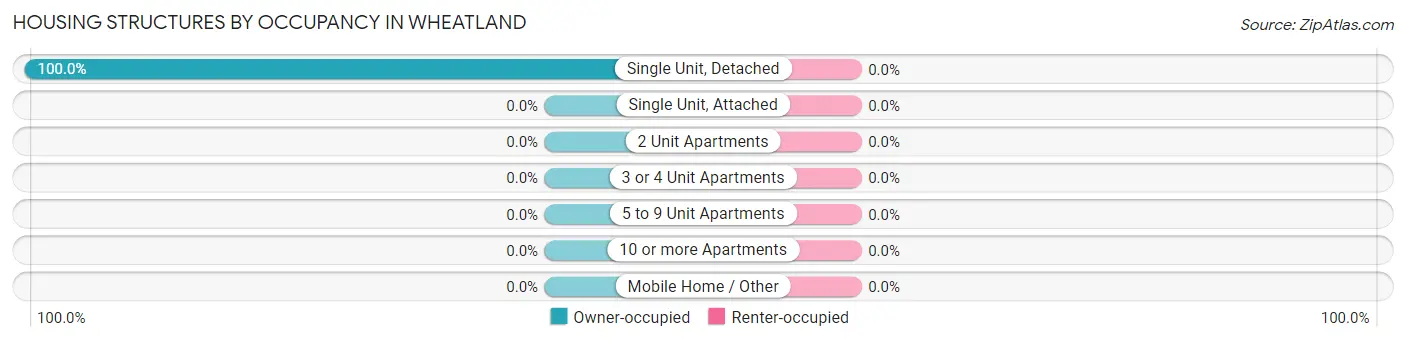
| Structure Type | Owner-occupied | Renter-occupied |
| Single Unit, Detached | 326 (100.0%) | 0 (0.0%) |
| Single Unit, Attached | 0 (0.0%) | 0 (0.0%) |
| 2 Unit Apartments | 0 (0.0%) | 0 (0.0%) |
| 3 or 4 Unit Apartments | 0 (0.0%) | 0 (0.0%) |
| 5 to 9 Unit Apartments | 0 (0.0%) | 0 (0.0%) |
| 10 or more Apartments | 0 (0.0%) | 0 (0.0%) |
| Mobile Home / Other | 0 (0.0%) | 0 (0.0%) |
| Total | 326 (100.0%) | 0 (0.0%) |
Housing Structures by Number of Rooms in Wheatland
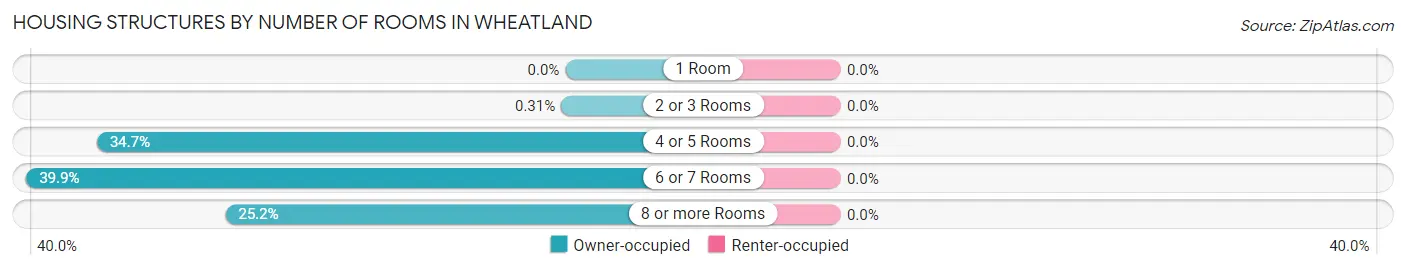
| Number of Rooms | Owner-occupied | Renter-occupied |
| 1 Room | 0 (0.0%) | 0 (0.0%) |
| 2 or 3 Rooms | 1 (0.3%) | 0 (0.0%) |
| 4 or 5 Rooms | 113 (34.7%) | 0 (0.0%) |
| 6 or 7 Rooms | 130 (39.9%) | 0 (0.0%) |
| 8 or more Rooms | 82 (25.2%) | 0 (0.0%) |
| Total | 326 (100.0%) | 0 (0.0%) |
Housing Structure by Heating Type in Wheatland
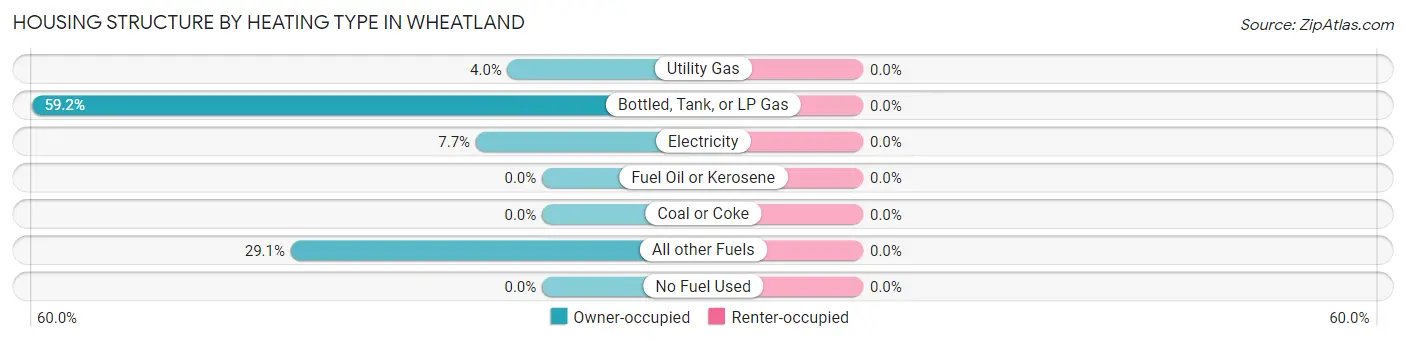
| Heating Type | Owner-occupied | Renter-occupied |
| Utility Gas | 13 (4.0%) | 0 (0.0%) |
| Bottled, Tank, or LP Gas | 193 (59.2%) | 0 (0.0%) |
| Electricity | 25 (7.7%) | 0 (0.0%) |
| Fuel Oil or Kerosene | 0 (0.0%) | 0 (0.0%) |
| Coal or Coke | 0 (0.0%) | 0 (0.0%) |
| All other Fuels | 95 (29.1%) | 0 (0.0%) |
| No Fuel Used | 0 (0.0%) | 0 (0.0%) |
| Total | 326 (100.0%) | 0 (0.0%) |
Household Vehicle Usage in Wheatland
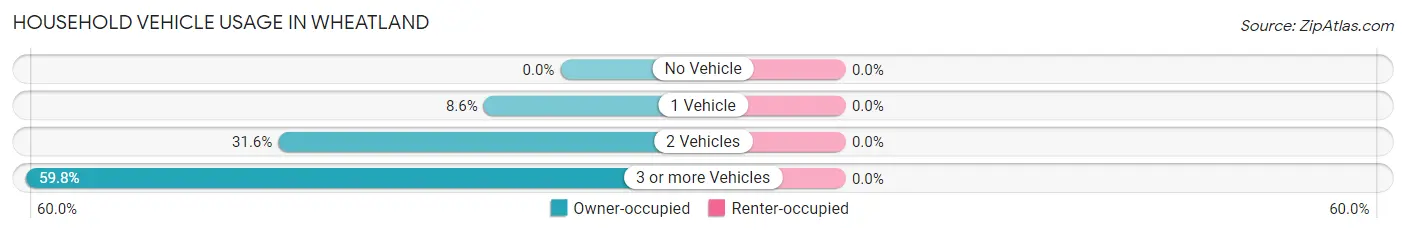
| Vehicles per Household | Owner-occupied | Renter-occupied |
| No Vehicle | 0 (0.0%) | 0 (0.0%) |
| 1 Vehicle | 28 (8.6%) | 0 (0.0%) |
| 2 Vehicles | 103 (31.6%) | 0 (0.0%) |
| 3 or more Vehicles | 195 (59.8%) | 0 (0.0%) |
| Total | 326 (100.0%) | 0 (0.0%) |
Real Estate & Mortgages in Wheatland
Real Estate and Mortgage Overview in Wheatland
| Characteristic | Without Mortgage | With Mortgage |
| Housing Units | 101 | 225 |
| Median Property Value | $827,100 | $416,700 |
| Median Household Income | - | - |
| Monthly Housing Costs | $540 | $22 |
| Real Estate Taxes | $2,554 | $33 |
Property Value by Mortgage Status in Wheatland
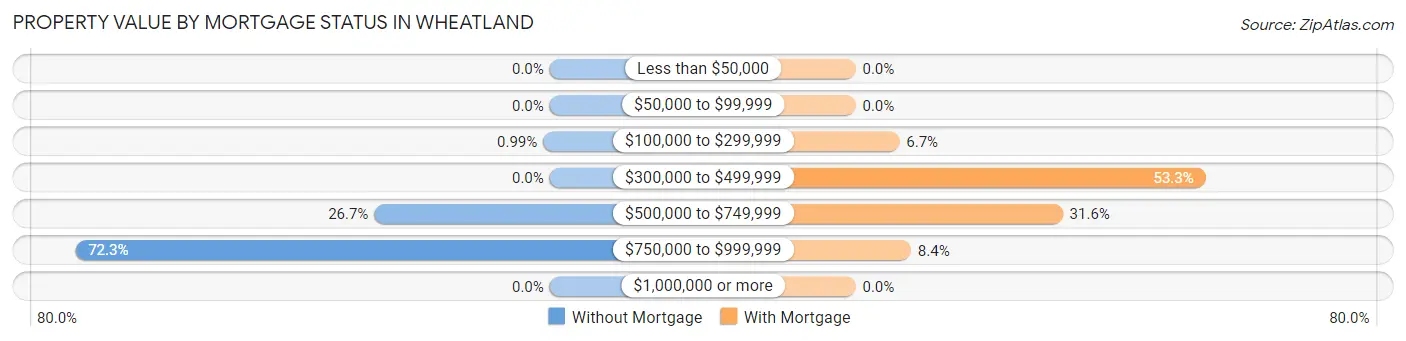
| Property Value | Without Mortgage | With Mortgage |
| Less than $50,000 | 0 (0.0%) | 0 (0.0%) |
| $50,000 to $99,999 | 0 (0.0%) | 0 (0.0%) |
| $100,000 to $299,999 | 1 (1.0%) | 15 (6.7%) |
| $300,000 to $499,999 | 0 (0.0%) | 120 (53.3%) |
| $500,000 to $749,999 | 27 (26.7%) | 71 (31.6%) |
| $750,000 to $999,999 | 73 (72.3%) | 19 (8.4%) |
| $1,000,000 or more | 0 (0.0%) | 0 (0.0%) |
| Total | 101 (100.0%) | 225 (100.0%) |
Household Income by Mortgage Status in Wheatland
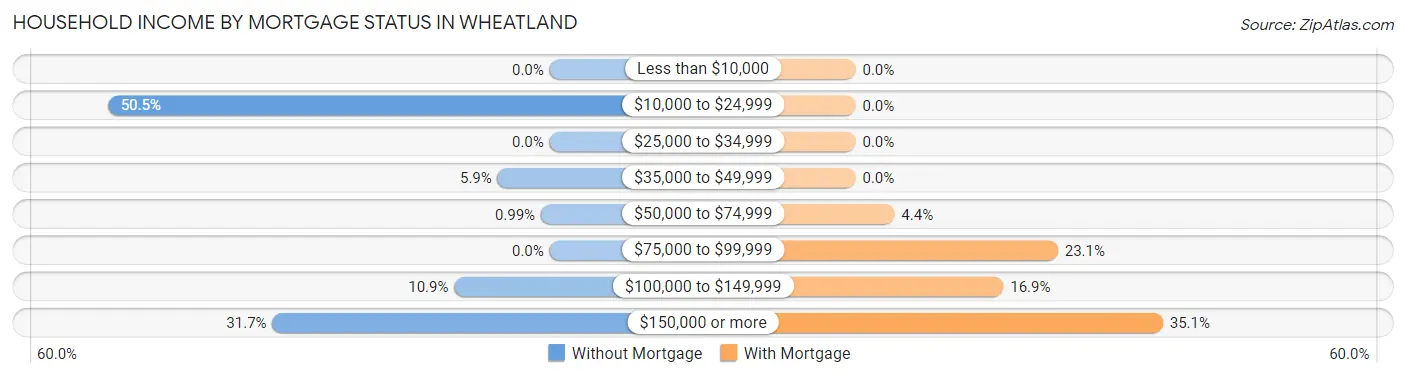
| Household Income | Without Mortgage | With Mortgage |
| Less than $10,000 | 0 (0.0%) | 0 (0.0%) |
| $10,000 to $24,999 | 51 (50.5%) | 0 (0.0%) |
| $25,000 to $34,999 | 0 (0.0%) | 0 (0.0%) |
| $35,000 to $49,999 | 6 (5.9%) | 0 (0.0%) |
| $50,000 to $74,999 | 1 (1.0%) | 10 (4.4%) |
| $75,000 to $99,999 | 0 (0.0%) | 52 (23.1%) |
| $100,000 to $149,999 | 11 (10.9%) | 38 (16.9%) |
| $150,000 or more | 32 (31.7%) | 79 (35.1%) |
| Total | 101 (100.0%) | 225 (100.0%) |
Property Value to Household Income Ratio in Wheatland
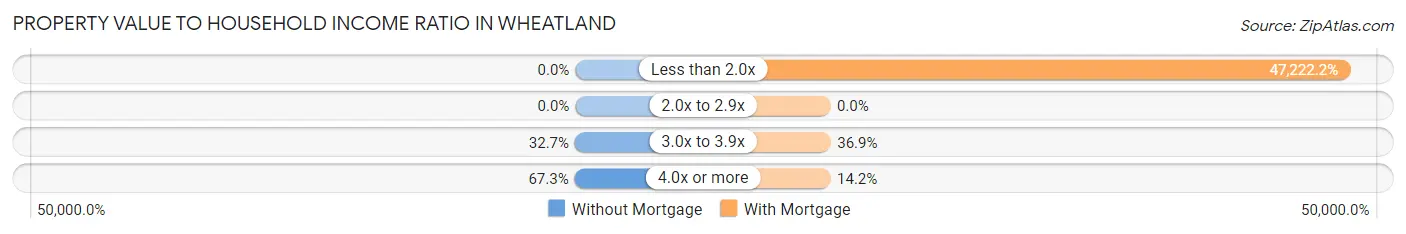
| Value-to-Income Ratio | Without Mortgage | With Mortgage |
| Less than 2.0x | 0 (0.0%) | 106,250 (47,222.2%) |
| 2.0x to 2.9x | 0 (0.0%) | 0 (0.0%) |
| 3.0x to 3.9x | 33 (32.7%) | 83 (36.9%) |
| 4.0x or more | 68 (67.3%) | 32 (14.2%) |
| Total | 101 (100.0%) | 225 (100.0%) |
Real Estate Taxes by Mortgage Status in Wheatland
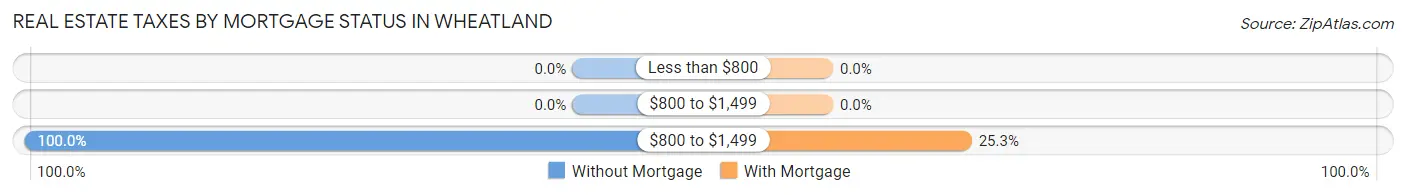
| Property Taxes | Without Mortgage | With Mortgage |
| Less than $800 | 0 (0.0%) | 0 (0.0%) |
| $800 to $1,499 | 0 (0.0%) | 0 (0.0%) |
| $800 to $1,499 | 101 (100.0%) | 57 (25.3%) |
| Total | 101 (100.0%) | 225 (100.0%) |
Health & Disability in Wheatland
Health Insurance Coverage by Age in Wheatland
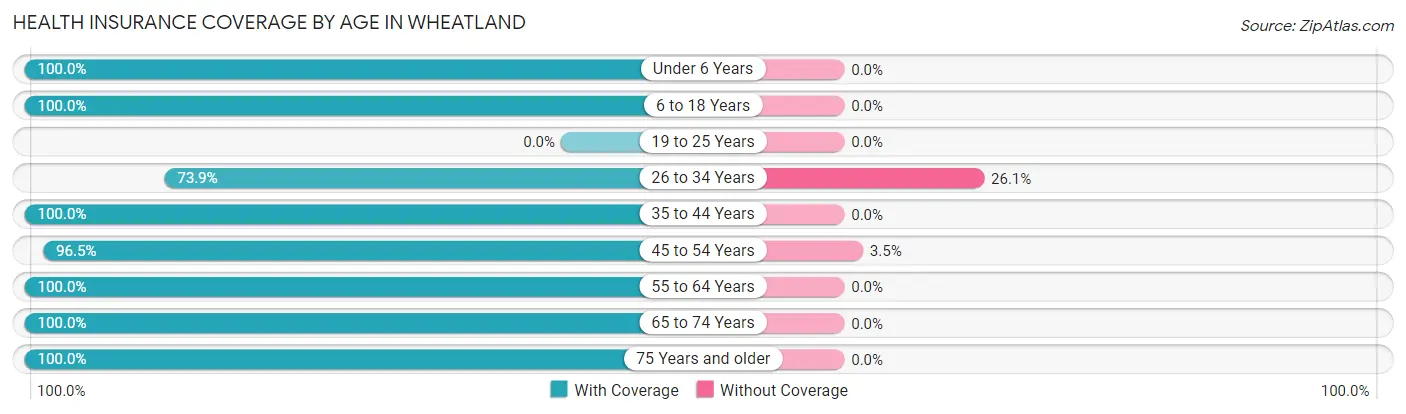
| Age Bracket | With Coverage | Without Coverage |
| Under 6 Years | 73 (100.0%) | 0 (0.0%) |
| 6 to 18 Years | 117 (100.0%) | 0 (0.0%) |
| 19 to 25 Years | 0 (0.0%) | 0 (0.0%) |
| 26 to 34 Years | 156 (73.9%) | 55 (26.1%) |
| 35 to 44 Years | 130 (100.0%) | 0 (0.0%) |
| 45 to 54 Years | 195 (96.5%) | 7 (3.5%) |
| 55 to 64 Years | 129 (100.0%) | 0 (0.0%) |
| 65 to 74 Years | 133 (100.0%) | 0 (0.0%) |
| 75 Years and older | 22 (100.0%) | 0 (0.0%) |
| Total | 955 (93.9%) | 62 (6.1%) |
Health Insurance Coverage by Citizenship Status in Wheatland
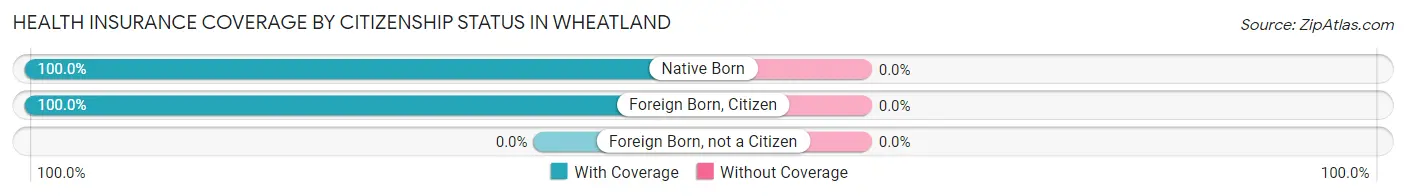
| Citizenship Status | With Coverage | Without Coverage |
| Native Born | 73 (100.0%) | 0 (0.0%) |
| Foreign Born, Citizen | 117 (100.0%) | 0 (0.0%) |
| Foreign Born, not a Citizen | 0 (0.0%) | 0 (0.0%) |
Health Insurance Coverage by Household Income in Wheatland
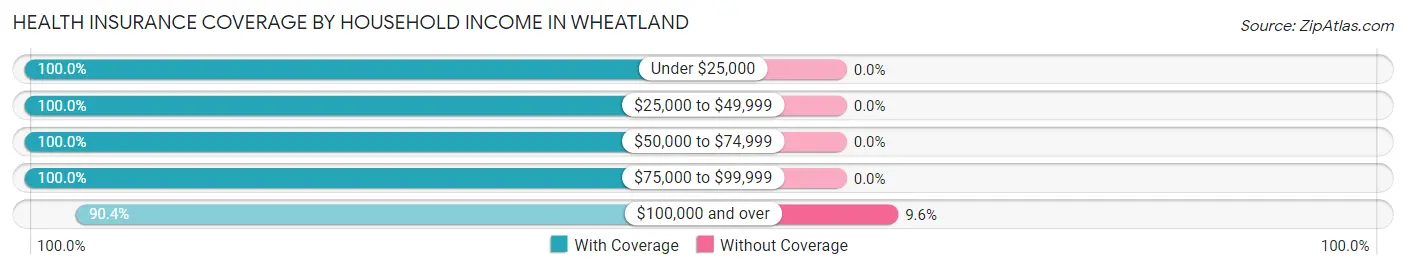
| Household Income | With Coverage | Without Coverage |
| Under $25,000 | 94 (100.0%) | 0 (0.0%) |
| $25,000 to $49,999 | 46 (100.0%) | 0 (0.0%) |
| $50,000 to $74,999 | 161 (100.0%) | 0 (0.0%) |
| $75,000 to $99,999 | 72 (100.0%) | 0 (0.0%) |
| $100,000 and over | 582 (90.4%) | 62 (9.6%) |
Public vs Private Health Insurance Coverage by Age in Wheatland
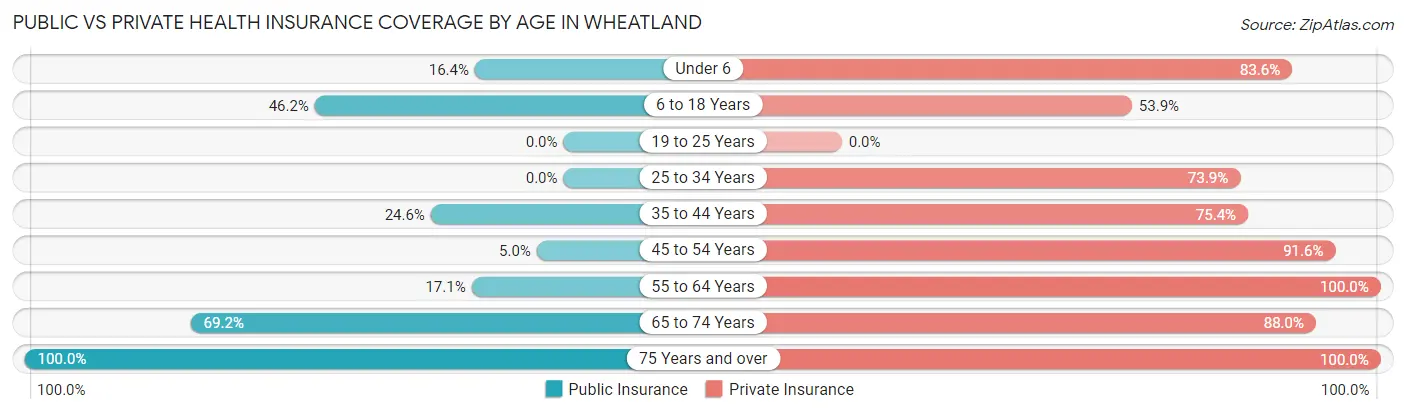
| Age Bracket | Public Insurance | Private Insurance |
| Under 6 | 12 (16.4%) | 61 (83.6%) |
| 6 to 18 Years | 54 (46.2%) | 63 (53.8%) |
| 19 to 25 Years | 0 (0.0%) | 0 (0.0%) |
| 25 to 34 Years | 0 (0.0%) | 156 (73.9%) |
| 35 to 44 Years | 32 (24.6%) | 98 (75.4%) |
| 45 to 54 Years | 10 (5.0%) | 185 (91.6%) |
| 55 to 64 Years | 22 (17.1%) | 129 (100.0%) |
| 65 to 74 Years | 92 (69.2%) | 117 (88.0%) |
| 75 Years and over | 22 (100.0%) | 22 (100.0%) |
| Total | 244 (24.0%) | 831 (81.7%) |
Disability Status by Sex by Age in Wheatland
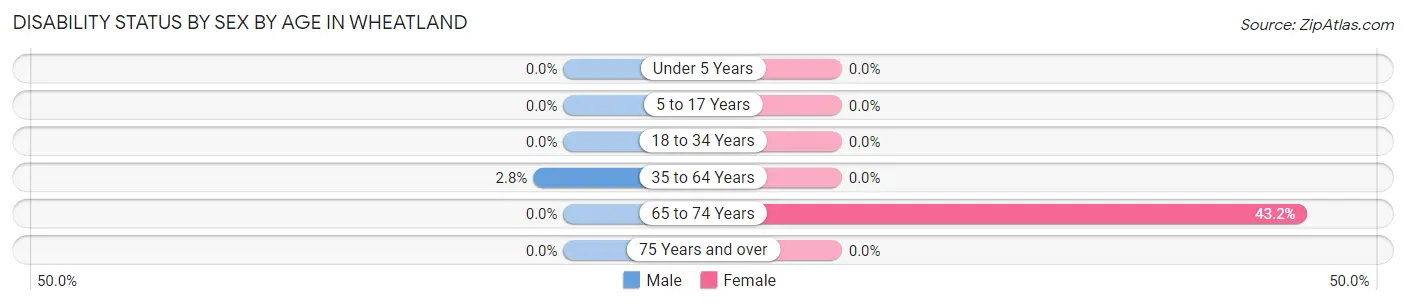
| Age Bracket | Male | Female |
| Under 5 Years | 0 (0.0%) | 0 (0.0%) |
| 5 to 17 Years | 0 (0.0%) | 0 (0.0%) |
| 18 to 34 Years | 0 (0.0%) | 0 (0.0%) |
| 35 to 64 Years | 6 (2.8%) | 0 (0.0%) |
| 65 to 74 Years | 0 (0.0%) | 35 (43.2%) |
| 75 Years and over | 0 (0.0%) | 0 (0.0%) |
Disability Class by Sex by Age in Wheatland
Disability Class: Hearing Difficulty
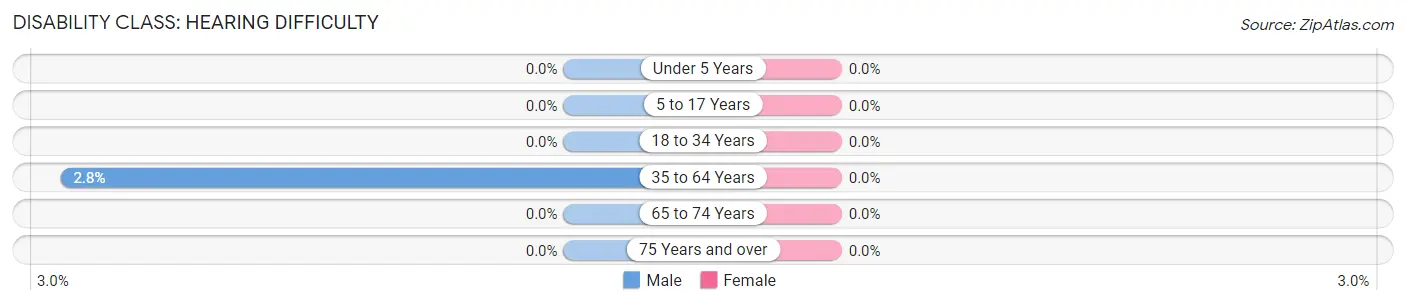
| Age Bracket | Male | Female |
| Under 5 Years | 0 (0.0%) | 0 (0.0%) |
| 5 to 17 Years | 0 (0.0%) | 0 (0.0%) |
| 18 to 34 Years | 0 (0.0%) | 0 (0.0%) |
| 35 to 64 Years | 6 (2.8%) | 0 (0.0%) |
| 65 to 74 Years | 0 (0.0%) | 0 (0.0%) |
| 75 Years and over | 0 (0.0%) | 0 (0.0%) |
Disability Class: Vision Difficulty
| Age Bracket | Male | Female |
| Under 5 Years | 0 (0.0%) | 0 (0.0%) |
| 5 to 17 Years | 0 (0.0%) | 0 (0.0%) |
| 18 to 34 Years | 0 (0.0%) | 0 (0.0%) |
| 35 to 64 Years | 0 (0.0%) | 0 (0.0%) |
| 65 to 74 Years | 0 (0.0%) | 0 (0.0%) |
| 75 Years and over | 0 (0.0%) | 0 (0.0%) |
Disability Class: Cognitive Difficulty
| Age Bracket | Male | Female |
| 5 to 17 Years | 0 (0.0%) | 0 (0.0%) |
| 18 to 34 Years | 0 (0.0%) | 0 (0.0%) |
| 35 to 64 Years | 0 (0.0%) | 0 (0.0%) |
| 65 to 74 Years | 0 (0.0%) | 0 (0.0%) |
| 75 Years and over | 0 (0.0%) | 0 (0.0%) |
Disability Class: Ambulatory Difficulty
| Age Bracket | Male | Female |
| 5 to 17 Years | 0 (0.0%) | 0 (0.0%) |
| 18 to 34 Years | 0 (0.0%) | 0 (0.0%) |
| 35 to 64 Years | 0 (0.0%) | 0 (0.0%) |
| 65 to 74 Years | 0 (0.0%) | 35 (43.2%) |
| 75 Years and over | 0 (0.0%) | 0 (0.0%) |
Disability Class: Self-Care Difficulty
| Age Bracket | Male | Female |
| 5 to 17 Years | 0 (0.0%) | 0 (0.0%) |
| 18 to 34 Years | 0 (0.0%) | 0 (0.0%) |
| 35 to 64 Years | 0 (0.0%) | 0 (0.0%) |
| 65 to 74 Years | 0 (0.0%) | 35 (43.2%) |
| 75 Years and over | 0 (0.0%) | 0 (0.0%) |
Technology Access in Wheatland
Computing Device Access in Wheatland
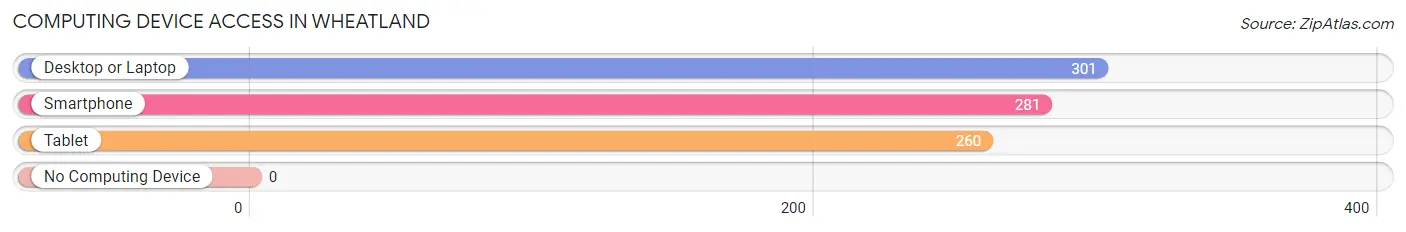
| Device Type | # Households | % Households |
| Desktop or Laptop | 301 | 92.3% |
| Smartphone | 281 | 86.2% |
| Tablet | 260 | 79.7% |
| No Computing Device | 0 | 0.0% |
| Total | 326 | 100.0% |
Internet Access in Wheatland
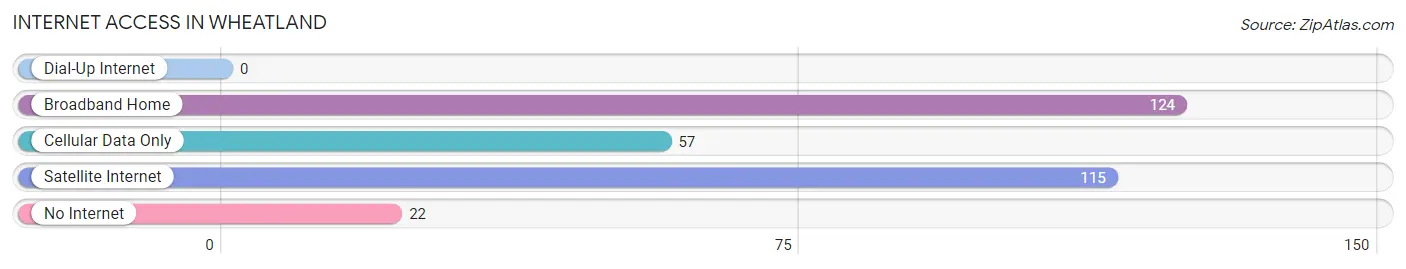
| Internet Type | # Households | % Households |
| Dial-Up Internet | 0 | 0.0% |
| Broadband Home | 124 | 38.0% |
| Cellular Data Only | 57 | 17.5% |
| Satellite Internet | 115 | 35.3% |
| No Internet | 22 | 6.8% |
| Total | 326 | 100.0% |
Wheatland Summary
Wheatland, Montana is a small town located in the southeastern corner of the state, near the border with Wyoming. It is part of the Great Plains region of the United States and is situated in the Yellowstone River Valley. The town is located in the heart of the Yellowstone Valley, which is known for its rich agricultural land and abundant wildlife.
Geography
Wheatland is located in the Yellowstone River Valley, which is part of the Great Plains region of the United States. The town is situated in the southeastern corner of Montana, near the border with Wyoming. The Yellowstone River runs through the town, providing a source of water for the local agricultural industry. The town is surrounded by rolling hills and grasslands, with the Big Horn Mountains to the west and the Pryor Mountains to the east. The climate in Wheatland is semi-arid, with hot summers and cold winters.
Economy
Wheatland’s economy is largely based on agriculture. The town is home to several large farms, which produce a variety of crops, including wheat, barley, oats, and hay. The local agricultural industry also produces beef, pork, and poultry. In addition to farming, Wheatland is home to several small businesses, including a grocery store, a hardware store, and a few restaurants.
Demographics
As of the 2010 census, Wheatland had a population of 1,072. The town is predominantly white, with a small Hispanic population. The median household income in Wheatland is $41,250, and the median age is 44. The town has a low unemployment rate of 3.2%.
History
Wheatland was founded in 1882 by a group of settlers from the Midwest. The town was named after the abundance of wheat that was grown in the area. In the early 1900s, the town was a major stop on the Northern Pacific Railroad. The railroad brought in new settlers and businesses, and the town grew rapidly. In the 1920s, the town was home to several large farms, which produced a variety of crops.
Wheatland has a long history of agriculture and ranching. The town is still home to several large farms, which produce a variety of crops, including wheat, barley, oats, and hay. The local agricultural industry also produces beef, pork, and poultry. In addition to farming, Wheatland is home to several small businesses, including a grocery store, a hardware store, and a few restaurants.
Conclusion
Wheatland, Montana is a small town located in the southeastern corner of the state, near the border with Wyoming. It is part of the Great Plains region of the United States and is situated in the Yellowstone River Valley. The town is surrounded by rolling hills and grasslands, with the Big Horn Mountains to the west and the Pryor Mountains to the east. The economy of Wheatland is largely based on agriculture, with several large farms producing a variety of crops. The town also has a small business sector, with a grocery store, a hardware store, and a few restaurants. The population of Wheatland is predominantly white, with a small Hispanic population. The town has a long history of agriculture and ranching, and is still home to several large farms.
Common Questions
What is Per Capita Income in Wheatland?
Per Capita income in Wheatland is $45,039.
What is the Median Family Income in Wheatland?
Median Family Income in Wheatland is $91,731.
What is the Median Household income in Wheatland?
Median Household Income in Wheatland is $105,500.
What is Income or Wage Gap in Wheatland?
Income or Wage Gap in Wheatland is 53.3%.
Women in Wheatland earn 46.7 cents for every dollar earned by a man.
What is Inequality or Gini Index in Wheatland?
Inequality or Gini Index in Wheatland is 0.37.
What is the Total Population of Wheatland?
Total Population of Wheatland is 1,017.
What is the Total Male Population of Wheatland?
Total Male Population of Wheatland is 454.
What is the Total Female Population of Wheatland?
Total Female Population of Wheatland is 563.
What is the Ratio of Males per 100 Females in Wheatland?
There are 80.64 Males per 100 Females in Wheatland.
What is the Ratio of Females per 100 Males in Wheatland?
There are 124.01 Females per 100 Males in Wheatland.
What is the Median Population Age in Wheatland?
Median Population Age in Wheatland is 44.2 Years.
What is the Average Family Size in Wheatland
Average Family Size in Wheatland is 3.0 People.
What is the Average Household Size in Wheatland
Average Household Size in Wheatland is 3.1 People.
How Large is the Labor Force in Wheatland?
There are 618 People in the Labor Forcein in Wheatland.
What is the Percentage of People in the Labor Force in Wheatland?
71.1% of People are in the Labor Force in Wheatland.