Hungry Horse, MT Map & Demographics
Hungry Horse Map
Hungry Horse Overview
$22,488
PER CAPITA INCOME
$32,163
AVG FAMILY INCOME
$38,750
AVG HOUSEHOLD INCOME
0.41
INEQUALITY / GINI INDEX
891
TOTAL POPULATION
614
MALE POPULATION
277
FEMALE POPULATION
221.66
MALES / 100 FEMALES
45.11
FEMALES / 100 MALES
33.9
MEDIAN AGE
2.8
AVG FAMILY SIZE
2.2
AVG HOUSEHOLD SIZE
325
LABOR FORCE [ PEOPLE ]
53.1%
PERCENT IN LABOR FORCE
Hungry Horse Zip Codes
Hungry Horse Area Codes
Income in Hungry Horse
Income Overview in Hungry Horse
Per Capita Income in Hungry Horse is $22,488, while median incomes of families and households are $32,163 and $38,750 respectively.
| Characteristic | Number | Measure |
| Per Capita Income | 891 | $22,488 |
| Median Family Income | 231 | $32,163 |
| Mean Family Income | 231 | $53,538 |
| Median Household Income | 386 | $38,750 |
| Mean Household Income | 386 | $48,610 |
| Income Deficit | 231 | $0 |
| Wage / Income Gap (%) | 891 | 0.00% |
| Wage / Income Gap ($) | 891 | 100.00¢ per $1 |
| Gini / Inequality Index | 891 | 0.41 |
Earnings by Sex in Hungry Horse
| Sex | Number | Average Earnings |
| Male | 210 (64.6%) | $0 |
| Female | 115 (35.4%) | $0 |
| Total | 325 (100.0%) | $0 |
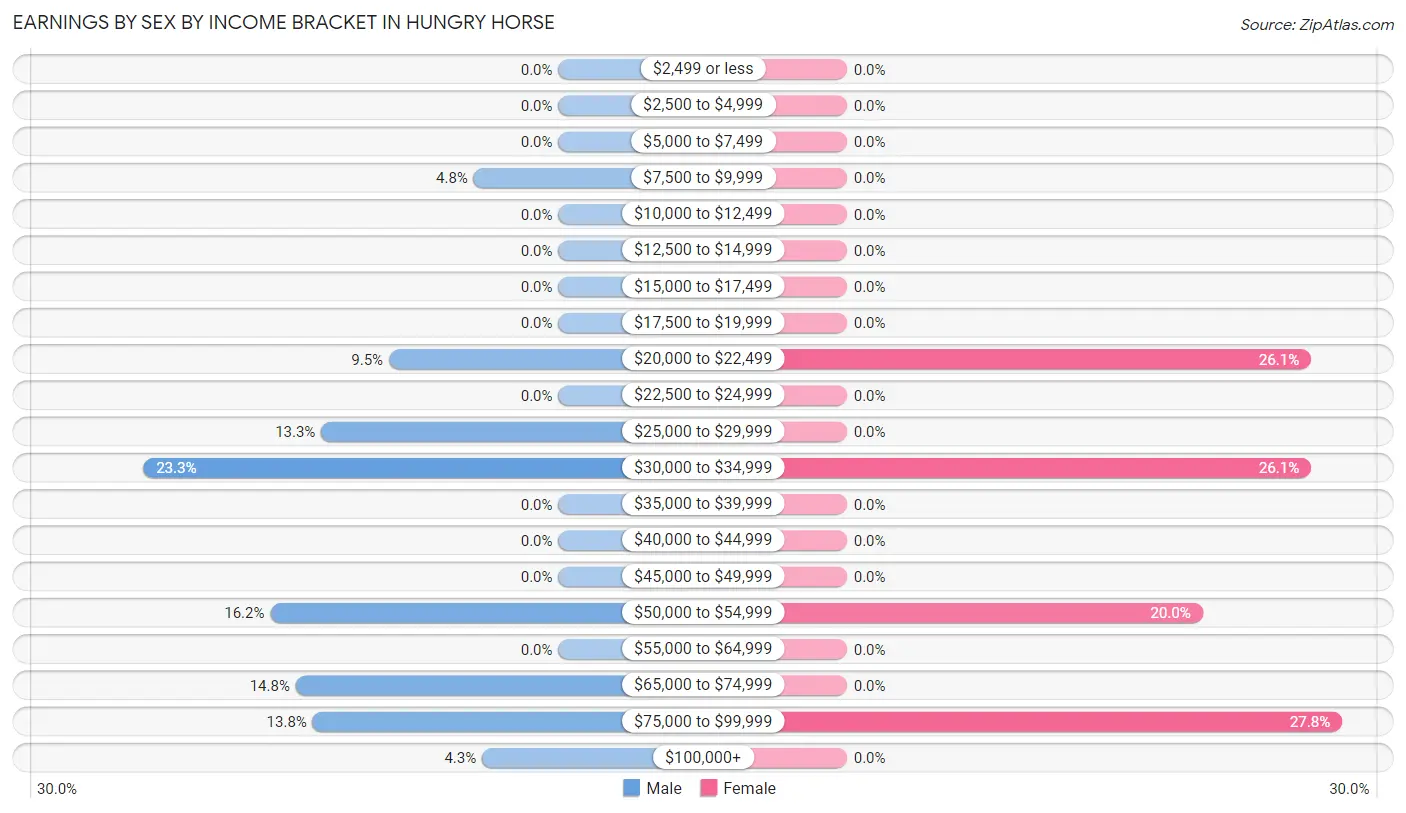
Earnings by Sex by Income Bracket in Hungry Horse
The most common earnings brackets in Hungry Horse are $30,000 to $34,999 for men (49 | 23.3%) and $75,000 to $99,999 for women (32 | 27.8%).
| Income | Male | Female |
| $2,499 or less | 0 (0.0%) | 0 (0.0%) |
| $2,500 to $4,999 | 0 (0.0%) | 0 (0.0%) |
| $5,000 to $7,499 | 0 (0.0%) | 0 (0.0%) |
| $7,500 to $9,999 | 10 (4.8%) | 0 (0.0%) |
| $10,000 to $12,499 | 0 (0.0%) | 0 (0.0%) |
| $12,500 to $14,999 | 0 (0.0%) | 0 (0.0%) |
| $15,000 to $17,499 | 0 (0.0%) | 0 (0.0%) |
| $17,500 to $19,999 | 0 (0.0%) | 0 (0.0%) |
| $20,000 to $22,499 | 20 (9.5%) | 30 (26.1%) |
| $22,500 to $24,999 | 0 (0.0%) | 0 (0.0%) |
| $25,000 to $29,999 | 28 (13.3%) | 0 (0.0%) |
| $30,000 to $34,999 | 49 (23.3%) | 30 (26.1%) |
| $35,000 to $39,999 | 0 (0.0%) | 0 (0.0%) |
| $40,000 to $44,999 | 0 (0.0%) | 0 (0.0%) |
| $45,000 to $49,999 | 0 (0.0%) | 0 (0.0%) |
| $50,000 to $54,999 | 34 (16.2%) | 23 (20.0%) |
| $55,000 to $64,999 | 0 (0.0%) | 0 (0.0%) |
| $65,000 to $74,999 | 31 (14.8%) | 0 (0.0%) |
| $75,000 to $99,999 | 29 (13.8%) | 32 (27.8%) |
| $100,000+ | 9 (4.3%) | 0 (0.0%) |
| Total | 210 (100.0%) | 115 (100.0%) |
Earnings by Sex by Educational Attainment in Hungry Horse
| Educational Attainment | Male Income | Female Income |
| Less than High School | - | - |
| High School Diploma | - | - |
| College or Associate's Degree | - | - |
| Bachelor's Degree | - | - |
| Graduate Degree | - | - |
| Total | $50,221 | $51,359 |
Family Income in Hungry Horse
Family Income Brackets in Hungry Horse
According to the Hungry Horse family income data, there are 106 families falling into the $25,000 to $34,999 income range, which is the most common income bracket and makes up 45.9% of all families.
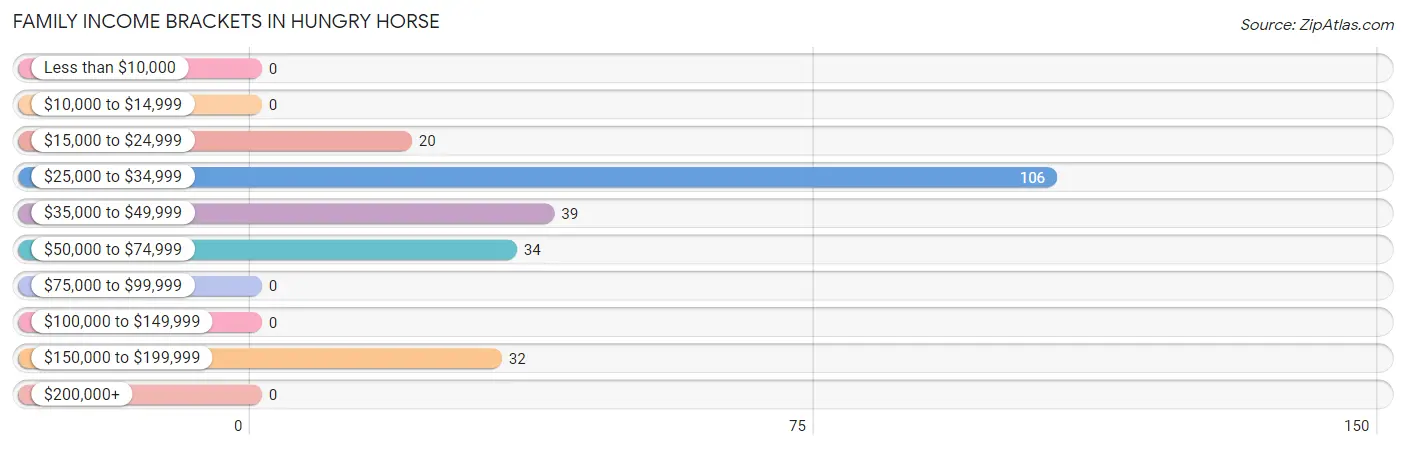
| Income Bracket | # Families | % Families |
| Less than $10,000 | 0 | 0.0% |
| $10,000 to $14,999 | 0 | 0.0% |
| $15,000 to $24,999 | 20 | 8.7% |
| $25,000 to $34,999 | 106 | 45.9% |
| $35,000 to $49,999 | 39 | 16.9% |
| $50,000 to $74,999 | 34 | 14.7% |
| $75,000 to $99,999 | 0 | 0.0% |
| $100,000 to $149,999 | 0 | 0.0% |
| $150,000 to $199,999 | 32 | 13.9% |
| $200,000+ | 0 | 0.0% |
Family Income by Famaliy Size in Hungry Horse
2-person families (155 | 67.1%) account for the highest median family income in Hungry Horse with $47,371 per family, while 2-person families (155 | 67.1%) have the highest median income of $23,686 per family member.
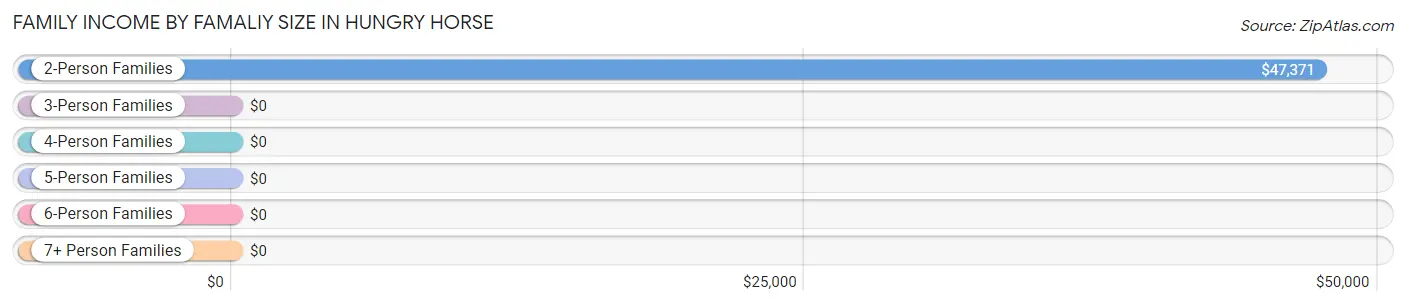
| Income Bracket | # Families | Median Income |
| 2-Person Families | 155 (67.1%) | $47,371 |
| 3-Person Families | 28 (12.1%) | $0 |
| 4-Person Families | 35 (15.1%) | $0 |
| 5-Person Families | 13 (5.6%) | $0 |
| 6-Person Families | 0 (0.0%) | $0 |
| 7+ Person Families | 0 (0.0%) | $0 |
| Total | 231 (100.0%) | $32,163 |
Family Income by Number of Earners in Hungry Horse
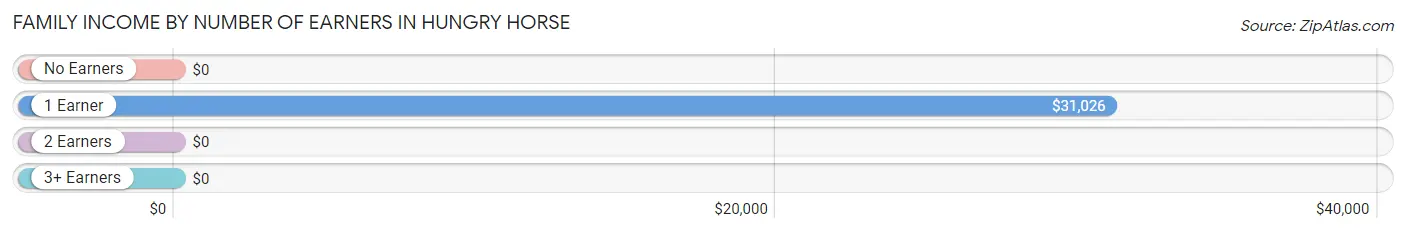
| Number of Earners | # Families | Median Income |
| No Earners | 39 (16.9%) | $0 |
| 1 Earner | 160 (69.3%) | $31,026 |
| 2 Earners | 32 (13.9%) | $0 |
| 3+ Earners | 0 (0.0%) | $0 |
| Total | 231 (100.0%) | $32,163 |
Household Income in Hungry Horse
Household Income Brackets in Hungry Horse
With 97 households falling in the category, the $15,000 to $24,999 income range is the most frequent in Hungry Horse, accounting for 25.1% of all households.
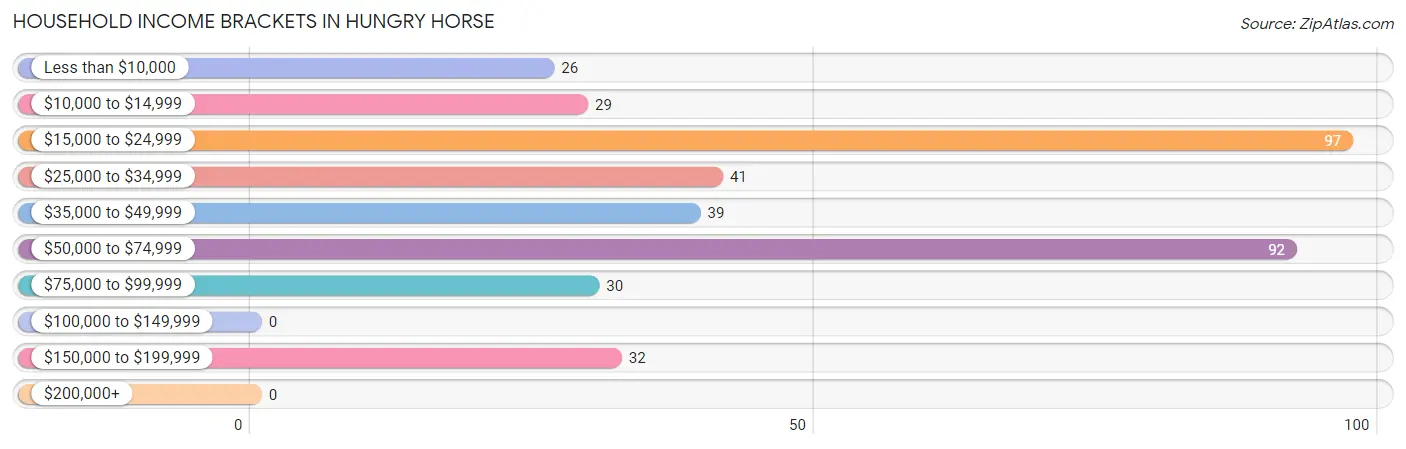
| Income Bracket | # Households | % Households |
| Less than $10,000 | 26 | 6.7% |
| $10,000 to $14,999 | 29 | 7.5% |
| $15,000 to $24,999 | 97 | 25.1% |
| $25,000 to $34,999 | 41 | 10.6% |
| $35,000 to $49,999 | 39 | 10.1% |
| $50,000 to $74,999 | 92 | 23.8% |
| $75,000 to $99,999 | 30 | 7.8% |
| $100,000 to $149,999 | 0 | 0.0% |
| $150,000 to $199,999 | 32 | 8.3% |
| $200,000+ | 0 | 0.0% |
Household Income by Householder Age in Hungry Horse
The median household income in Hungry Horse is $38,750, with the highest median household income of $23,912 found in the 65+ years age bracket for the primary householder. A total of 145 households (37.6%) fall into this category. Meanwhile, the 15 to 24 years age bracket for the primary householder has the lowest median household income of $0, with 30 households (7.8%) in this group.
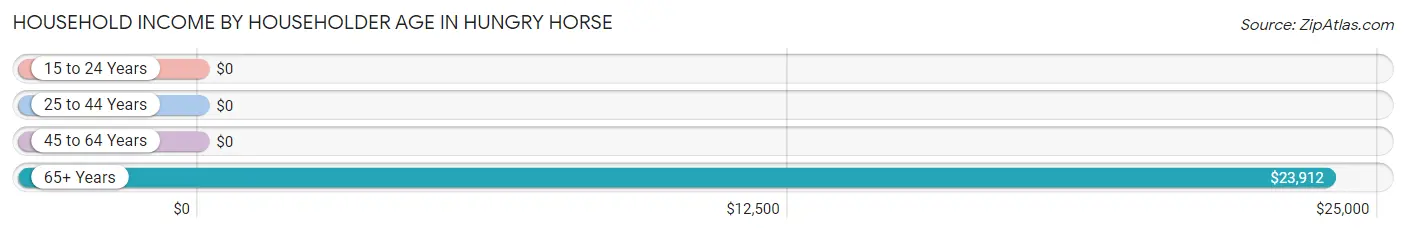
| Income Bracket | # Households | Median Income |
| 15 to 24 Years | 30 (7.8%) | $0 |
| 25 to 44 Years | 80 (20.7%) | $0 |
| 45 to 64 Years | 131 (33.9%) | $0 |
| 65+ Years | 145 (37.6%) | $23,912 |
| Total | 386 (100.0%) | $38,750 |
Poverty in Hungry Horse
Income Below Poverty by Sex and Age in Hungry Horse
With 12.2% poverty level for males and 24.5% for females among the residents of Hungry Horse, 18 to 24 year old males and 35 to 44 year old females are the most vulnerable to poverty, with 19 males (100.0%) and 13 females (100.0%) in their respective age groups living below the poverty level.
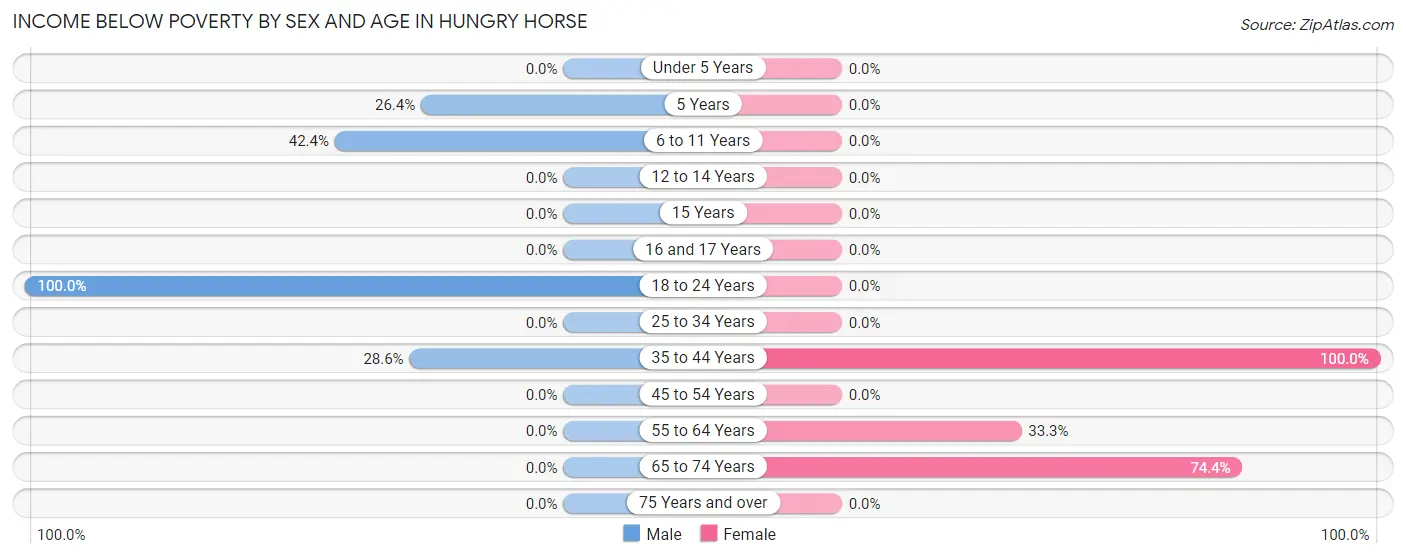
| Age Bracket | Male | Female |
| Under 5 Years | 0 (0.0%) | 0 (0.0%) |
| 5 Years | 14 (26.4%) | 0 (0.0%) |
| 6 to 11 Years | 28 (42.4%) | 0 (0.0%) |
| 12 to 14 Years | 0 (0.0%) | 0 (0.0%) |
| 15 Years | 0 (0.0%) | 0 (0.0%) |
| 16 and 17 Years | 0 (0.0%) | 0 (0.0%) |
| 18 to 24 Years | 19 (100.0%) | 0 (0.0%) |
| 25 to 34 Years | 0 (0.0%) | 0 (0.0%) |
| 35 to 44 Years | 14 (28.6%) | 13 (100.0%) |
| 45 to 54 Years | 0 (0.0%) | 0 (0.0%) |
| 55 to 64 Years | 0 (0.0%) | 26 (33.3%) |
| 65 to 74 Years | 0 (0.0%) | 29 (74.4%) |
| 75 Years and over | 0 (0.0%) | 0 (0.0%) |
| Total | 75 (12.2%) | 68 (24.5%) |
Income Above Poverty by Sex and Age in Hungry Horse
According to the poverty statistics in Hungry Horse, males aged under 5 years and females aged 18 to 24 years are the age groups that are most secure financially, with 100.0% of males and 100.0% of females in these age groups living above the poverty line.
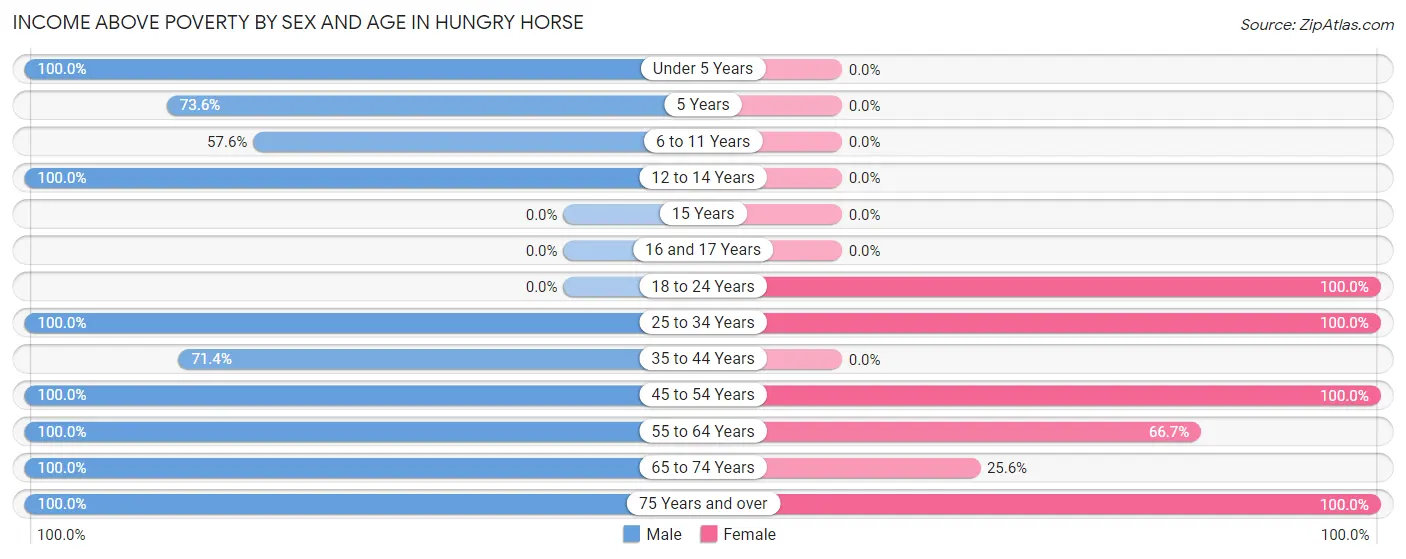
| Age Bracket | Male | Female |
| Under 5 Years | 62 (100.0%) | 0 (0.0%) |
| 5 Years | 39 (73.6%) | 0 (0.0%) |
| 6 to 11 Years | 38 (57.6%) | 0 (0.0%) |
| 12 to 14 Years | 98 (100.0%) | 0 (0.0%) |
| 15 Years | 0 (0.0%) | 0 (0.0%) |
| 16 and 17 Years | 0 (0.0%) | 0 (0.0%) |
| 18 to 24 Years | 0 (0.0%) | 30 (100.0%) |
| 25 to 34 Years | 60 (100.0%) | 62 (100.0%) |
| 35 to 44 Years | 35 (71.4%) | 0 (0.0%) |
| 45 to 54 Years | 82 (100.0%) | 32 (100.0%) |
| 55 to 64 Years | 9 (100.0%) | 52 (66.7%) |
| 65 to 74 Years | 77 (100.0%) | 10 (25.6%) |
| 75 Years and over | 39 (100.0%) | 23 (100.0%) |
| Total | 539 (87.8%) | 209 (75.4%) |
Income Below Poverty Among Married-Couple Families in Hungry Horse
The poverty statistics for married-couple families in Hungry Horse show that 8.9% or 13 of the total 146 families live below the poverty line. Families with 3 or 4 children have the highest poverty rate of 100.0%, comprising of 13 families. On the other hand, families with no children have the lowest poverty rate of 0.0%, which includes 0 families.
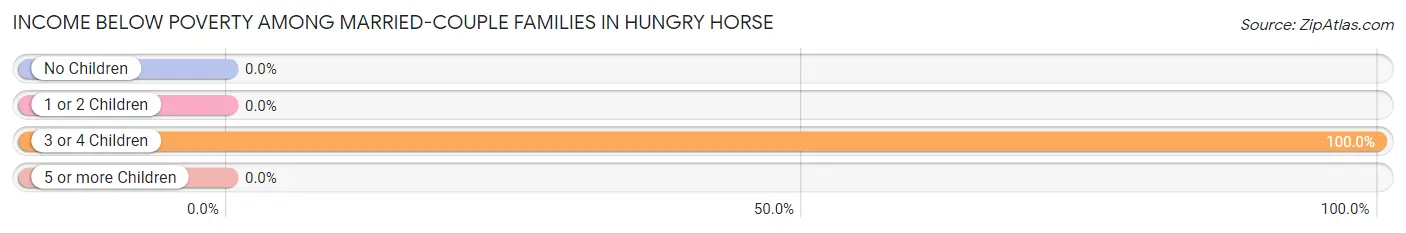
| Children | Above Poverty | Below Poverty |
| No Children | 105 (100.0%) | 0 (0.0%) |
| 1 or 2 Children | 28 (100.0%) | 0 (0.0%) |
| 3 or 4 Children | 0 (0.0%) | 13 (100.0%) |
| 5 or more Children | 0 (0.0%) | 0 (0.0%) |
| Total | 133 (91.1%) | 13 (8.9%) |
Income Below Poverty Among Single-Parent Households in Hungry Horse
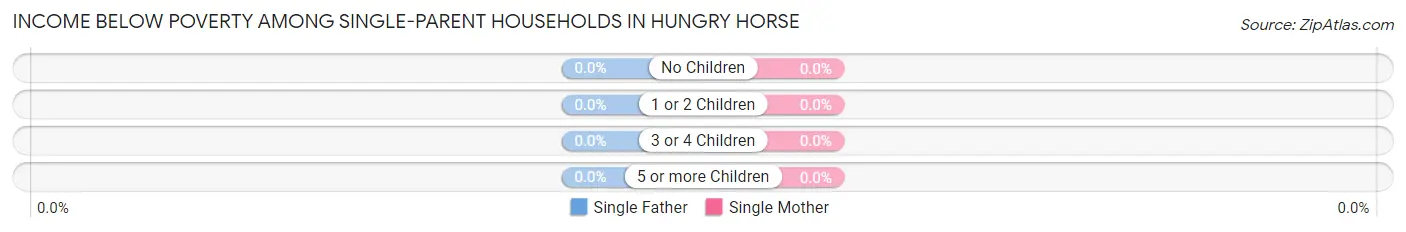
| Children | Single Father | Single Mother |
| No Children | 0 (0.0%) | 0 (0.0%) |
| 1 or 2 Children | 0 (0.0%) | 0 (0.0%) |
| 3 or 4 Children | 0 (0.0%) | 0 (0.0%) |
| 5 or more Children | 0 (0.0%) | 0 (0.0%) |
| Total | 0 (0.0%) | 0 (0.0%) |
Income Below Poverty Among Married-Couple vs Single-Parent Households in Hungry Horse
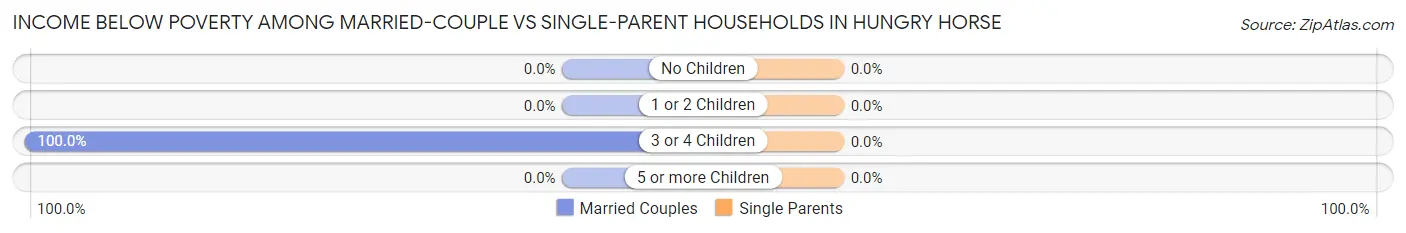
| Children | Married-Couple Families | Single-Parent Households |
| No Children | 0 (0.0%) | 0 (0.0%) |
| 1 or 2 Children | 0 (0.0%) | 0 (0.0%) |
| 3 or 4 Children | 13 (100.0%) | 0 (0.0%) |
| 5 or more Children | 0 (0.0%) | 0 (0.0%) |
| Total | 13 (8.9%) | 0 (0.0%) |
Race in Hungry Horse
The most populous races in Hungry Horse are White / Caucasian (865 | 97.1%), and Native / Alaskan (26 | 2.9%).
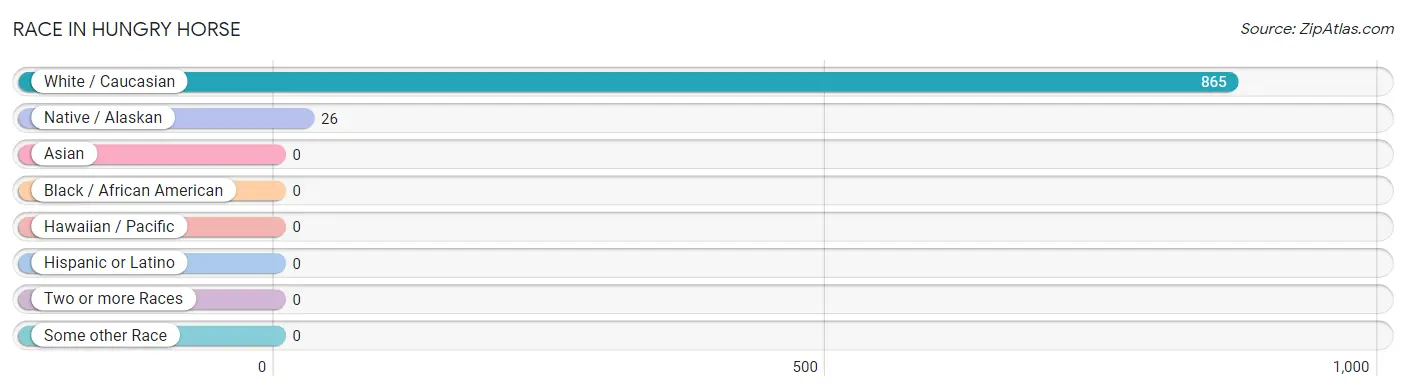
| Race | # Population | % Population |
| Asian | 0 | 0.0% |
| Black / African American | 0 | 0.0% |
| Hawaiian / Pacific | 0 | 0.0% |
| Hispanic or Latino | 0 | 0.0% |
| Native / Alaskan | 26 | 2.9% |
| White / Caucasian | 865 | 97.1% |
| Two or more Races | 0 | 0.0% |
| Some other Race | 0 | 0.0% |
| Total | 891 | 100.0% |
Ancestry in Hungry Horse
The most populous ancestries reported in Hungry Horse are English (221 | 24.8%), German (132 | 14.8%), Dutch (115 | 12.9%), Norwegian (99 | 11.1%), and Italian (84 | 9.4%), together accounting for 73.1% of all Hungry Horse residents.
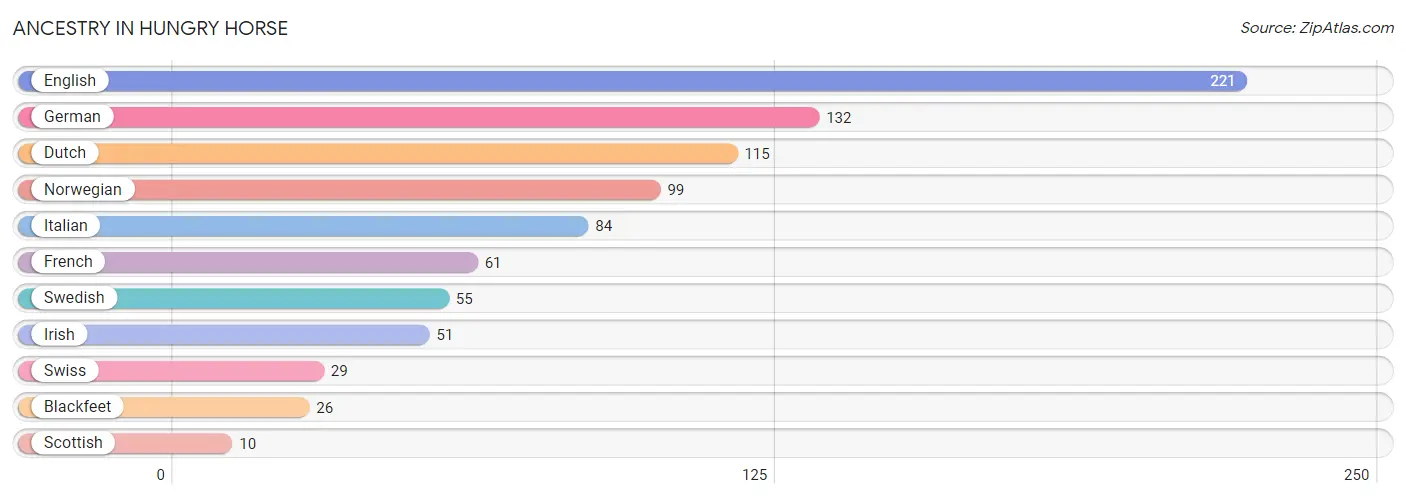
| Ancestry | # Population | % Population |
| Blackfeet | 26 | 2.9% |
| Dutch | 115 | 12.9% |
| English | 221 | 24.8% |
| French | 61 | 6.9% |
| German | 132 | 14.8% |
| Irish | 51 | 5.7% |
| Italian | 84 | 9.4% |
| Norwegian | 99 | 11.1% |
| Scottish | 10 | 1.1% |
| Swedish | 55 | 6.2% |
| Swiss | 29 | 3.3% | View All 11 Rows |
Immigrants in Hungry Horse

| Immigration Origin | # Population | % Population | View All 0 Rows |
Sex and Age in Hungry Horse
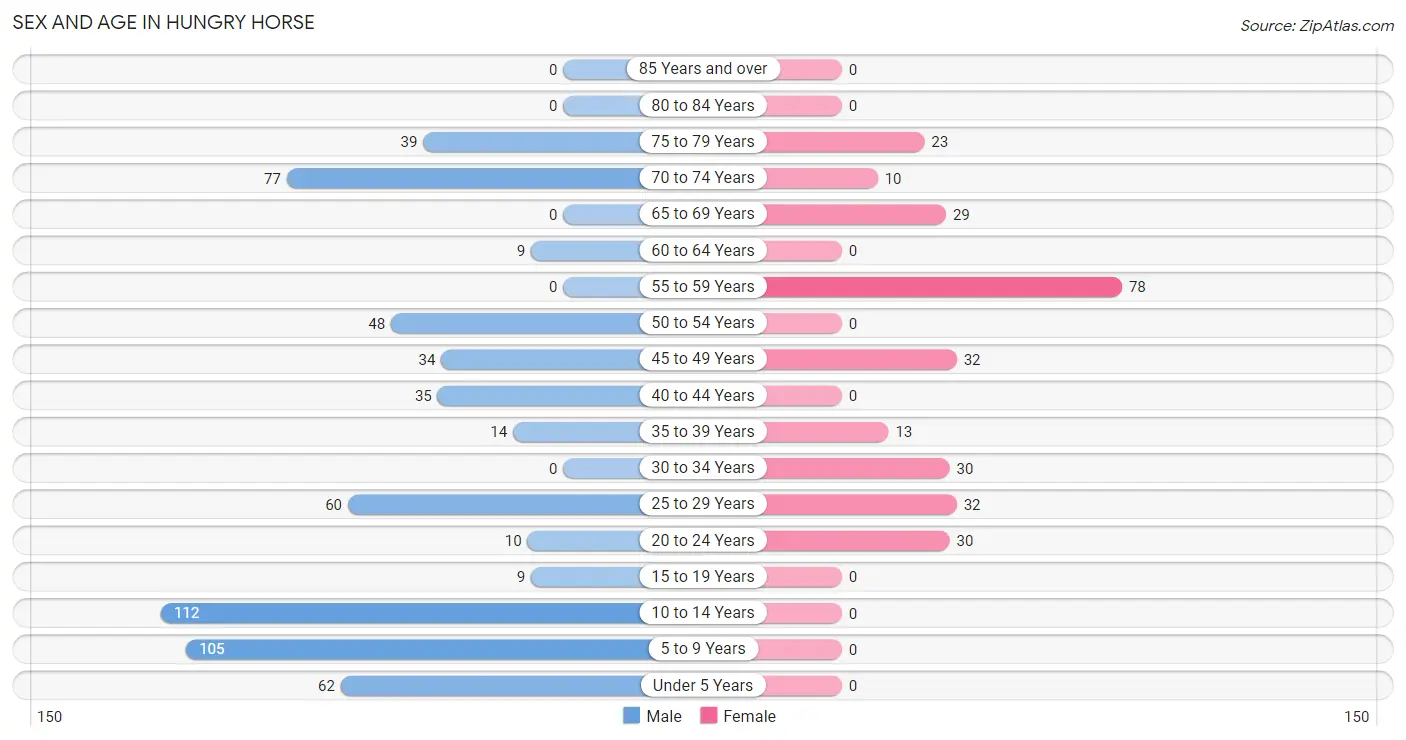
Sex and Age in Hungry Horse
The most populous age groups in Hungry Horse are 10 to 14 Years (112 | 18.2%) for men and 55 to 59 Years (78 | 28.2%) for women.
| Age Bracket | Male | Female |
| Under 5 Years | 62 (10.1%) | 0 (0.0%) |
| 5 to 9 Years | 105 (17.1%) | 0 (0.0%) |
| 10 to 14 Years | 112 (18.2%) | 0 (0.0%) |
| 15 to 19 Years | 9 (1.5%) | 0 (0.0%) |
| 20 to 24 Years | 10 (1.6%) | 30 (10.8%) |
| 25 to 29 Years | 60 (9.8%) | 32 (11.6%) |
| 30 to 34 Years | 0 (0.0%) | 30 (10.8%) |
| 35 to 39 Years | 14 (2.3%) | 13 (4.7%) |
| 40 to 44 Years | 35 (5.7%) | 0 (0.0%) |
| 45 to 49 Years | 34 (5.5%) | 32 (11.6%) |
| 50 to 54 Years | 48 (7.8%) | 0 (0.0%) |
| 55 to 59 Years | 0 (0.0%) | 78 (28.2%) |
| 60 to 64 Years | 9 (1.5%) | 0 (0.0%) |
| 65 to 69 Years | 0 (0.0%) | 29 (10.5%) |
| 70 to 74 Years | 77 (12.5%) | 10 (3.6%) |
| 75 to 79 Years | 39 (6.4%) | 23 (8.3%) |
| 80 to 84 Years | 0 (0.0%) | 0 (0.0%) |
| 85 Years and over | 0 (0.0%) | 0 (0.0%) |
| Total | 614 (100.0%) | 277 (100.0%) |
Families and Households in Hungry Horse
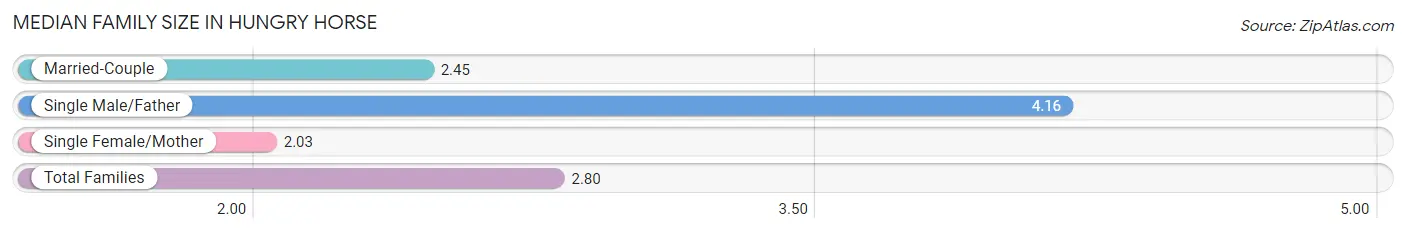
Median Family Size in Hungry Horse
The median family size in Hungry Horse is 2.80 persons per family, with single male/father families (55 | 23.8%) accounting for the largest median family size of 4.16 persons per family. On the other hand, single female/mother families (30 | 13.0%) represent the smallest median family size with 2.03 persons per family.
| Family Type | # Families | Family Size |
| Married-Couple | 146 (63.2%) | 2.45 |
| Single Male/Father | 55 (23.8%) | 4.16 |
| Single Female/Mother | 30 (13.0%) | 2.03 |
| Total Families | 231 (100.0%) | 2.80 |
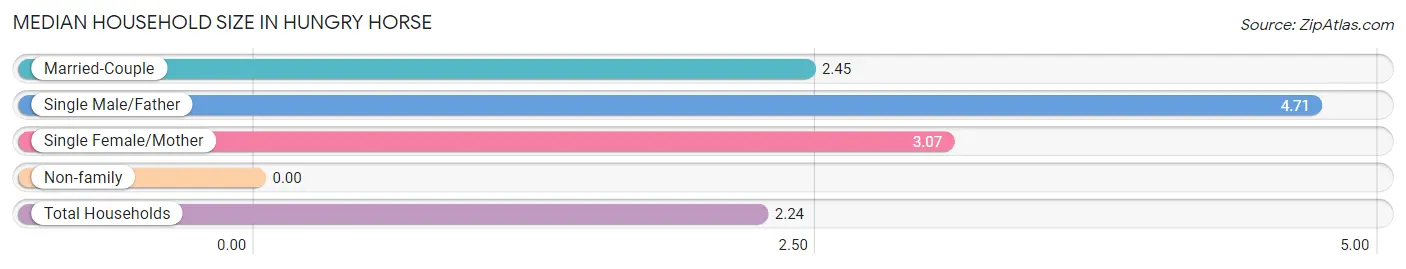
Median Household Size in Hungry Horse
| Household Type | # Households | Household Size |
| Married-Couple | 146 (37.8%) | 2.45 |
| Single Male/Father | 55 (14.2%) | 4.71 |
| Single Female/Mother | 30 (7.8%) | 3.07 |
| Non-family | 155 (40.2%) | - |
| Total Households | 386 (100.0%) | 2.24 |
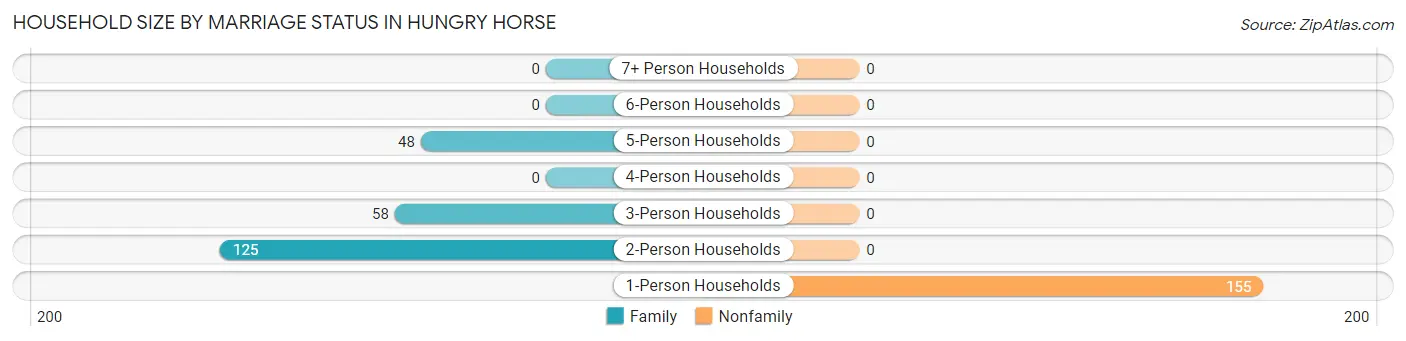
Household Size by Marriage Status in Hungry Horse
Out of a total of 386 households in Hungry Horse, 231 (59.8%) are family households, while 155 (40.2%) are nonfamily households. The most numerous type of family households are 2-person households, comprising 125, and the most common type of nonfamily households are 1-person households, comprising 155.
| Household Size | Family Households | Nonfamily Households |
| 1-Person Households | - | 155 (40.2%) |
| 2-Person Households | 125 (32.4%) | 0 (0.0%) |
| 3-Person Households | 58 (15.0%) | 0 (0.0%) |
| 4-Person Households | 0 (0.0%) | 0 (0.0%) |
| 5-Person Households | 48 (12.4%) | 0 (0.0%) |
| 6-Person Households | 0 (0.0%) | 0 (0.0%) |
| 7+ Person Households | 0 (0.0%) | 0 (0.0%) |
| Total | 231 (59.8%) | 155 (40.2%) |
Female Fertility in Hungry Horse
Fertility by Age in Hungry Horse
| Age Bracket | Women with Births | Births / 1,000 Women |
| 15 to 19 years | 0 (0.0%) | 0.0 |
| 20 to 34 years | 0 (0.0%) | 0.0 |
| 35 to 50 years | 0 (0.0%) | 0.0 |
| Total | 0 (0.0%) | 0.0 |
Fertility by Age by Marriage Status in Hungry Horse
| Age Bracket | Married | Unmarried |
| 15 to 19 years | 0 (0.0%) | 0 (0.0%) |
| 20 to 34 years | 0 (0.0%) | 0 (0.0%) |
| 35 to 50 years | 0 (0.0%) | 0 (0.0%) |
| Total | 0 (0.0%) | 0 (0.0%) |
Fertility by Education in Hungry Horse
| Educational Attainment | Women with Births | Births / 1,000 Women |
| Less than High School | 0 (0.0%) | 0.0 |
| High School Diploma | 0 (0.0%) | 0.0 |
| College or Associate's Degree | 0 (0.0%) | 0.0 |
| Bachelor's Degree | 0 (0.0%) | 0.0 |
| Graduate Degree | 0 (0.0%) | 0.0 |
| Total | 0 (0.0%) | 0.0 |
Fertility by Education by Marriage Status in Hungry Horse
| Educational Attainment | Married | Unmarried |
| Less than High School | 0 (0.0%) | 0 (0.0%) |
| High School Diploma | 0 (0.0%) | 0 (0.0%) |
| College or Associate's Degree | 0 (0.0%) | 0 (0.0%) |
| Bachelor's Degree | 0 (0.0%) | 0 (0.0%) |
| Graduate Degree | 0 (0.0%) | 0 (0.0%) |
| Total | 0 (0.0%) | 0 (0.0%) |
Employment Characteristics in Hungry Horse
Employment by Class of Employer in Hungry Horse
Among the 325 employed individuals in Hungry Horse, private company employees (227 | 69.9%), self-employed (not incorporated) (48 | 14.8%), and state government employees (41 | 12.6%) make up the most common classes of employment.
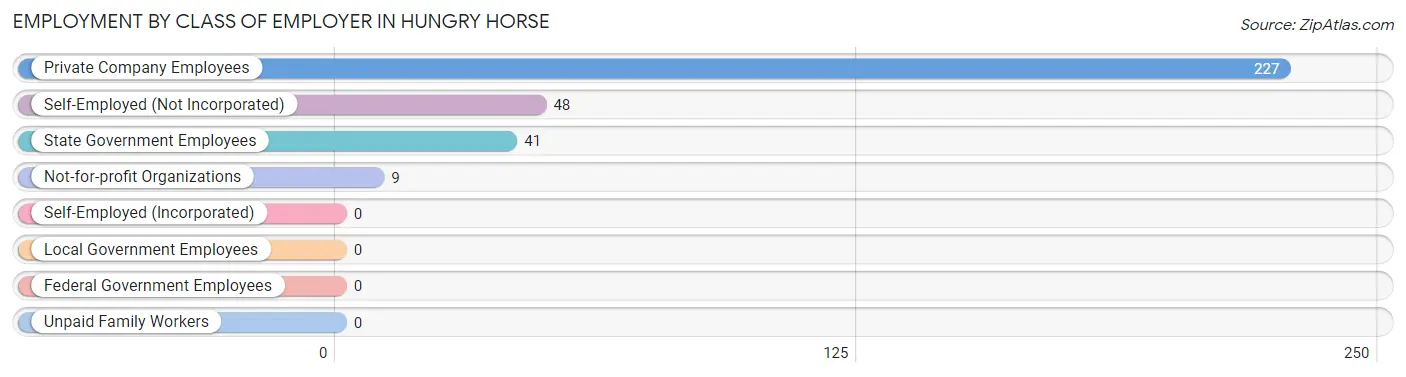
| Employer Class | # Employees | % Employees |
| Private Company Employees | 227 | 69.9% |
| Self-Employed (Incorporated) | 0 | 0.0% |
| Self-Employed (Not Incorporated) | 48 | 14.8% |
| Not-for-profit Organizations | 9 | 2.8% |
| Local Government Employees | 0 | 0.0% |
| State Government Employees | 41 | 12.6% |
| Federal Government Employees | 0 | 0.0% |
| Unpaid Family Workers | 0 | 0.0% |
| Total | 325 | 100.0% |
Employment Status by Age in Hungry Horse
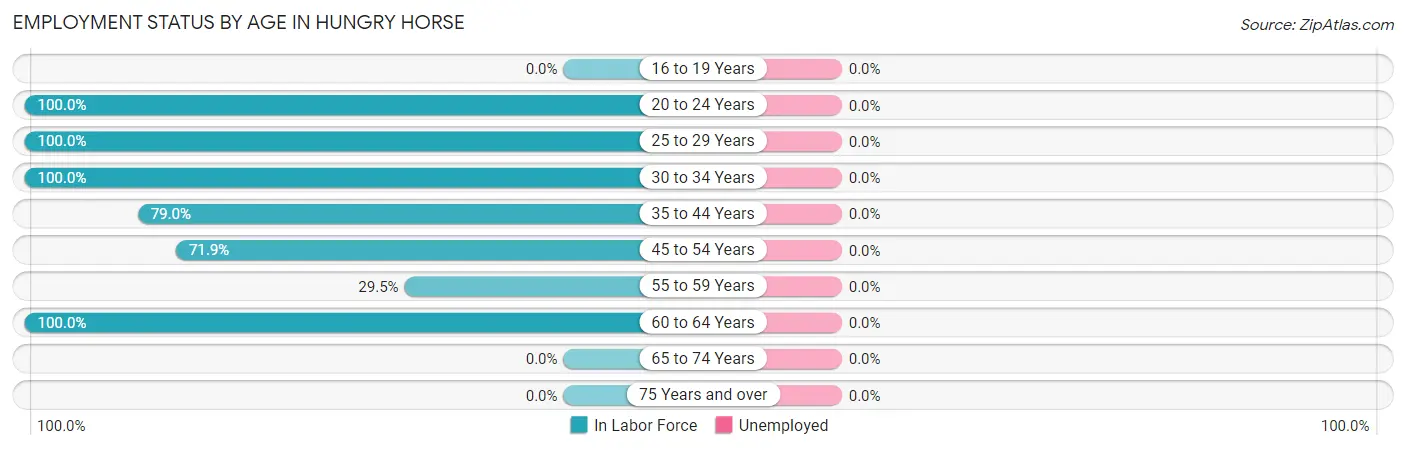
| Age Bracket | In Labor Force | Unemployed |
| 16 to 19 Years | 0 (0.0%) | 0 (0.0%) |
| 20 to 24 Years | 40 (100.0%) | 0 (0.0%) |
| 25 to 29 Years | 92 (100.0%) | 0 (0.0%) |
| 30 to 34 Years | 30 (100.0%) | 0 (0.0%) |
| 35 to 44 Years | 49 (79.0%) | 0 (0.0%) |
| 45 to 54 Years | 82 (71.9%) | 0 (0.0%) |
| 55 to 59 Years | 23 (29.5%) | 0 (0.0%) |
| 60 to 64 Years | 9 (100.0%) | 0 (0.0%) |
| 65 to 74 Years | 0 (0.0%) | 0 (0.0%) |
| 75 Years and over | 0 (0.0%) | 0 (0.0%) |
| Total | 325 (53.1%) | 0 (0.0%) |
Employment Status by Educational Attainment in Hungry Horse
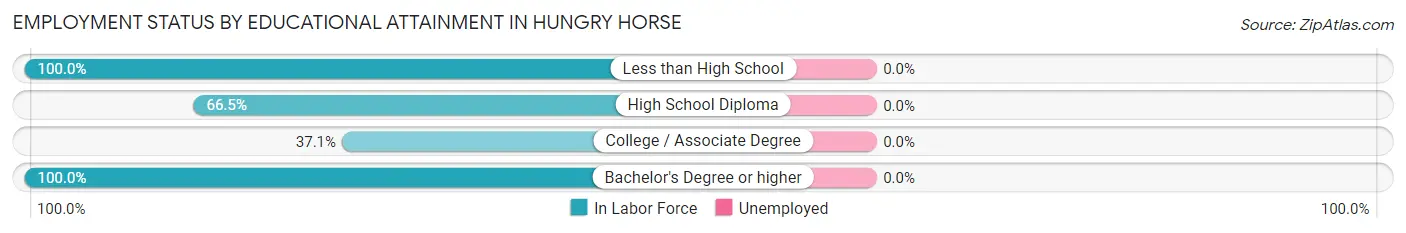
| Educational Attainment | In Labor Force | Unemployed |
| Less than High School | 35 (100.0%) | 0 (0.0%) |
| High School Diploma | 121 (66.5%) | 0 (0.0%) |
| College / Associate Degree | 23 (37.1%) | 0 (0.0%) |
| Bachelor's Degree or higher | 106 (100.0%) | 0 (0.0%) |
| Total | 285 (74.0%) | 0 (0.0%) |
Employment Occupations by Sex in Hungry Horse
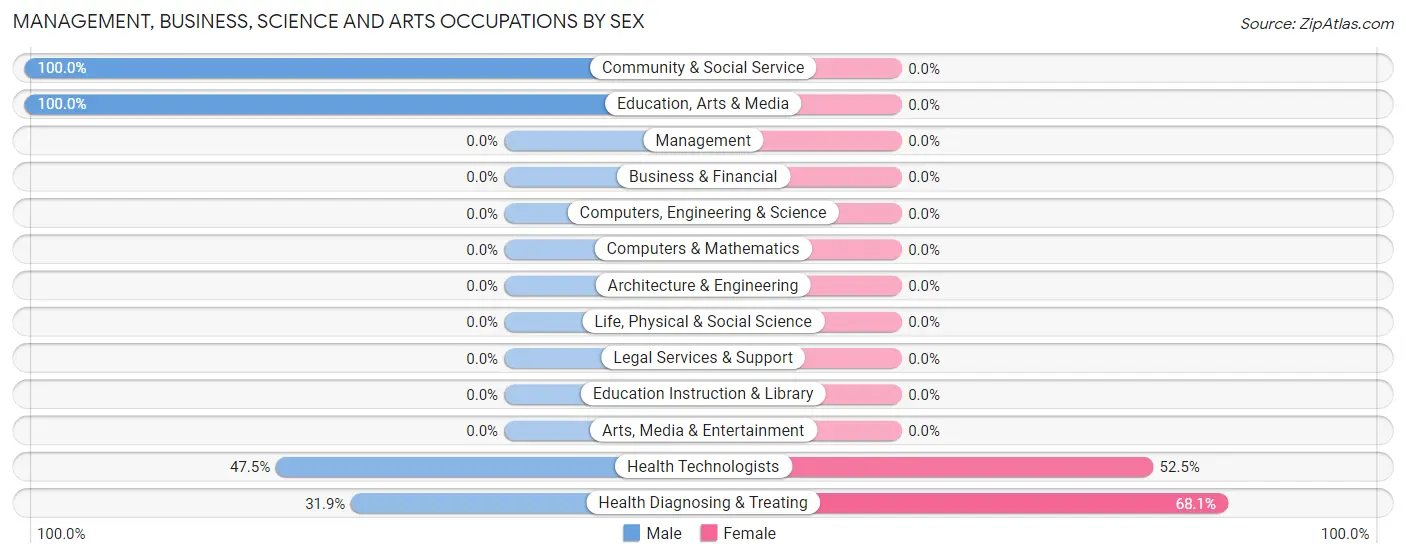
Management, Business, Science and Arts Occupations
The most common Management, Business, Science and Arts occupations in Hungry Horse are Health Diagnosing & Treating (91 | 28.0%), Health Technologists (61 | 18.8%), Community & Social Service (9 | 2.8%), and Education, Arts & Media (9 | 2.8%).
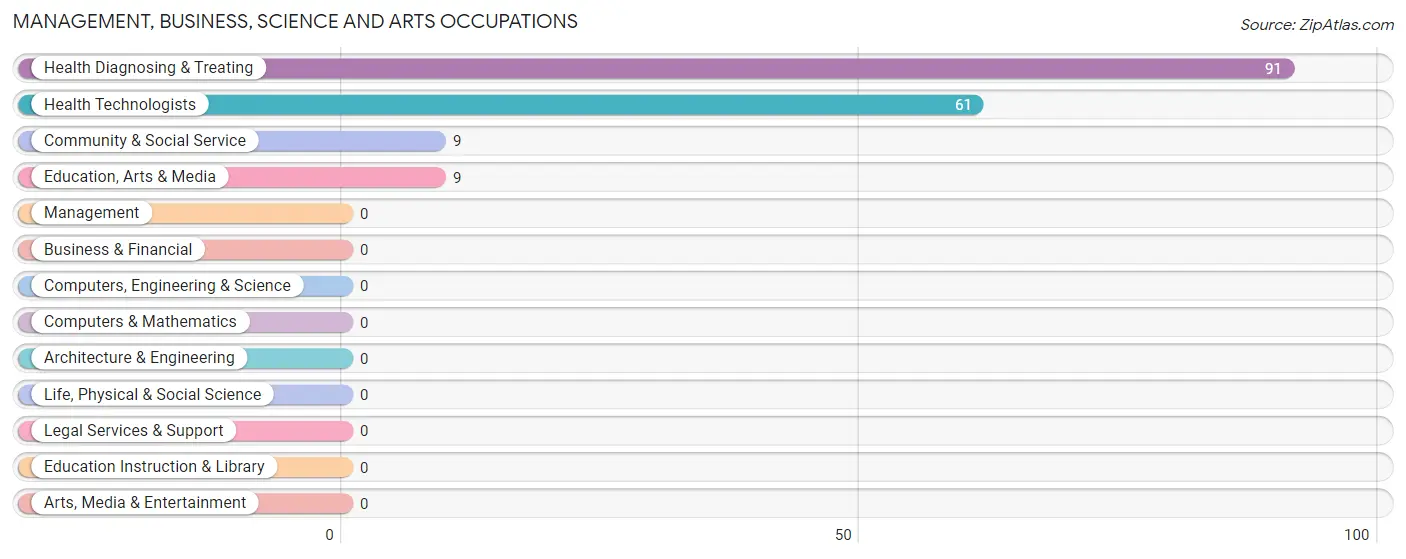
Management, Business, Science and Arts Occupations by Sex
Within the Management, Business, Science and Arts occupations in Hungry Horse, the most male-oriented occupations are Community & Social Service (100.0%), Education, Arts & Media (100.0%), and Health Technologists (47.5%), while the most female-oriented occupations are Health Diagnosing & Treating (68.1%), and Health Technologists (52.5%).
| Occupation | Male | Female |
| Management | 0 (0.0%) | 0 (0.0%) |
| Business & Financial | 0 (0.0%) | 0 (0.0%) |
| Computers, Engineering & Science | 0 (0.0%) | 0 (0.0%) |
| Computers & Mathematics | 0 (0.0%) | 0 (0.0%) |
| Architecture & Engineering | 0 (0.0%) | 0 (0.0%) |
| Life, Physical & Social Science | 0 (0.0%) | 0 (0.0%) |
| Community & Social Service | 9 (100.0%) | 0 (0.0%) |
| Education, Arts & Media | 9 (100.0%) | 0 (0.0%) |
| Legal Services & Support | 0 (0.0%) | 0 (0.0%) |
| Education Instruction & Library | 0 (0.0%) | 0 (0.0%) |
| Arts, Media & Entertainment | 0 (0.0%) | 0 (0.0%) |
| Health Diagnosing & Treating | 29 (31.9%) | 62 (68.1%) |
| Health Technologists | 29 (47.5%) | 32 (52.5%) |
| Total (Category) | 38 (38.0%) | 62 (62.0%) |
| Total (Overall) | 210 (64.6%) | 115 (35.4%) |
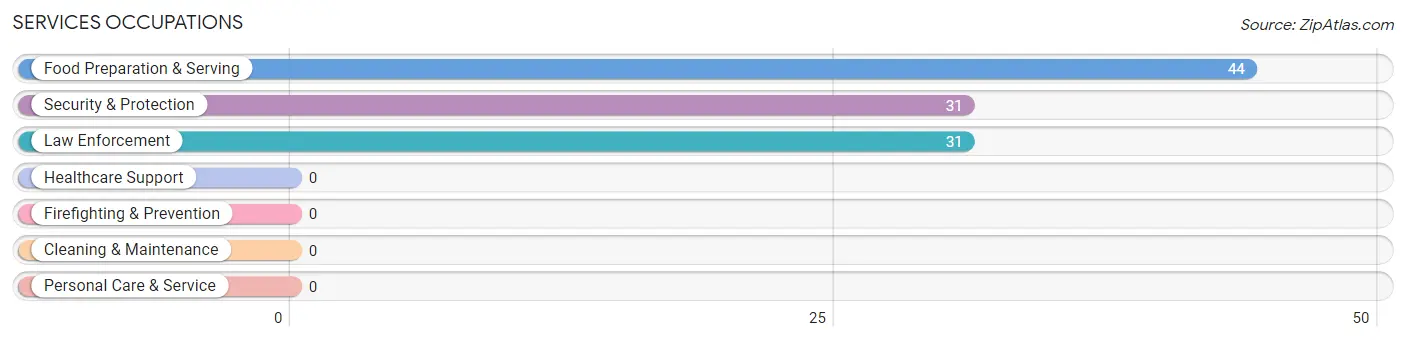
Services Occupations
The most common Services occupations in Hungry Horse are Food Preparation & Serving (44 | 13.5%), Security & Protection (31 | 9.5%), and Law Enforcement (31 | 9.5%).
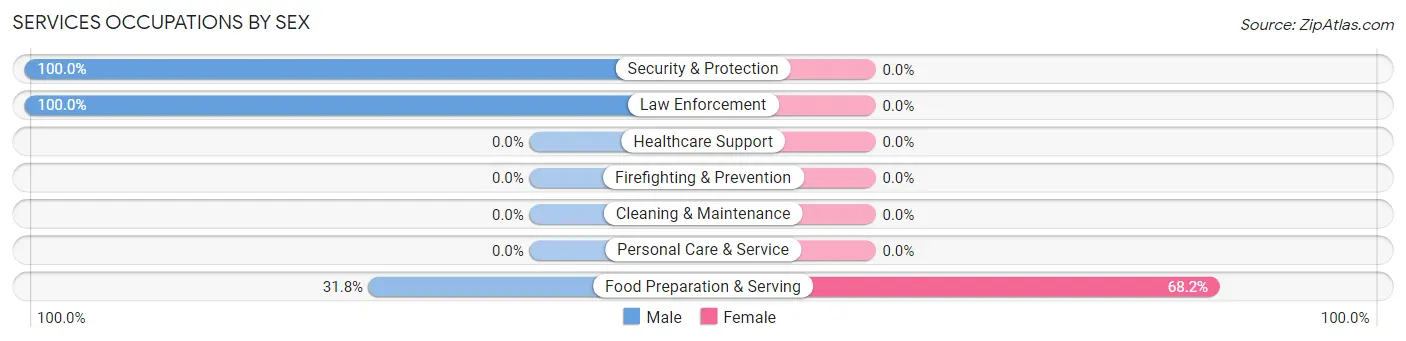
Services Occupations by Sex
| Occupation | Male | Female |
| Healthcare Support | 0 (0.0%) | 0 (0.0%) |
| Security & Protection | 31 (100.0%) | 0 (0.0%) |
| Firefighting & Prevention | 0 (0.0%) | 0 (0.0%) |
| Law Enforcement | 31 (100.0%) | 0 (0.0%) |
| Food Preparation & Serving | 14 (31.8%) | 30 (68.2%) |
| Cleaning & Maintenance | 0 (0.0%) | 0 (0.0%) |
| Personal Care & Service | 0 (0.0%) | 0 (0.0%) |
| Total (Category) | 45 (60.0%) | 30 (40.0%) |
| Total (Overall) | 210 (64.6%) | 115 (35.4%) |
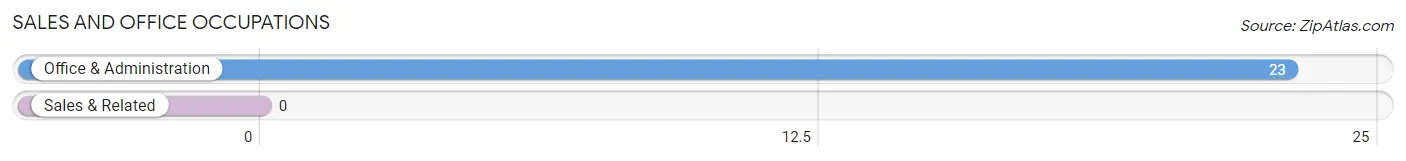
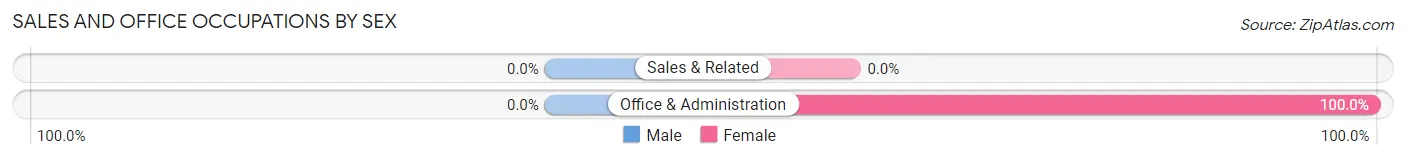
Sales and Office Occupations
The most common Sales and Office occupations in Hungry Horse are , and Office & Administration (23 | 7.1%).
Sales and Office Occupations by Sex
| Occupation | Male | Female |
| Sales & Related | 0 (0.0%) | 0 (0.0%) |
| Office & Administration | 0 (0.0%) | 23 (100.0%) |
| Total (Category) | 0 (0.0%) | 23 (100.0%) |
| Total (Overall) | 210 (64.6%) | 115 (35.4%) |
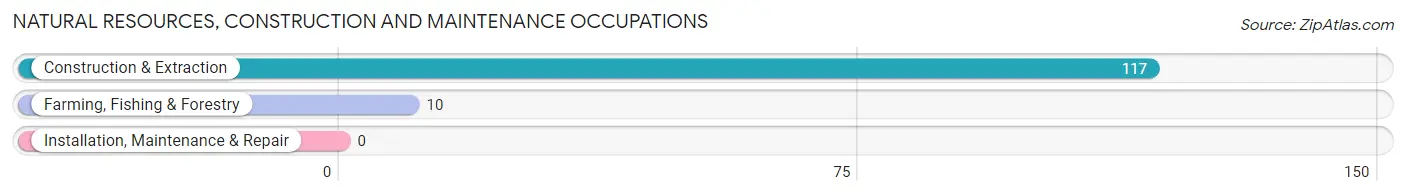
Natural Resources, Construction and Maintenance Occupations
The most common Natural Resources, Construction and Maintenance occupations in Hungry Horse are Construction & Extraction (117 | 36.0%), and Farming, Fishing & Forestry (10 | 3.1%).
Natural Resources, Construction and Maintenance Occupations by Sex
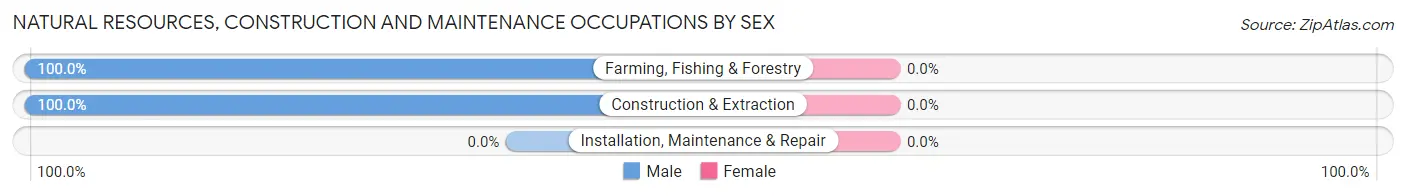
| Occupation | Male | Female |
| Farming, Fishing & Forestry | 10 (100.0%) | 0 (0.0%) |
| Construction & Extraction | 117 (100.0%) | 0 (0.0%) |
| Installation, Maintenance & Repair | 0 (0.0%) | 0 (0.0%) |
| Total (Category) | 127 (100.0%) | 0 (0.0%) |
| Total (Overall) | 210 (64.6%) | 115 (35.4%) |
Production, Transportation and Moving Occupations
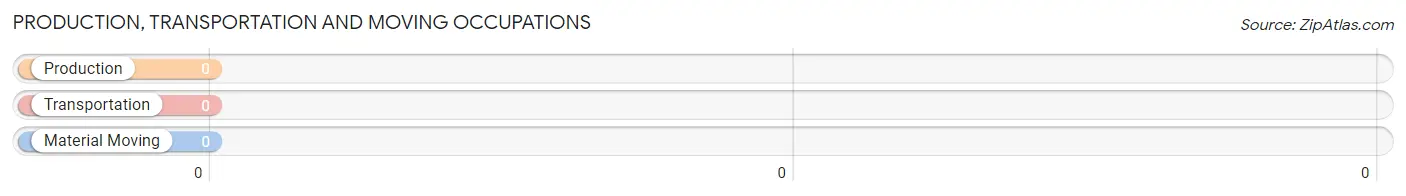
Production, Transportation and Moving Occupations by Sex
| Occupation | Male | Female |
| Production | 0 (0.0%) | 0 (0.0%) |
| Transportation | 0 (0.0%) | 0 (0.0%) |
| Material Moving | 0 (0.0%) | 0 (0.0%) |
| Total (Category) | 0 (0.0%) | 0 (0.0%) |
| Total (Overall) | 210 (64.6%) | 115 (35.4%) |
Employment Industries by Sex in Hungry Horse
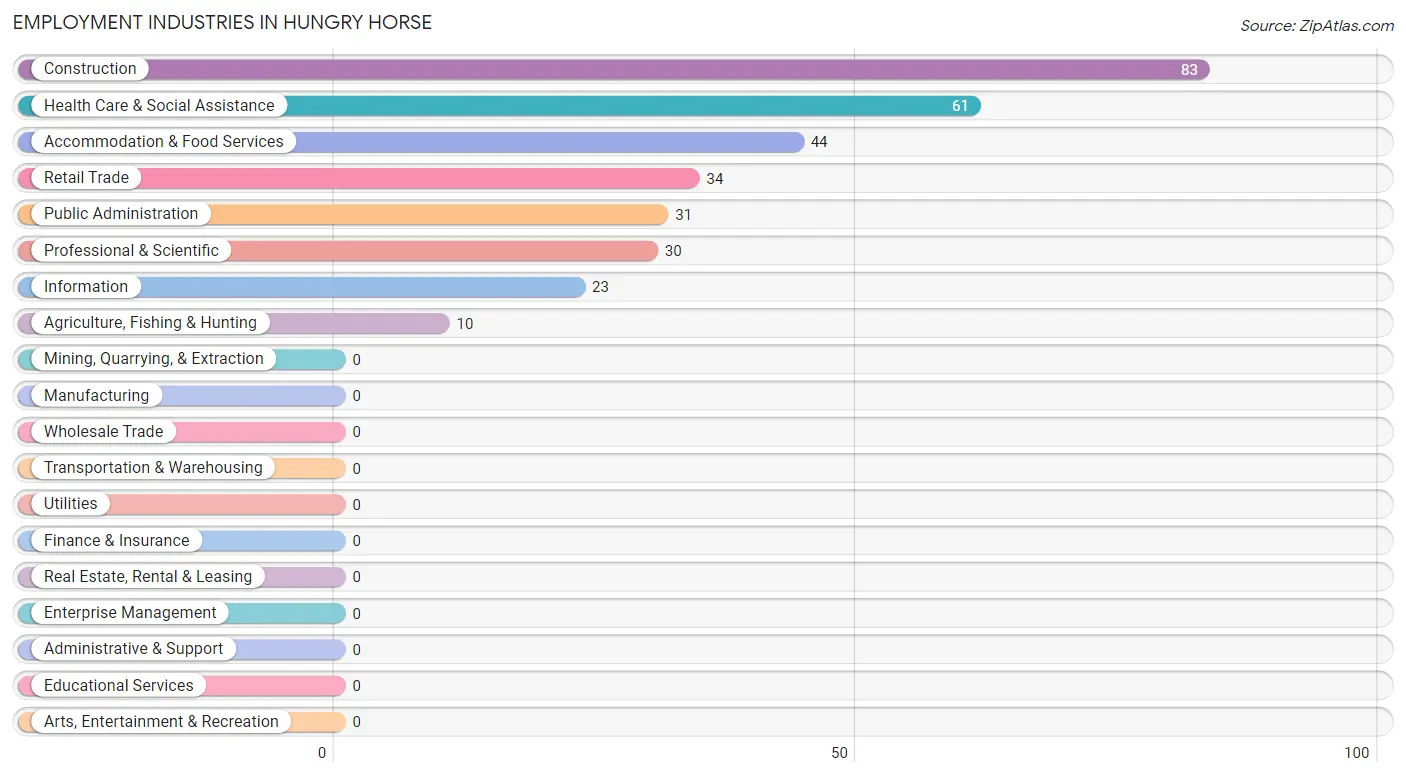
Employment Industries in Hungry Horse
The major employment industries in Hungry Horse include Construction (83 | 25.5%), Health Care & Social Assistance (61 | 18.8%), Accommodation & Food Services (44 | 13.5%), Retail Trade (34 | 10.5%), and Public Administration (31 | 9.5%).
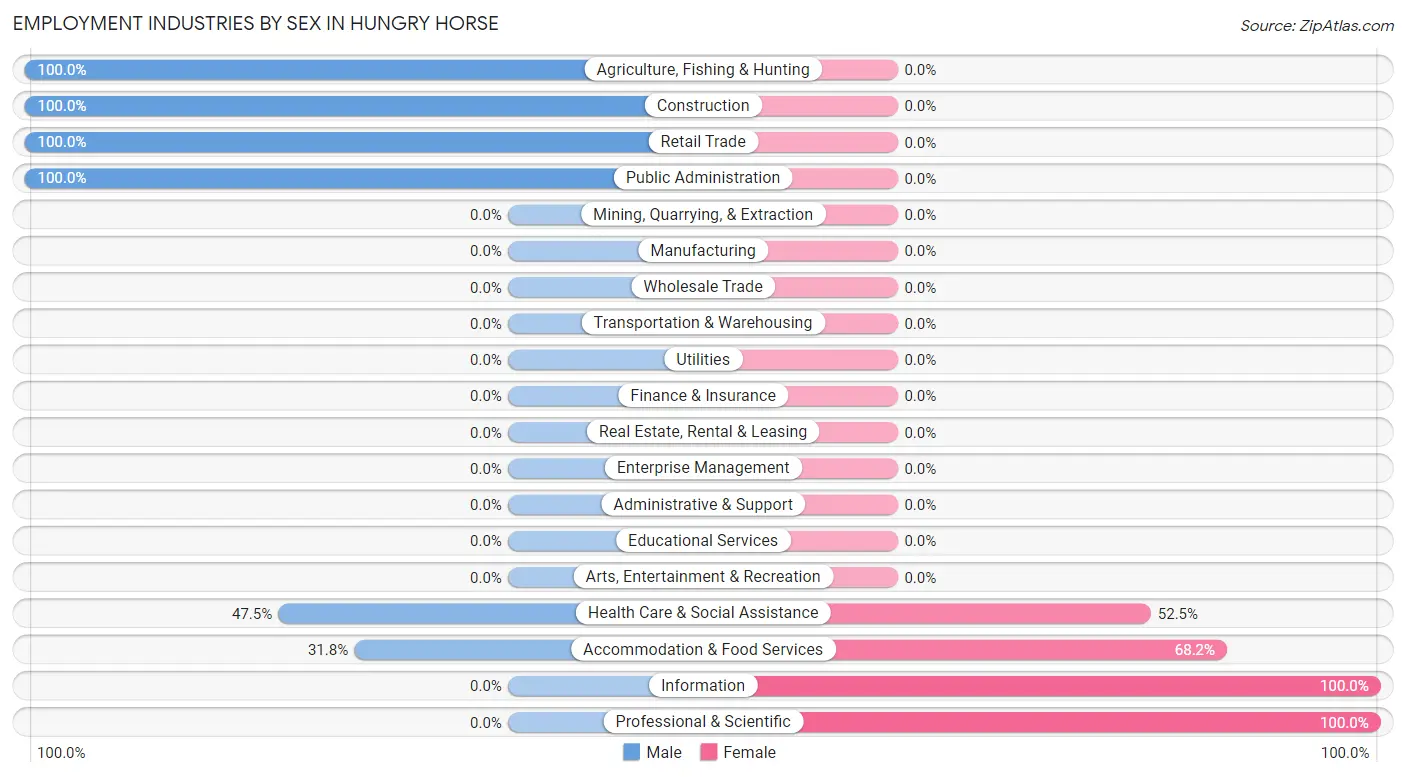
Employment Industries by Sex in Hungry Horse
The Hungry Horse industries that see more men than women are Agriculture, Fishing & Hunting (100.0%), Construction (100.0%), and Retail Trade (100.0%), whereas the industries that tend to have a higher number of women are Information (100.0%), Professional & Scientific (100.0%), and Accommodation & Food Services (68.2%).
| Industry | Male | Female |
| Agriculture, Fishing & Hunting | 10 (100.0%) | 0 (0.0%) |
| Mining, Quarrying, & Extraction | 0 (0.0%) | 0 (0.0%) |
| Construction | 83 (100.0%) | 0 (0.0%) |
| Manufacturing | 0 (0.0%) | 0 (0.0%) |
| Wholesale Trade | 0 (0.0%) | 0 (0.0%) |
| Retail Trade | 34 (100.0%) | 0 (0.0%) |
| Transportation & Warehousing | 0 (0.0%) | 0 (0.0%) |
| Utilities | 0 (0.0%) | 0 (0.0%) |
| Information | 0 (0.0%) | 23 (100.0%) |
| Finance & Insurance | 0 (0.0%) | 0 (0.0%) |
| Real Estate, Rental & Leasing | 0 (0.0%) | 0 (0.0%) |
| Professional & Scientific | 0 (0.0%) | 30 (100.0%) |
| Enterprise Management | 0 (0.0%) | 0 (0.0%) |
| Administrative & Support | 0 (0.0%) | 0 (0.0%) |
| Educational Services | 0 (0.0%) | 0 (0.0%) |
| Health Care & Social Assistance | 29 (47.5%) | 32 (52.5%) |
| Arts, Entertainment & Recreation | 0 (0.0%) | 0 (0.0%) |
| Accommodation & Food Services | 14 (31.8%) | 30 (68.2%) |
| Public Administration | 31 (100.0%) | 0 (0.0%) |
| Total | 210 (64.6%) | 115 (35.4%) |
Education in Hungry Horse
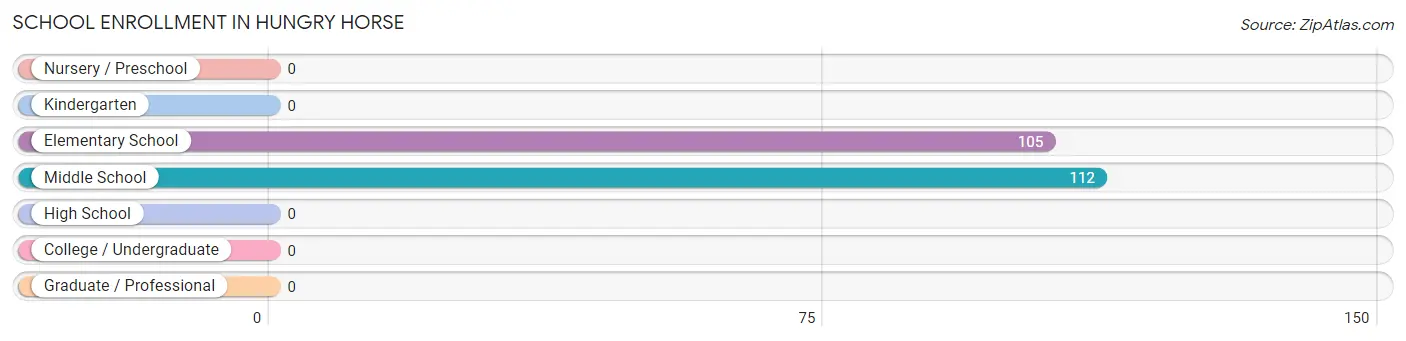
School Enrollment in Hungry Horse
The most common levels of schooling among the 217 students in Hungry Horse are middle school (112 | 51.6%), and elementary school (105 | 48.4%).
| School Level | # Students | % Students |
| Nursery / Preschool | 0 | 0.0% |
| Kindergarten | 0 | 0.0% |
| Elementary School | 105 | 48.4% |
| Middle School | 112 | 51.6% |
| High School | 0 | 0.0% |
| College / Undergraduate | 0 | 0.0% |
| Graduate / Professional | 0 | 0.0% |
| Total | 217 | 100.0% |
School Enrollment by Age by Funding Source in Hungry Horse
Out of a total of 217 students who are enrolled in schools in Hungry Horse, 42 (19.4%) attend a private institution, while the remaining 175 (80.6%) are enrolled in public schools. The age group of 5 to 9 year old has the highest likelihood of being enrolled in private schools, with 28 (26.7% in the age bracket) enrolled. Conversely, the age group of 10 to 14 year olds has the lowest likelihood of being enrolled in a private school, with 98 (87.5% in the age bracket) attending a public institution.
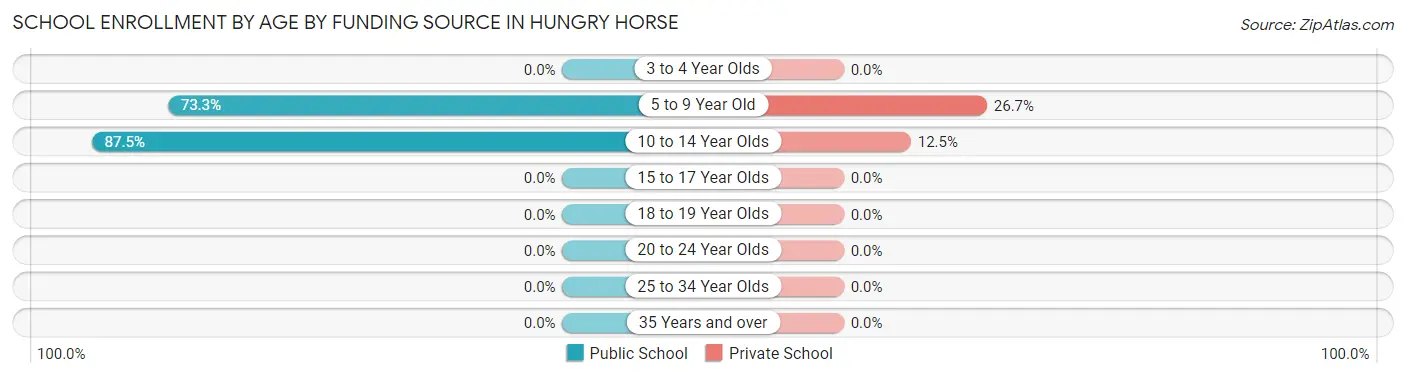
| Age Bracket | Public School | Private School |
| 3 to 4 Year Olds | 0 (0.0%) | 0 (0.0%) |
| 5 to 9 Year Old | 77 (73.3%) | 28 (26.7%) |
| 10 to 14 Year Olds | 98 (87.5%) | 14 (12.5%) |
| 15 to 17 Year Olds | 0 (0.0%) | 0 (0.0%) |
| 18 to 19 Year Olds | 0 (0.0%) | 0 (0.0%) |
| 20 to 24 Year Olds | 0 (0.0%) | 0 (0.0%) |
| 25 to 34 Year Olds | 0 (0.0%) | 0 (0.0%) |
| 35 Years and over | 0 (0.0%) | 0 (0.0%) |
| Total | 175 (80.6%) | 42 (19.4%) |
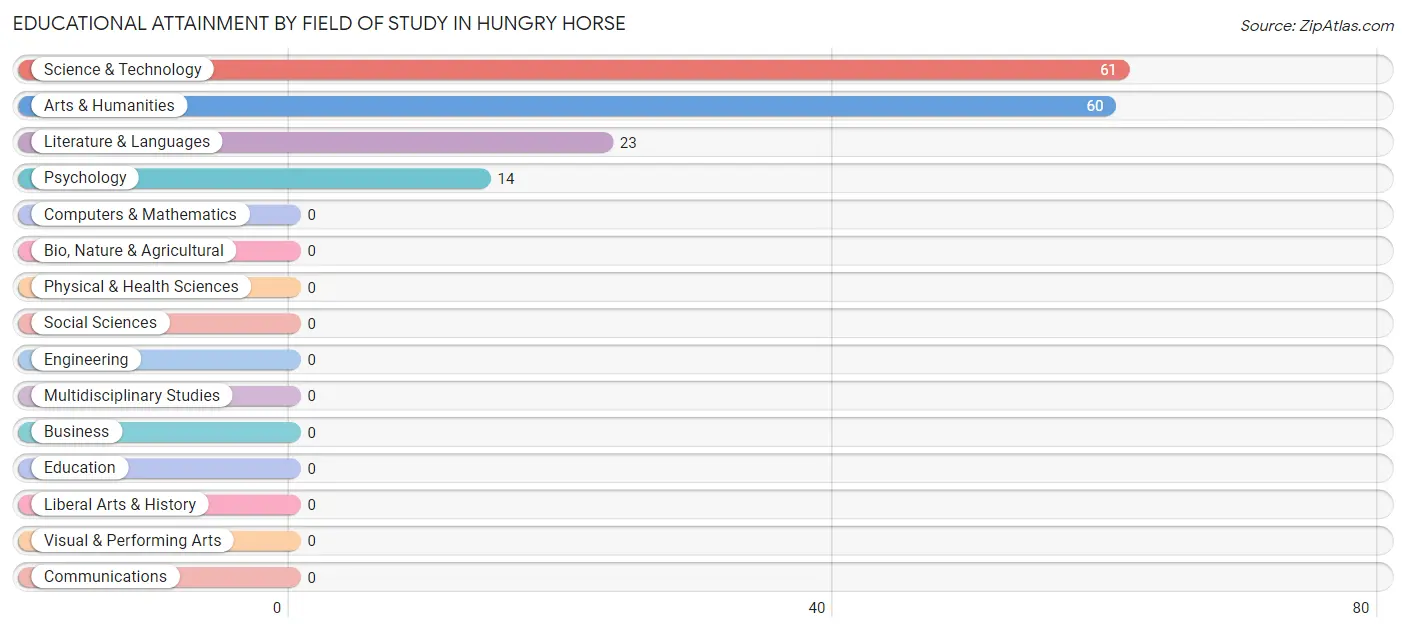
Educational Attainment by Field of Study in Hungry Horse
Science & technology (61 | 38.6%), arts & humanities (60 | 38.0%), literature & languages (23 | 14.6%), and psychology (14 | 8.9%) are the most common fields of study among 158 individuals in Hungry Horse who have obtained a bachelor's degree or higher.
| Field of Study | # Graduates | % Graduates |
| Computers & Mathematics | 0 | 0.0% |
| Bio, Nature & Agricultural | 0 | 0.0% |
| Physical & Health Sciences | 0 | 0.0% |
| Psychology | 14 | 8.9% |
| Social Sciences | 0 | 0.0% |
| Engineering | 0 | 0.0% |
| Multidisciplinary Studies | 0 | 0.0% |
| Science & Technology | 61 | 38.6% |
| Business | 0 | 0.0% |
| Education | 0 | 0.0% |
| Literature & Languages | 23 | 14.6% |
| Liberal Arts & History | 0 | 0.0% |
| Visual & Performing Arts | 0 | 0.0% |
| Communications | 0 | 0.0% |
| Arts & Humanities | 60 | 38.0% |
| Total | 158 | 100.0% |
Transportation & Commute in Hungry Horse
Vehicle Availability by Sex in Hungry Horse
The most prevalent vehicle ownership categories in Hungry Horse are males with 2 vehicles (108, accounting for 56.5%) and females with 2 vehicles (83, making up 93.9%).
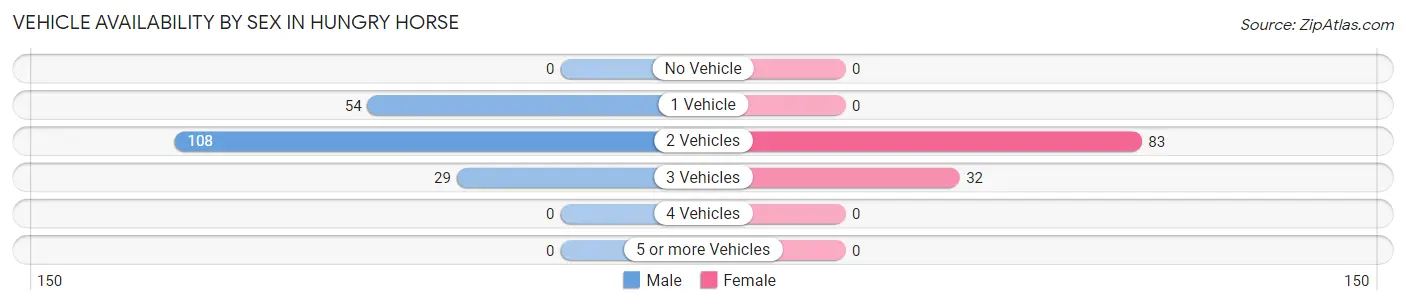
| Vehicles Available | Male | Female |
| No Vehicle | 0 (0.0%) | 0 (0.0%) |
| 1 Vehicle | 54 (28.3%) | 0 (0.0%) |
| 2 Vehicles | 108 (56.5%) | 83 (72.2%) |
| 3 Vehicles | 29 (15.2%) | 32 (27.8%) |
| 4 Vehicles | 0 (0.0%) | 0 (0.0%) |
| 5 or more Vehicles | 0 (0.0%) | 0 (0.0%) |
| Total | 191 (100.0%) | 115 (100.0%) |
Commute Time in Hungry Horse
The most frequently occuring commute durations in Hungry Horse are 30 to 34 minutes (76 commuters, 32.6%), 10 to 14 minutes (53 commuters, 22.8%), and 15 to 19 minutes (39 commuters, 16.7%).
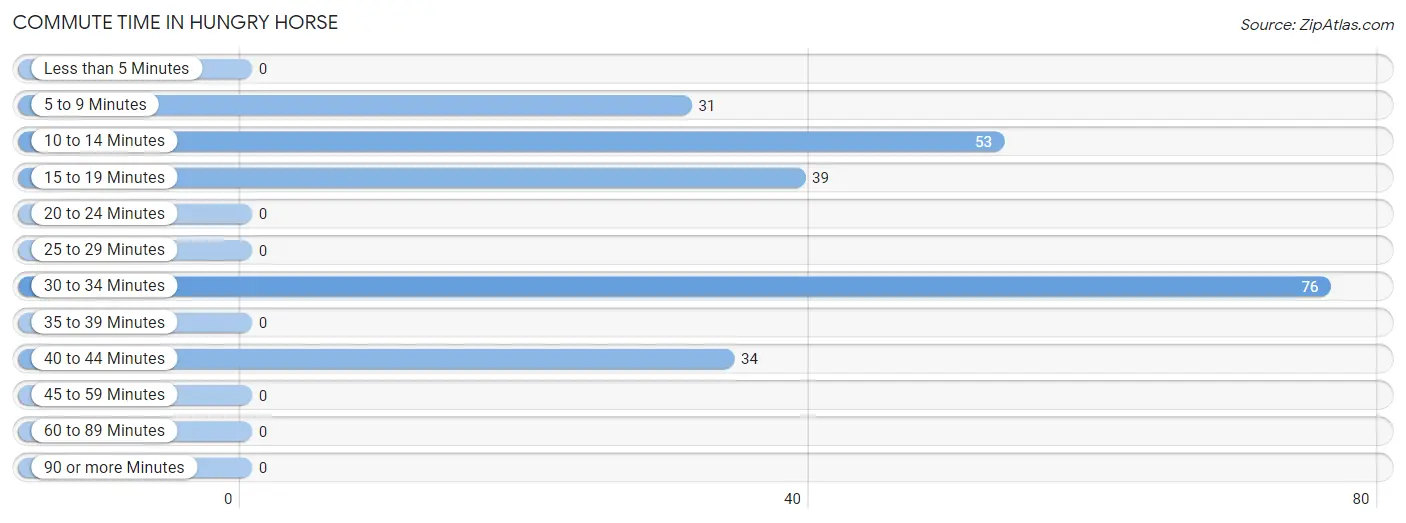
| Commute Time | # Commuters | % Commuters |
| Less than 5 Minutes | 0 | 0.0% |
| 5 to 9 Minutes | 31 | 13.3% |
| 10 to 14 Minutes | 53 | 22.8% |
| 15 to 19 Minutes | 39 | 16.7% |
| 20 to 24 Minutes | 0 | 0.0% |
| 25 to 29 Minutes | 0 | 0.0% |
| 30 to 34 Minutes | 76 | 32.6% |
| 35 to 39 Minutes | 0 | 0.0% |
| 40 to 44 Minutes | 34 | 14.6% |
| 45 to 59 Minutes | 0 | 0.0% |
| 60 to 89 Minutes | 0 | 0.0% |
| 90 or more Minutes | 0 | 0.0% |
Commute Time by Sex in Hungry Horse
The most common commute times in Hungry Horse are 15 to 19 minutes (39 commuters, 33.1%) for males and 30 to 34 minutes (62 commuters, 53.9%) for females.
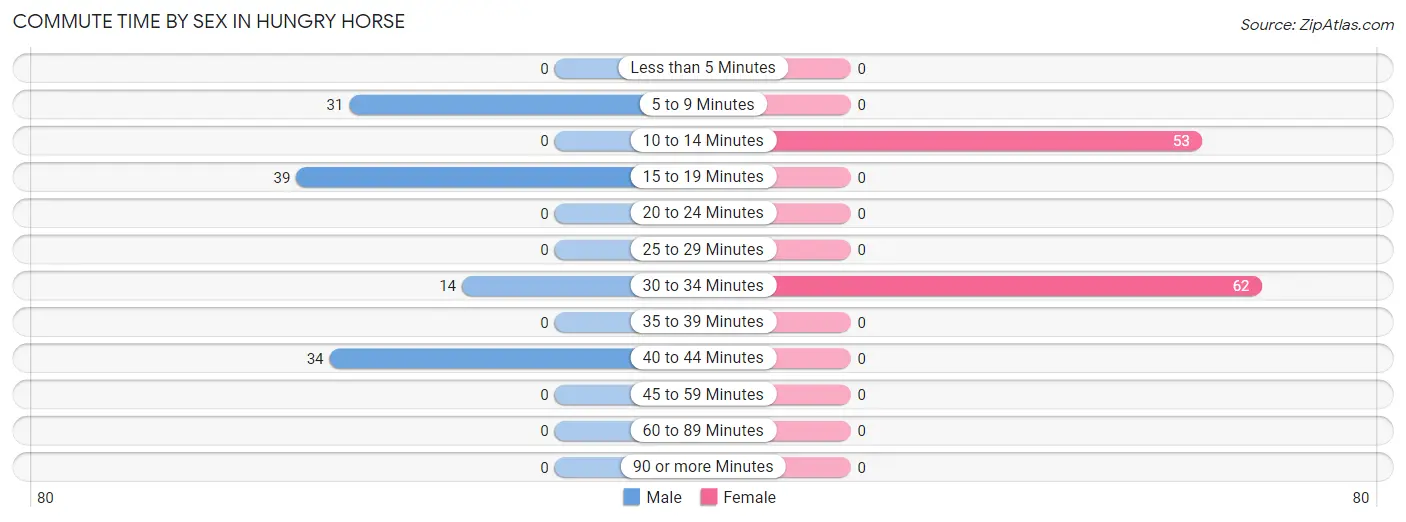
| Commute Time | Male | Female |
| Less than 5 Minutes | 0 (0.0%) | 0 (0.0%) |
| 5 to 9 Minutes | 31 (26.3%) | 0 (0.0%) |
| 10 to 14 Minutes | 0 (0.0%) | 53 (46.1%) |
| 15 to 19 Minutes | 39 (33.1%) | 0 (0.0%) |
| 20 to 24 Minutes | 0 (0.0%) | 0 (0.0%) |
| 25 to 29 Minutes | 0 (0.0%) | 0 (0.0%) |
| 30 to 34 Minutes | 14 (11.9%) | 62 (53.9%) |
| 35 to 39 Minutes | 0 (0.0%) | 0 (0.0%) |
| 40 to 44 Minutes | 34 (28.8%) | 0 (0.0%) |
| 45 to 59 Minutes | 0 (0.0%) | 0 (0.0%) |
| 60 to 89 Minutes | 0 (0.0%) | 0 (0.0%) |
| 90 or more Minutes | 0 (0.0%) | 0 (0.0%) |
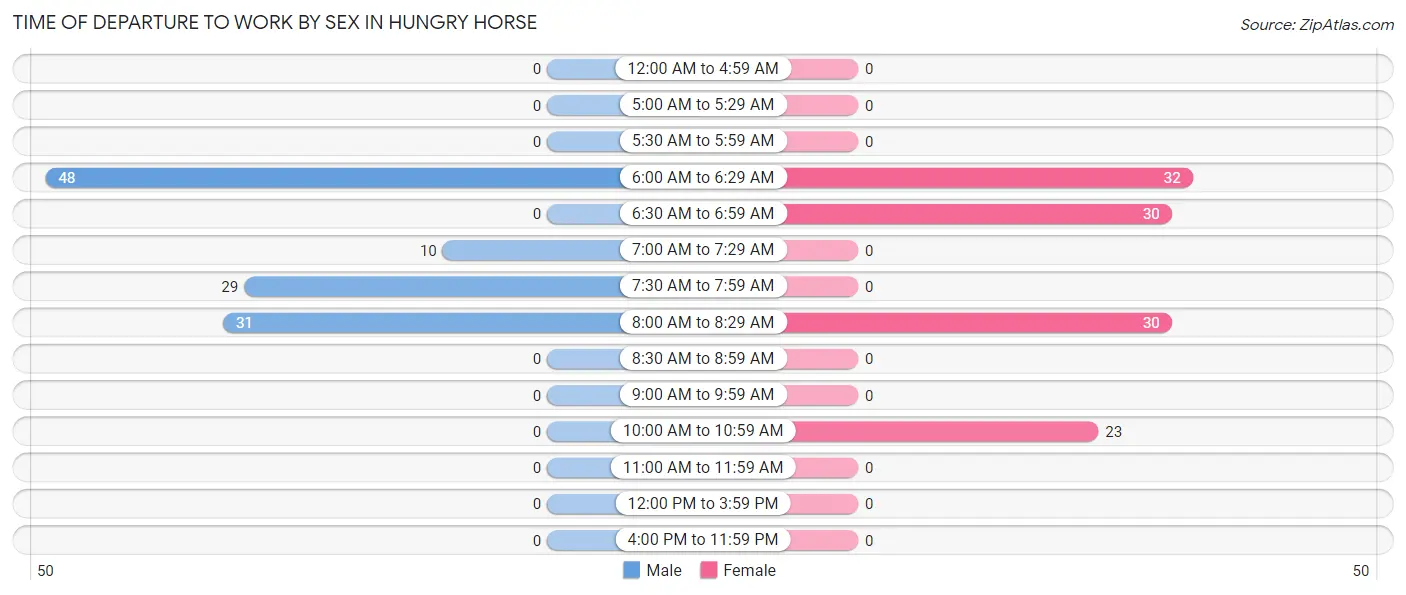
Time of Departure to Work by Sex in Hungry Horse
The most frequent times of departure to work in Hungry Horse are 6:00 AM to 6:29 AM (48, 40.7%) for males and 6:00 AM to 6:29 AM (32, 27.8%) for females.
| Time of Departure | Male | Female |
| 12:00 AM to 4:59 AM | 0 (0.0%) | 0 (0.0%) |
| 5:00 AM to 5:29 AM | 0 (0.0%) | 0 (0.0%) |
| 5:30 AM to 5:59 AM | 0 (0.0%) | 0 (0.0%) |
| 6:00 AM to 6:29 AM | 48 (40.7%) | 32 (27.8%) |
| 6:30 AM to 6:59 AM | 0 (0.0%) | 30 (26.1%) |
| 7:00 AM to 7:29 AM | 10 (8.5%) | 0 (0.0%) |
| 7:30 AM to 7:59 AM | 29 (24.6%) | 0 (0.0%) |
| 8:00 AM to 8:29 AM | 31 (26.3%) | 30 (26.1%) |
| 8:30 AM to 8:59 AM | 0 (0.0%) | 0 (0.0%) |
| 9:00 AM to 9:59 AM | 0 (0.0%) | 0 (0.0%) |
| 10:00 AM to 10:59 AM | 0 (0.0%) | 23 (20.0%) |
| 11:00 AM to 11:59 AM | 0 (0.0%) | 0 (0.0%) |
| 12:00 PM to 3:59 PM | 0 (0.0%) | 0 (0.0%) |
| 4:00 PM to 11:59 PM | 0 (0.0%) | 0 (0.0%) |
| Total | 118 (100.0%) | 115 (100.0%) |
Housing Occupancy in Hungry Horse
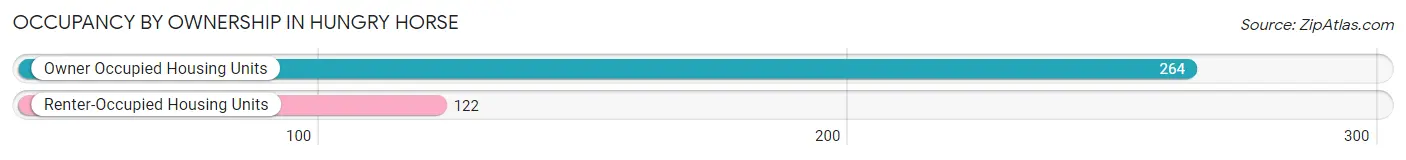
Occupancy by Ownership in Hungry Horse
Of the total 386 dwellings in Hungry Horse, owner-occupied units account for 264 (68.4%), while renter-occupied units make up 122 (31.6%).
| Occupancy | # Housing Units | % Housing Units |
| Owner Occupied Housing Units | 264 | 68.4% |
| Renter-Occupied Housing Units | 122 | 31.6% |
| Total Occupied Housing Units | 386 | 100.0% |
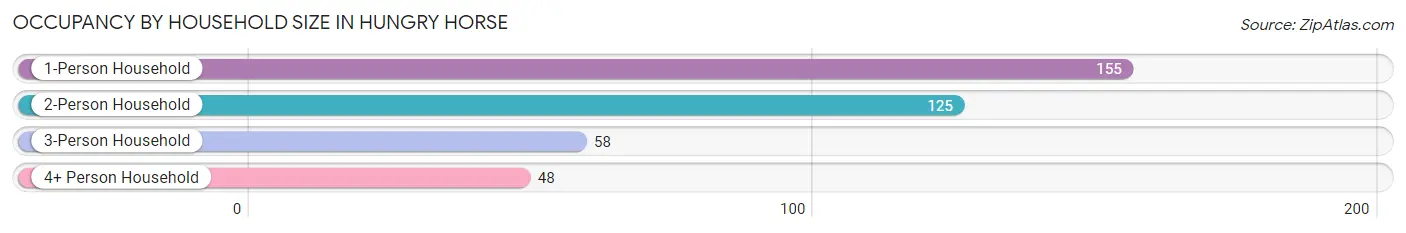
Occupancy by Household Size in Hungry Horse
| Household Size | # Housing Units | % Housing Units |
| 1-Person Household | 155 | 40.2% |
| 2-Person Household | 125 | 32.4% |
| 3-Person Household | 58 | 15.0% |
| 4+ Person Household | 48 | 12.4% |
| Total Housing Units | 386 | 100.0% |
Occupancy by Ownership by Household Size in Hungry Horse
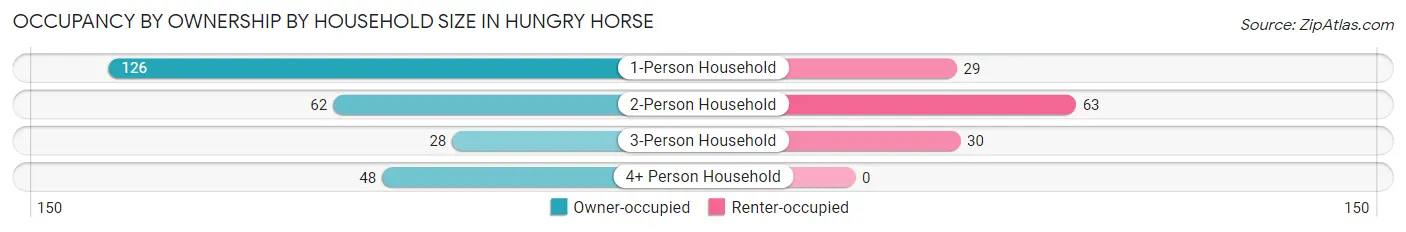
| Household Size | Owner-occupied | Renter-occupied |
| 1-Person Household | 126 (81.3%) | 29 (18.7%) |
| 2-Person Household | 62 (49.6%) | 63 (50.4%) |
| 3-Person Household | 28 (48.3%) | 30 (51.7%) |
| 4+ Person Household | 48 (100.0%) | 0 (0.0%) |
| Total Housing Units | 264 (68.4%) | 122 (31.6%) |
Occupancy by Educational Attainment in Hungry Horse
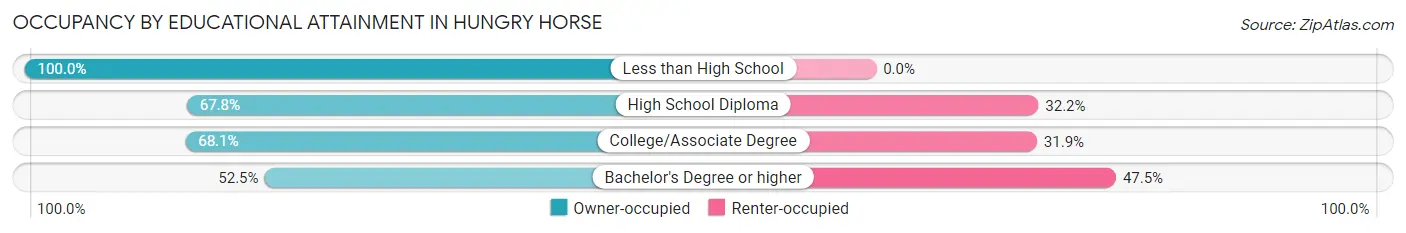
| Household Size | Owner-occupied | Renter-occupied |
| Less than High School | 35 (100.0%) | 0 (0.0%) |
| High School Diploma | 135 (67.8%) | 64 (32.2%) |
| College/Associate Degree | 62 (68.1%) | 29 (31.9%) |
| Bachelor's Degree or higher | 32 (52.5%) | 29 (47.5%) |
Occupancy by Age of Householder in Hungry Horse
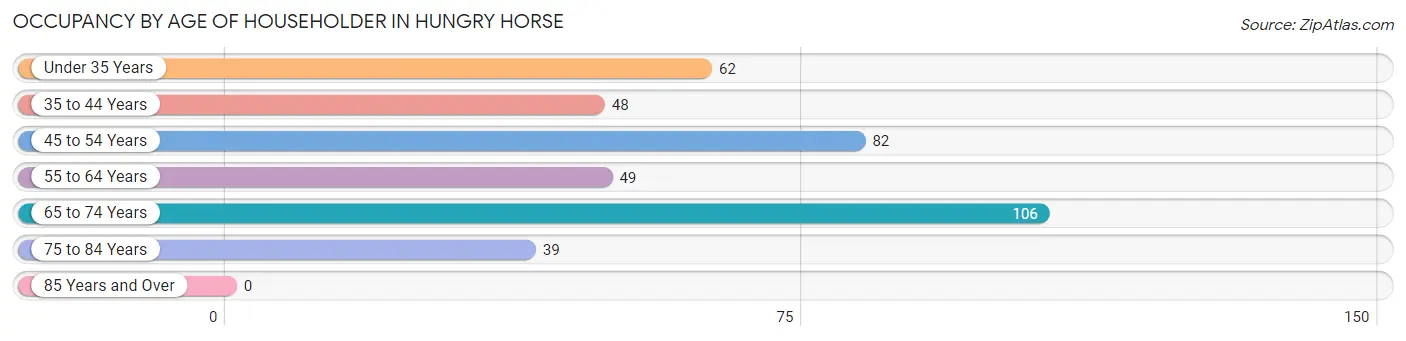
| Age Bracket | # Households | % Households |
| Under 35 Years | 62 | 16.1% |
| 35 to 44 Years | 48 | 12.4% |
| 45 to 54 Years | 82 | 21.2% |
| 55 to 64 Years | 49 | 12.7% |
| 65 to 74 Years | 106 | 27.5% |
| 75 to 84 Years | 39 | 10.1% |
| 85 Years and Over | 0 | 0.0% |
| Total | 386 | 100.0% |
Housing Finances in Hungry Horse
Median Income by Occupancy in Hungry Horse
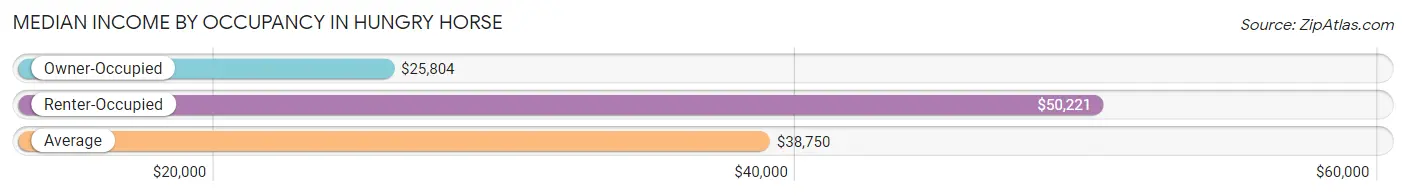
| Occupancy Type | # Households | Median Income |
| Owner-Occupied | 264 (68.4%) | $25,804 |
| Renter-Occupied | 122 (31.6%) | $50,221 |
| Average | 386 (100.0%) | $38,750 |
Occupancy by Householder Income Bracket in Hungry Horse
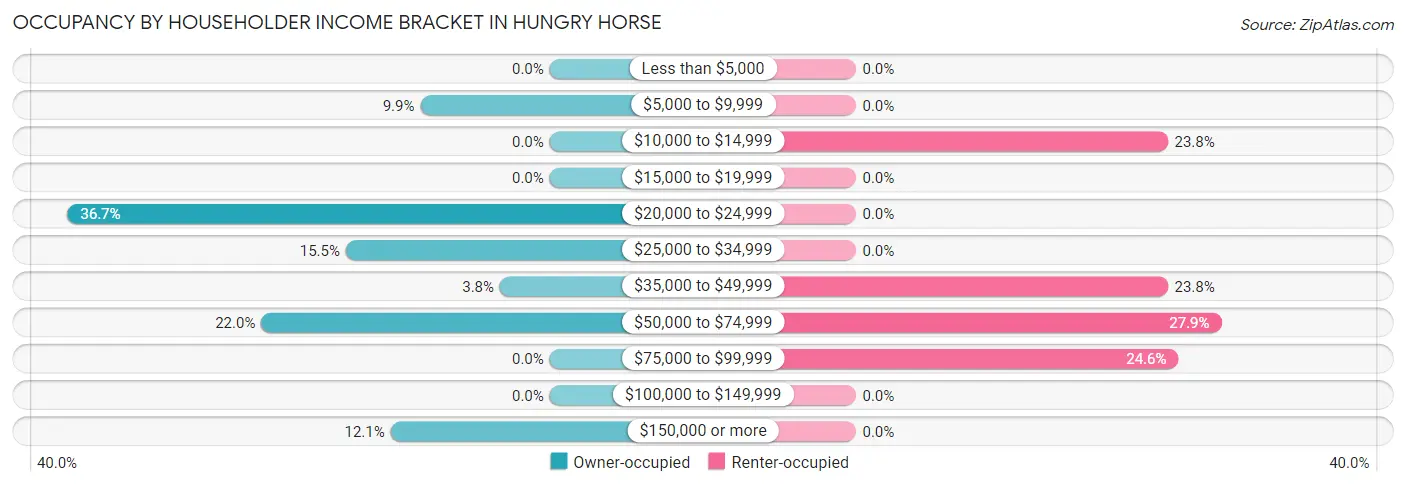
| Income Bracket | Owner-occupied | Renter-occupied |
| Less than $5,000 | 0 (0.0%) | 0 (0.0%) |
| $5,000 to $9,999 | 26 (9.9%) | 0 (0.0%) |
| $10,000 to $14,999 | 0 (0.0%) | 29 (23.8%) |
| $15,000 to $19,999 | 0 (0.0%) | 0 (0.0%) |
| $20,000 to $24,999 | 97 (36.7%) | 0 (0.0%) |
| $25,000 to $34,999 | 41 (15.5%) | 0 (0.0%) |
| $35,000 to $49,999 | 10 (3.8%) | 29 (23.8%) |
| $50,000 to $74,999 | 58 (22.0%) | 34 (27.9%) |
| $75,000 to $99,999 | 0 (0.0%) | 30 (24.6%) |
| $100,000 to $149,999 | 0 (0.0%) | 0 (0.0%) |
| $150,000 or more | 32 (12.1%) | 0 (0.0%) |
| Total | 264 (100.0%) | 122 (100.0%) |
Monthly Housing Cost Tiers in Hungry Horse
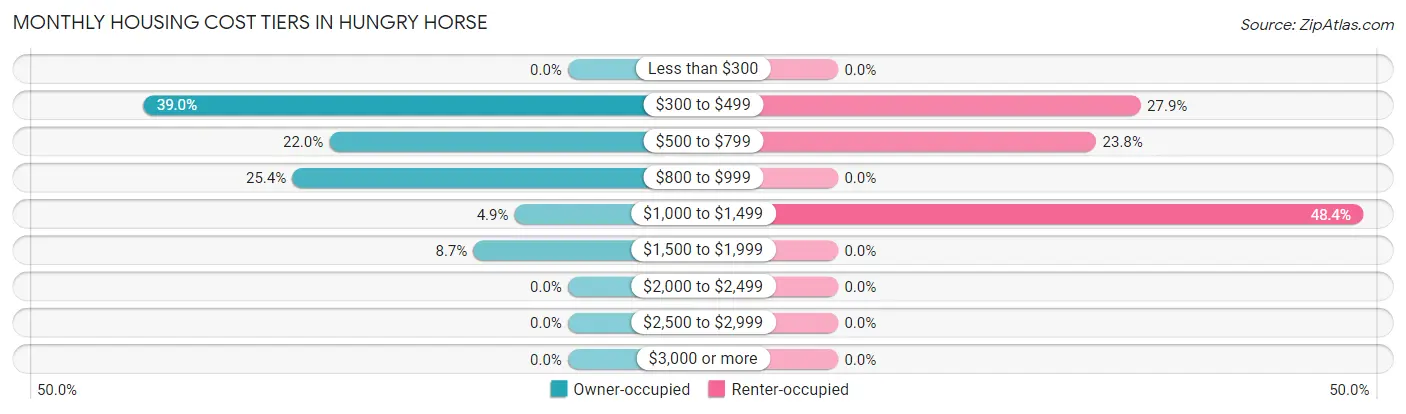
| Monthly Cost | Owner-occupied | Renter-occupied |
| Less than $300 | 0 (0.0%) | 0 (0.0%) |
| $300 to $499 | 103 (39.0%) | 34 (27.9%) |
| $500 to $799 | 58 (22.0%) | 29 (23.8%) |
| $800 to $999 | 67 (25.4%) | 0 (0.0%) |
| $1,000 to $1,499 | 13 (4.9%) | 59 (48.4%) |
| $1,500 to $1,999 | 23 (8.7%) | 0 (0.0%) |
| $2,000 to $2,499 | 0 (0.0%) | 0 (0.0%) |
| $2,500 to $2,999 | 0 (0.0%) | 0 (0.0%) |
| $3,000 or more | 0 (0.0%) | 0 (0.0%) |
| Total | 264 (100.0%) | 122 (100.0%) |
Physical Housing Characteristics in Hungry Horse
Housing Structures in Hungry Horse
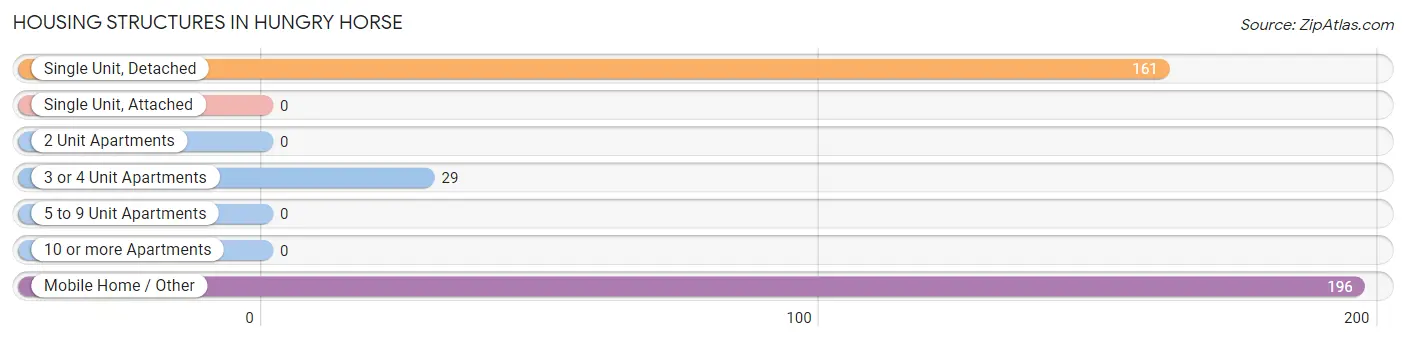
| Structure Type | # Housing Units | % Housing Units |
| Single Unit, Detached | 161 | 41.7% |
| Single Unit, Attached | 0 | 0.0% |
| 2 Unit Apartments | 0 | 0.0% |
| 3 or 4 Unit Apartments | 29 | 7.5% |
| 5 to 9 Unit Apartments | 0 | 0.0% |
| 10 or more Apartments | 0 | 0.0% |
| Mobile Home / Other | 196 | 50.8% |
| Total | 386 | 100.0% |
Housing Structures by Occupancy in Hungry Horse
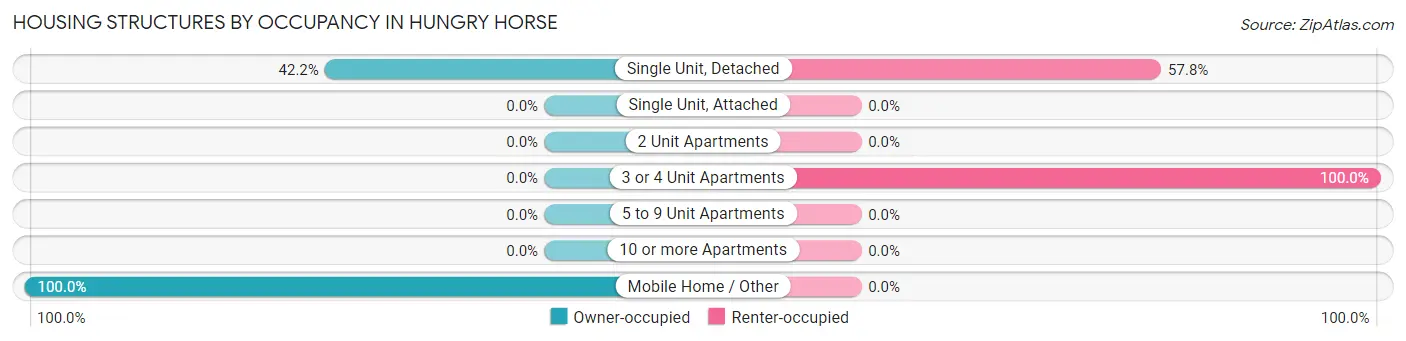
| Structure Type | Owner-occupied | Renter-occupied |
| Single Unit, Detached | 68 (42.2%) | 93 (57.8%) |
| Single Unit, Attached | 0 (0.0%) | 0 (0.0%) |
| 2 Unit Apartments | 0 (0.0%) | 0 (0.0%) |
| 3 or 4 Unit Apartments | 0 (0.0%) | 29 (100.0%) |
| 5 to 9 Unit Apartments | 0 (0.0%) | 0 (0.0%) |
| 10 or more Apartments | 0 (0.0%) | 0 (0.0%) |
| Mobile Home / Other | 196 (100.0%) | 0 (0.0%) |
| Total | 264 (68.4%) | 122 (31.6%) |
Housing Structures by Number of Rooms in Hungry Horse
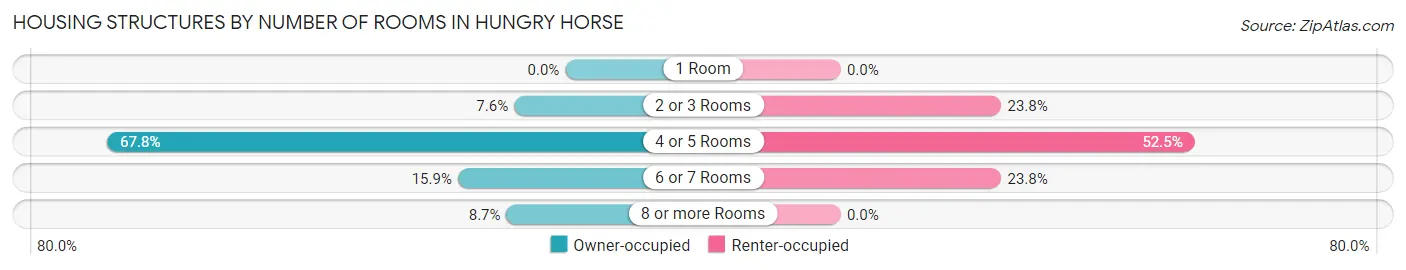
| Number of Rooms | Owner-occupied | Renter-occupied |
| 1 Room | 0 (0.0%) | 0 (0.0%) |
| 2 or 3 Rooms | 20 (7.6%) | 29 (23.8%) |
| 4 or 5 Rooms | 179 (67.8%) | 64 (52.5%) |
| 6 or 7 Rooms | 42 (15.9%) | 29 (23.8%) |
| 8 or more Rooms | 23 (8.7%) | 0 (0.0%) |
| Total | 264 (100.0%) | 122 (100.0%) |
Housing Structure by Heating Type in Hungry Horse
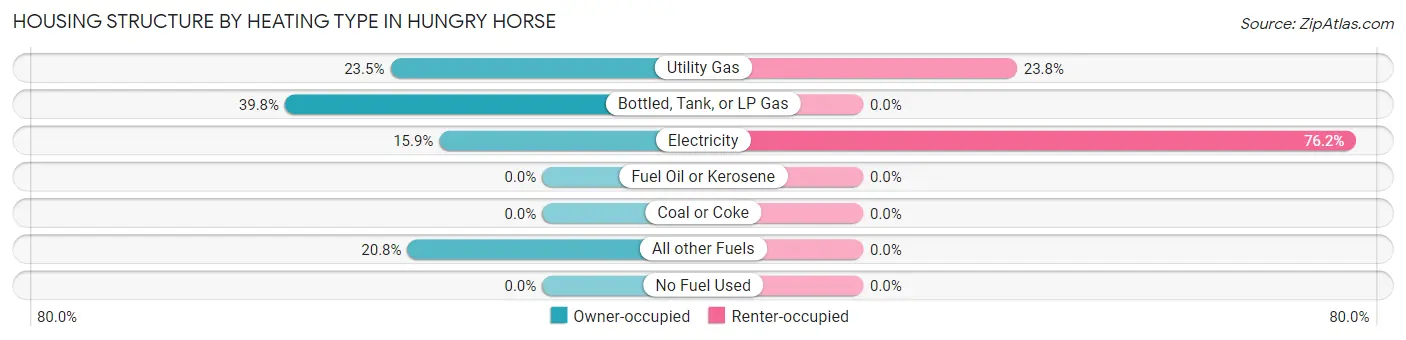
| Heating Type | Owner-occupied | Renter-occupied |
| Utility Gas | 62 (23.5%) | 29 (23.8%) |
| Bottled, Tank, or LP Gas | 105 (39.8%) | 0 (0.0%) |
| Electricity | 42 (15.9%) | 93 (76.2%) |
| Fuel Oil or Kerosene | 0 (0.0%) | 0 (0.0%) |
| Coal or Coke | 0 (0.0%) | 0 (0.0%) |
| All other Fuels | 55 (20.8%) | 0 (0.0%) |
| No Fuel Used | 0 (0.0%) | 0 (0.0%) |
| Total | 264 (100.0%) | 122 (100.0%) |
Household Vehicle Usage in Hungry Horse
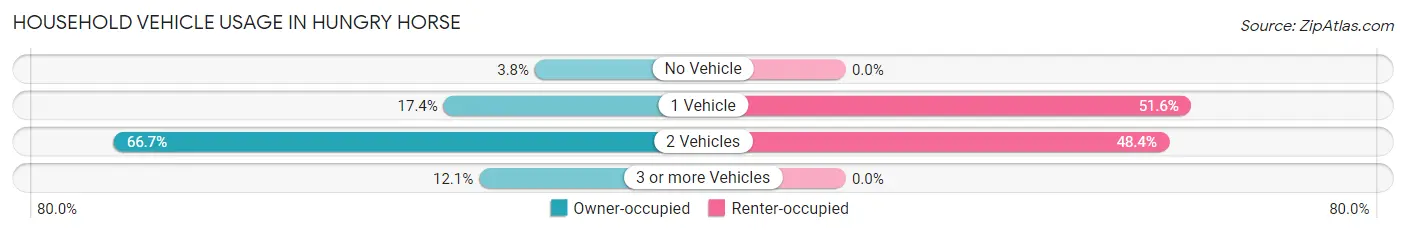
| Vehicles per Household | Owner-occupied | Renter-occupied |
| No Vehicle | 10 (3.8%) | 0 (0.0%) |
| 1 Vehicle | 46 (17.4%) | 63 (51.6%) |
| 2 Vehicles | 176 (66.7%) | 59 (48.4%) |
| 3 or more Vehicles | 32 (12.1%) | 0 (0.0%) |
| Total | 264 (100.0%) | 122 (100.0%) |
Real Estate & Mortgages in Hungry Horse
Real Estate and Mortgage Overview in Hungry Horse
| Characteristic | Without Mortgage | With Mortgage |
| Housing Units | 113 | 151 |
| Median Property Value | - | - |
| Median Household Income | $23,490 | $32 |
| Monthly Housing Costs | $327 | $0 |
| Real Estate Taxes | $479 | $20 |
Property Value by Mortgage Status in Hungry Horse
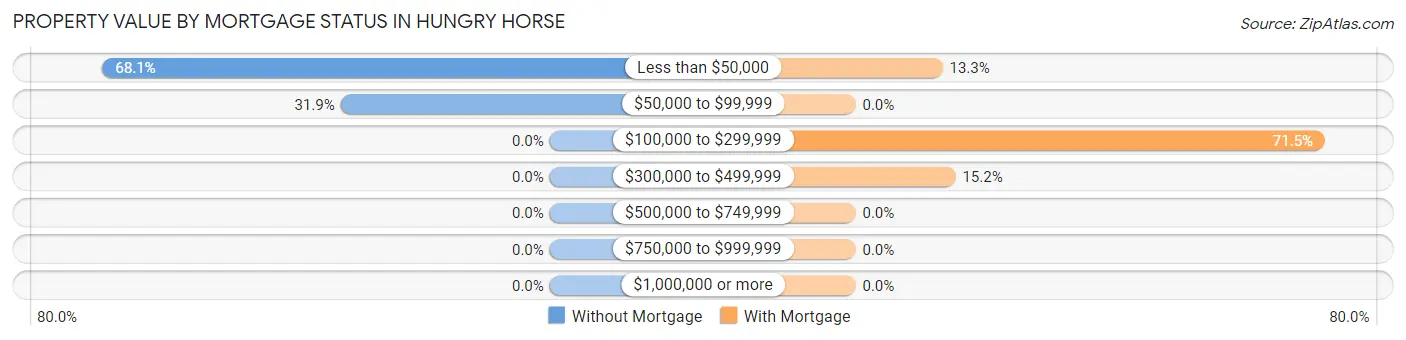
| Property Value | Without Mortgage | With Mortgage |
| Less than $50,000 | 77 (68.1%) | 20 (13.3%) |
| $50,000 to $99,999 | 36 (31.9%) | 0 (0.0%) |
| $100,000 to $299,999 | 0 (0.0%) | 108 (71.5%) |
| $300,000 to $499,999 | 0 (0.0%) | 23 (15.2%) |
| $500,000 to $749,999 | 0 (0.0%) | 0 (0.0%) |
| $750,000 to $999,999 | 0 (0.0%) | 0 (0.0%) |
| $1,000,000 or more | 0 (0.0%) | 0 (0.0%) |
| Total | 113 (100.0%) | 151 (100.0%) |
Household Income by Mortgage Status in Hungry Horse
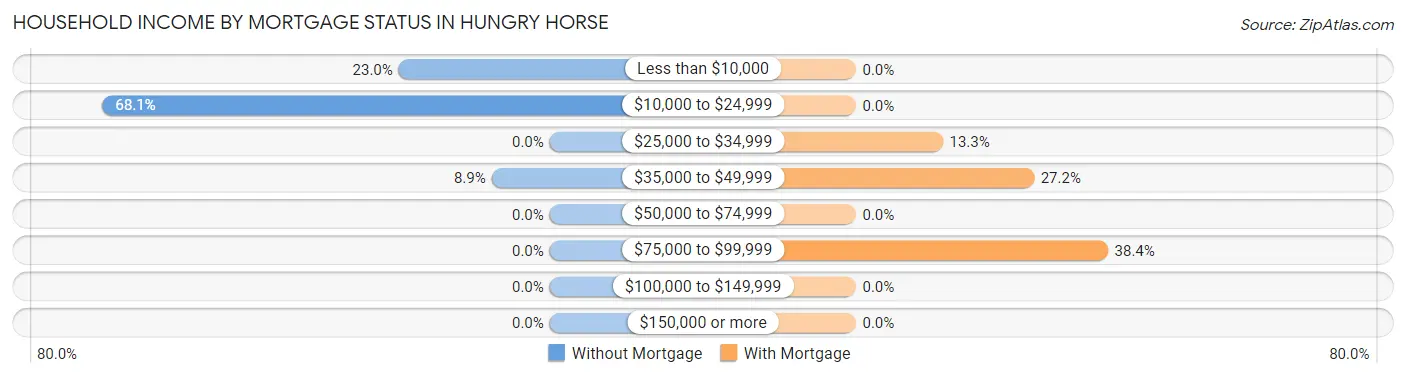
| Household Income | Without Mortgage | With Mortgage |
| Less than $10,000 | 26 (23.0%) | 0 (0.0%) |
| $10,000 to $24,999 | 77 (68.1%) | 0 (0.0%) |
| $25,000 to $34,999 | 0 (0.0%) | 20 (13.3%) |
| $35,000 to $49,999 | 10 (8.8%) | 41 (27.2%) |
| $50,000 to $74,999 | 0 (0.0%) | 0 (0.0%) |
| $75,000 to $99,999 | 0 (0.0%) | 58 (38.4%) |
| $100,000 to $149,999 | 0 (0.0%) | 0 (0.0%) |
| $150,000 or more | 0 (0.0%) | 0 (0.0%) |
| Total | 113 (100.0%) | 151 (100.0%) |
Property Value to Household Income Ratio in Hungry Horse
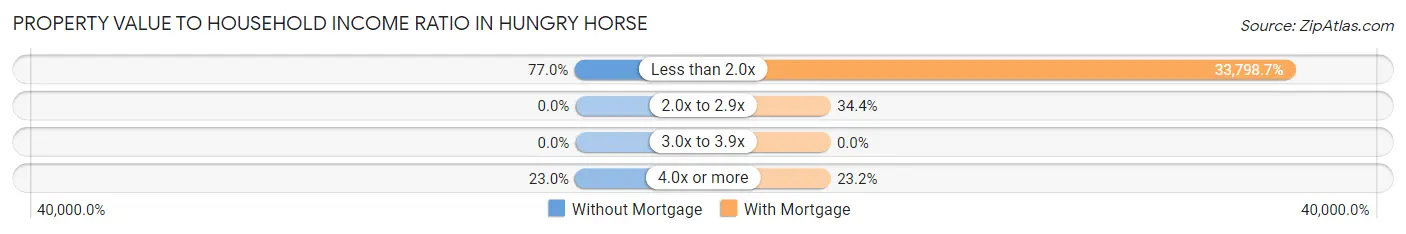
| Value-to-Income Ratio | Without Mortgage | With Mortgage |
| Less than 2.0x | 87 (77.0%) | 51,036 (33,798.7%) |
| 2.0x to 2.9x | 0 (0.0%) | 52 (34.4%) |
| 3.0x to 3.9x | 0 (0.0%) | 0 (0.0%) |
| 4.0x or more | 26 (23.0%) | 35 (23.2%) |
| Total | 113 (100.0%) | 151 (100.0%) |
Real Estate Taxes by Mortgage Status in Hungry Horse
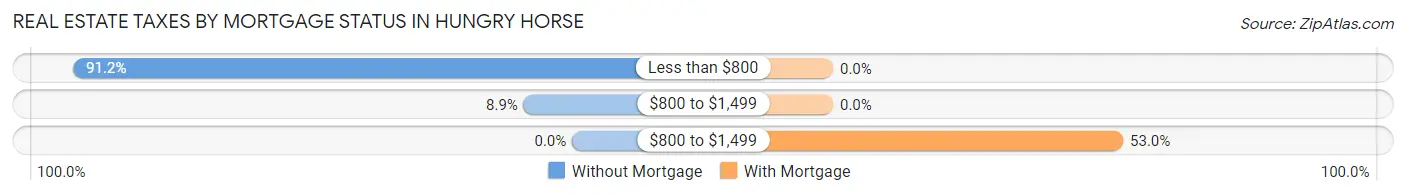
| Property Taxes | Without Mortgage | With Mortgage |
| Less than $800 | 103 (91.1%) | 0 (0.0%) |
| $800 to $1,499 | 10 (8.8%) | 0 (0.0%) |
| $800 to $1,499 | 0 (0.0%) | 80 (53.0%) |
| Total | 113 (100.0%) | 151 (100.0%) |
Health & Disability in Hungry Horse
Health Insurance Coverage by Age in Hungry Horse
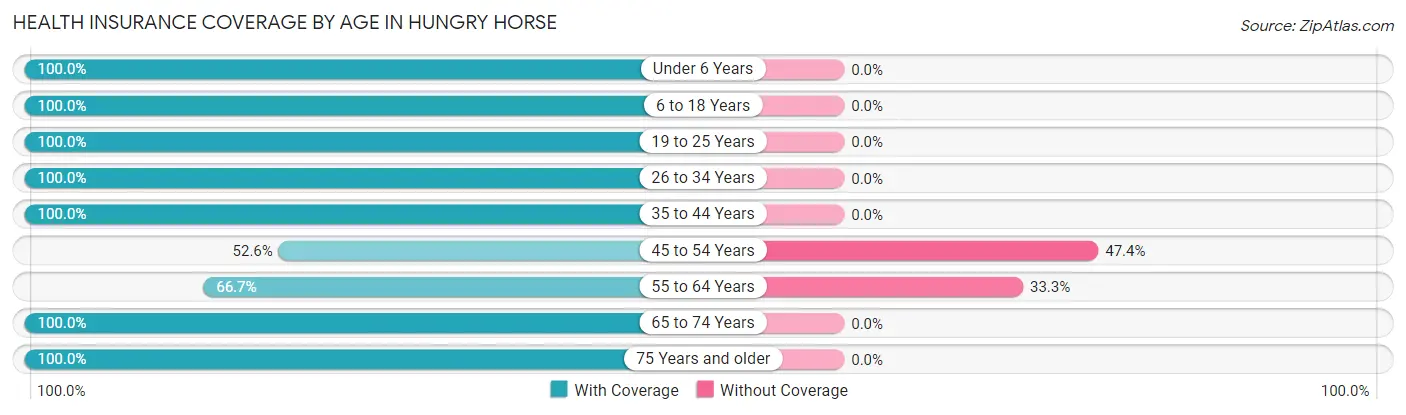
| Age Bracket | With Coverage | Without Coverage |
| Under 6 Years | 115 (100.0%) | 0 (0.0%) |
| 6 to 18 Years | 164 (100.0%) | 0 (0.0%) |
| 19 to 25 Years | 80 (100.0%) | 0 (0.0%) |
| 26 to 34 Years | 91 (100.0%) | 0 (0.0%) |
| 35 to 44 Years | 62 (100.0%) | 0 (0.0%) |
| 45 to 54 Years | 60 (52.6%) | 54 (47.4%) |
| 55 to 64 Years | 58 (66.7%) | 29 (33.3%) |
| 65 to 74 Years | 116 (100.0%) | 0 (0.0%) |
| 75 Years and older | 62 (100.0%) | 0 (0.0%) |
| Total | 808 (90.7%) | 83 (9.3%) |
Health Insurance Coverage by Citizenship Status in Hungry Horse
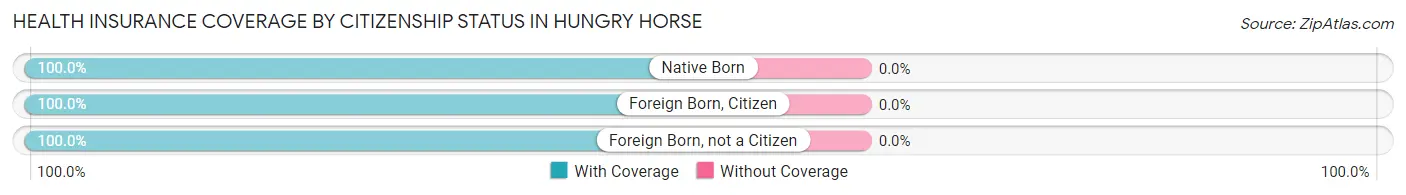
| Citizenship Status | With Coverage | Without Coverage |
| Native Born | 115 (100.0%) | 0 (0.0%) |
| Foreign Born, Citizen | 164 (100.0%) | 0 (0.0%) |
| Foreign Born, not a Citizen | 80 (100.0%) | 0 (0.0%) |
Health Insurance Coverage by Household Income in Hungry Horse
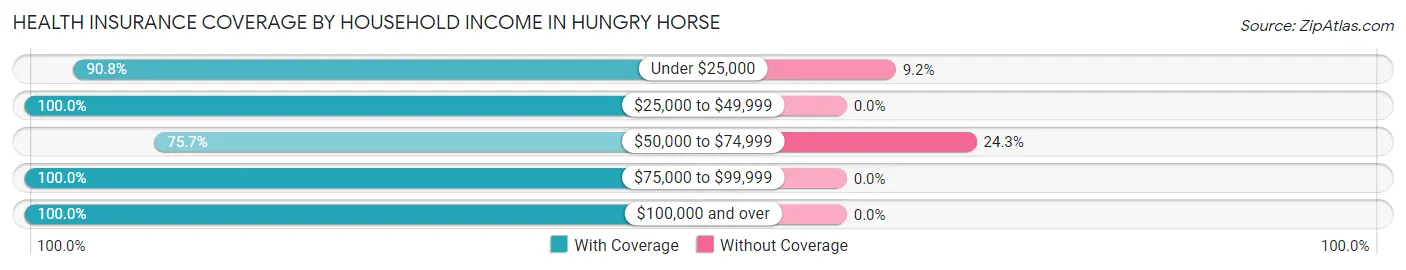
| Household Income | With Coverage | Without Coverage |
| Under $25,000 | 198 (90.8%) | 20 (9.2%) |
| $25,000 to $49,999 | 233 (100.0%) | 0 (0.0%) |
| $50,000 to $74,999 | 196 (75.7%) | 63 (24.3%) |
| $75,000 to $99,999 | 92 (100.0%) | 0 (0.0%) |
| $100,000 and over | 61 (100.0%) | 0 (0.0%) |
Public vs Private Health Insurance Coverage by Age in Hungry Horse
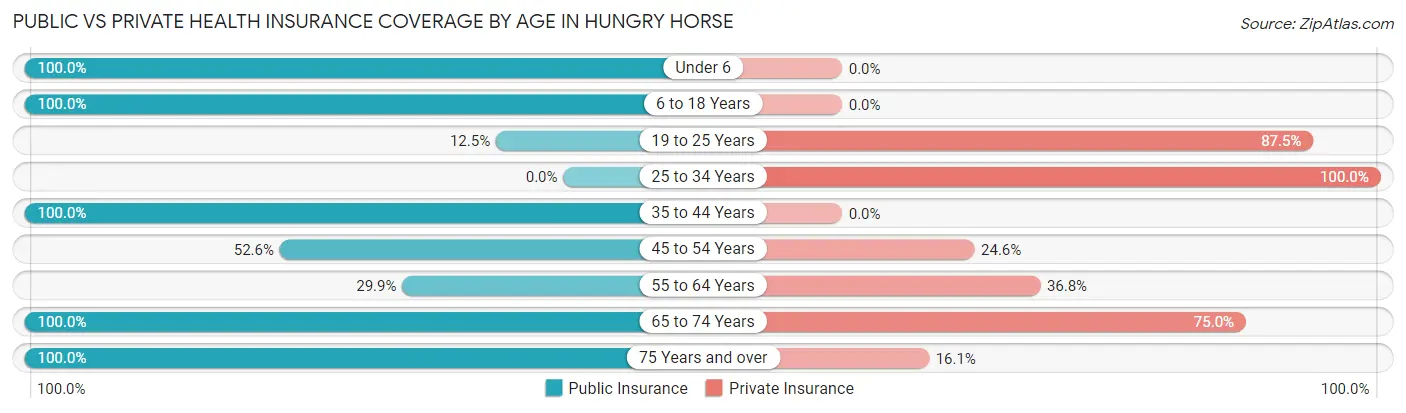
| Age Bracket | Public Insurance | Private Insurance |
| Under 6 | 115 (100.0%) | 0 (0.0%) |
| 6 to 18 Years | 164 (100.0%) | 0 (0.0%) |
| 19 to 25 Years | 10 (12.5%) | 70 (87.5%) |
| 25 to 34 Years | 0 (0.0%) | 91 (100.0%) |
| 35 to 44 Years | 62 (100.0%) | 0 (0.0%) |
| 45 to 54 Years | 60 (52.6%) | 28 (24.6%) |
| 55 to 64 Years | 26 (29.9%) | 32 (36.8%) |
| 65 to 74 Years | 116 (100.0%) | 87 (75.0%) |
| 75 Years and over | 62 (100.0%) | 10 (16.1%) |
| Total | 615 (69.0%) | 318 (35.7%) |
Disability Status by Sex by Age in Hungry Horse
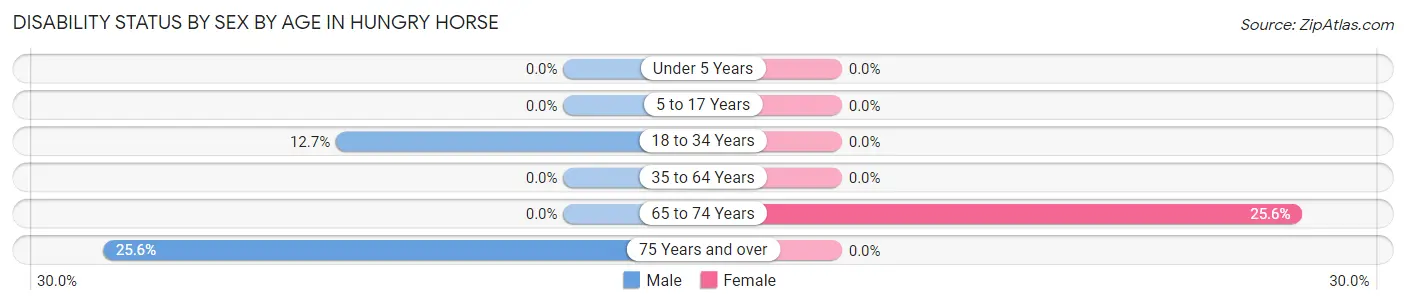
| Age Bracket | Male | Female |
| Under 5 Years | 0 (0.0%) | 0 (0.0%) |
| 5 to 17 Years | 0 (0.0%) | 0 (0.0%) |
| 18 to 34 Years | 10 (12.7%) | 0 (0.0%) |
| 35 to 64 Years | 0 (0.0%) | 0 (0.0%) |
| 65 to 74 Years | 0 (0.0%) | 10 (25.6%) |
| 75 Years and over | 10 (25.6%) | 0 (0.0%) |
Disability Class by Sex by Age in Hungry Horse
Disability Class: Hearing Difficulty
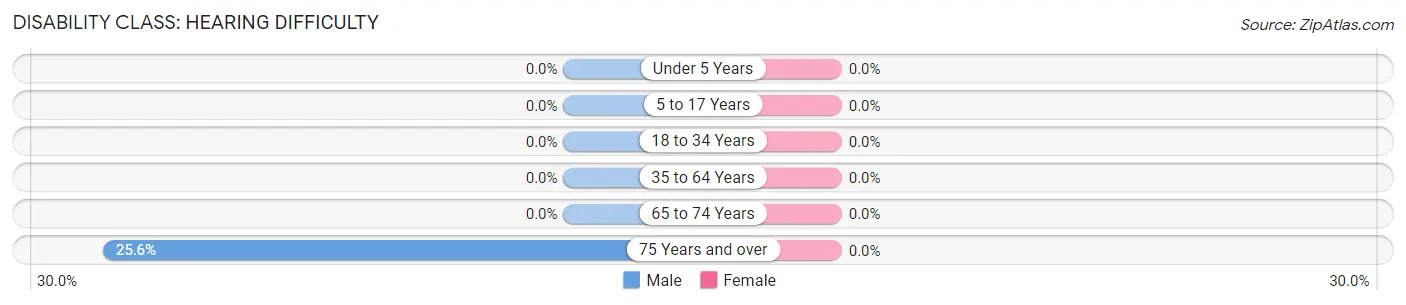
| Age Bracket | Male | Female |
| Under 5 Years | 0 (0.0%) | 0 (0.0%) |
| 5 to 17 Years | 0 (0.0%) | 0 (0.0%) |
| 18 to 34 Years | 0 (0.0%) | 0 (0.0%) |
| 35 to 64 Years | 0 (0.0%) | 0 (0.0%) |
| 65 to 74 Years | 0 (0.0%) | 0 (0.0%) |
| 75 Years and over | 10 (25.6%) | 0 (0.0%) |
Disability Class: Vision Difficulty
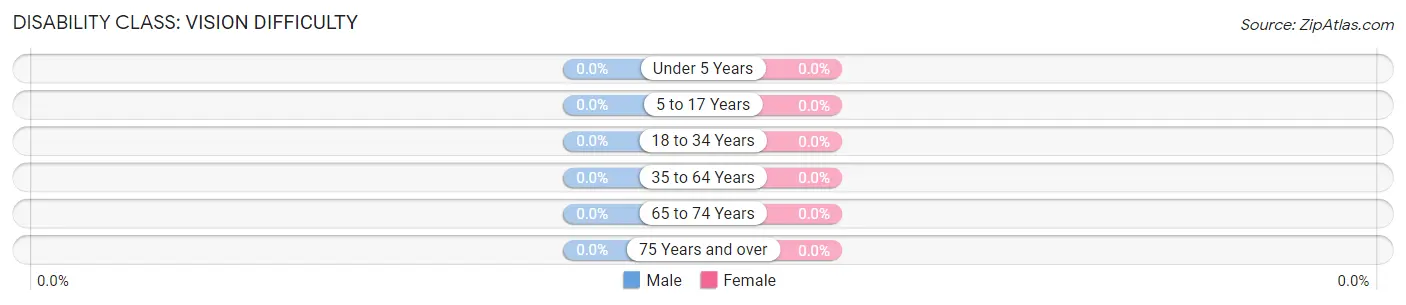
| Age Bracket | Male | Female |
| Under 5 Years | 0 (0.0%) | 0 (0.0%) |
| 5 to 17 Years | 0 (0.0%) | 0 (0.0%) |
| 18 to 34 Years | 0 (0.0%) | 0 (0.0%) |
| 35 to 64 Years | 0 (0.0%) | 0 (0.0%) |
| 65 to 74 Years | 0 (0.0%) | 0 (0.0%) |
| 75 Years and over | 0 (0.0%) | 0 (0.0%) |
Disability Class: Cognitive Difficulty
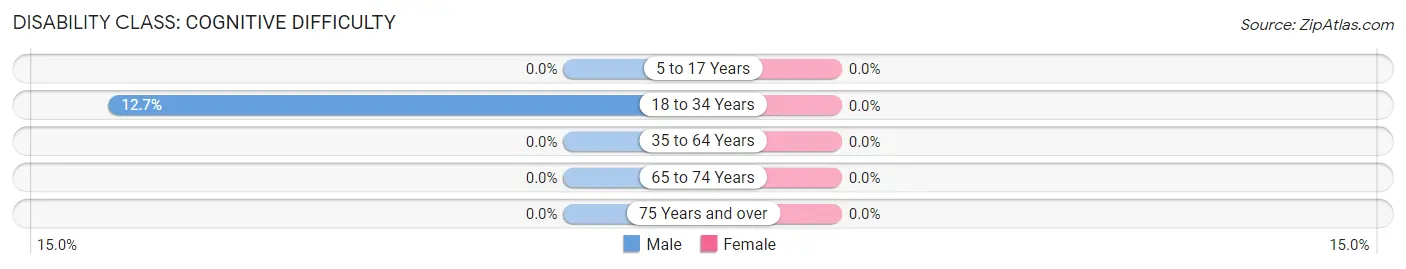
| Age Bracket | Male | Female |
| 5 to 17 Years | 0 (0.0%) | 0 (0.0%) |
| 18 to 34 Years | 10 (12.7%) | 0 (0.0%) |
| 35 to 64 Years | 0 (0.0%) | 0 (0.0%) |
| 65 to 74 Years | 0 (0.0%) | 0 (0.0%) |
| 75 Years and over | 0 (0.0%) | 0 (0.0%) |
Disability Class: Ambulatory Difficulty
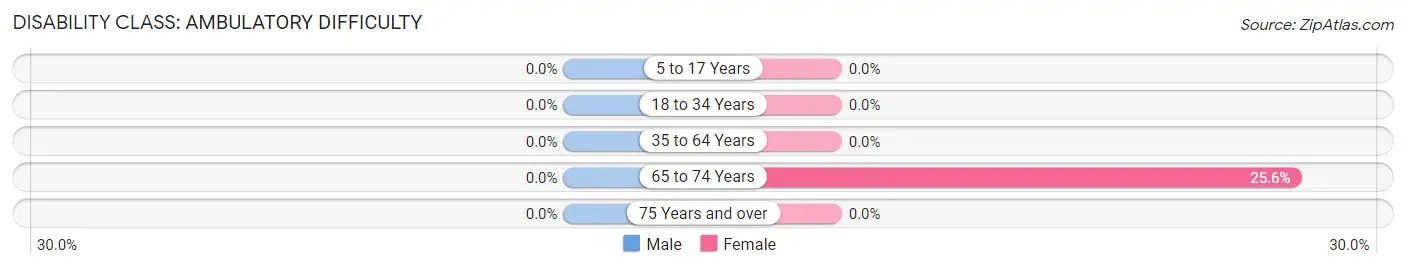
| Age Bracket | Male | Female |
| 5 to 17 Years | 0 (0.0%) | 0 (0.0%) |
| 18 to 34 Years | 0 (0.0%) | 0 (0.0%) |
| 35 to 64 Years | 0 (0.0%) | 0 (0.0%) |
| 65 to 74 Years | 0 (0.0%) | 10 (25.6%) |
| 75 Years and over | 0 (0.0%) | 0 (0.0%) |
Disability Class: Self-Care Difficulty
| Age Bracket | Male | Female |
| 5 to 17 Years | 0 (0.0%) | 0 (0.0%) |
| 18 to 34 Years | 0 (0.0%) | 0 (0.0%) |
| 35 to 64 Years | 0 (0.0%) | 0 (0.0%) |
| 65 to 74 Years | 0 (0.0%) | 0 (0.0%) |
| 75 Years and over | 0 (0.0%) | 0 (0.0%) |
Technology Access in Hungry Horse
Computing Device Access in Hungry Horse
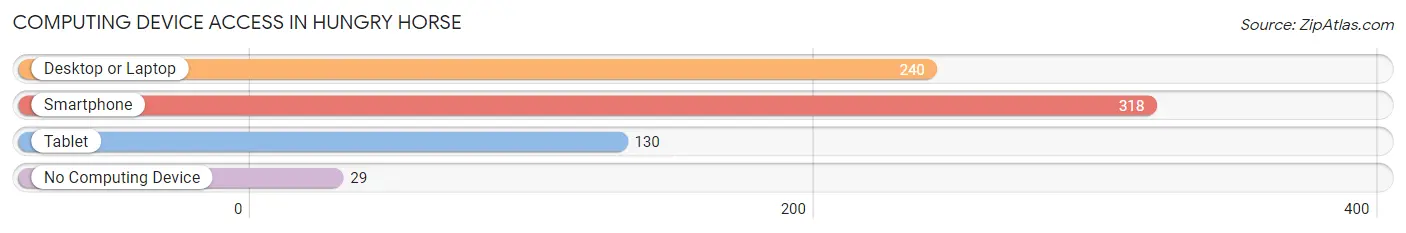
| Device Type | # Households | % Households |
| Desktop or Laptop | 240 | 62.2% |
| Smartphone | 318 | 82.4% |
| Tablet | 130 | 33.7% |
| No Computing Device | 29 | 7.5% |
| Total | 386 | 100.0% |
Internet Access in Hungry Horse
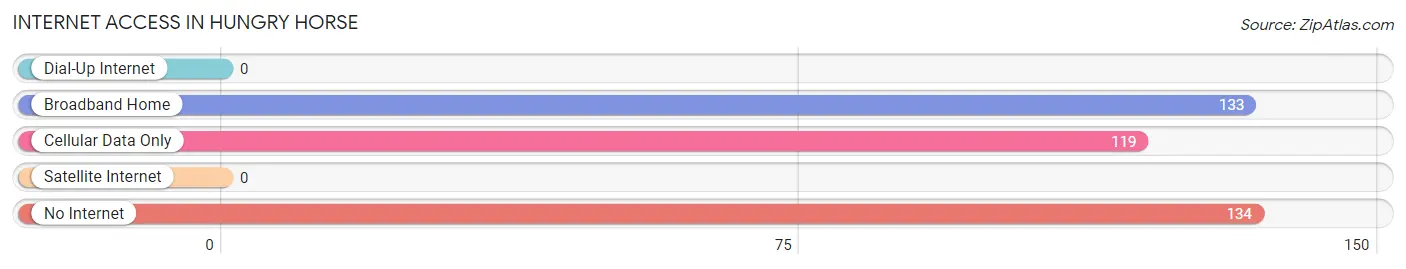
| Internet Type | # Households | % Households |
| Dial-Up Internet | 0 | 0.0% |
| Broadband Home | 133 | 34.5% |
| Cellular Data Only | 119 | 30.8% |
| Satellite Internet | 0 | 0.0% |
| No Internet | 134 | 34.7% |
| Total | 386 | 100.0% |
Hungry Horse Summary
Hungry Horse, Montana is a small town located in the Flathead Valley of the Rocky Mountains. It is situated in the northwestern corner of the state, just south of the Canadian border. The town was founded in the early 1900s and has a population of just over 1,000 people.
Geography
Hungry Horse is located in the Flathead Valley of the Rocky Mountains. The town is situated in the northwestern corner of the state, just south of the Canadian border. The town is surrounded by the Flathead National Forest and is close to the Flathead River. The town is located at an elevation of 3,400 feet and has a total area of 0.7 square miles.
The climate in Hungry Horse is generally mild, with warm summers and cold winters. The average high temperature in the summer is around 80 degrees Fahrenheit, while the average low temperature in the winter is around 20 degrees Fahrenheit. The town receives an average of 20 inches of precipitation per year, with most of it falling in the form of snow.
Economy
The economy of Hungry Horse is largely based on tourism and agriculture. The town is home to several tourist attractions, including the Hungry Horse Dam, which is the largest hydroelectric dam in the United States. The dam is a popular destination for fishing, boating, and camping. The town is also home to several ski resorts, which attract visitors from all over the world.
Agriculture is also an important part of the local economy. The town is home to several farms, which produce a variety of crops, including wheat, barley, hay, and potatoes. The town is also home to several cattle ranches, which produce beef and dairy products.
Demographics
As of the 2010 census, the population of Hungry Horse was 1,068. The town is predominantly white, with 92.3% of the population identifying as white. The remaining population is made up of Native Americans (3.2%), African Americans (1.2%), and other races (3.3%).
The median household income in Hungry Horse is $37,500, and the median age is 44. The town has a high rate of poverty, with 22.3% of the population living below the poverty line.
History
Hungry Horse was founded in the early 1900s by settlers from the Flathead Valley. The town was named after a nearby mountain, which was said to resemble a horse with its head hung low, looking for food. The town was originally a logging and mining town, but it eventually shifted to an agricultural and tourism-based economy.
The town was incorporated in 1947 and has remained relatively small since then. The town is home to several tourist attractions, including the Hungry Horse Dam, which is the largest hydroelectric dam in the United States. The town is also home to several ski resorts, which attract visitors from all over the world.
Conclusion
Hungry Horse, Montana is a small town located in the Flathead Valley of the Rocky Mountains. It is situated in the northwestern corner of the state, just south of the Canadian border. The town was founded in the early 1900s and has a population of just over 1,000 people. The economy of Hungry Horse is largely based on tourism and agriculture, and the town is home to several tourist attractions, including the Hungry Horse Dam. The town is predominantly white, with 92.3% of the population identifying as white. The median household income in Hungry Horse is $37,500, and the median age is 44. The town has a high rate of poverty, with 22.3% of the population living below the poverty line.
Common Questions
What is Per Capita Income in Hungry Horse?
Per Capita income in Hungry Horse is $22,488.
What is the Median Family Income in Hungry Horse?
Median Family Income in Hungry Horse is $32,163.
What is the Median Household income in Hungry Horse?
Median Household Income in Hungry Horse is $38,750.
What is Inequality or Gini Index in Hungry Horse?
Inequality or Gini Index in Hungry Horse is 0.41.
What is the Total Population of Hungry Horse?
Total Population of Hungry Horse is 891.
What is the Total Male Population of Hungry Horse?
Total Male Population of Hungry Horse is 614.
What is the Total Female Population of Hungry Horse?
Total Female Population of Hungry Horse is 277.
What is the Ratio of Males per 100 Females in Hungry Horse?
There are 221.66 Males per 100 Females in Hungry Horse.
What is the Ratio of Females per 100 Males in Hungry Horse?
There are 45.11 Females per 100 Males in Hungry Horse.
What is the Median Population Age in Hungry Horse?
Median Population Age in Hungry Horse is 33.9 Years.
What is the Average Family Size in Hungry Horse
Average Family Size in Hungry Horse is 2.8 People.
What is the Average Household Size in Hungry Horse
Average Household Size in Hungry Horse is 2.2 People.
How Large is the Labor Force in Hungry Horse?
There are 325 People in the Labor Forcein in Hungry Horse.
What is the Percentage of People in the Labor Force in Hungry Horse?
53.1% of People are in the Labor Force in Hungry Horse.