Zip Codes with the Highest Percentage of Population Employed in Food Preparation & Serving in Great Falls, MT
RELATED REPORTS & OPTIONS
Food Preparation & Serving
Great Falls
Compare Zip Codes
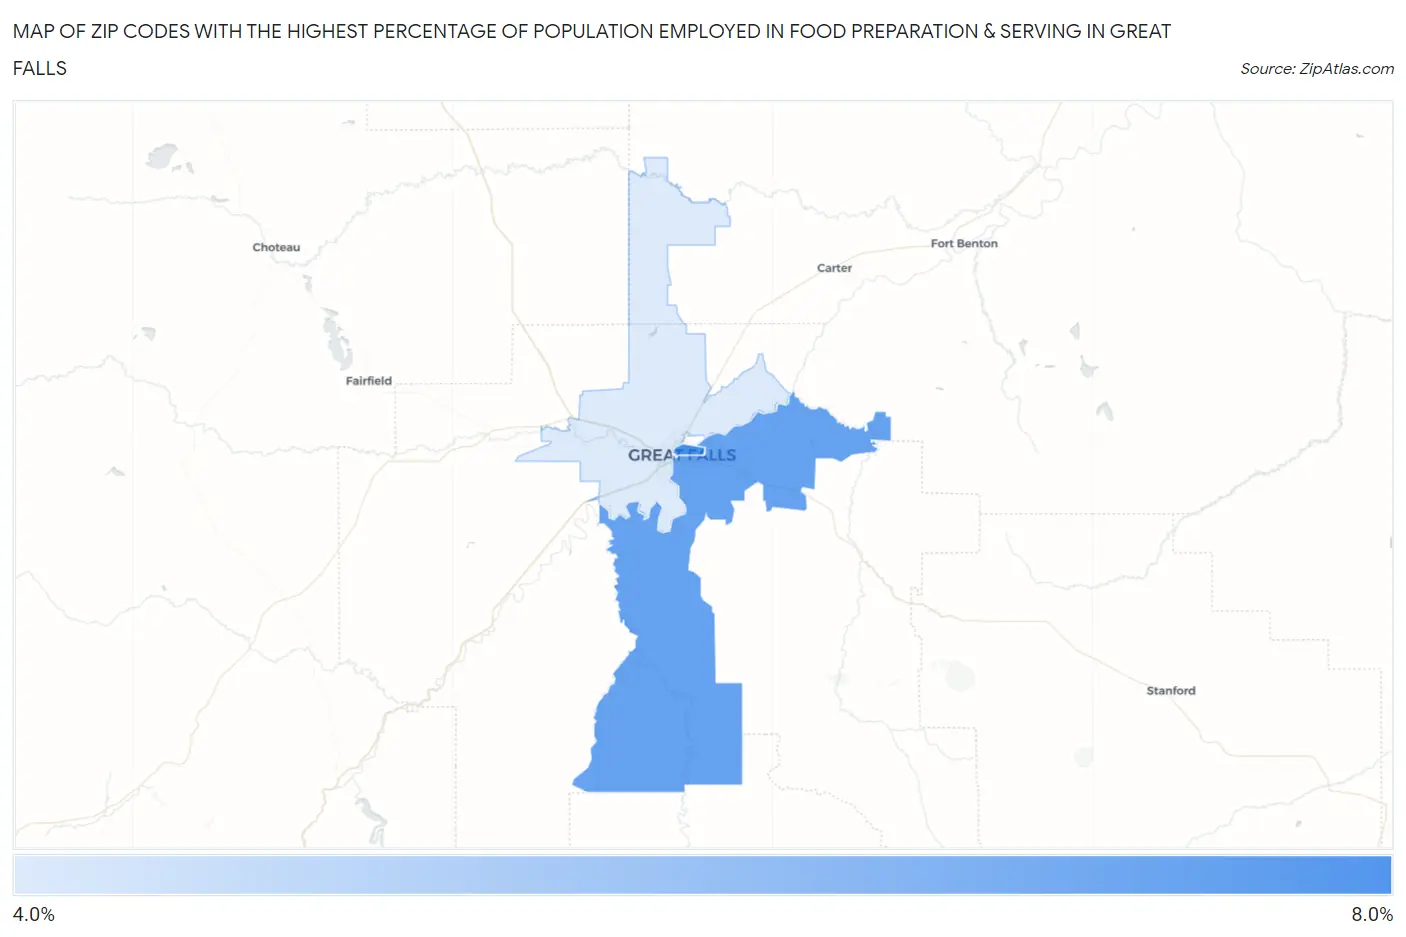
Map of Zip Codes with the Highest Percentage of Population Employed in Food Preparation & Serving in Great Falls
4.9%
7.9%
Zip Codes with the Highest Percentage of Population Employed in Food Preparation & Serving in Great Falls, MT
| Zip Code | % Employed | vs State | vs National | |
| 1. | 59401 | 7.9% | 6.7%(+1.19)#87 | 5.3%(+2.63)#4,866 |
| 2. | 59405 | 7.3% | 6.7%(+0.598)#99 | 5.3%(+2.03)#5,888 |
| 3. | 59404 | 4.9% | 6.7%(-1.86)#169 | 5.3%(-0.423)#13,507 |
1
Common Questions
What are the Top Zip Codes with the Highest Percentage of Population Employed in Food Preparation & Serving in Great Falls, MT?
Top Zip Codes with the Highest Percentage of Population Employed in Food Preparation & Serving in Great Falls, MT are:
What zip code has the Highest Percentage of Population Employed in Food Preparation & Serving in Great Falls, MT?
59401 has the Highest Percentage of Population Employed in Food Preparation & Serving in Great Falls, MT with 7.9%.
What is the Percentage of Population Employed in Food Preparation & Serving in Great Falls, MT?
Percentage of Population Employed in Food Preparation & Serving in Great Falls is 6.8%.
What is the Percentage of Population Employed in Food Preparation & Serving in Montana?
Percentage of Population Employed in Food Preparation & Serving in Montana is 6.7%.
What is the Percentage of Population Employed in Food Preparation & Serving in the United States?
Percentage of Population Employed in Food Preparation & Serving in the United States is 5.3%.