Zip Codes with the Highest Percentage of Population Employed in Food Preparation & Serving in Butte, MT
RELATED REPORTS & OPTIONS
Food Preparation & Serving
Butte
Compare Zip Codes
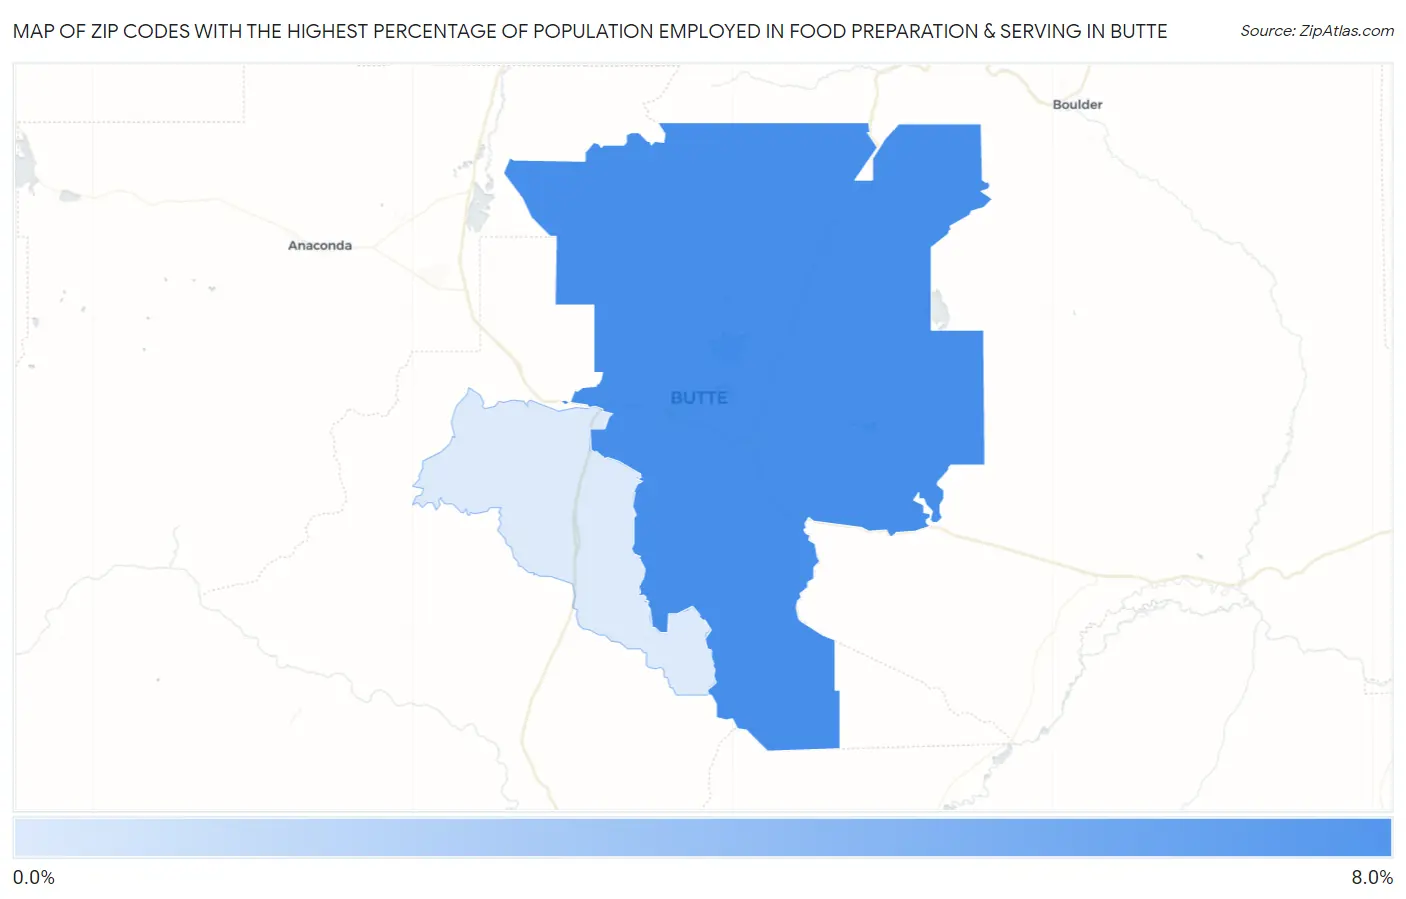
Map of Zip Codes with the Highest Percentage of Population Employed in Food Preparation & Serving in Butte
0.68%
6.3%
Zip Codes with the Highest Percentage of Population Employed in Food Preparation & Serving in Butte, MT
| Zip Code | % Employed | vs State | vs National | |
| 1. | 59701 | 6.3% | 6.7%(-0.419)#125 | 5.3%(+1.02)#8,431 |
| 2. | 59750 | 0.68% | 6.7%(-6.04)#265 | 5.3%(-4.61)#27,484 |
1
Common Questions
What are the Top Zip Codes with the Highest Percentage of Population Employed in Food Preparation & Serving in Butte, MT?
Top Zip Codes with the Highest Percentage of Population Employed in Food Preparation & Serving in Butte, MT are:
What zip code has the Highest Percentage of Population Employed in Food Preparation & Serving in Butte, MT?
59701 has the Highest Percentage of Population Employed in Food Preparation & Serving in Butte, MT with 6.3%.
What is the Percentage of Population Employed in Food Preparation & Serving in Montana?
Percentage of Population Employed in Food Preparation & Serving in Montana is 6.7%.
What is the Percentage of Population Employed in Food Preparation & Serving in the United States?
Percentage of Population Employed in Food Preparation & Serving in the United States is 5.3%.