Box Elder, MT Map & Demographics
Box Elder Map
Box Elder Overview
$27,919
PER CAPITA INCOME
$38,958
AVG HOUSEHOLD INCOME
5.1%
WAGE / INCOME GAP [ % ]
94.9¢/ $1
WAGE / INCOME GAP [ $ ]
0.31
INEQUALITY / GINI INDEX
68
TOTAL POPULATION
29
MALE POPULATION
39
FEMALE POPULATION
74.36
MALES / 100 FEMALES
134.48
FEMALES / 100 MALES
25.0
MEDIAN AGE
2.9
AVG FAMILY SIZE
1.9
AVG HOUSEHOLD SIZE
38
LABOR FORCE [ PEOPLE ]
74.5%
PERCENT IN LABOR FORCE
Box Elder Zip Codes
Box Elder Area Codes
Income in Box Elder
Income Overview in Box Elder
| Characteristic | Number | Measure |
| Per Capita Income | 68 | $27,919 |
| Median Family Income | 17 | $0 |
| Mean Family Income | 17 | $78,194 |
| Median Household Income | 35 | $38,958 |
| Mean Household Income | 35 | $55,906 |
| Income Deficit | 17 | $0 |
| Wage / Income Gap (%) | 68 | 5.05% |
| Wage / Income Gap ($) | 68 | 94.95¢ per $1 |
| Gini / Inequality Index | 68 | 0.31 |
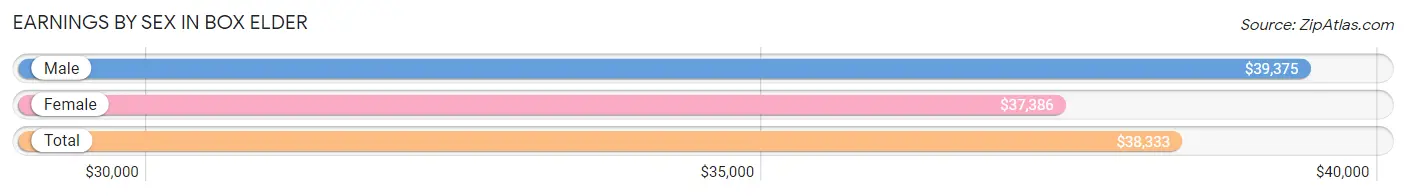
Earnings by Sex in Box Elder
Average Earnings in Box Elder are $38,333, $39,375 for men and $37,386 for women, a difference of 5.1%.
| Sex | Number | Average Earnings |
| Male | 17 (44.7%) | $39,375 |
| Female | 21 (55.3%) | $37,386 |
| Total | 38 (100.0%) | $38,333 |
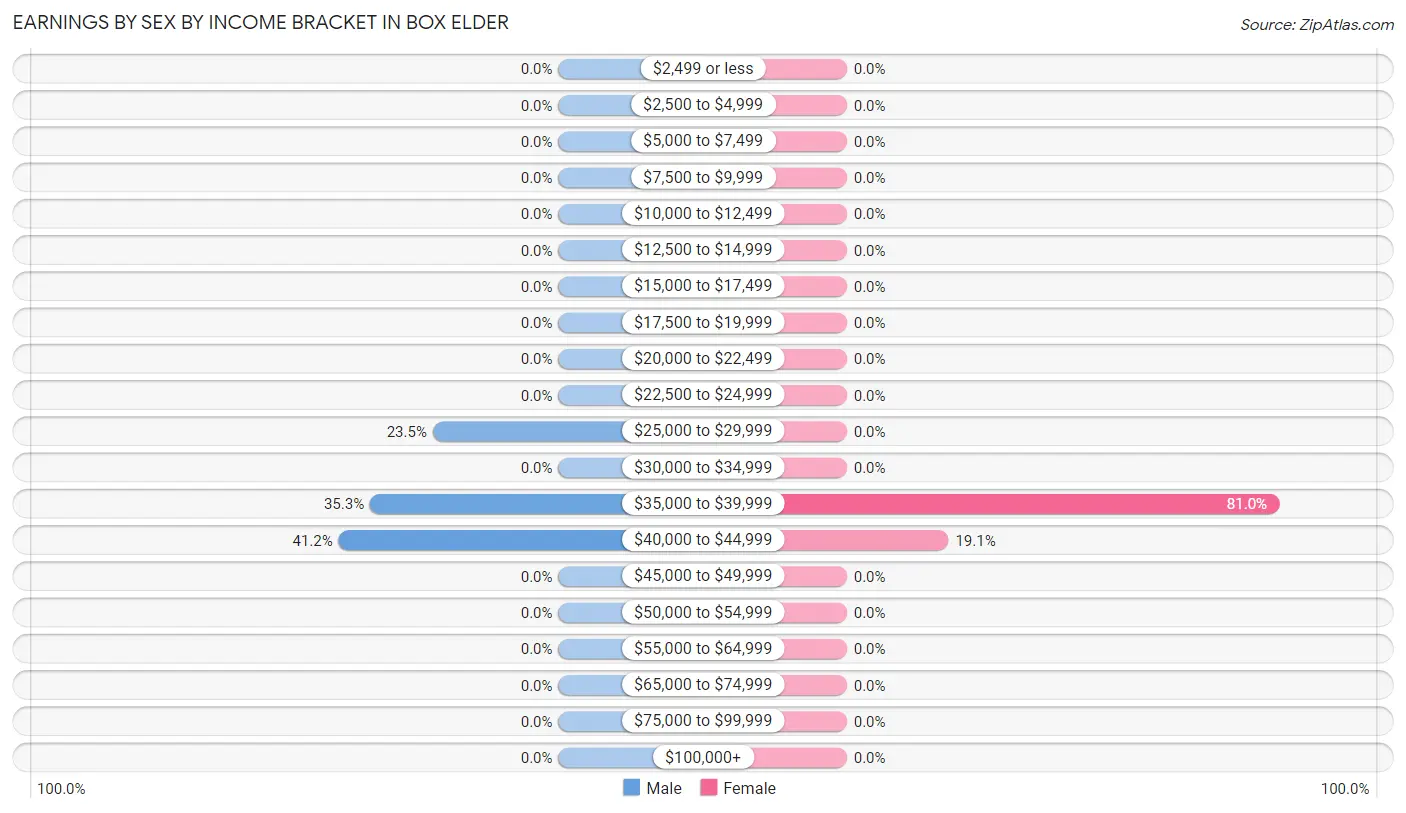
Earnings by Sex by Income Bracket in Box Elder
The most common earnings brackets in Box Elder are $40,000 to $44,999 for men (7 | 41.2%) and $35,000 to $39,999 for women (17 | 80.9%).
| Income | Male | Female |
| $2,499 or less | 0 (0.0%) | 0 (0.0%) |
| $2,500 to $4,999 | 0 (0.0%) | 0 (0.0%) |
| $5,000 to $7,499 | 0 (0.0%) | 0 (0.0%) |
| $7,500 to $9,999 | 0 (0.0%) | 0 (0.0%) |
| $10,000 to $12,499 | 0 (0.0%) | 0 (0.0%) |
| $12,500 to $14,999 | 0 (0.0%) | 0 (0.0%) |
| $15,000 to $17,499 | 0 (0.0%) | 0 (0.0%) |
| $17,500 to $19,999 | 0 (0.0%) | 0 (0.0%) |
| $20,000 to $22,499 | 0 (0.0%) | 0 (0.0%) |
| $22,500 to $24,999 | 0 (0.0%) | 0 (0.0%) |
| $25,000 to $29,999 | 4 (23.5%) | 0 (0.0%) |
| $30,000 to $34,999 | 0 (0.0%) | 0 (0.0%) |
| $35,000 to $39,999 | 6 (35.3%) | 17 (80.9%) |
| $40,000 to $44,999 | 7 (41.2%) | 4 (19.1%) |
| $45,000 to $49,999 | 0 (0.0%) | 0 (0.0%) |
| $50,000 to $54,999 | 0 (0.0%) | 0 (0.0%) |
| $55,000 to $64,999 | 0 (0.0%) | 0 (0.0%) |
| $65,000 to $74,999 | 0 (0.0%) | 0 (0.0%) |
| $75,000 to $99,999 | 0 (0.0%) | 0 (0.0%) |
| $100,000+ | 0 (0.0%) | 0 (0.0%) |
| Total | 17 (100.0%) | 21 (100.0%) |
Earnings by Sex by Educational Attainment in Box Elder
| Educational Attainment | Male Income | Female Income |
| Less than High School | - | - |
| High School Diploma | - | - |
| College or Associate's Degree | - | - |
| Bachelor's Degree | - | - |
| Graduate Degree | - | - |
| Total | - | - |
Family Income in Box Elder
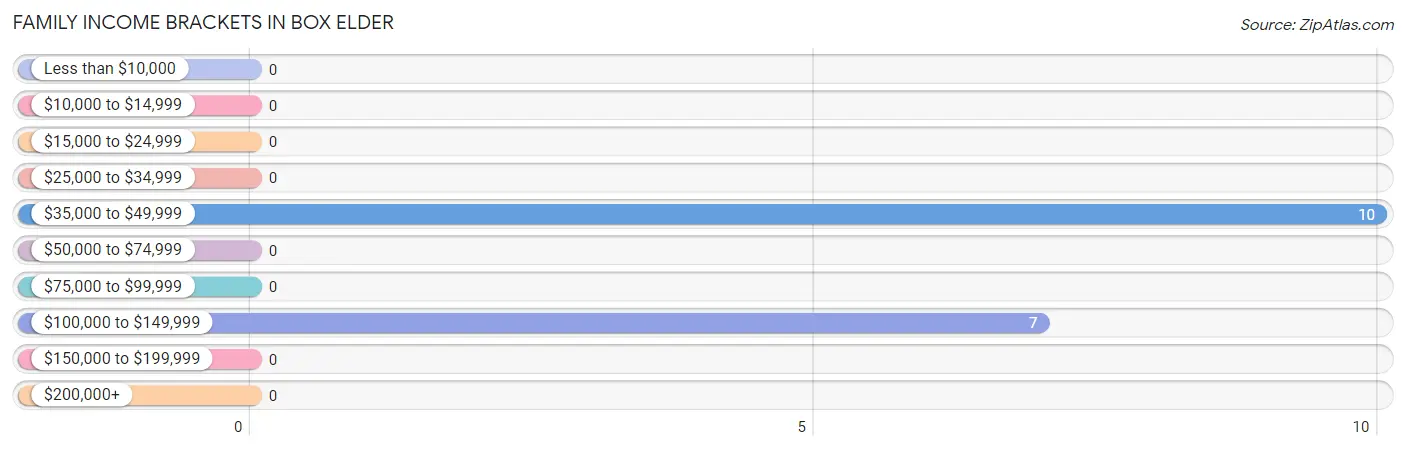
Family Income Brackets in Box Elder
According to the Box Elder family income data, there are 10 families falling into the $35,000 to $49,999 income range, which is the most common income bracket and makes up 58.8% of all families.
| Income Bracket | # Families | % Families |
| Less than $10,000 | 0 | 0.0% |
| $10,000 to $14,999 | 0 | 0.0% |
| $15,000 to $24,999 | 0 | 0.0% |
| $25,000 to $34,999 | 0 | 0.0% |
| $35,000 to $49,999 | 10 | 58.8% |
| $50,000 to $74,999 | 0 | 0.0% |
| $75,000 to $99,999 | 0 | 0.0% |
| $100,000 to $149,999 | 7 | 41.2% |
| $150,000 to $199,999 | 0 | 0.0% |
| $200,000+ | 0 | 0.0% |
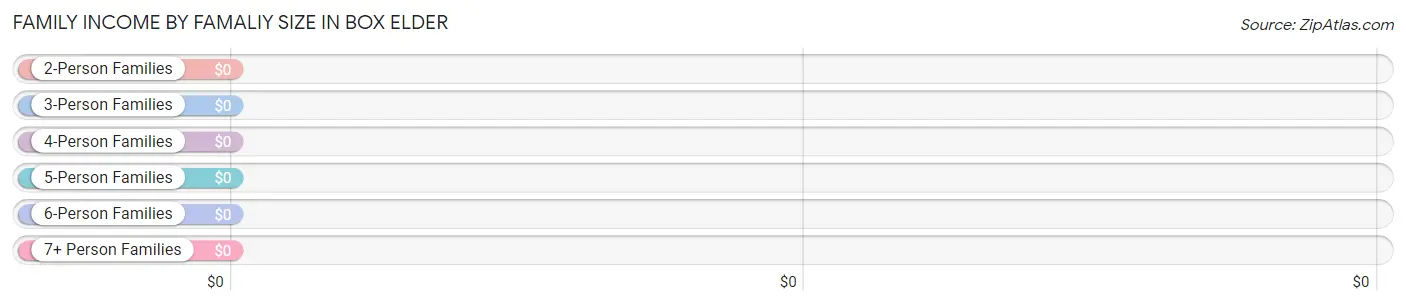
Family Income by Famaliy Size in Box Elder
| Income Bracket | # Families | Median Income |
| 2-Person Families | 7 (41.2%) | $0 |
| 3-Person Families | 10 (58.8%) | $0 |
| 4-Person Families | 0 (0.0%) | $0 |
| 5-Person Families | 0 (0.0%) | $0 |
| 6-Person Families | 0 (0.0%) | $0 |
| 7+ Person Families | 0 (0.0%) | $0 |
| Total | 17 (100.0%) | $0 |
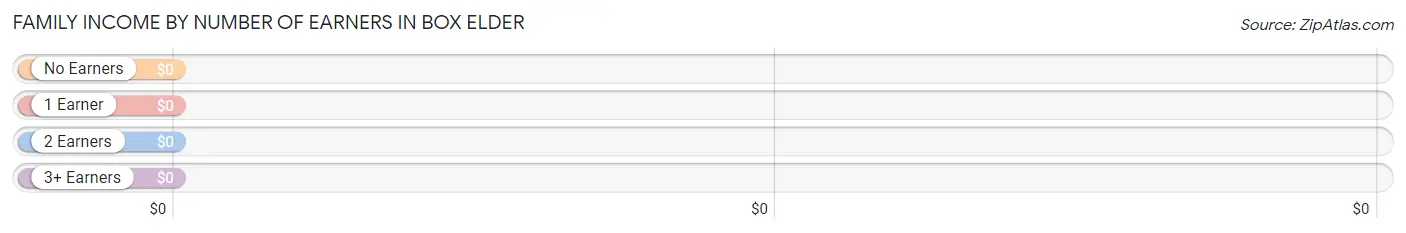
Family Income by Number of Earners in Box Elder
| Number of Earners | # Families | Median Income |
| No Earners | 0 (0.0%) | $0 |
| 1 Earner | 10 (58.8%) | $0 |
| 2 Earners | 7 (41.2%) | $0 |
| 3+ Earners | 0 (0.0%) | $0 |
| Total | 17 (100.0%) | $0 |
Household Income in Box Elder
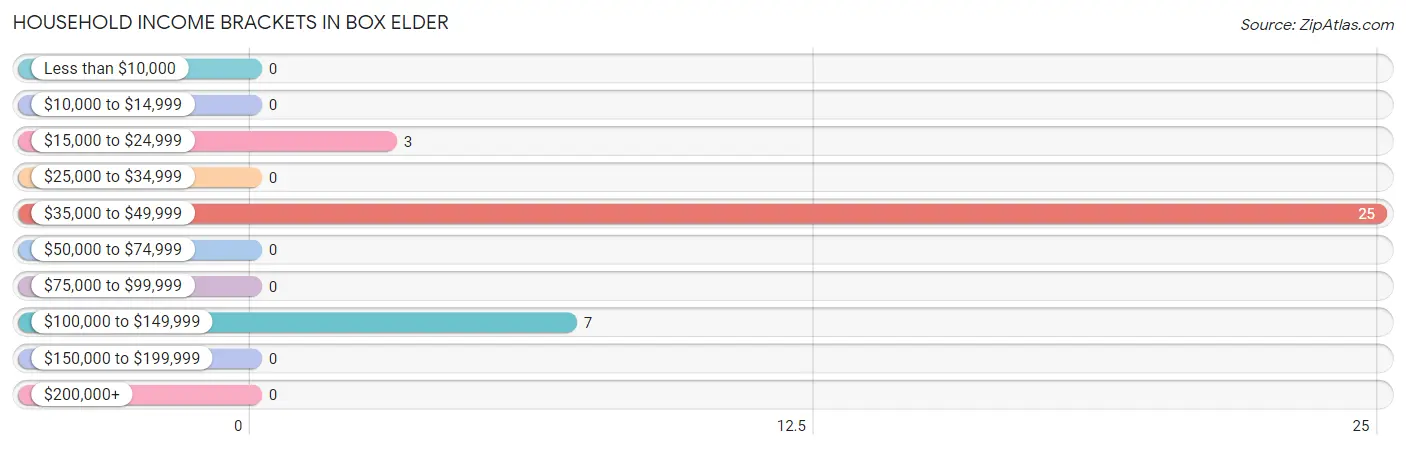
Household Income Brackets in Box Elder
With 25 households falling in the category, the $35,000 to $49,999 income range is the most frequent in Box Elder, accounting for 71.4% of all households.
| Income Bracket | # Households | % Households |
| Less than $10,000 | 0 | 0.0% |
| $10,000 to $14,999 | 0 | 0.0% |
| $15,000 to $24,999 | 3 | 8.6% |
| $25,000 to $34,999 | 0 | 0.0% |
| $35,000 to $49,999 | 25 | 71.4% |
| $50,000 to $74,999 | 0 | 0.0% |
| $75,000 to $99,999 | 0 | 0.0% |
| $100,000 to $149,999 | 7 | 20.0% |
| $150,000 to $199,999 | 0 | 0.0% |
| $200,000+ | 0 | 0.0% |
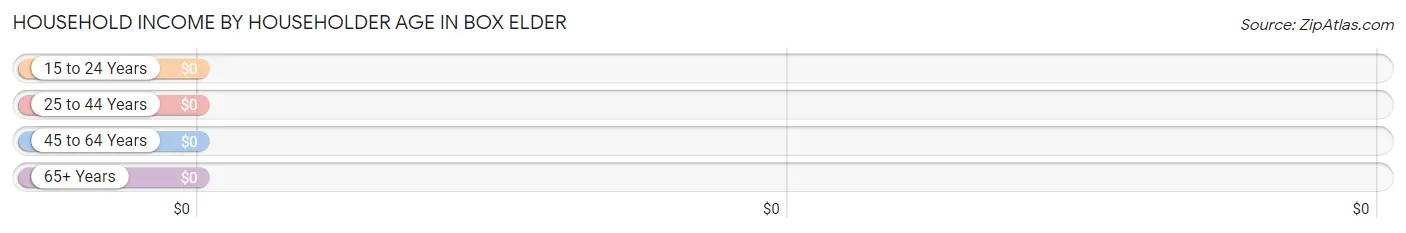
Household Income by Householder Age in Box Elder
| Income Bracket | # Households | Median Income |
| 15 to 24 Years | 10 (28.6%) | $0 |
| 25 to 44 Years | 11 (31.4%) | $0 |
| 45 to 64 Years | 11 (31.4%) | $0 |
| 65+ Years | 3 (8.6%) | $0 |
| Total | 35 (100.0%) | $38,958 |
Poverty in Box Elder
Income Below Poverty by Sex and Age in Box Elder
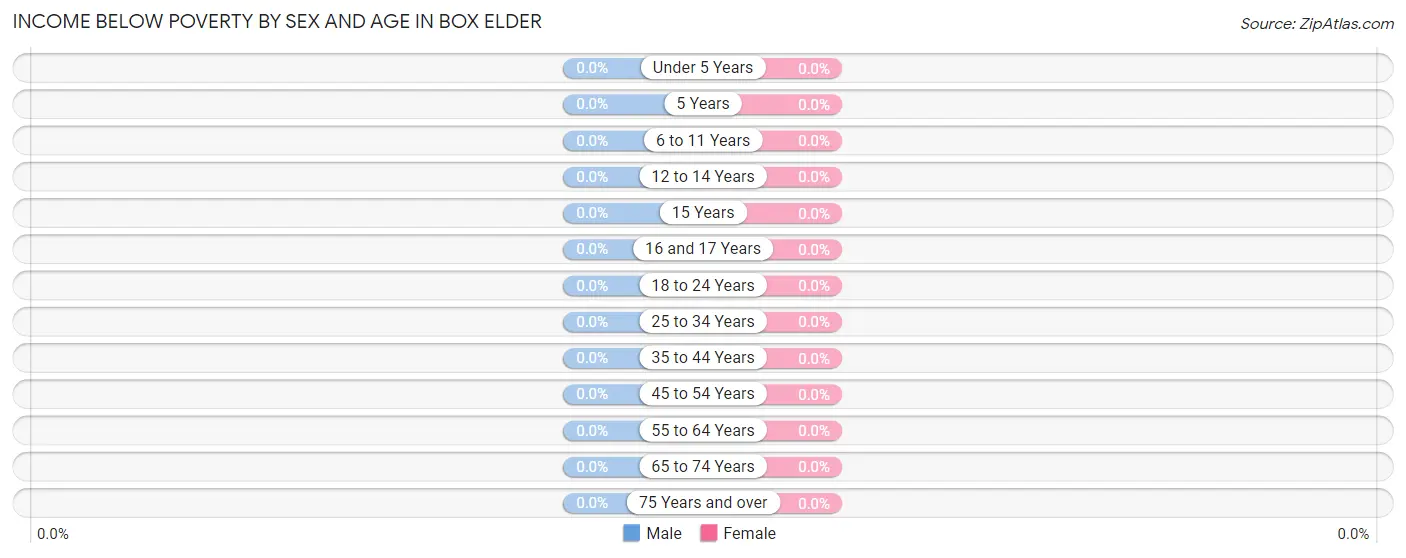
| Age Bracket | Male | Female |
| Under 5 Years | 0 (0.0%) | 0 (0.0%) |
| 5 Years | 0 (0.0%) | 0 (0.0%) |
| 6 to 11 Years | 0 (0.0%) | 0 (0.0%) |
| 12 to 14 Years | 0 (0.0%) | 0 (0.0%) |
| 15 Years | 0 (0.0%) | 0 (0.0%) |
| 16 and 17 Years | 0 (0.0%) | 0 (0.0%) |
| 18 to 24 Years | 0 (0.0%) | 0 (0.0%) |
| 25 to 34 Years | 0 (0.0%) | 0 (0.0%) |
| 35 to 44 Years | 0 (0.0%) | 0 (0.0%) |
| 45 to 54 Years | 0 (0.0%) | 0 (0.0%) |
| 55 to 64 Years | 0 (0.0%) | 0 (0.0%) |
| 65 to 74 Years | 0 (0.0%) | 0 (0.0%) |
| 75 Years and over | 0 (0.0%) | 0 (0.0%) |
| Total | 0 (0.0%) | 0 (0.0%) |
Income Above Poverty by Sex and Age in Box Elder
According to the poverty statistics in Box Elder, males aged under 5 years and females aged 12 to 14 years are the age groups that are most secure financially, with 100.0% of males and 100.0% of females in these age groups living above the poverty line.
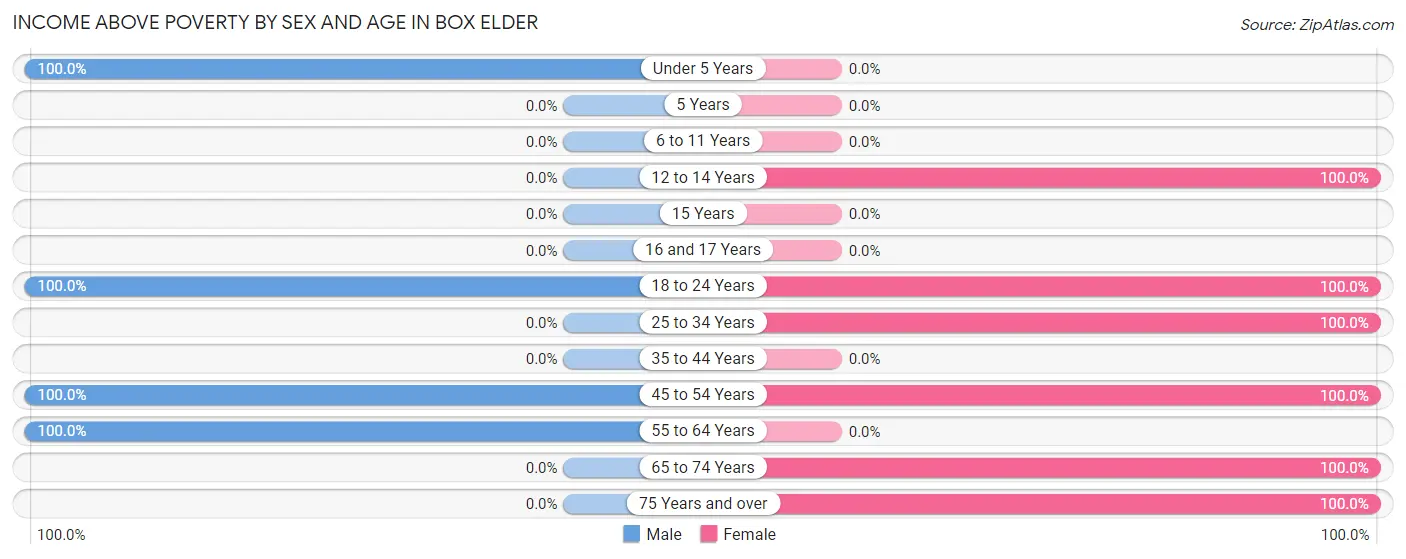
| Age Bracket | Male | Female |
| Under 5 Years | 12 (100.0%) | 0 (0.0%) |
| 5 Years | 0 (0.0%) | 0 (0.0%) |
| 6 to 11 Years | 0 (0.0%) | 0 (0.0%) |
| 12 to 14 Years | 0 (0.0%) | 5 (100.0%) |
| 15 Years | 0 (0.0%) | 0 (0.0%) |
| 16 and 17 Years | 0 (0.0%) | 0 (0.0%) |
| 18 to 24 Years | 6 (100.0%) | 11 (100.0%) |
| 25 to 34 Years | 0 (0.0%) | 11 (100.0%) |
| 35 to 44 Years | 0 (0.0%) | 0 (0.0%) |
| 45 to 54 Years | 4 (100.0%) | 6 (100.0%) |
| 55 to 64 Years | 7 (100.0%) | 0 (0.0%) |
| 65 to 74 Years | 0 (0.0%) | 3 (100.0%) |
| 75 Years and over | 0 (0.0%) | 3 (100.0%) |
| Total | 29 (100.0%) | 39 (100.0%) |
Income Below Poverty Among Married-Couple Families in Box Elder
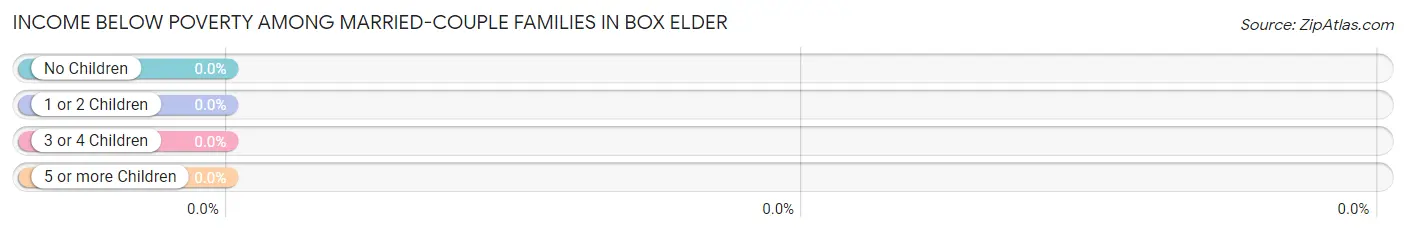
| Children | Above Poverty | Below Poverty |
| No Children | 7 (100.0%) | 0 (0.0%) |
| 1 or 2 Children | 6 (100.0%) | 0 (0.0%) |
| 3 or 4 Children | 0 (0.0%) | 0 (0.0%) |
| 5 or more Children | 0 (0.0%) | 0 (0.0%) |
| Total | 13 (100.0%) | 0 (0.0%) |
Income Below Poverty Among Single-Parent Households in Box Elder
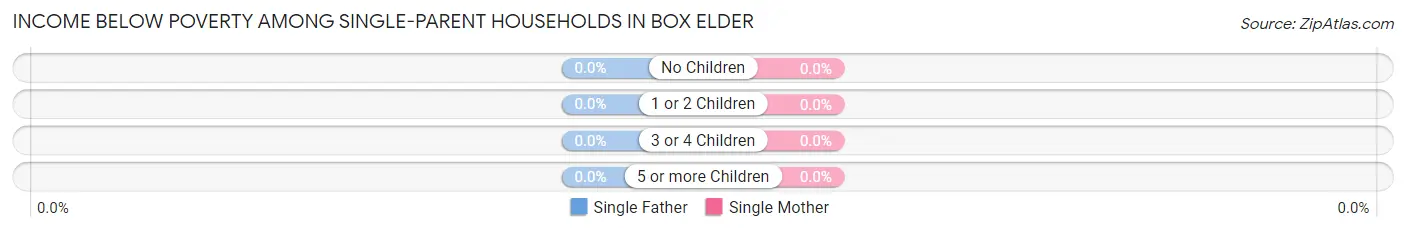
| Children | Single Father | Single Mother |
| No Children | 0 (0.0%) | 0 (0.0%) |
| 1 or 2 Children | 0 (0.0%) | 0 (0.0%) |
| 3 or 4 Children | 0 (0.0%) | 0 (0.0%) |
| 5 or more Children | 0 (0.0%) | 0 (0.0%) |
| Total | 0 (0.0%) | 0 (0.0%) |
Income Below Poverty Among Married-Couple vs Single-Parent Households in Box Elder
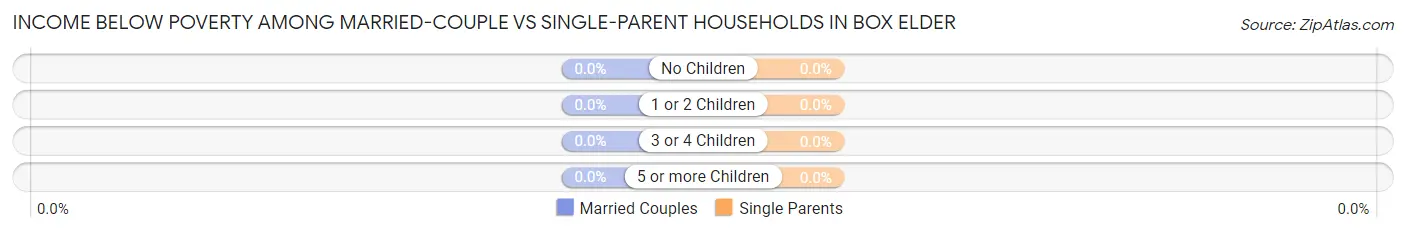
| Children | Married-Couple Families | Single-Parent Households |
| No Children | 0 (0.0%) | 0 (0.0%) |
| 1 or 2 Children | 0 (0.0%) | 0 (0.0%) |
| 3 or 4 Children | 0 (0.0%) | 0 (0.0%) |
| 5 or more Children | 0 (0.0%) | 0 (0.0%) |
| Total | 0 (0.0%) | 0 (0.0%) |
Race in Box Elder
The most populous races in Box Elder are White / Caucasian (43 | 63.2%), Native / Alaskan (25 | 36.8%), and Hispanic or Latino (5 | 7.3%).
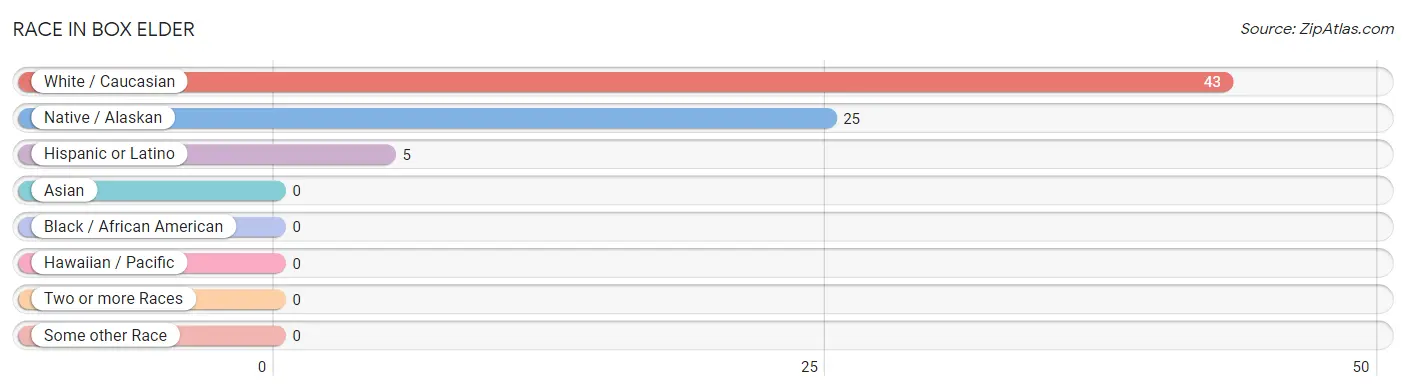
| Race | # Population | % Population |
| Asian | 0 | 0.0% |
| Black / African American | 0 | 0.0% |
| Hawaiian / Pacific | 0 | 0.0% |
| Hispanic or Latino | 5 | 7.3% |
| Native / Alaskan | 25 | 36.8% |
| White / Caucasian | 43 | 63.2% |
| Two or more Races | 0 | 0.0% |
| Some other Race | 0 | 0.0% |
| Total | 68 | 100.0% |
Ancestry in Box Elder
The most populous ancestries reported in Box Elder are English (13 | 19.1%), Irish (13 | 19.1%), Scotch-Irish (7 | 10.3%), American (5 | 7.3%), and Mexican (5 | 7.3%), together accounting for 63.2% of all Box Elder residents.
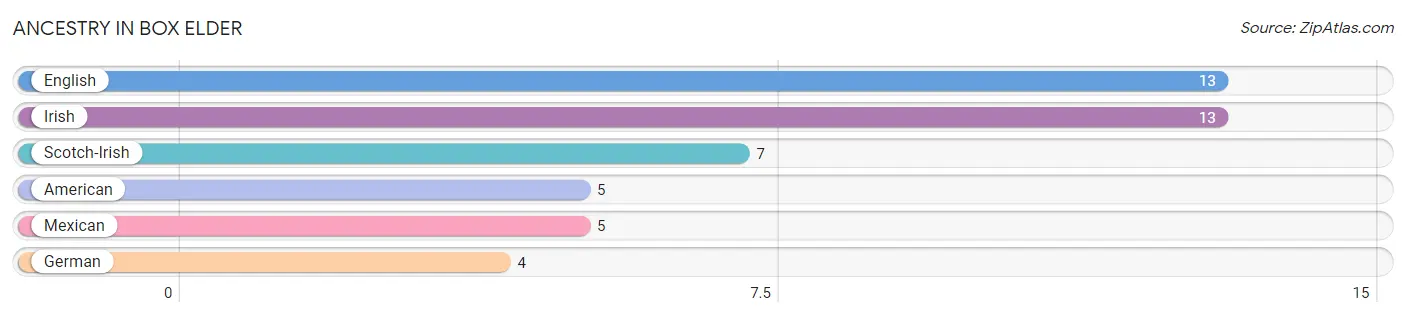
| Ancestry | # Population | % Population |
| American | 5 | 7.3% |
| English | 13 | 19.1% |
| German | 4 | 5.9% |
| Irish | 13 | 19.1% |
| Mexican | 5 | 7.3% |
| Scotch-Irish | 7 | 10.3% | View All 6 Rows |
Immigrants in Box Elder

| Immigration Origin | # Population | % Population | View All 0 Rows |
Sex and Age in Box Elder
Sex and Age in Box Elder
The most populous age groups in Box Elder are Under 5 Years (12 | 41.4%) for men and 20 to 24 Years (11 | 28.2%) for women.
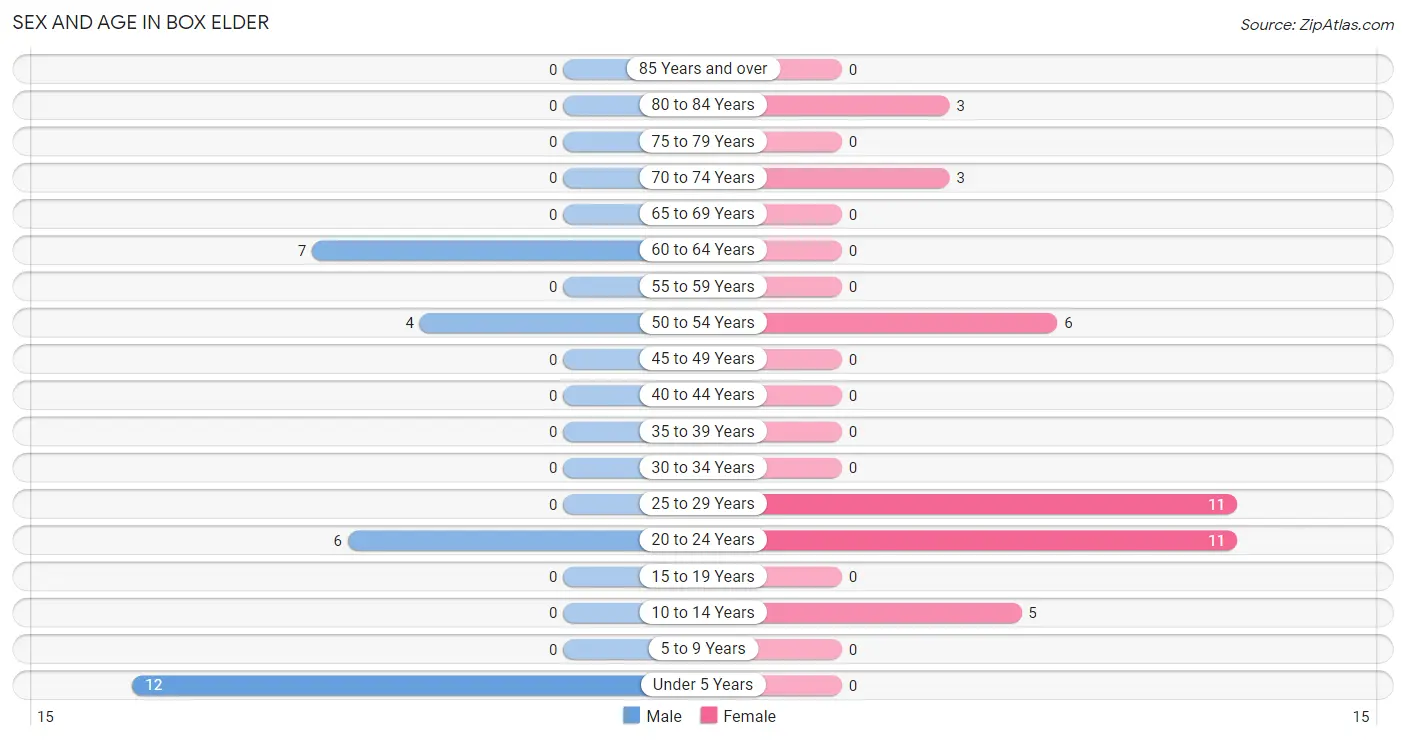
| Age Bracket | Male | Female |
| Under 5 Years | 12 (41.4%) | 0 (0.0%) |
| 5 to 9 Years | 0 (0.0%) | 0 (0.0%) |
| 10 to 14 Years | 0 (0.0%) | 5 (12.8%) |
| 15 to 19 Years | 0 (0.0%) | 0 (0.0%) |
| 20 to 24 Years | 6 (20.7%) | 11 (28.2%) |
| 25 to 29 Years | 0 (0.0%) | 11 (28.2%) |
| 30 to 34 Years | 0 (0.0%) | 0 (0.0%) |
| 35 to 39 Years | 0 (0.0%) | 0 (0.0%) |
| 40 to 44 Years | 0 (0.0%) | 0 (0.0%) |
| 45 to 49 Years | 0 (0.0%) | 0 (0.0%) |
| 50 to 54 Years | 4 (13.8%) | 6 (15.4%) |
| 55 to 59 Years | 0 (0.0%) | 0 (0.0%) |
| 60 to 64 Years | 7 (24.1%) | 0 (0.0%) |
| 65 to 69 Years | 0 (0.0%) | 0 (0.0%) |
| 70 to 74 Years | 0 (0.0%) | 3 (7.7%) |
| 75 to 79 Years | 0 (0.0%) | 0 (0.0%) |
| 80 to 84 Years | 0 (0.0%) | 3 (7.7%) |
| 85 Years and over | 0 (0.0%) | 0 (0.0%) |
| Total | 29 (100.0%) | 39 (100.0%) |
Families and Households in Box Elder
Median Family Size in Box Elder
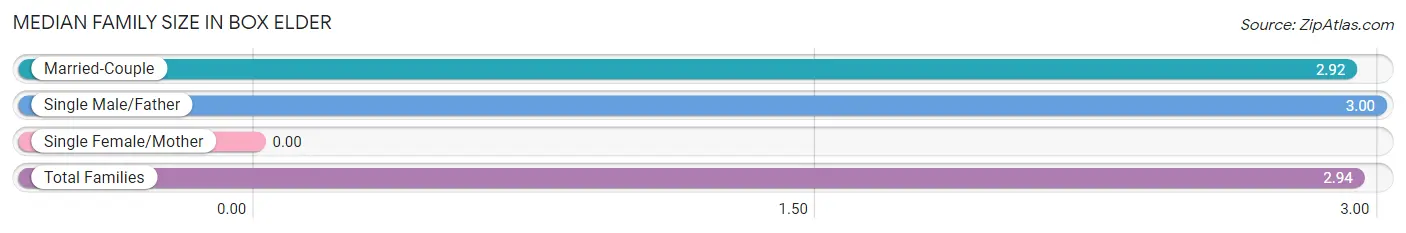
| Family Type | # Families | Family Size |
| Married-Couple | 13 (76.5%) | 2.92 |
| Single Male/Father | 4 (23.5%) | 3.00 |
| Single Female/Mother | 0 (0.0%) | - |
| Total Families | 17 (100.0%) | 2.94 |
Median Household Size in Box Elder
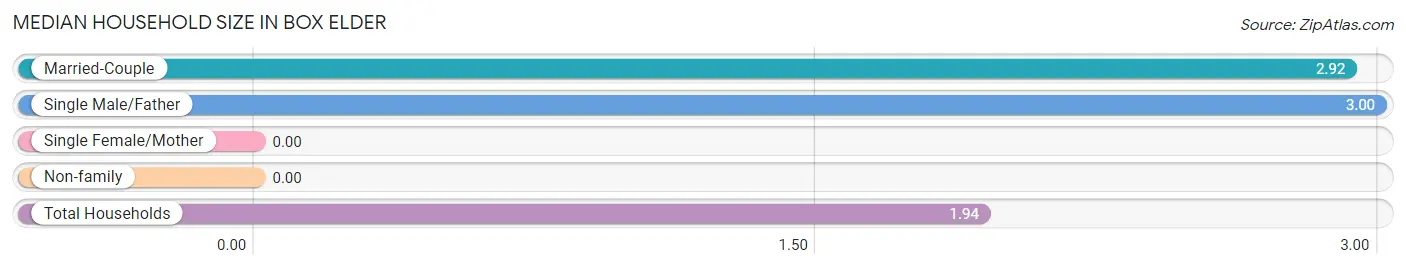
| Household Type | # Households | Household Size |
| Married-Couple | 13 (37.1%) | 2.92 |
| Single Male/Father | 4 (11.4%) | 3.00 |
| Single Female/Mother | 0 (0.0%) | - |
| Non-family | 18 (51.4%) | - |
| Total Households | 35 (100.0%) | 1.94 |
Household Size by Marriage Status in Box Elder
Out of a total of 35 households in Box Elder, 17 (48.6%) are family households, while 18 (51.4%) are nonfamily households. The most numerous type of family households are 3-person households, comprising 10, and the most common type of nonfamily households are 1-person households, comprising 18.
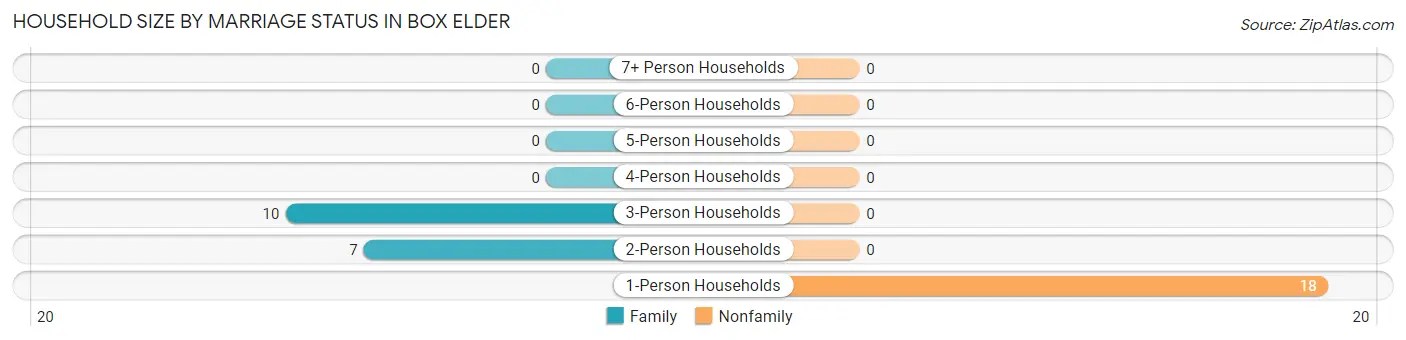
| Household Size | Family Households | Nonfamily Households |
| 1-Person Households | - | 18 (51.4%) |
| 2-Person Households | 7 (20.0%) | 0 (0.0%) |
| 3-Person Households | 10 (28.6%) | 0 (0.0%) |
| 4-Person Households | 0 (0.0%) | 0 (0.0%) |
| 5-Person Households | 0 (0.0%) | 0 (0.0%) |
| 6-Person Households | 0 (0.0%) | 0 (0.0%) |
| 7+ Person Households | 0 (0.0%) | 0 (0.0%) |
| Total | 17 (48.6%) | 18 (51.4%) |
Female Fertility in Box Elder
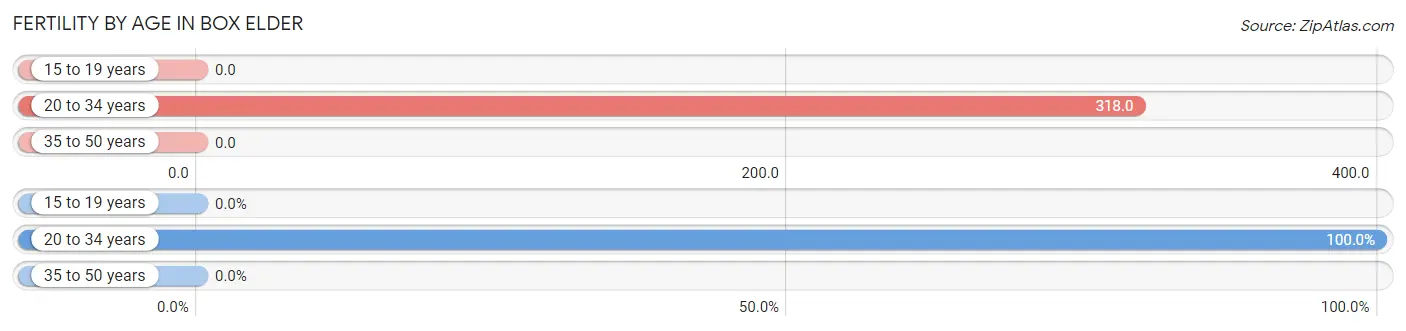
Fertility by Age in Box Elder
Average fertility rate in Box Elder is 318.0 births per 1,000 women. Women in the age bracket of 20 to 34 years have the highest fertility rate with 318.0 births per 1,000 women. Women in the age bracket of 20 to 34 years acount for 100.0% of all women with births.
| Age Bracket | Women with Births | Births / 1,000 Women |
| 15 to 19 years | 0 (0.0%) | 0.0 |
| 20 to 34 years | 7 (100.0%) | 318.0 |
| 35 to 50 years | 0 (0.0%) | 0.0 |
| Total | 7 (100.0%) | 318.0 |
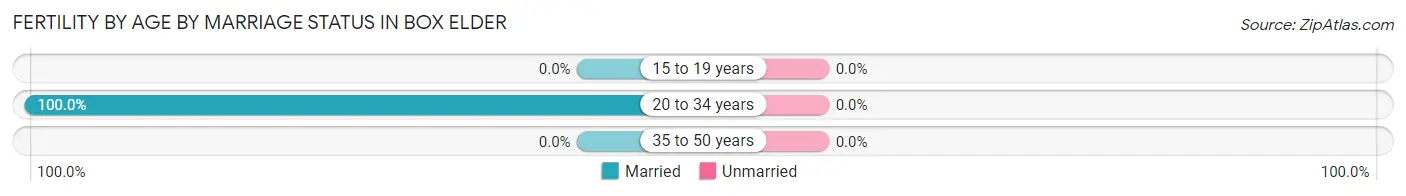
Fertility by Age by Marriage Status in Box Elder
| Age Bracket | Married | Unmarried |
| 15 to 19 years | 0 (0.0%) | 0 (0.0%) |
| 20 to 34 years | 7 (100.0%) | 0 (0.0%) |
| 35 to 50 years | 0 (0.0%) | 0 (0.0%) |
| Total | 7 (100.0%) | 0 (0.0%) |
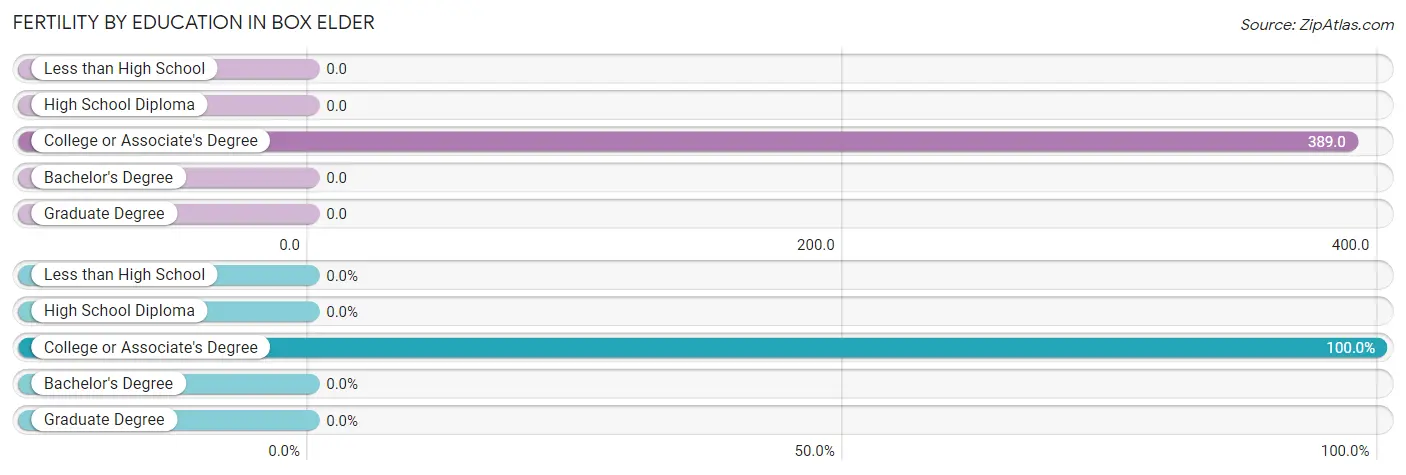
Fertility by Education in Box Elder
| Educational Attainment | Women with Births | Births / 1,000 Women |
| Less than High School | 0 (0.0%) | 0.0 |
| High School Diploma | 0 (0.0%) | 0.0 |
| College or Associate's Degree | 7 (100.0%) | 389.0 |
| Bachelor's Degree | 0 (0.0%) | 0.0 |
| Graduate Degree | 0 (0.0%) | 0.0 |
| Total | 7 (100.0%) | 318.0 |
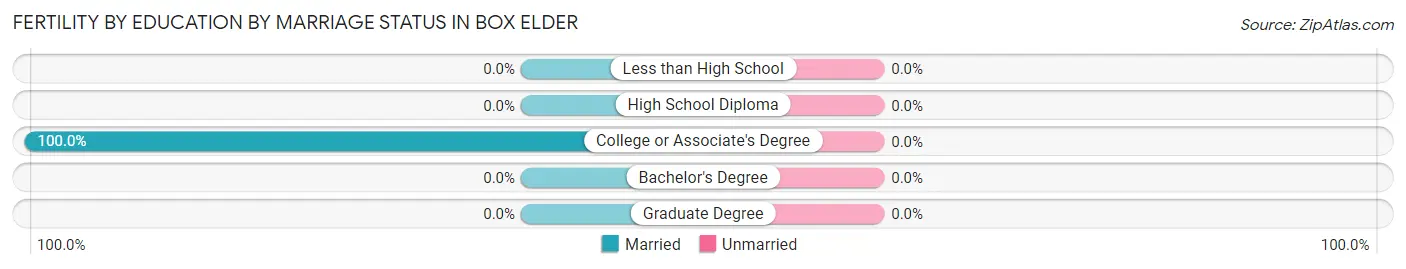
Fertility by Education by Marriage Status in Box Elder
| Educational Attainment | Married | Unmarried |
| Less than High School | 0 (0.0%) | 0 (0.0%) |
| High School Diploma | 0 (0.0%) | 0 (0.0%) |
| College or Associate's Degree | 7 (100.0%) | 0 (0.0%) |
| Bachelor's Degree | 0 (0.0%) | 0 (0.0%) |
| Graduate Degree | 0 (0.0%) | 0 (0.0%) |
| Total | 7 (100.0%) | 0 (0.0%) |
Employment Characteristics in Box Elder
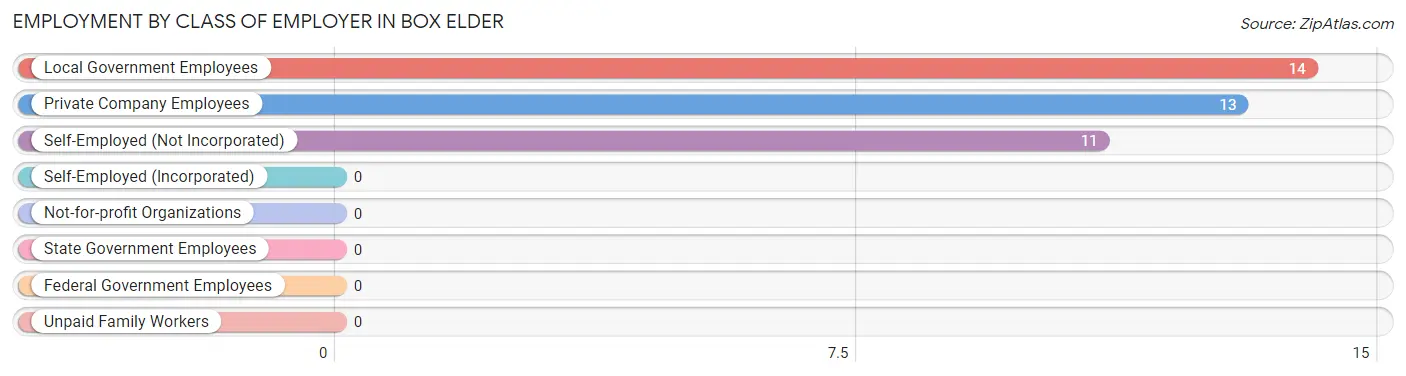
Employment by Class of Employer in Box Elder
Among the 38 employed individuals in Box Elder, local government employees (14 | 36.8%), private company employees (13 | 34.2%), and self-employed (not incorporated) (11 | 28.9%) make up the most common classes of employment.
| Employer Class | # Employees | % Employees |
| Private Company Employees | 13 | 34.2% |
| Self-Employed (Incorporated) | 0 | 0.0% |
| Self-Employed (Not Incorporated) | 11 | 28.9% |
| Not-for-profit Organizations | 0 | 0.0% |
| Local Government Employees | 14 | 36.8% |
| State Government Employees | 0 | 0.0% |
| Federal Government Employees | 0 | 0.0% |
| Unpaid Family Workers | 0 | 0.0% |
| Total | 38 | 100.0% |
Employment Status by Age in Box Elder
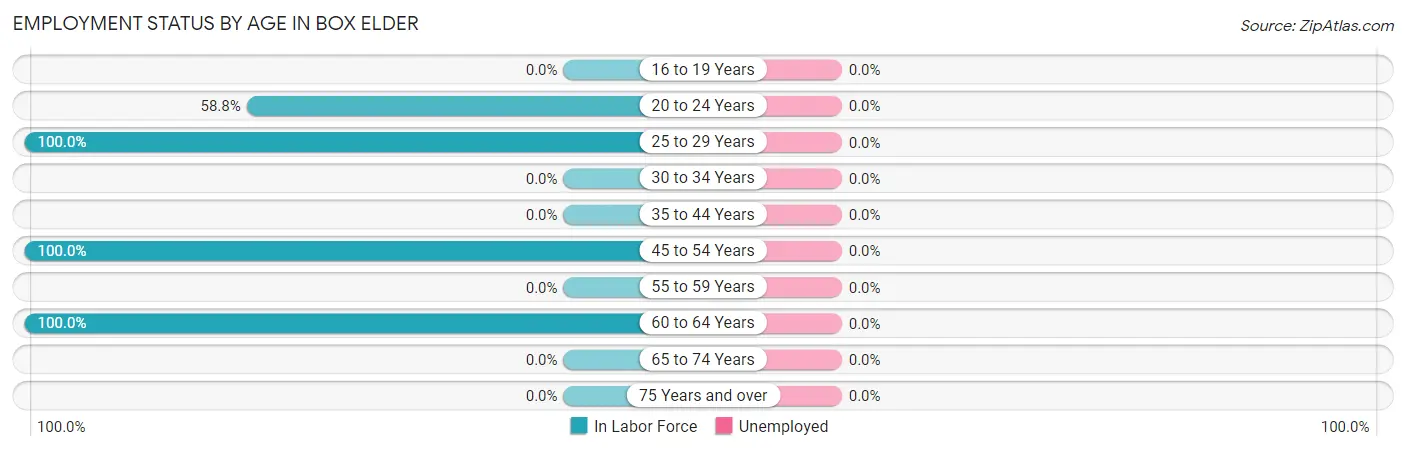
| Age Bracket | In Labor Force | Unemployed |
| 16 to 19 Years | 0 (0.0%) | 0 (0.0%) |
| 20 to 24 Years | 10 (58.8%) | 0 (0.0%) |
| 25 to 29 Years | 11 (100.0%) | 0 (0.0%) |
| 30 to 34 Years | 0 (0.0%) | 0 (0.0%) |
| 35 to 44 Years | 0 (0.0%) | 0 (0.0%) |
| 45 to 54 Years | 10 (100.0%) | 0 (0.0%) |
| 55 to 59 Years | 0 (0.0%) | 0 (0.0%) |
| 60 to 64 Years | 7 (100.0%) | 0 (0.0%) |
| 65 to 74 Years | 0 (0.0%) | 0 (0.0%) |
| 75 Years and over | 0 (0.0%) | 0 (0.0%) |
| Total | 38 (74.5%) | 0 (0.0%) |
Employment Status by Educational Attainment in Box Elder
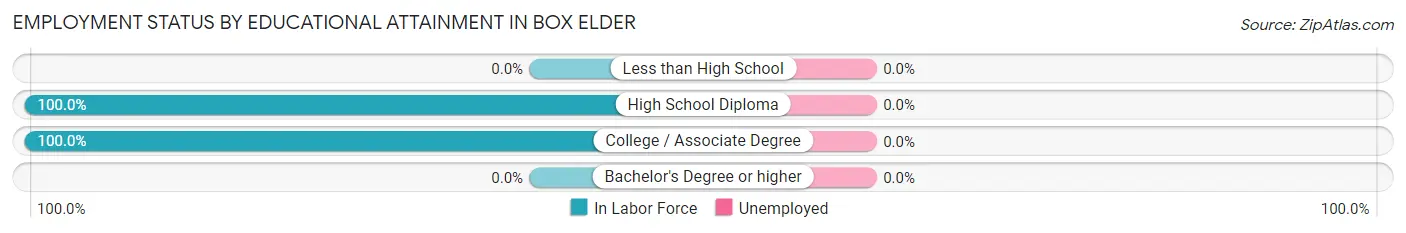
| Educational Attainment | In Labor Force | Unemployed |
| Less than High School | 0 (0.0%) | 0 (0.0%) |
| High School Diploma | 17 (100.0%) | 0 (0.0%) |
| College / Associate Degree | 11 (100.0%) | 0 (0.0%) |
| Bachelor's Degree or higher | 0 (0.0%) | 0 (0.0%) |
| Total | 28 (100.0%) | 0 (0.0%) |
Employment Occupations by Sex in Box Elder
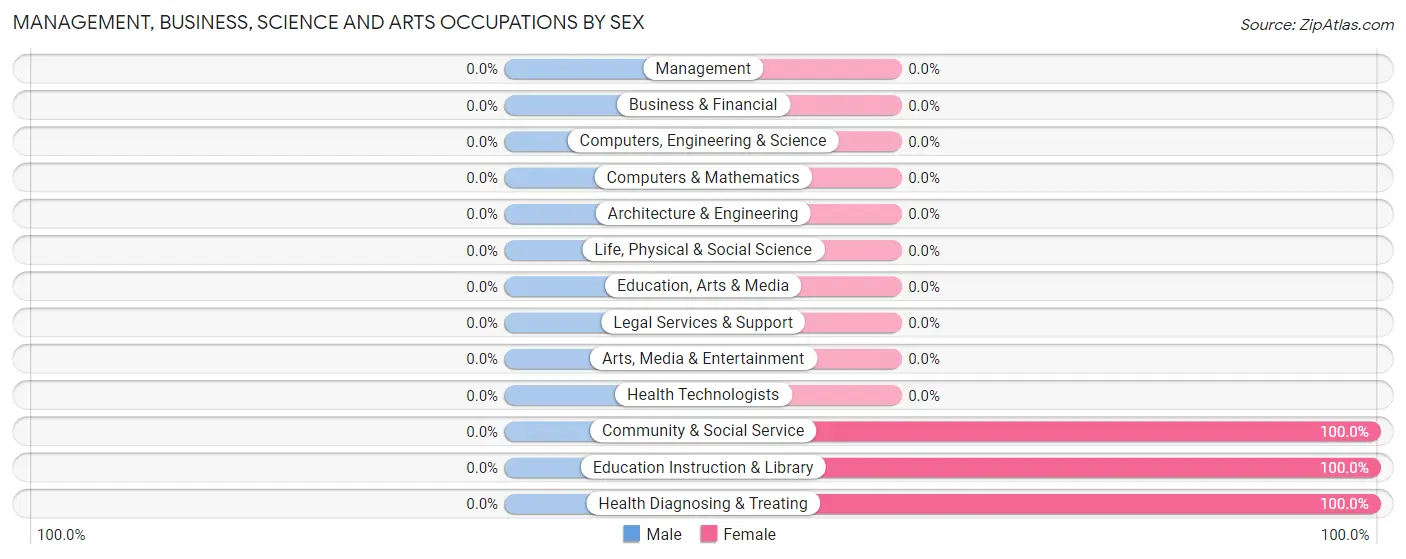
Management, Business, Science and Arts Occupations
The most common Management, Business, Science and Arts occupations in Box Elder are Health Diagnosing & Treating (11 | 28.9%), Community & Social Service (4 | 10.5%), and Education Instruction & Library (4 | 10.5%).
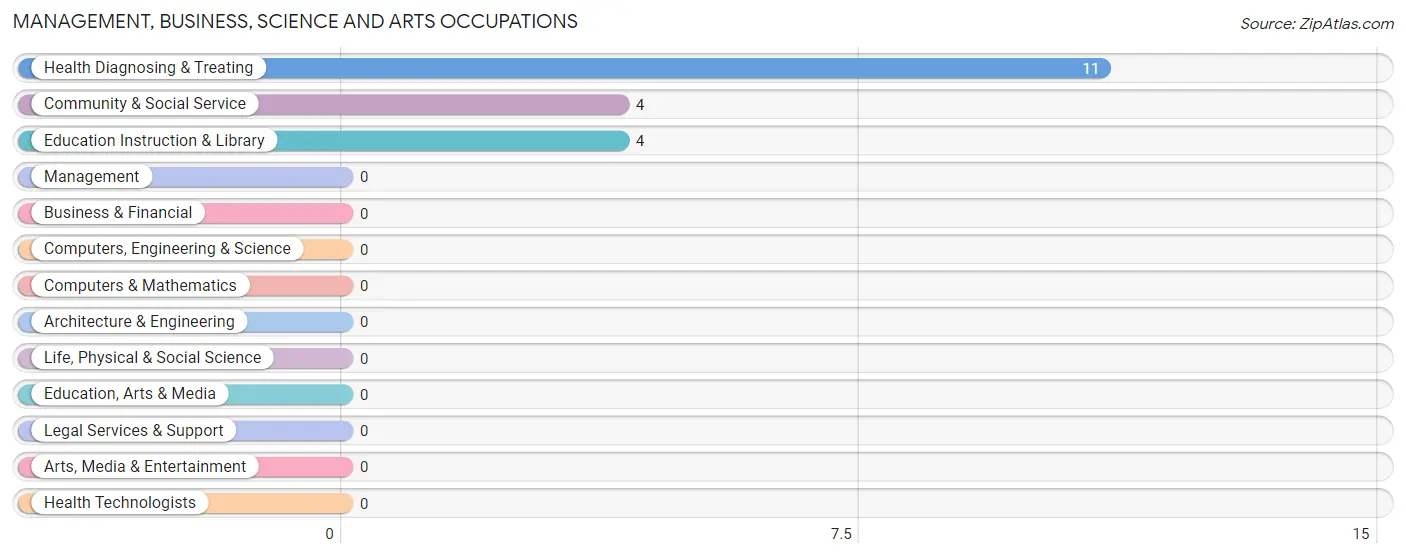
Management, Business, Science and Arts Occupations by Sex
| Occupation | Male | Female |
| Management | 0 (0.0%) | 0 (0.0%) |
| Business & Financial | 0 (0.0%) | 0 (0.0%) |
| Computers, Engineering & Science | 0 (0.0%) | 0 (0.0%) |
| Computers & Mathematics | 0 (0.0%) | 0 (0.0%) |
| Architecture & Engineering | 0 (0.0%) | 0 (0.0%) |
| Life, Physical & Social Science | 0 (0.0%) | 0 (0.0%) |
| Community & Social Service | 0 (0.0%) | 4 (100.0%) |
| Education, Arts & Media | 0 (0.0%) | 0 (0.0%) |
| Legal Services & Support | 0 (0.0%) | 0 (0.0%) |
| Education Instruction & Library | 0 (0.0%) | 4 (100.0%) |
| Arts, Media & Entertainment | 0 (0.0%) | 0 (0.0%) |
| Health Diagnosing & Treating | 0 (0.0%) | 11 (100.0%) |
| Health Technologists | 0 (0.0%) | 0 (0.0%) |
| Total (Category) | 0 (0.0%) | 15 (100.0%) |
| Total (Overall) | 17 (44.7%) | 21 (55.3%) |
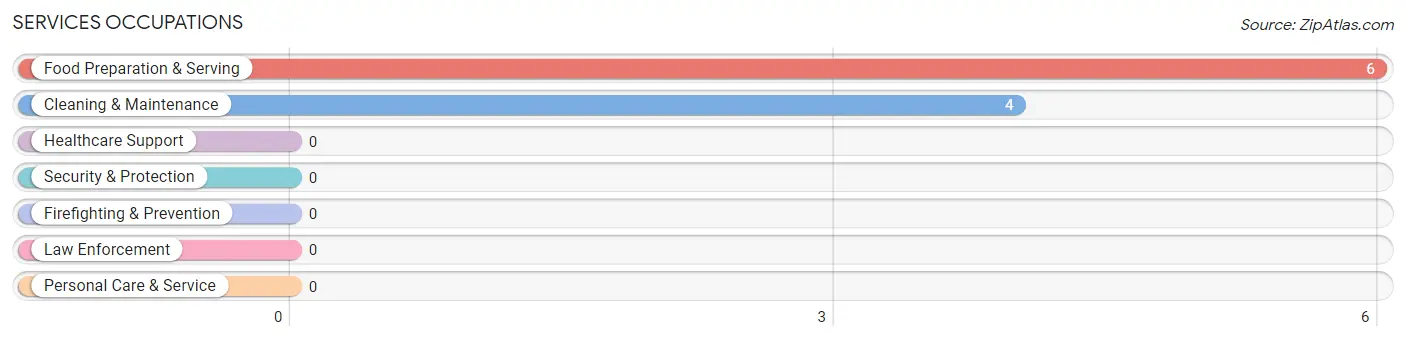
Services Occupations
The most common Services occupations in Box Elder are Food Preparation & Serving (6 | 15.8%), and Cleaning & Maintenance (4 | 10.5%).
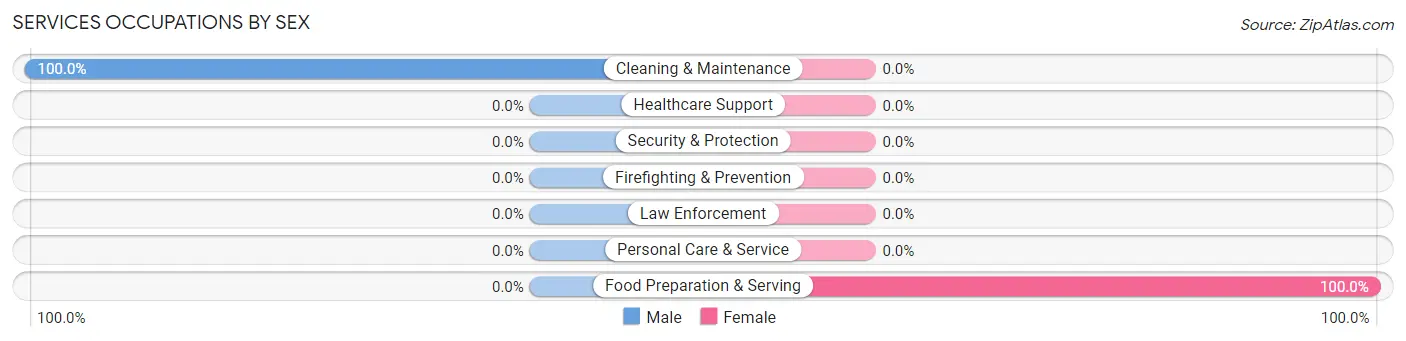
Services Occupations by Sex
| Occupation | Male | Female |
| Healthcare Support | 0 (0.0%) | 0 (0.0%) |
| Security & Protection | 0 (0.0%) | 0 (0.0%) |
| Firefighting & Prevention | 0 (0.0%) | 0 (0.0%) |
| Law Enforcement | 0 (0.0%) | 0 (0.0%) |
| Food Preparation & Serving | 0 (0.0%) | 6 (100.0%) |
| Cleaning & Maintenance | 4 (100.0%) | 0 (0.0%) |
| Personal Care & Service | 0 (0.0%) | 0 (0.0%) |
| Total (Category) | 4 (40.0%) | 6 (60.0%) |
| Total (Overall) | 17 (44.7%) | 21 (55.3%) |
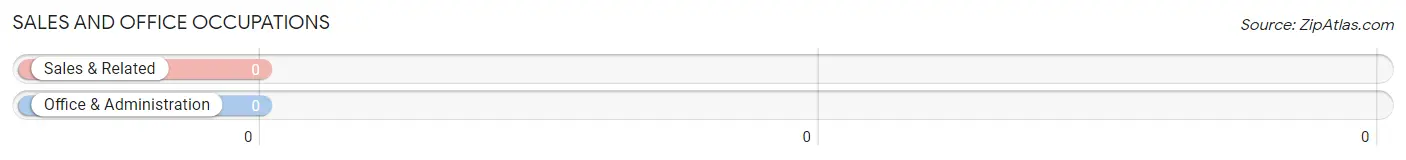
Sales and Office Occupations
Sales and Office Occupations by Sex
| Occupation | Male | Female |
| Sales & Related | 0 (0.0%) | 0 (0.0%) |
| Office & Administration | 0 (0.0%) | 0 (0.0%) |
| Total (Category) | 0 (0.0%) | 0 (0.0%) |
| Total (Overall) | 17 (44.7%) | 21 (55.3%) |
Natural Resources, Construction and Maintenance Occupations
The most common Natural Resources, Construction and Maintenance occupations in Box Elder are , and Installation, Maintenance & Repair (7 | 18.4%).
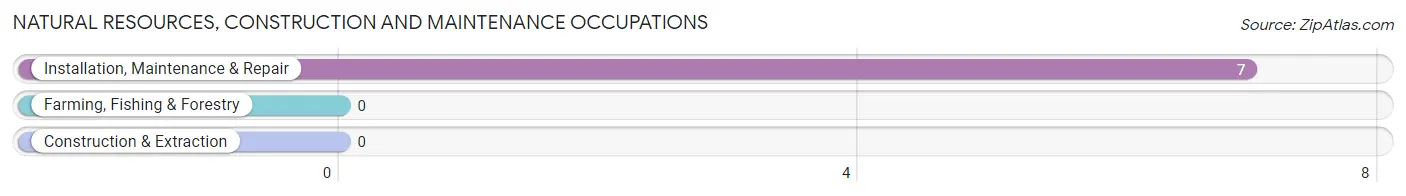
Natural Resources, Construction and Maintenance Occupations by Sex
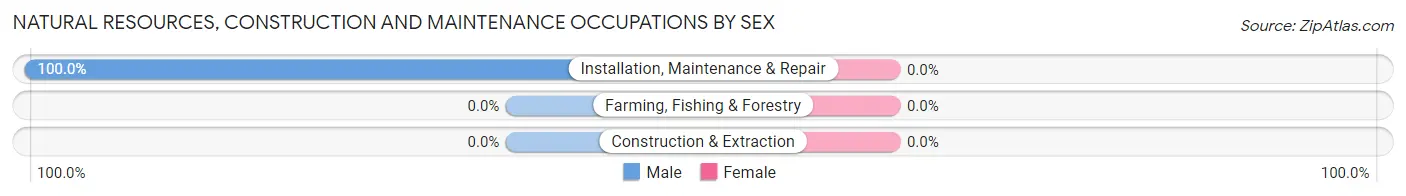
| Occupation | Male | Female |
| Farming, Fishing & Forestry | 0 (0.0%) | 0 (0.0%) |
| Construction & Extraction | 0 (0.0%) | 0 (0.0%) |
| Installation, Maintenance & Repair | 7 (100.0%) | 0 (0.0%) |
| Total (Category) | 7 (100.0%) | 0 (0.0%) |
| Total (Overall) | 17 (44.7%) | 21 (55.3%) |
Production, Transportation and Moving Occupations
The most common Production, Transportation and Moving occupations in Box Elder are , and Material Moving (6 | 15.8%).
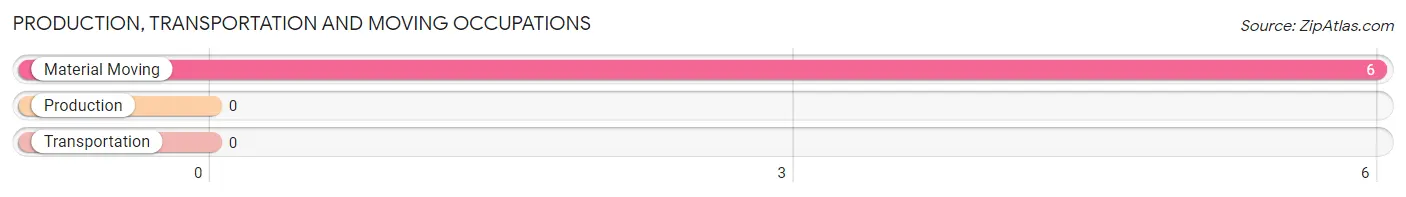
Production, Transportation and Moving Occupations by Sex
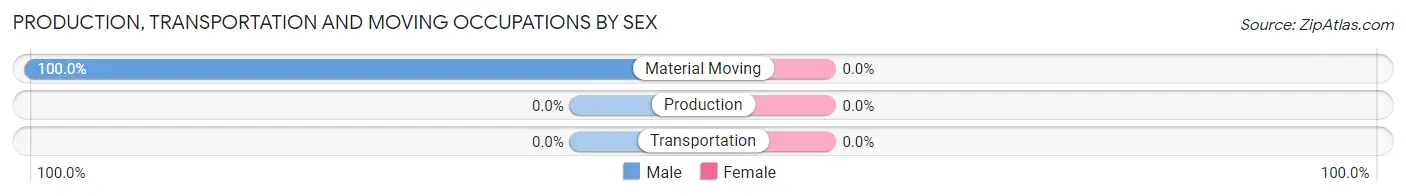
| Occupation | Male | Female |
| Production | 0 (0.0%) | 0 (0.0%) |
| Transportation | 0 (0.0%) | 0 (0.0%) |
| Material Moving | 6 (100.0%) | 0 (0.0%) |
| Total (Category) | 6 (100.0%) | 0 (0.0%) |
| Total (Overall) | 17 (44.7%) | 21 (55.3%) |
Employment Industries by Sex in Box Elder
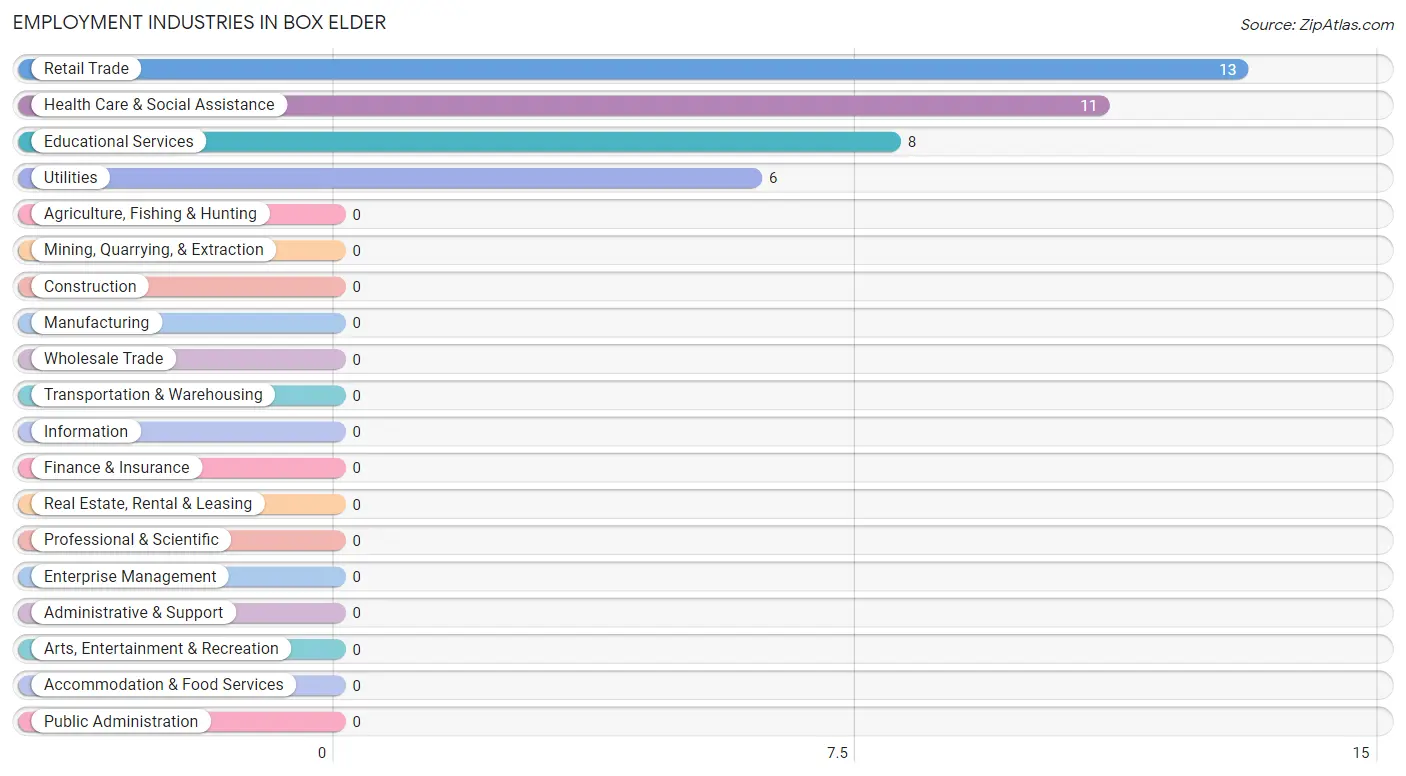
Employment Industries in Box Elder
The major employment industries in Box Elder include Retail Trade (13 | 34.2%), Health Care & Social Assistance (11 | 28.9%), Educational Services (8 | 21.0%), and Utilities (6 | 15.8%).
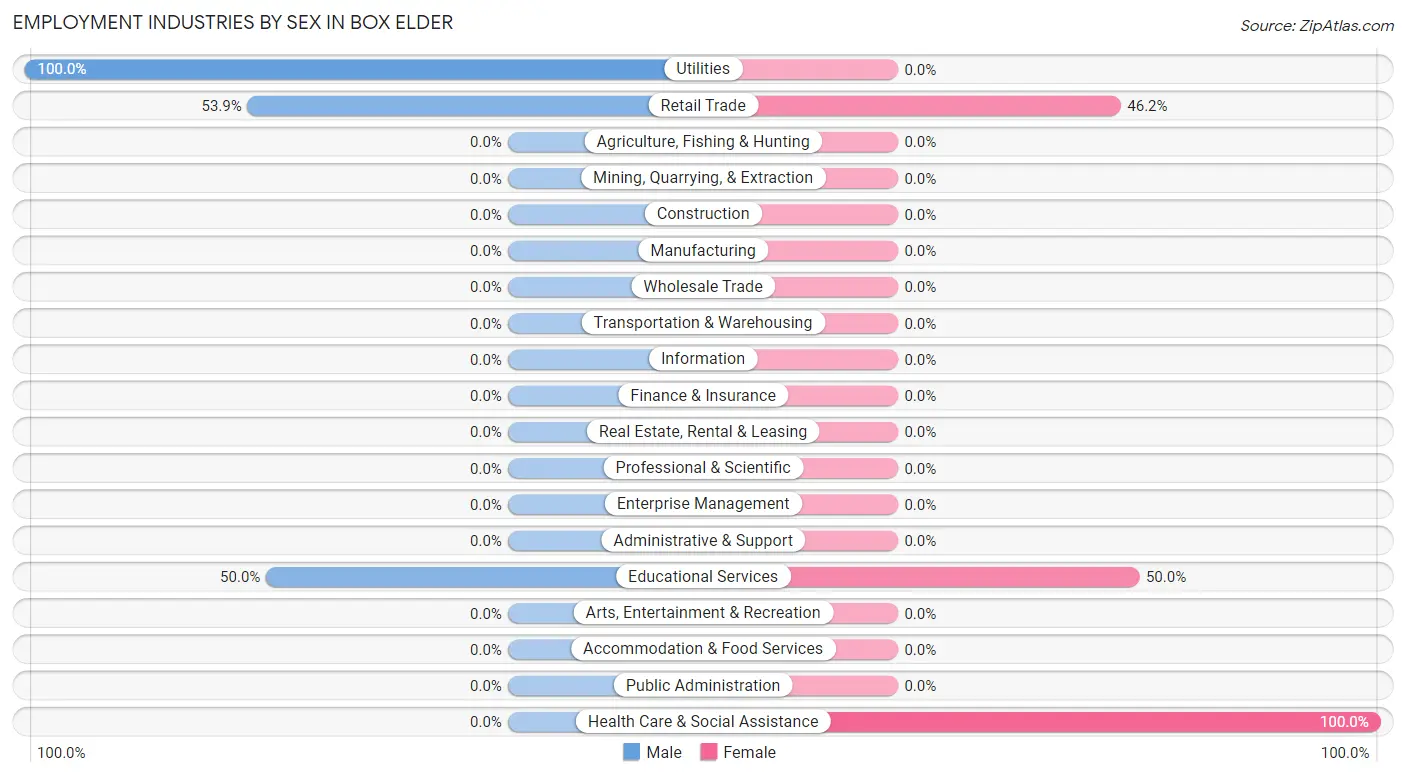
Employment Industries by Sex in Box Elder
The Box Elder industries that see more men than women are Utilities (100.0%), Retail Trade (53.8%), and Educational Services (50.0%), whereas the industries that tend to have a higher number of women are Health Care & Social Assistance (100.0%), Educational Services (50.0%), and Retail Trade (46.2%).
| Industry | Male | Female |
| Agriculture, Fishing & Hunting | 0 (0.0%) | 0 (0.0%) |
| Mining, Quarrying, & Extraction | 0 (0.0%) | 0 (0.0%) |
| Construction | 0 (0.0%) | 0 (0.0%) |
| Manufacturing | 0 (0.0%) | 0 (0.0%) |
| Wholesale Trade | 0 (0.0%) | 0 (0.0%) |
| Retail Trade | 7 (53.8%) | 6 (46.2%) |
| Transportation & Warehousing | 0 (0.0%) | 0 (0.0%) |
| Utilities | 6 (100.0%) | 0 (0.0%) |
| Information | 0 (0.0%) | 0 (0.0%) |
| Finance & Insurance | 0 (0.0%) | 0 (0.0%) |
| Real Estate, Rental & Leasing | 0 (0.0%) | 0 (0.0%) |
| Professional & Scientific | 0 (0.0%) | 0 (0.0%) |
| Enterprise Management | 0 (0.0%) | 0 (0.0%) |
| Administrative & Support | 0 (0.0%) | 0 (0.0%) |
| Educational Services | 4 (50.0%) | 4 (50.0%) |
| Health Care & Social Assistance | 0 (0.0%) | 11 (100.0%) |
| Arts, Entertainment & Recreation | 0 (0.0%) | 0 (0.0%) |
| Accommodation & Food Services | 0 (0.0%) | 0 (0.0%) |
| Public Administration | 0 (0.0%) | 0 (0.0%) |
| Total | 17 (44.7%) | 21 (55.3%) |
Education in Box Elder
School Enrollment in Box Elder
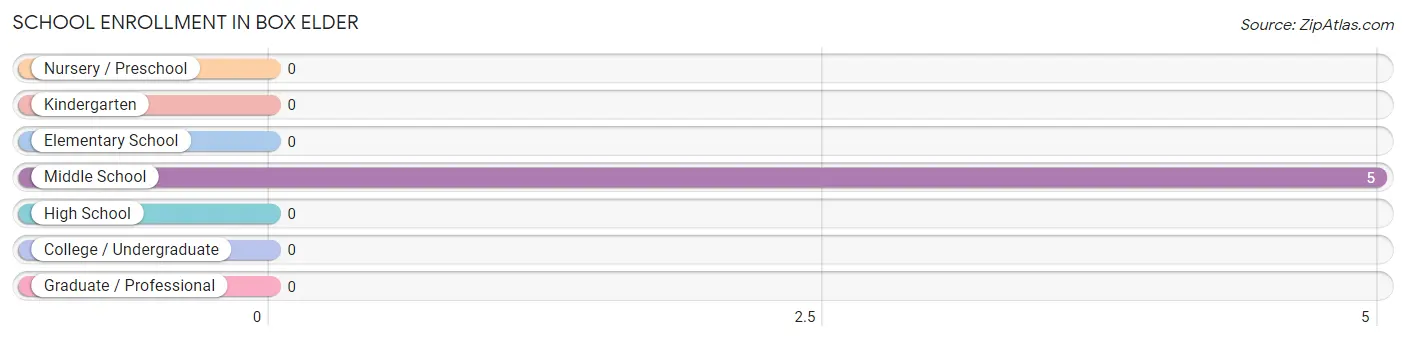
| School Level | # Students | % Students |
| Nursery / Preschool | 0 | 0.0% |
| Kindergarten | 0 | 0.0% |
| Elementary School | 0 | 0.0% |
| Middle School | 5 | 100.0% |
| High School | 0 | 0.0% |
| College / Undergraduate | 0 | 0.0% |
| Graduate / Professional | 0 | 0.0% |
| Total | 5 | 100.0% |
School Enrollment by Age by Funding Source in Box Elder
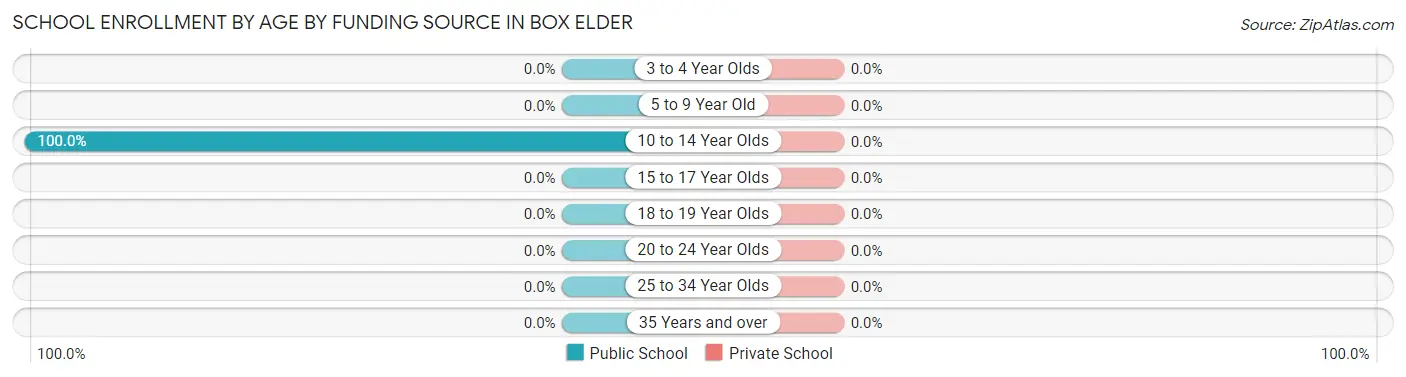
| Age Bracket | Public School | Private School |
| 3 to 4 Year Olds | 0 (0.0%) | 0 (0.0%) |
| 5 to 9 Year Old | 0 (0.0%) | 0 (0.0%) |
| 10 to 14 Year Olds | 5 (100.0%) | 0 (0.0%) |
| 15 to 17 Year Olds | 0 (0.0%) | 0 (0.0%) |
| 18 to 19 Year Olds | 0 (0.0%) | 0 (0.0%) |
| 20 to 24 Year Olds | 0 (0.0%) | 0 (0.0%) |
| 25 to 34 Year Olds | 0 (0.0%) | 0 (0.0%) |
| 35 Years and over | 0 (0.0%) | 0 (0.0%) |
| Total | 5 (100.0%) | 0 (0.0%) |
Educational Attainment by Field of Study in Box Elder
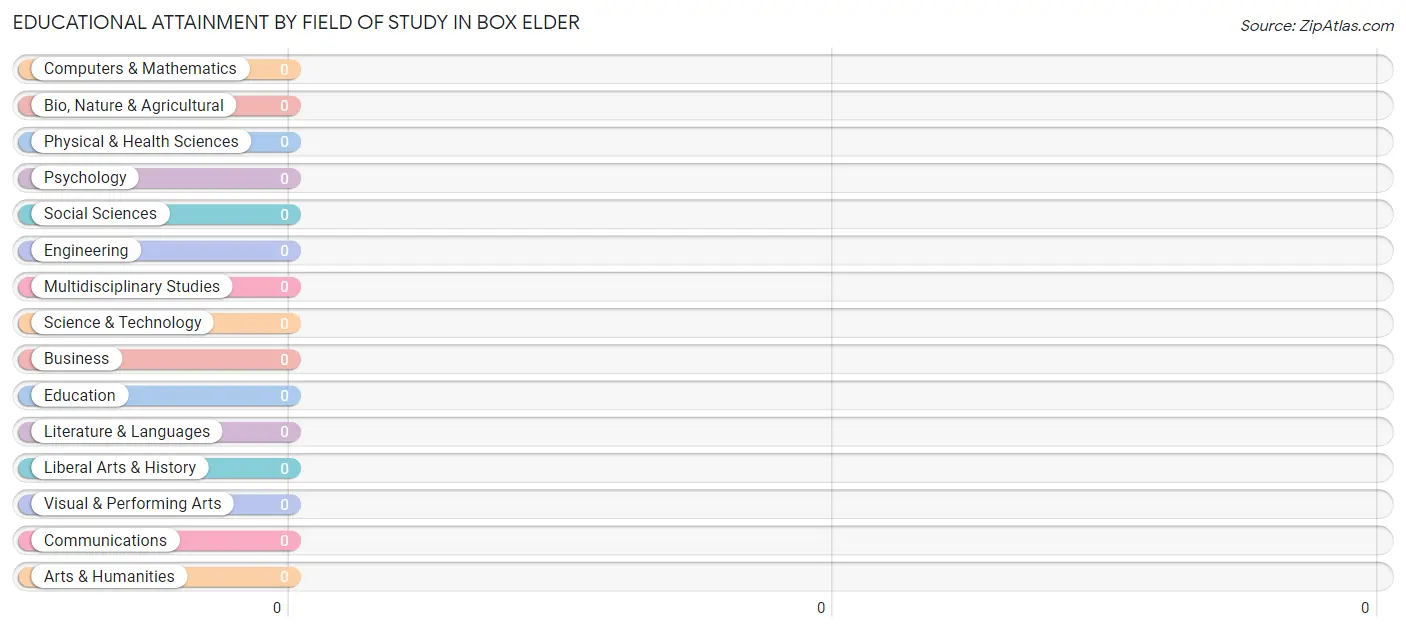
| Field of Study | # Graduates | % Graduates |
| Computers & Mathematics | 0 | 0.0% |
| Bio, Nature & Agricultural | 0 | 0.0% |
| Physical & Health Sciences | 0 | 0.0% |
| Psychology | 0 | 0.0% |
| Social Sciences | 0 | 0.0% |
| Engineering | 0 | 0.0% |
| Multidisciplinary Studies | 0 | 0.0% |
| Science & Technology | 0 | 0.0% |
| Business | 0 | 0.0% |
| Education | 0 | 0.0% |
| Literature & Languages | 0 | 0.0% |
| Liberal Arts & History | 0 | 0.0% |
| Visual & Performing Arts | 0 | 0.0% |
| Communications | 0 | 0.0% |
| Arts & Humanities | 0 | 0.0% |
| Total | 0 | 0.0% |
Transportation & Commute in Box Elder
Vehicle Availability by Sex in Box Elder
The most prevalent vehicle ownership categories in Box Elder are males with 3 vehicles (7, accounting for 41.2%) and females with 3 vehicles (6, making up 33.3%).
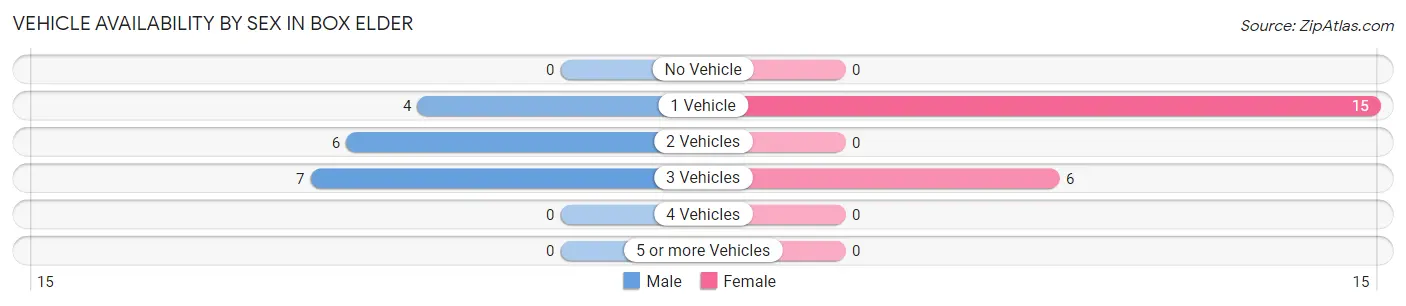
| Vehicles Available | Male | Female |
| No Vehicle | 0 (0.0%) | 0 (0.0%) |
| 1 Vehicle | 4 (23.5%) | 15 (71.4%) |
| 2 Vehicles | 6 (35.3%) | 0 (0.0%) |
| 3 Vehicles | 7 (41.2%) | 6 (28.6%) |
| 4 Vehicles | 0 (0.0%) | 0 (0.0%) |
| 5 or more Vehicles | 0 (0.0%) | 0 (0.0%) |
| Total | 17 (100.0%) | 21 (100.0%) |
Commute Time in Box Elder
The most frequently occuring commute durations in Box Elder are 25 to 29 minutes (17 commuters, 44.7%), 5 to 9 minutes (13 commuters, 34.2%), and less than 5 minutes (4 commuters, 10.5%).
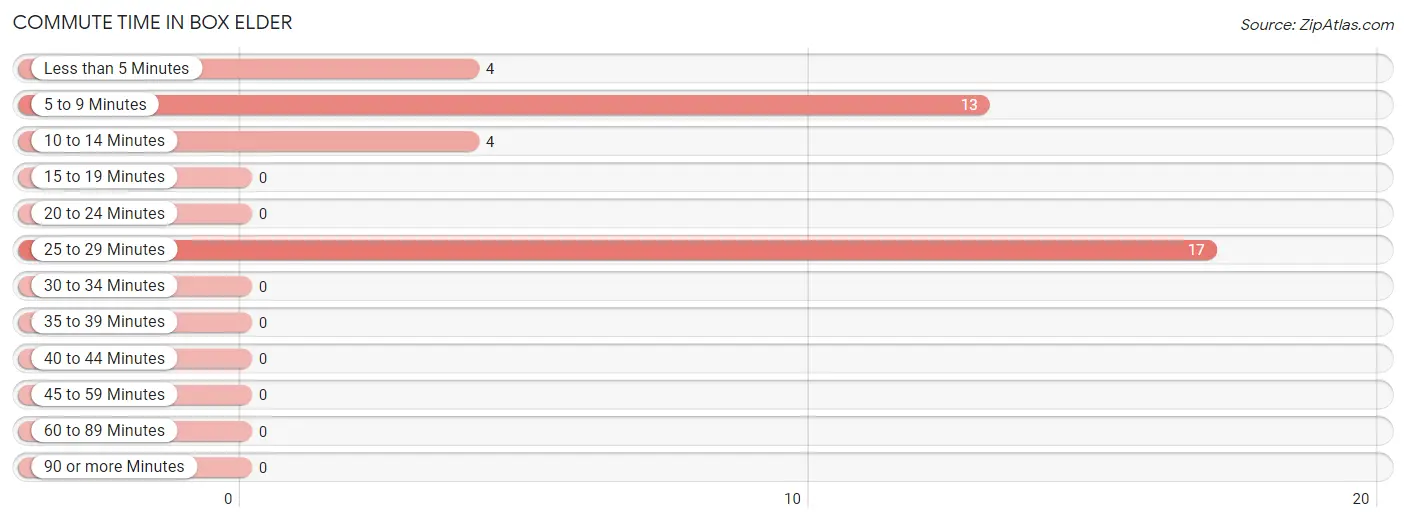
| Commute Time | # Commuters | % Commuters |
| Less than 5 Minutes | 4 | 10.5% |
| 5 to 9 Minutes | 13 | 34.2% |
| 10 to 14 Minutes | 4 | 10.5% |
| 15 to 19 Minutes | 0 | 0.0% |
| 20 to 24 Minutes | 0 | 0.0% |
| 25 to 29 Minutes | 17 | 44.7% |
| 30 to 34 Minutes | 0 | 0.0% |
| 35 to 39 Minutes | 0 | 0.0% |
| 40 to 44 Minutes | 0 | 0.0% |
| 45 to 59 Minutes | 0 | 0.0% |
| 60 to 89 Minutes | 0 | 0.0% |
| 90 or more Minutes | 0 | 0.0% |
Commute Time by Sex in Box Elder
The most common commute times in Box Elder are 5 to 9 minutes (7 commuters, 41.2%) for males and 25 to 29 minutes (11 commuters, 52.4%) for females.
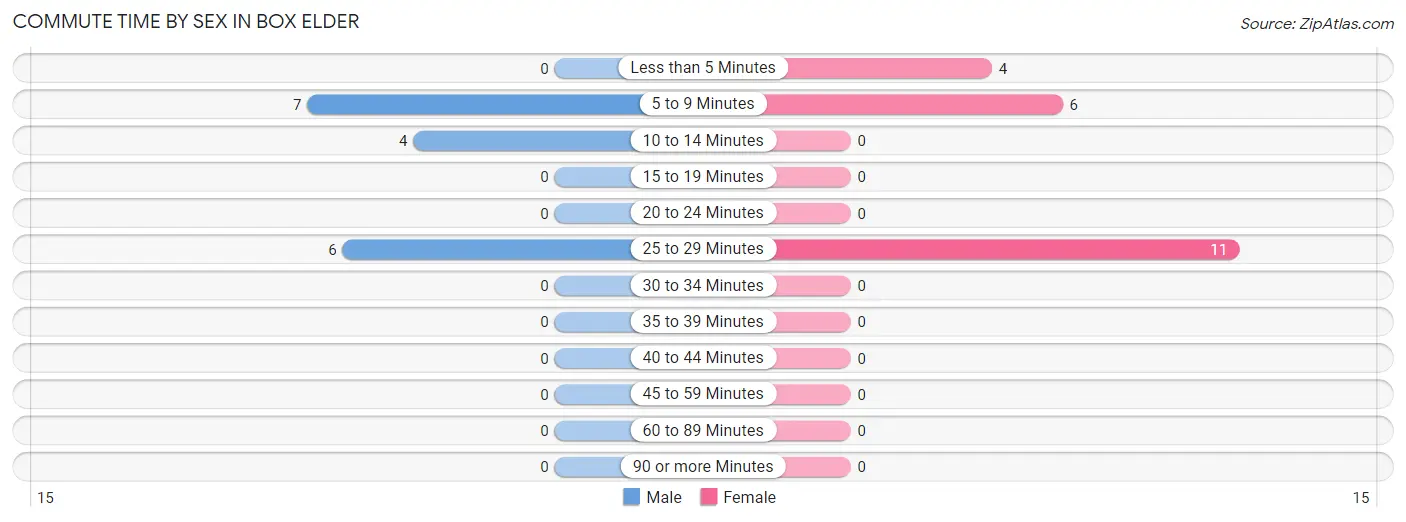
| Commute Time | Male | Female |
| Less than 5 Minutes | 0 (0.0%) | 4 (19.1%) |
| 5 to 9 Minutes | 7 (41.2%) | 6 (28.6%) |
| 10 to 14 Minutes | 4 (23.5%) | 0 (0.0%) |
| 15 to 19 Minutes | 0 (0.0%) | 0 (0.0%) |
| 20 to 24 Minutes | 0 (0.0%) | 0 (0.0%) |
| 25 to 29 Minutes | 6 (35.3%) | 11 (52.4%) |
| 30 to 34 Minutes | 0 (0.0%) | 0 (0.0%) |
| 35 to 39 Minutes | 0 (0.0%) | 0 (0.0%) |
| 40 to 44 Minutes | 0 (0.0%) | 0 (0.0%) |
| 45 to 59 Minutes | 0 (0.0%) | 0 (0.0%) |
| 60 to 89 Minutes | 0 (0.0%) | 0 (0.0%) |
| 90 or more Minutes | 0 (0.0%) | 0 (0.0%) |
Time of Departure to Work by Sex in Box Elder
The most frequent times of departure to work in Box Elder are 5:00 AM to 5:29 AM (7, 41.2%) for males and 8:00 AM to 8:29 AM (11, 52.4%) for females.
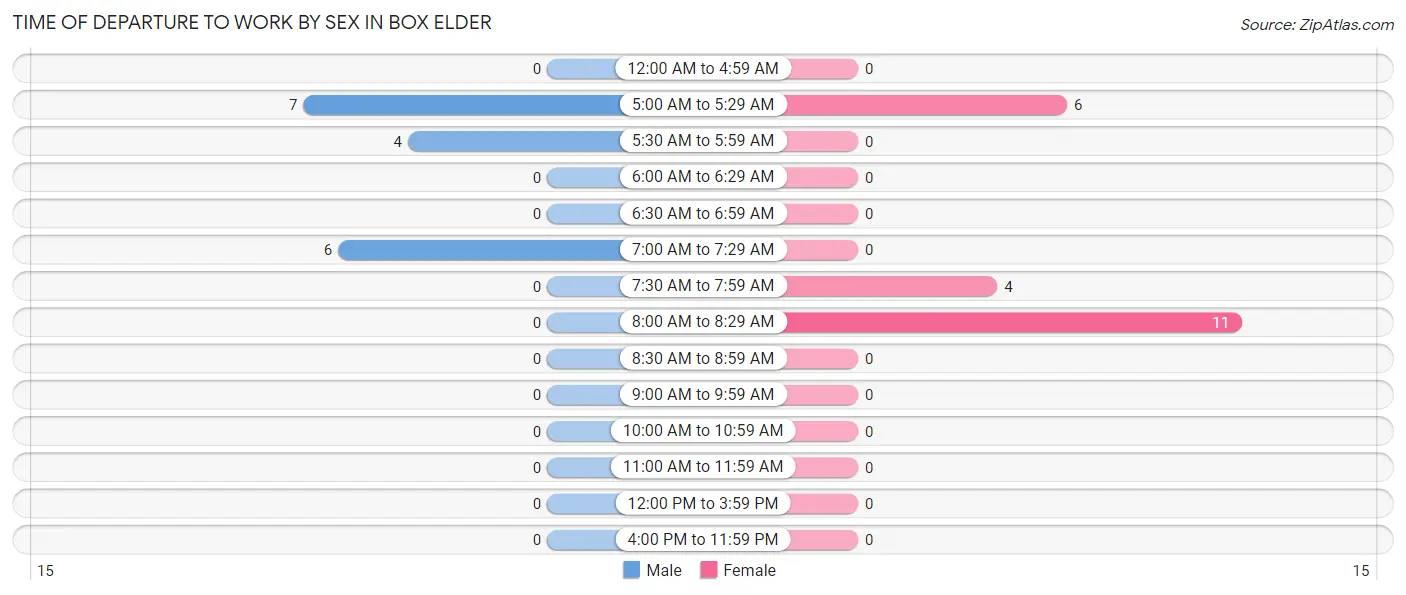
| Time of Departure | Male | Female |
| 12:00 AM to 4:59 AM | 0 (0.0%) | 0 (0.0%) |
| 5:00 AM to 5:29 AM | 7 (41.2%) | 6 (28.6%) |
| 5:30 AM to 5:59 AM | 4 (23.5%) | 0 (0.0%) |
| 6:00 AM to 6:29 AM | 0 (0.0%) | 0 (0.0%) |
| 6:30 AM to 6:59 AM | 0 (0.0%) | 0 (0.0%) |
| 7:00 AM to 7:29 AM | 6 (35.3%) | 0 (0.0%) |
| 7:30 AM to 7:59 AM | 0 (0.0%) | 4 (19.1%) |
| 8:00 AM to 8:29 AM | 0 (0.0%) | 11 (52.4%) |
| 8:30 AM to 8:59 AM | 0 (0.0%) | 0 (0.0%) |
| 9:00 AM to 9:59 AM | 0 (0.0%) | 0 (0.0%) |
| 10:00 AM to 10:59 AM | 0 (0.0%) | 0 (0.0%) |
| 11:00 AM to 11:59 AM | 0 (0.0%) | 0 (0.0%) |
| 12:00 PM to 3:59 PM | 0 (0.0%) | 0 (0.0%) |
| 4:00 PM to 11:59 PM | 0 (0.0%) | 0 (0.0%) |
| Total | 17 (100.0%) | 21 (100.0%) |
Housing Occupancy in Box Elder
Occupancy by Ownership in Box Elder
Of the total 35 dwellings in Box Elder, owner-occupied units account for 14 (40.0%), while renter-occupied units make up 21 (60.0%).
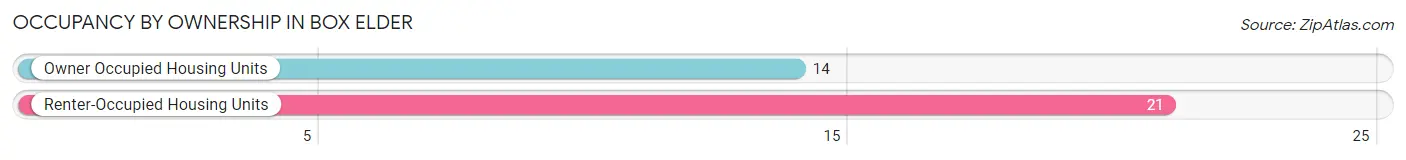
| Occupancy | # Housing Units | % Housing Units |
| Owner Occupied Housing Units | 14 | 40.0% |
| Renter-Occupied Housing Units | 21 | 60.0% |
| Total Occupied Housing Units | 35 | 100.0% |
Occupancy by Household Size in Box Elder
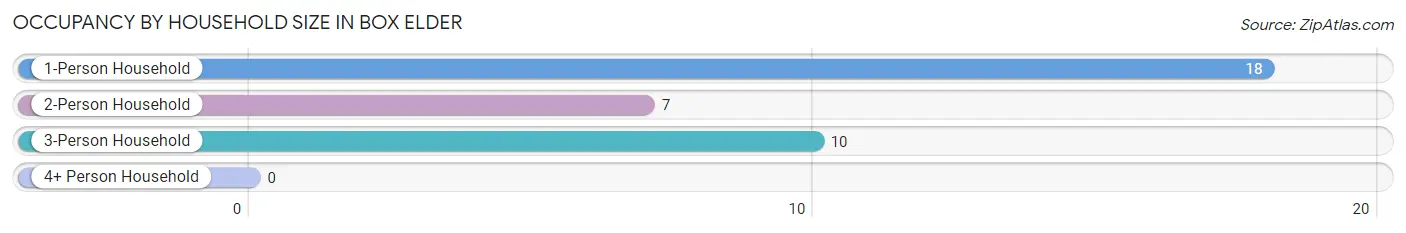
| Household Size | # Housing Units | % Housing Units |
| 1-Person Household | 18 | 51.4% |
| 2-Person Household | 7 | 20.0% |
| 3-Person Household | 10 | 28.6% |
| 4+ Person Household | 0 | 0.0% |
| Total Housing Units | 35 | 100.0% |
Occupancy by Ownership by Household Size in Box Elder
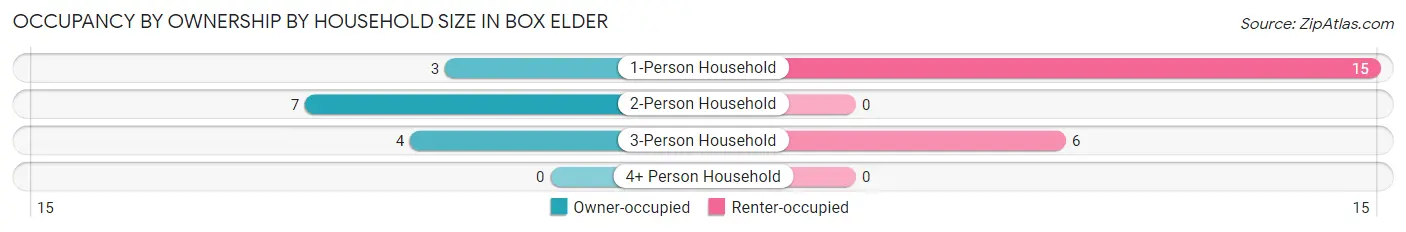
| Household Size | Owner-occupied | Renter-occupied |
| 1-Person Household | 3 (16.7%) | 15 (83.3%) |
| 2-Person Household | 7 (100.0%) | 0 (0.0%) |
| 3-Person Household | 4 (40.0%) | 6 (60.0%) |
| 4+ Person Household | 0 (0.0%) | 0 (0.0%) |
| Total Housing Units | 14 (40.0%) | 21 (60.0%) |
Occupancy by Educational Attainment in Box Elder
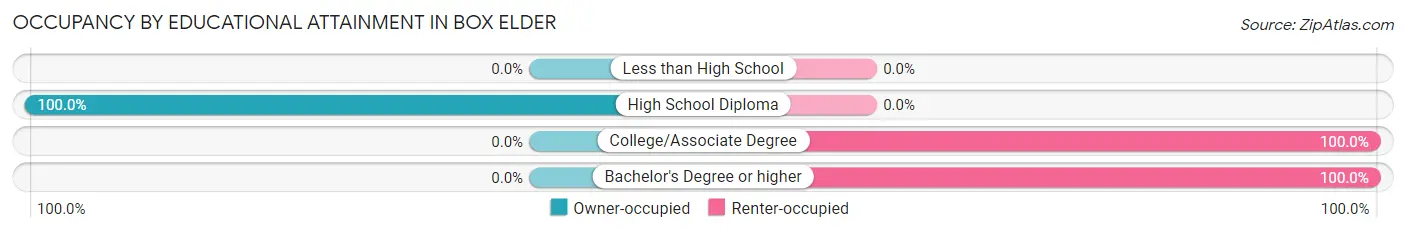
| Household Size | Owner-occupied | Renter-occupied |
| Less than High School | 0 (0.0%) | 0 (0.0%) |
| High School Diploma | 14 (100.0%) | 0 (0.0%) |
| College/Associate Degree | 0 (0.0%) | 17 (100.0%) |
| Bachelor's Degree or higher | 0 (0.0%) | 4 (100.0%) |
Occupancy by Age of Householder in Box Elder
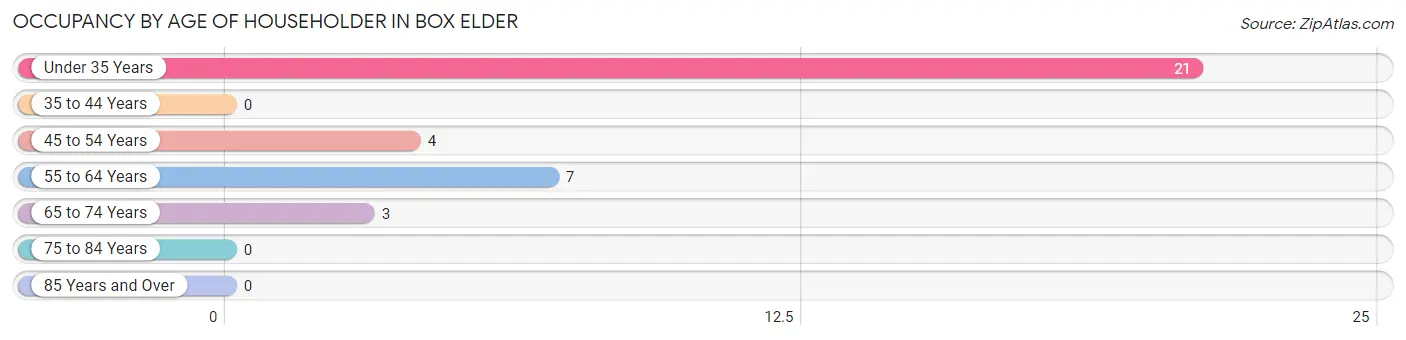
| Age Bracket | # Households | % Households |
| Under 35 Years | 21 | 60.0% |
| 35 to 44 Years | 0 | 0.0% |
| 45 to 54 Years | 4 | 11.4% |
| 55 to 64 Years | 7 | 20.0% |
| 65 to 74 Years | 3 | 8.6% |
| 75 to 84 Years | 0 | 0.0% |
| 85 Years and Over | 0 | 0.0% |
| Total | 35 | 100.0% |
Housing Finances in Box Elder
Median Income by Occupancy in Box Elder
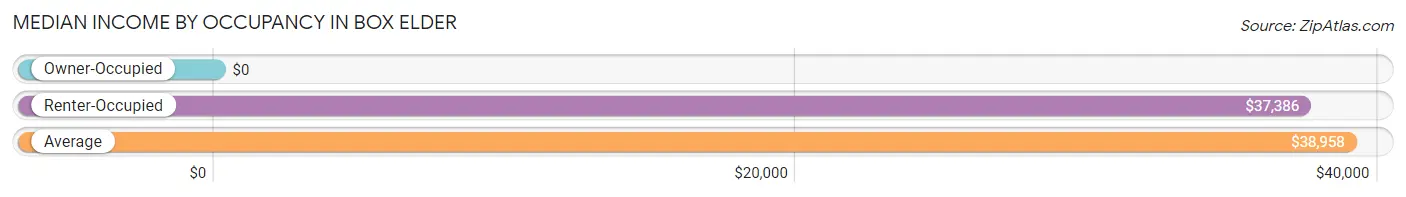
| Occupancy Type | # Households | Median Income |
| Owner-Occupied | 14 (40.0%) | $0 |
| Renter-Occupied | 21 (60.0%) | $37,386 |
| Average | 35 (100.0%) | $38,958 |
Occupancy by Householder Income Bracket in Box Elder
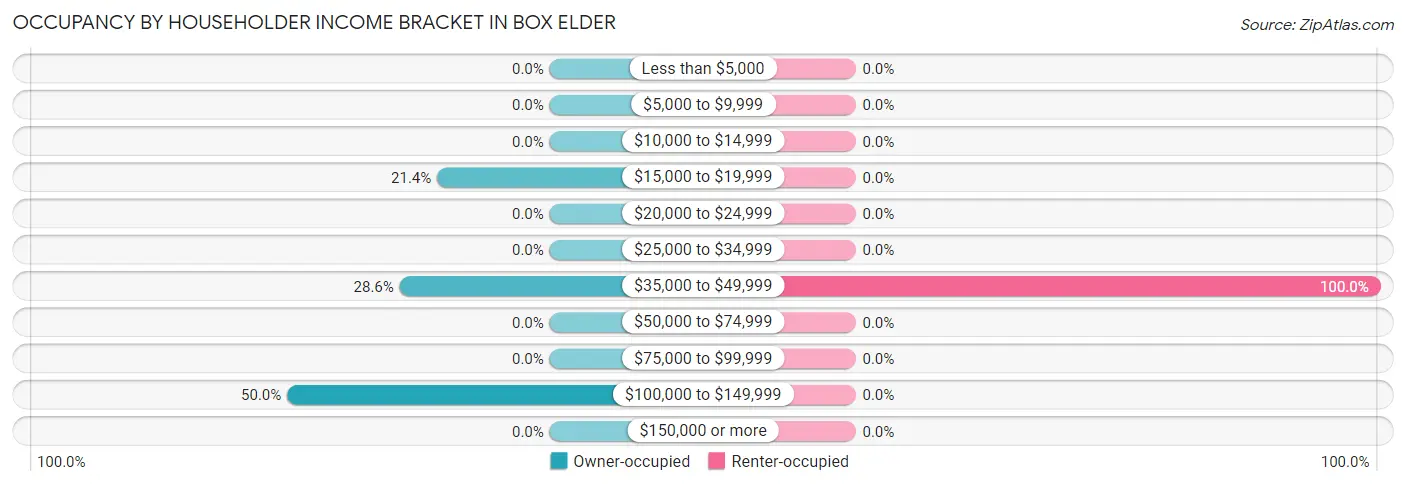
| Income Bracket | Owner-occupied | Renter-occupied |
| Less than $5,000 | 0 (0.0%) | 0 (0.0%) |
| $5,000 to $9,999 | 0 (0.0%) | 0 (0.0%) |
| $10,000 to $14,999 | 0 (0.0%) | 0 (0.0%) |
| $15,000 to $19,999 | 3 (21.4%) | 0 (0.0%) |
| $20,000 to $24,999 | 0 (0.0%) | 0 (0.0%) |
| $25,000 to $34,999 | 0 (0.0%) | 0 (0.0%) |
| $35,000 to $49,999 | 4 (28.6%) | 21 (100.0%) |
| $50,000 to $74,999 | 0 (0.0%) | 0 (0.0%) |
| $75,000 to $99,999 | 0 (0.0%) | 0 (0.0%) |
| $100,000 to $149,999 | 7 (50.0%) | 0 (0.0%) |
| $150,000 or more | 0 (0.0%) | 0 (0.0%) |
| Total | 14 (100.0%) | 21 (100.0%) |
Monthly Housing Cost Tiers in Box Elder
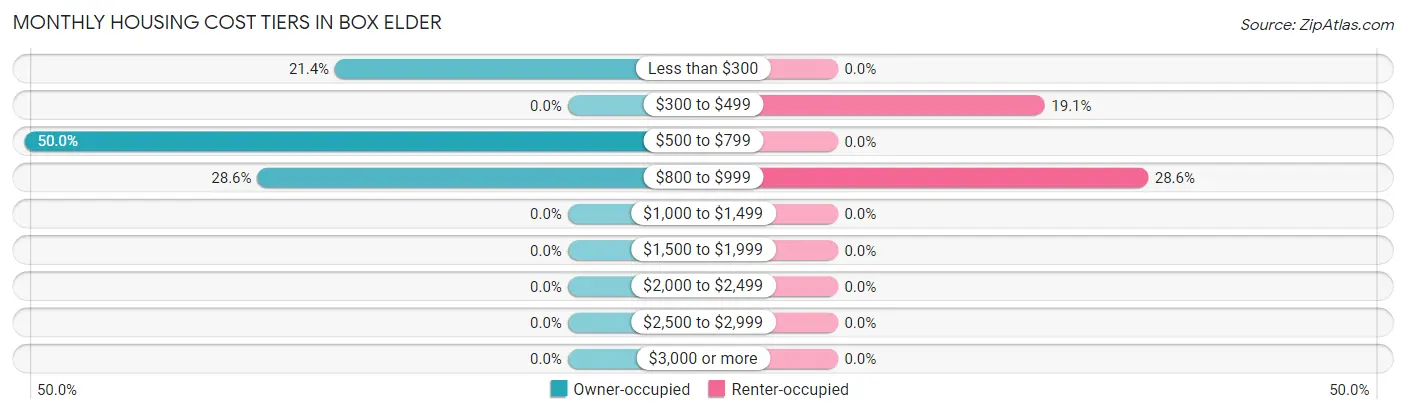
| Monthly Cost | Owner-occupied | Renter-occupied |
| Less than $300 | 3 (21.4%) | 0 (0.0%) |
| $300 to $499 | 0 (0.0%) | 4 (19.1%) |
| $500 to $799 | 7 (50.0%) | 0 (0.0%) |
| $800 to $999 | 4 (28.6%) | 6 (28.6%) |
| $1,000 to $1,499 | 0 (0.0%) | 0 (0.0%) |
| $1,500 to $1,999 | 0 (0.0%) | 0 (0.0%) |
| $2,000 to $2,499 | 0 (0.0%) | 0 (0.0%) |
| $2,500 to $2,999 | 0 (0.0%) | 0 (0.0%) |
| $3,000 or more | 0 (0.0%) | 0 (0.0%) |
| Total | 14 (100.0%) | 21 (100.0%) |
Physical Housing Characteristics in Box Elder
Housing Structures in Box Elder
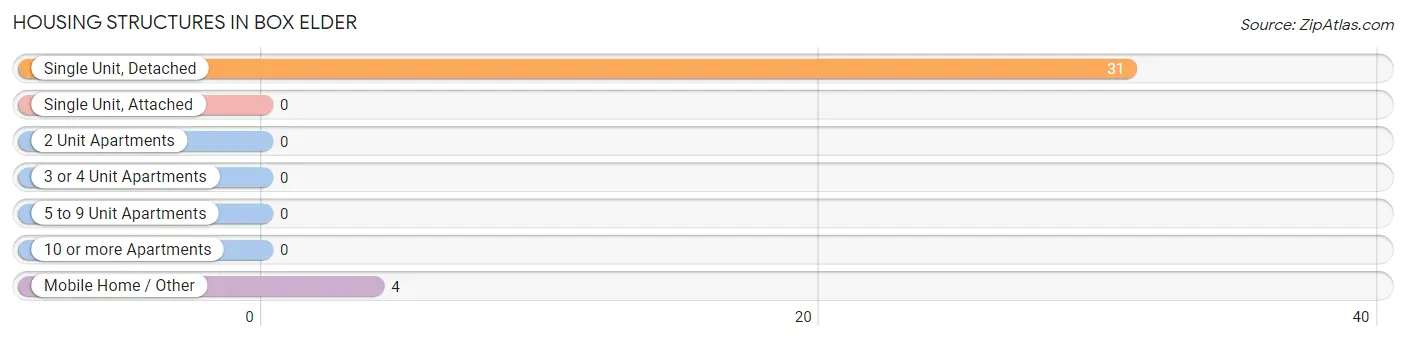
| Structure Type | # Housing Units | % Housing Units |
| Single Unit, Detached | 31 | 88.6% |
| Single Unit, Attached | 0 | 0.0% |
| 2 Unit Apartments | 0 | 0.0% |
| 3 or 4 Unit Apartments | 0 | 0.0% |
| 5 to 9 Unit Apartments | 0 | 0.0% |
| 10 or more Apartments | 0 | 0.0% |
| Mobile Home / Other | 4 | 11.4% |
| Total | 35 | 100.0% |
Housing Structures by Occupancy in Box Elder
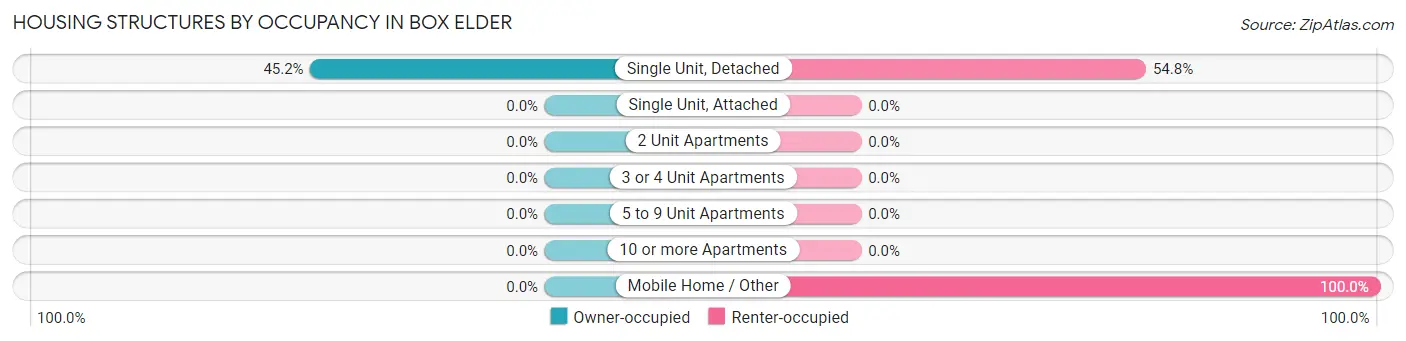
| Structure Type | Owner-occupied | Renter-occupied |
| Single Unit, Detached | 14 (45.2%) | 17 (54.8%) |
| Single Unit, Attached | 0 (0.0%) | 0 (0.0%) |
| 2 Unit Apartments | 0 (0.0%) | 0 (0.0%) |
| 3 or 4 Unit Apartments | 0 (0.0%) | 0 (0.0%) |
| 5 to 9 Unit Apartments | 0 (0.0%) | 0 (0.0%) |
| 10 or more Apartments | 0 (0.0%) | 0 (0.0%) |
| Mobile Home / Other | 0 (0.0%) | 4 (100.0%) |
| Total | 14 (40.0%) | 21 (60.0%) |
Housing Structures by Number of Rooms in Box Elder
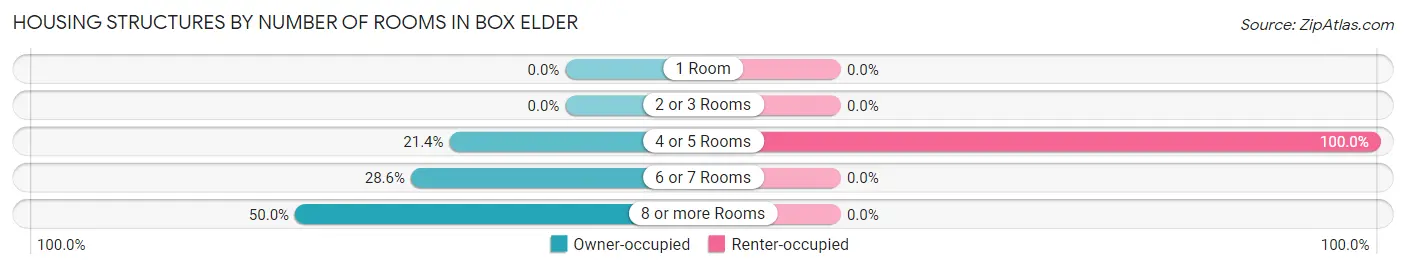
| Number of Rooms | Owner-occupied | Renter-occupied |
| 1 Room | 0 (0.0%) | 0 (0.0%) |
| 2 or 3 Rooms | 0 (0.0%) | 0 (0.0%) |
| 4 or 5 Rooms | 3 (21.4%) | 21 (100.0%) |
| 6 or 7 Rooms | 4 (28.6%) | 0 (0.0%) |
| 8 or more Rooms | 7 (50.0%) | 0 (0.0%) |
| Total | 14 (100.0%) | 21 (100.0%) |
Housing Structure by Heating Type in Box Elder
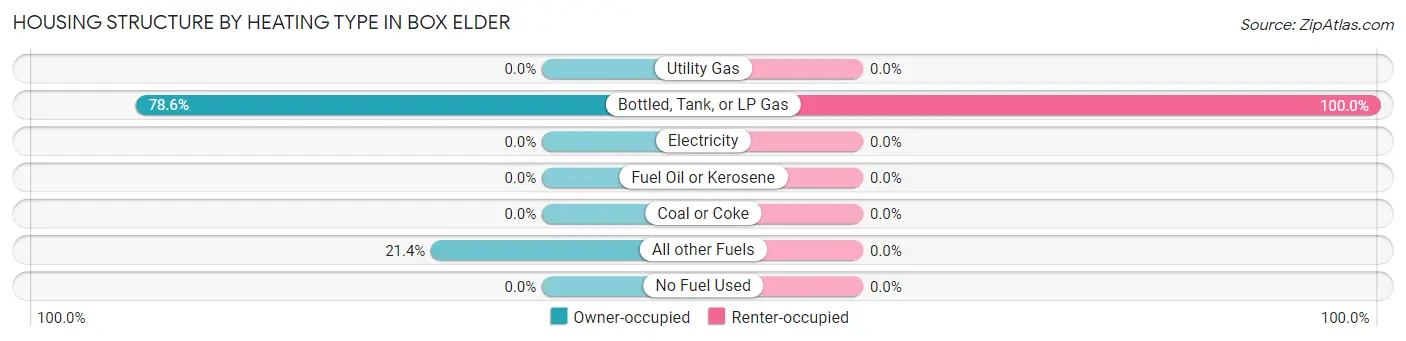
| Heating Type | Owner-occupied | Renter-occupied |
| Utility Gas | 0 (0.0%) | 0 (0.0%) |
| Bottled, Tank, or LP Gas | 11 (78.6%) | 21 (100.0%) |
| Electricity | 0 (0.0%) | 0 (0.0%) |
| Fuel Oil or Kerosene | 0 (0.0%) | 0 (0.0%) |
| Coal or Coke | 0 (0.0%) | 0 (0.0%) |
| All other Fuels | 3 (21.4%) | 0 (0.0%) |
| No Fuel Used | 0 (0.0%) | 0 (0.0%) |
| Total | 14 (100.0%) | 21 (100.0%) |
Household Vehicle Usage in Box Elder
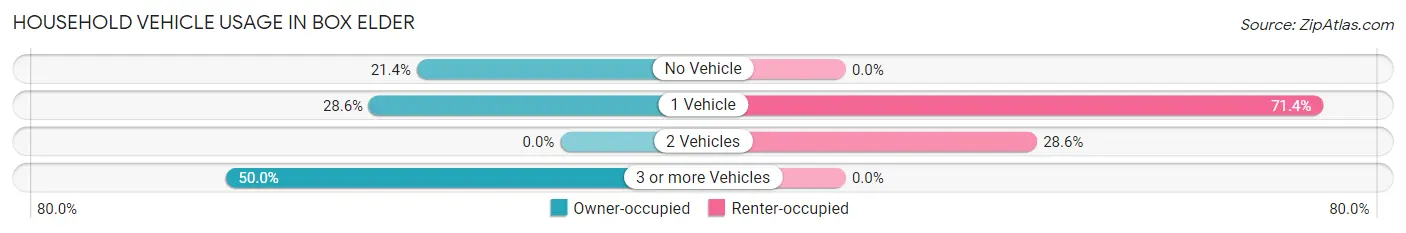
| Vehicles per Household | Owner-occupied | Renter-occupied |
| No Vehicle | 3 (21.4%) | 0 (0.0%) |
| 1 Vehicle | 4 (28.6%) | 15 (71.4%) |
| 2 Vehicles | 0 (0.0%) | 6 (28.6%) |
| 3 or more Vehicles | 7 (50.0%) | 0 (0.0%) |
| Total | 14 (100.0%) | 21 (100.0%) |
Real Estate & Mortgages in Box Elder
Real Estate and Mortgage Overview in Box Elder
| Characteristic | Without Mortgage | With Mortgage |
| Housing Units | 10 | 4 |
| Median Property Value | - | - |
| Median Household Income | - | - |
| Monthly Housing Costs | - | - |
| Real Estate Taxes | - | - |
Property Value by Mortgage Status in Box Elder
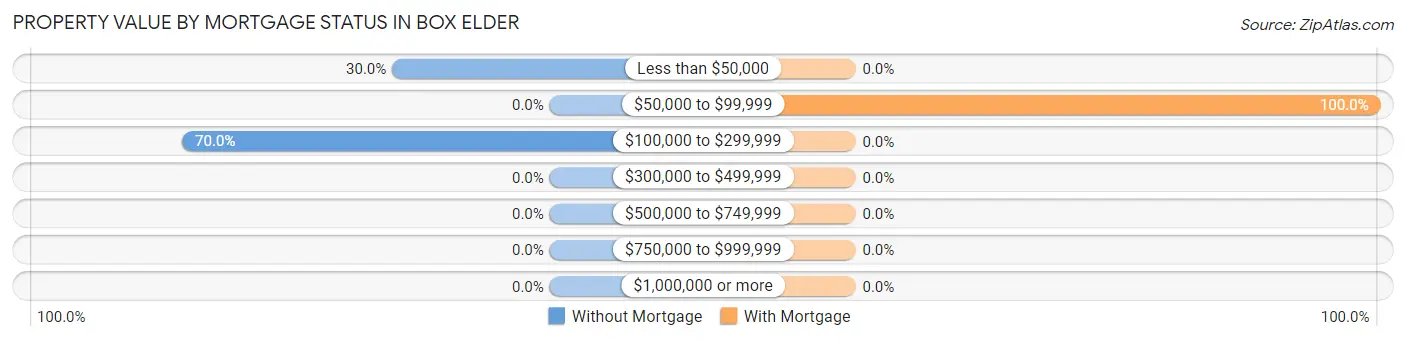
| Property Value | Without Mortgage | With Mortgage |
| Less than $50,000 | 3 (30.0%) | 0 (0.0%) |
| $50,000 to $99,999 | 0 (0.0%) | 4 (100.0%) |
| $100,000 to $299,999 | 7 (70.0%) | 0 (0.0%) |
| $300,000 to $499,999 | 0 (0.0%) | 0 (0.0%) |
| $500,000 to $749,999 | 0 (0.0%) | 0 (0.0%) |
| $750,000 to $999,999 | 0 (0.0%) | 0 (0.0%) |
| $1,000,000 or more | 0 (0.0%) | 0 (0.0%) |
| Total | 10 (100.0%) | 4 (100.0%) |
Household Income by Mortgage Status in Box Elder
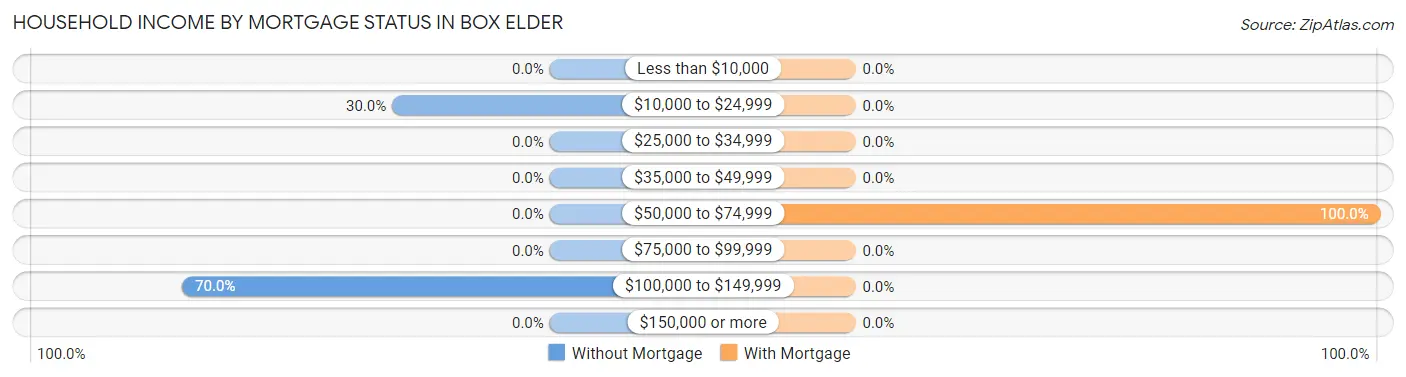
| Household Income | Without Mortgage | With Mortgage |
| Less than $10,000 | 0 (0.0%) | 0 (0.0%) |
| $10,000 to $24,999 | 3 (30.0%) | 0 (0.0%) |
| $25,000 to $34,999 | 0 (0.0%) | 0 (0.0%) |
| $35,000 to $49,999 | 0 (0.0%) | 0 (0.0%) |
| $50,000 to $74,999 | 0 (0.0%) | 4 (100.0%) |
| $75,000 to $99,999 | 0 (0.0%) | 0 (0.0%) |
| $100,000 to $149,999 | 7 (70.0%) | 0 (0.0%) |
| $150,000 or more | 0 (0.0%) | 0 (0.0%) |
| Total | 10 (100.0%) | 4 (100.0%) |
Property Value to Household Income Ratio in Box Elder
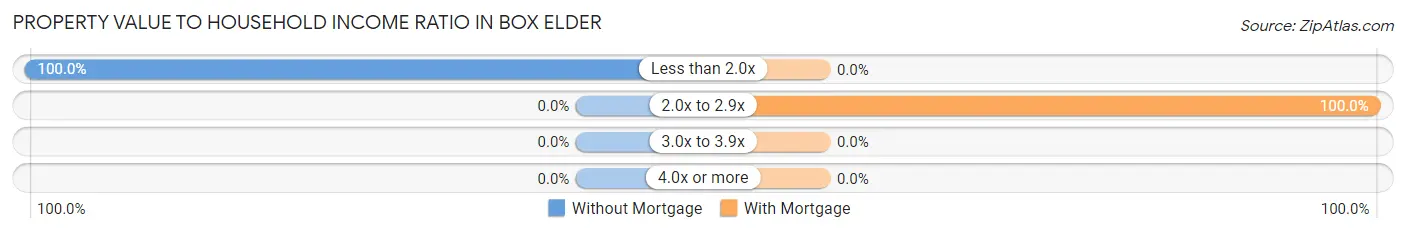
| Value-to-Income Ratio | Without Mortgage | With Mortgage |
| Less than 2.0x | 10 (100.0%) | 0 (0.0%) |
| 2.0x to 2.9x | 0 (0.0%) | 4 (100.0%) |
| 3.0x to 3.9x | 0 (0.0%) | 0 (0.0%) |
| 4.0x or more | 0 (0.0%) | 0 (0.0%) |
| Total | 10 (100.0%) | 4 (100.0%) |
Real Estate Taxes by Mortgage Status in Box Elder
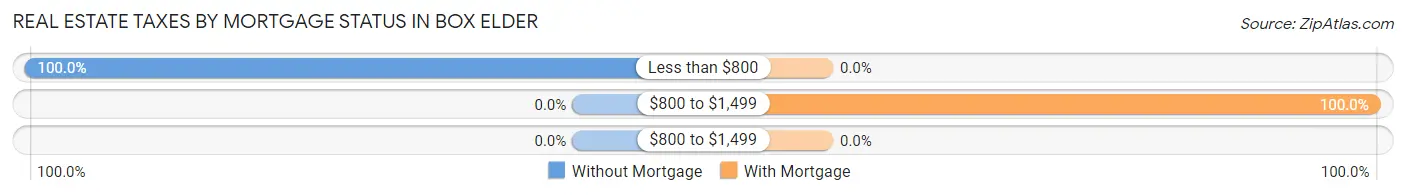
| Property Taxes | Without Mortgage | With Mortgage |
| Less than $800 | 10 (100.0%) | 0 (0.0%) |
| $800 to $1,499 | 0 (0.0%) | 4 (100.0%) |
| $800 to $1,499 | 0 (0.0%) | 0 (0.0%) |
| Total | 10 (100.0%) | 4 (100.0%) |
Health & Disability in Box Elder
Health Insurance Coverage by Age in Box Elder
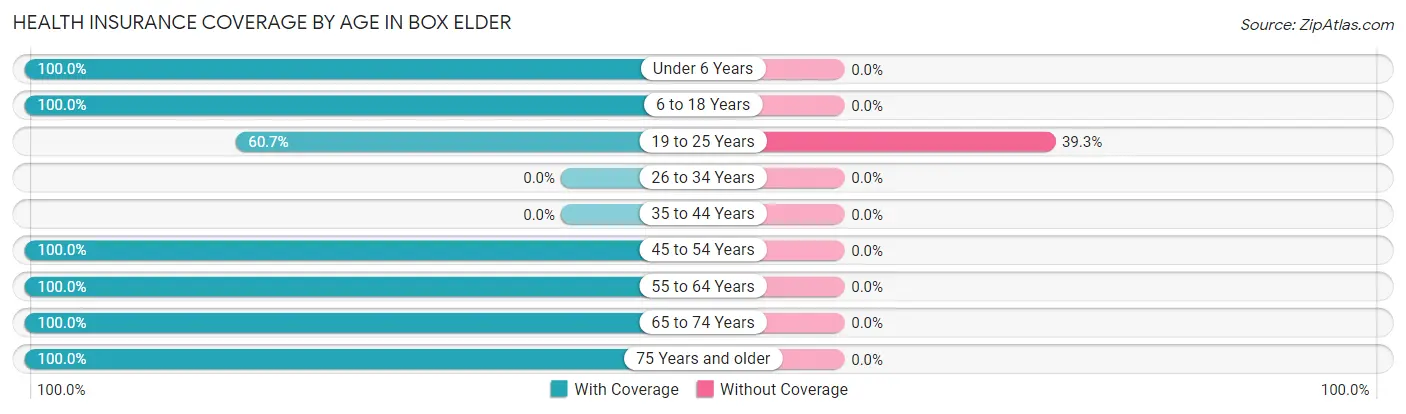
| Age Bracket | With Coverage | Without Coverage |
| Under 6 Years | 12 (100.0%) | 0 (0.0%) |
| 6 to 18 Years | 5 (100.0%) | 0 (0.0%) |
| 19 to 25 Years | 17 (60.7%) | 11 (39.3%) |
| 26 to 34 Years | 0 (0.0%) | 0 (0.0%) |
| 35 to 44 Years | 0 (0.0%) | 0 (0.0%) |
| 45 to 54 Years | 10 (100.0%) | 0 (0.0%) |
| 55 to 64 Years | 7 (100.0%) | 0 (0.0%) |
| 65 to 74 Years | 3 (100.0%) | 0 (0.0%) |
| 75 Years and older | 3 (100.0%) | 0 (0.0%) |
| Total | 57 (83.8%) | 11 (16.2%) |
Health Insurance Coverage by Citizenship Status in Box Elder
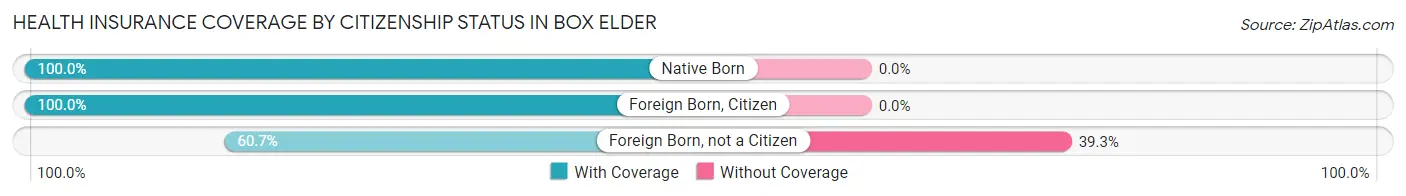
| Citizenship Status | With Coverage | Without Coverage |
| Native Born | 12 (100.0%) | 0 (0.0%) |
| Foreign Born, Citizen | 5 (100.0%) | 0 (0.0%) |
| Foreign Born, not a Citizen | 17 (60.7%) | 11 (39.3%) |
Health Insurance Coverage by Household Income in Box Elder
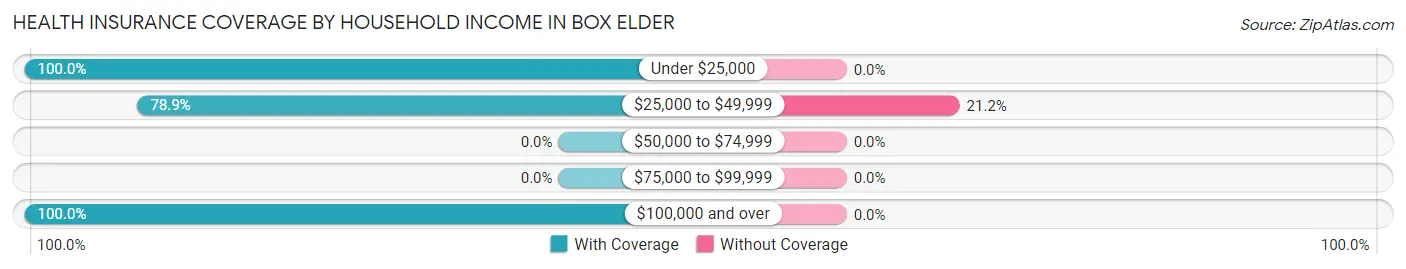
| Household Income | With Coverage | Without Coverage |
| Under $25,000 | 3 (100.0%) | 0 (0.0%) |
| $25,000 to $49,999 | 41 (78.8%) | 11 (21.1%) |
| $50,000 to $74,999 | 0 (0.0%) | 0 (0.0%) |
| $75,000 to $99,999 | 0 (0.0%) | 0 (0.0%) |
| $100,000 and over | 13 (100.0%) | 0 (0.0%) |
Public vs Private Health Insurance Coverage by Age in Box Elder
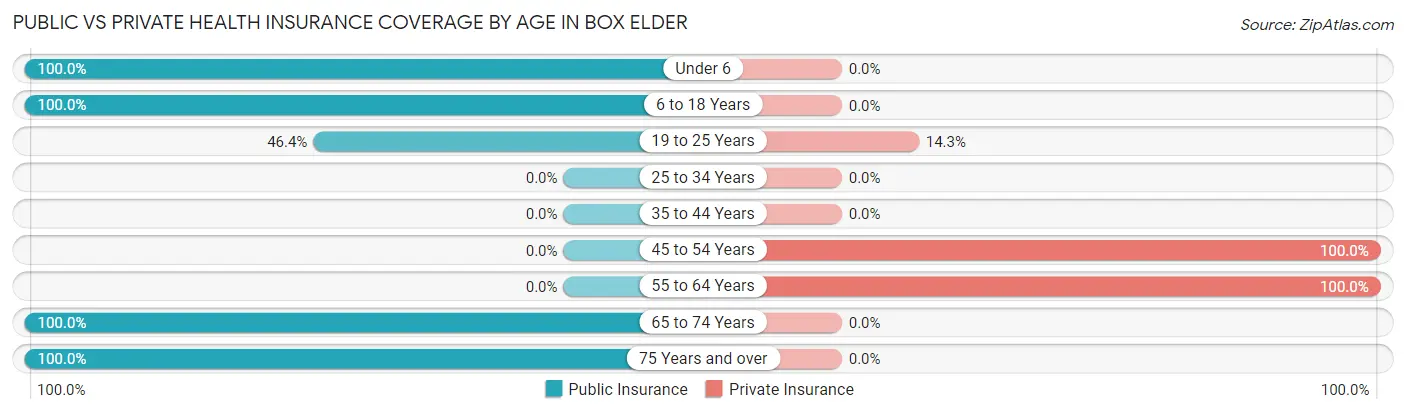
| Age Bracket | Public Insurance | Private Insurance |
| Under 6 | 12 (100.0%) | 0 (0.0%) |
| 6 to 18 Years | 5 (100.0%) | 0 (0.0%) |
| 19 to 25 Years | 13 (46.4%) | 4 (14.3%) |
| 25 to 34 Years | 0 (0.0%) | 0 (0.0%) |
| 35 to 44 Years | 0 (0.0%) | 0 (0.0%) |
| 45 to 54 Years | 0 (0.0%) | 10 (100.0%) |
| 55 to 64 Years | 0 (0.0%) | 7 (100.0%) |
| 65 to 74 Years | 3 (100.0%) | 0 (0.0%) |
| 75 Years and over | 3 (100.0%) | 0 (0.0%) |
| Total | 36 (52.9%) | 21 (30.9%) |
Disability Status by Sex by Age in Box Elder
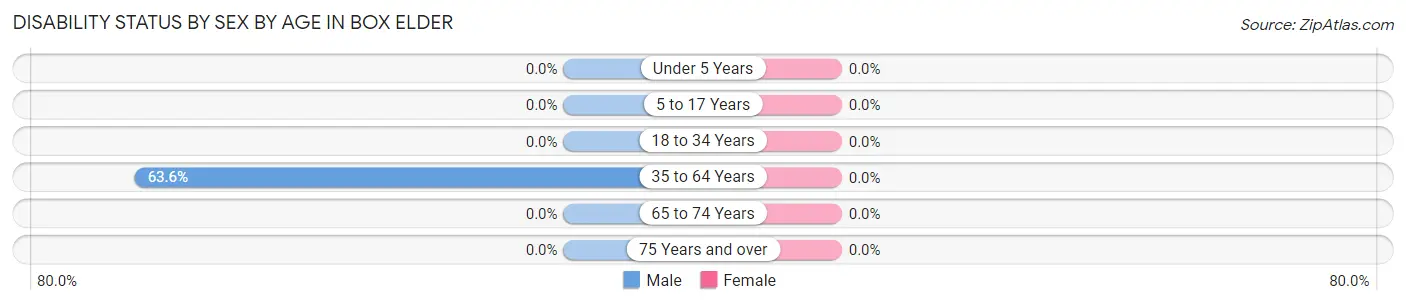
| Age Bracket | Male | Female |
| Under 5 Years | 0 (0.0%) | 0 (0.0%) |
| 5 to 17 Years | 0 (0.0%) | 0 (0.0%) |
| 18 to 34 Years | 0 (0.0%) | 0 (0.0%) |
| 35 to 64 Years | 7 (63.6%) | 0 (0.0%) |
| 65 to 74 Years | 0 (0.0%) | 0 (0.0%) |
| 75 Years and over | 0 (0.0%) | 0 (0.0%) |
Disability Class by Sex by Age in Box Elder
Disability Class: Hearing Difficulty
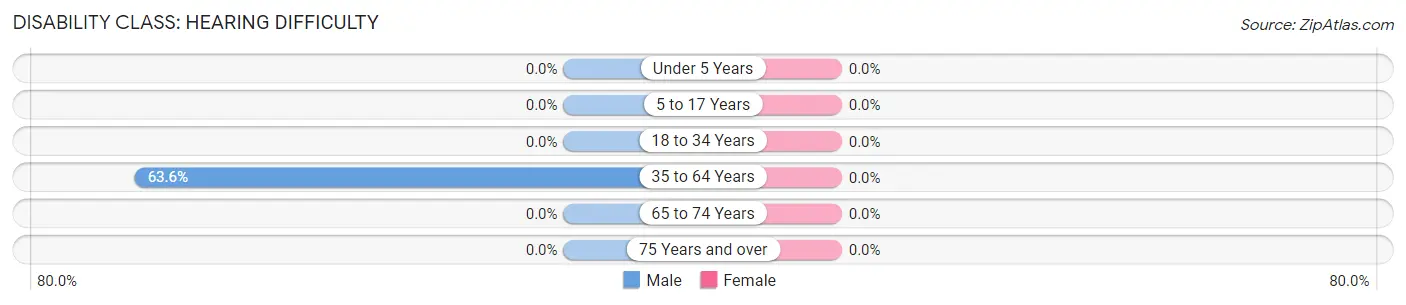
| Age Bracket | Male | Female |
| Under 5 Years | 0 (0.0%) | 0 (0.0%) |
| 5 to 17 Years | 0 (0.0%) | 0 (0.0%) |
| 18 to 34 Years | 0 (0.0%) | 0 (0.0%) |
| 35 to 64 Years | 7 (63.6%) | 0 (0.0%) |
| 65 to 74 Years | 0 (0.0%) | 0 (0.0%) |
| 75 Years and over | 0 (0.0%) | 0 (0.0%) |
Disability Class: Vision Difficulty
| Age Bracket | Male | Female |
| Under 5 Years | 0 (0.0%) | 0 (0.0%) |
| 5 to 17 Years | 0 (0.0%) | 0 (0.0%) |
| 18 to 34 Years | 0 (0.0%) | 0 (0.0%) |
| 35 to 64 Years | 0 (0.0%) | 0 (0.0%) |
| 65 to 74 Years | 0 (0.0%) | 0 (0.0%) |
| 75 Years and over | 0 (0.0%) | 0 (0.0%) |
Disability Class: Cognitive Difficulty

| Age Bracket | Male | Female |
| 5 to 17 Years | 0 (0.0%) | 0 (0.0%) |
| 18 to 34 Years | 0 (0.0%) | 0 (0.0%) |
| 35 to 64 Years | 0 (0.0%) | 0 (0.0%) |
| 65 to 74 Years | 0 (0.0%) | 0 (0.0%) |
| 75 Years and over | 0 (0.0%) | 0 (0.0%) |
Disability Class: Ambulatory Difficulty
| Age Bracket | Male | Female |
| 5 to 17 Years | 0 (0.0%) | 0 (0.0%) |
| 18 to 34 Years | 0 (0.0%) | 0 (0.0%) |
| 35 to 64 Years | 0 (0.0%) | 0 (0.0%) |
| 65 to 74 Years | 0 (0.0%) | 0 (0.0%) |
| 75 Years and over | 0 (0.0%) | 0 (0.0%) |
Disability Class: Self-Care Difficulty
| Age Bracket | Male | Female |
| 5 to 17 Years | 0 (0.0%) | 0 (0.0%) |
| 18 to 34 Years | 0 (0.0%) | 0 (0.0%) |
| 35 to 64 Years | 0 (0.0%) | 0 (0.0%) |
| 65 to 74 Years | 0 (0.0%) | 0 (0.0%) |
| 75 Years and over | 0 (0.0%) | 0 (0.0%) |
Technology Access in Box Elder
Computing Device Access in Box Elder
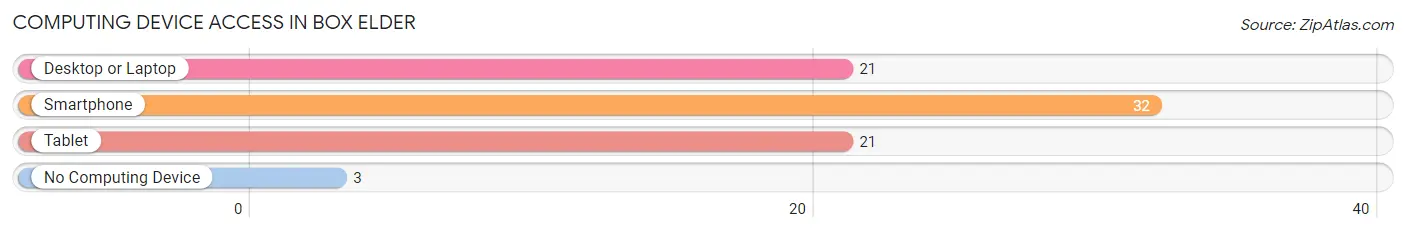
| Device Type | # Households | % Households |
| Desktop or Laptop | 21 | 60.0% |
| Smartphone | 32 | 91.4% |
| Tablet | 21 | 60.0% |
| No Computing Device | 3 | 8.6% |
| Total | 35 | 100.0% |
Internet Access in Box Elder
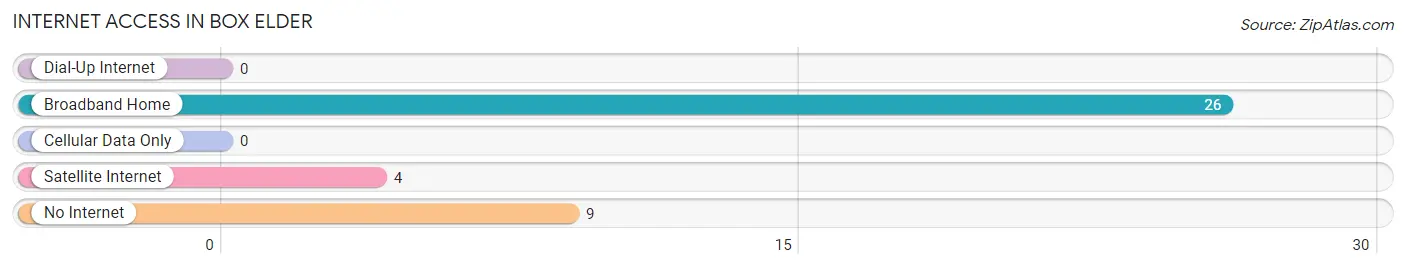
| Internet Type | # Households | % Households |
| Dial-Up Internet | 0 | 0.0% |
| Broadband Home | 26 | 74.3% |
| Cellular Data Only | 0 | 0.0% |
| Satellite Internet | 4 | 11.4% |
| No Internet | 9 | 25.7% |
| Total | 35 | 100.0% |
Box Elder Summary
History
Box Elder is a small town located in the state of Montana, in the United States. It is situated in the northern part of the state, in the county of Hill. The town was founded in 1883, when the Great Northern Railway was built through the area. The town was named after the box elder trees that grew in the area.
The town was originally a farming community, with many of the early settlers coming from the Midwest. The town was also home to a number of Native American tribes, including the Blackfeet, Gros Ventre, and Assiniboine.
In the early 1900s, the town began to grow and develop. The Great Northern Railway built a depot in the town, and the town became a hub for the surrounding area. The town also became a center for the timber industry, with several sawmills being built in the area.
In the 1950s, the town began to decline, as the timber industry began to move away from the area. The town was also affected by the Great Depression, and many of the businesses in the town closed.
In the late 1970s, the town began to experience a resurgence, as the timber industry began to return to the area. The town also began to attract tourists, as the nearby Glacier National Park became a popular destination.
Today, Box Elder is a small town with a population of just over 1,000 people. The town is still home to a number of sawmills, and the timber industry is still a major part of the local economy. The town is also home to a number of tourist attractions, including the nearby Glacier National Park.
Geography
Box Elder is located in the northern part of the state of Montana, in the county of Hill. The town is situated in the Rocky Mountains, at an elevation of 4,000 feet. The town is located near the Flathead River, and is surrounded by mountains and forests.
The climate in Box Elder is generally mild, with warm summers and cold winters. The average temperature in the summer is around 70 degrees Fahrenheit, and the average temperature in the winter is around 20 degrees Fahrenheit.
Economy
The economy of Box Elder is largely based on the timber industry. The town is home to several sawmills, and the timber industry is a major part of the local economy. The town is also home to a number of tourist attractions, including the nearby Glacier National Park.
The town is also home to a number of small businesses, including restaurants, shops, and other services. The town is also home to a number of small manufacturing companies, which produce a variety of products.
Demographics
As of the 2010 census, the population of Box Elder was 1,072. The town is predominantly white, with 92.3% of the population being white. The town is also home to a small Native American population, with 4.2% of the population being Native American. The town is also home to a small Hispanic population, with 2.2% of the population being Hispanic. The median household income in the town is $41,250, and the median home value is $127,000.
Common Questions
What is Per Capita Income in Box Elder?
Per Capita income in Box Elder is $27,919.
What is the Median Household income in Box Elder?
Median Household Income in Box Elder is $38,958.
What is Income or Wage Gap in Box Elder?
Income or Wage Gap in Box Elder is 5.1%.
Women in Box Elder earn 94.9 cents for every dollar earned by a man.
What is Inequality or Gini Index in Box Elder?
Inequality or Gini Index in Box Elder is 0.31.
What is the Total Population of Box Elder?
Total Population of Box Elder is 68.
What is the Total Male Population of Box Elder?
Total Male Population of Box Elder is 29.
What is the Total Female Population of Box Elder?
Total Female Population of Box Elder is 39.
What is the Ratio of Males per 100 Females in Box Elder?
There are 74.36 Males per 100 Females in Box Elder.
What is the Ratio of Females per 100 Males in Box Elder?
There are 134.48 Females per 100 Males in Box Elder.
What is the Median Population Age in Box Elder?
Median Population Age in Box Elder is 25.0 Years.
What is the Average Family Size in Box Elder
Average Family Size in Box Elder is 2.9 People.
What is the Average Household Size in Box Elder
Average Household Size in Box Elder is 1.9 People.
How Large is the Labor Force in Box Elder?
There are 38 People in the Labor Forcein in Box Elder.
What is the Percentage of People in the Labor Force in Box Elder?
74.5% of People are in the Labor Force in Box Elder.