Fort Smith, MT Map & Demographics
Fort Smith Map
Fort Smith Overview
$34,023
PER CAPITA INCOME
$53,920
AVG FAMILY INCOME
$49,398
AVG HOUSEHOLD INCOME
24.8%
WAGE / INCOME GAP [ % ]
75.2¢/ $1
WAGE / INCOME GAP [ $ ]
0.13
INEQUALITY / GINI INDEX
115
TOTAL POPULATION
70
MALE POPULATION
45
FEMALE POPULATION
155.56
MALES / 100 FEMALES
64.29
FEMALES / 100 MALES
56.7
MEDIAN AGE
2.6
AVG FAMILY SIZE
1.5
AVG HOUSEHOLD SIZE
49
LABOR FORCE [ PEOPLE ]
42.6%
PERCENT IN LABOR FORCE
Fort Smith Zip Codes
Fort Smith Area Codes
Income in Fort Smith
Income Overview in Fort Smith
Per Capita Income in Fort Smith is $34,023, while median incomes of families and households are $53,920 and $49,398 respectively.
| Characteristic | Number | Measure |
| Per Capita Income | 115 | $34,023 |
| Median Family Income | 25 | $53,920 |
| Mean Family Income | 25 | $55,052 |
| Median Household Income | 75 | $49,398 |
| Mean Household Income | 75 | $45,863 |
| Income Deficit | 25 | $0 |
| Wage / Income Gap (%) | 115 | 24.79% |
| Wage / Income Gap ($) | 115 | 75.21¢ per $1 |
| Gini / Inequality Index | 115 | 0.13 |
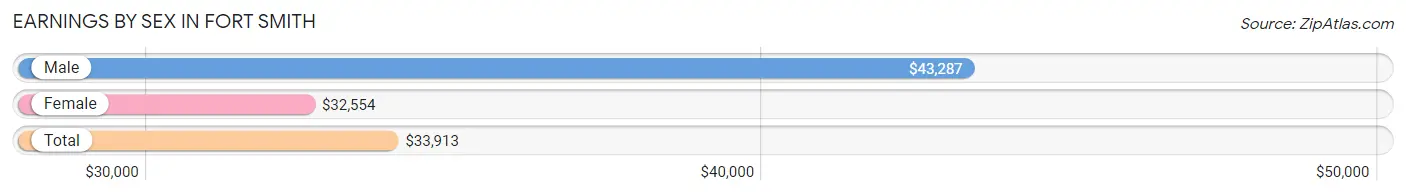
Earnings by Sex in Fort Smith
Average Earnings in Fort Smith are $33,913, $43,287 for men and $32,554 for women, a difference of 24.8%.
| Sex | Number | Average Earnings |
| Male | 37 (45.1%) | $43,287 |
| Female | 45 (54.9%) | $32,554 |
| Total | 82 (100.0%) | $33,913 |
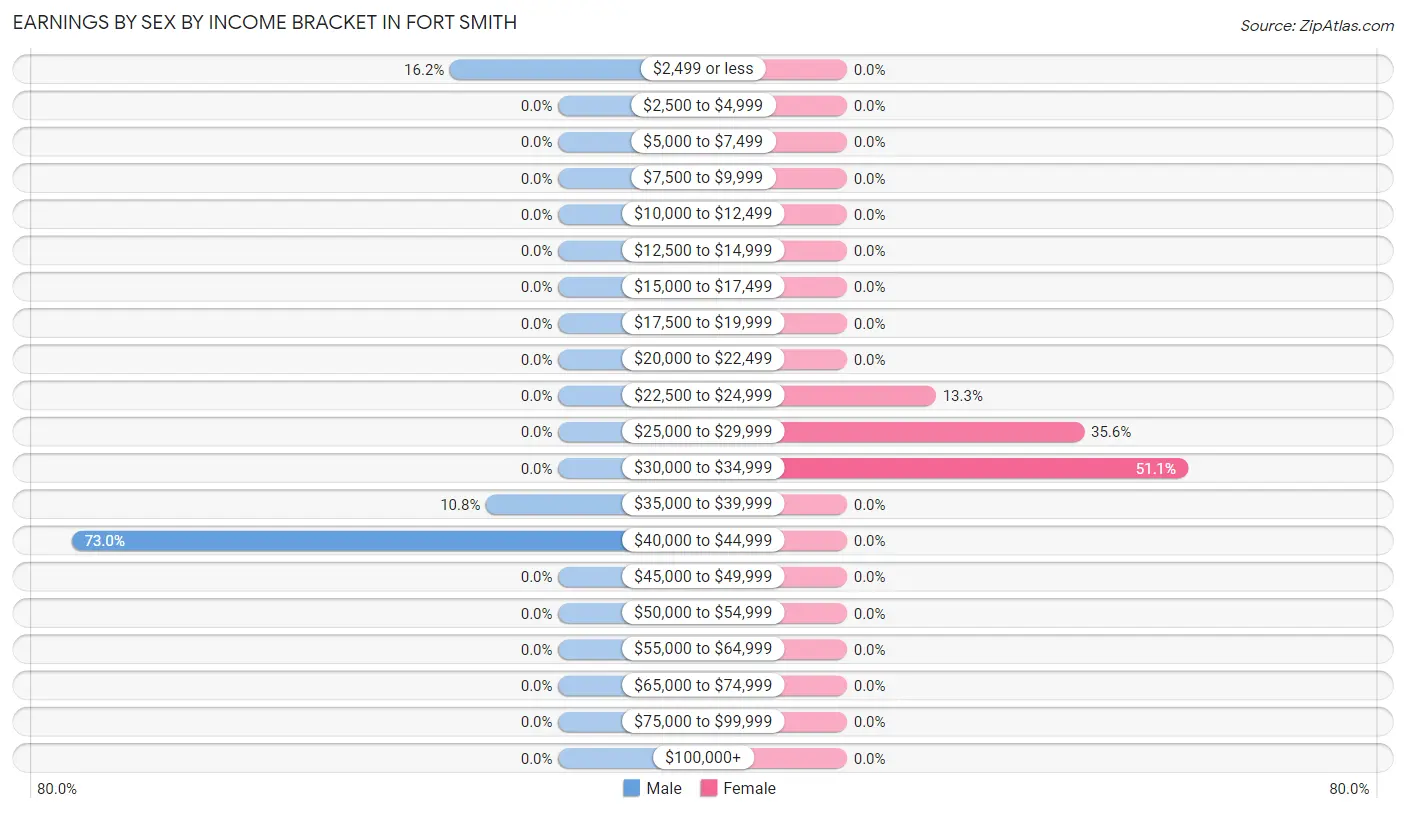
Earnings by Sex by Income Bracket in Fort Smith
The most common earnings brackets in Fort Smith are $40,000 to $44,999 for men (27 | 73.0%) and $30,000 to $34,999 for women (23 | 51.1%).
| Income | Male | Female |
| $2,499 or less | 6 (16.2%) | 0 (0.0%) |
| $2,500 to $4,999 | 0 (0.0%) | 0 (0.0%) |
| $5,000 to $7,499 | 0 (0.0%) | 0 (0.0%) |
| $7,500 to $9,999 | 0 (0.0%) | 0 (0.0%) |
| $10,000 to $12,499 | 0 (0.0%) | 0 (0.0%) |
| $12,500 to $14,999 | 0 (0.0%) | 0 (0.0%) |
| $15,000 to $17,499 | 0 (0.0%) | 0 (0.0%) |
| $17,500 to $19,999 | 0 (0.0%) | 0 (0.0%) |
| $20,000 to $22,499 | 0 (0.0%) | 0 (0.0%) |
| $22,500 to $24,999 | 0 (0.0%) | 6 (13.3%) |
| $25,000 to $29,999 | 0 (0.0%) | 16 (35.6%) |
| $30,000 to $34,999 | 0 (0.0%) | 23 (51.1%) |
| $35,000 to $39,999 | 4 (10.8%) | 0 (0.0%) |
| $40,000 to $44,999 | 27 (73.0%) | 0 (0.0%) |
| $45,000 to $49,999 | 0 (0.0%) | 0 (0.0%) |
| $50,000 to $54,999 | 0 (0.0%) | 0 (0.0%) |
| $55,000 to $64,999 | 0 (0.0%) | 0 (0.0%) |
| $65,000 to $74,999 | 0 (0.0%) | 0 (0.0%) |
| $75,000 to $99,999 | 0 (0.0%) | 0 (0.0%) |
| $100,000+ | 0 (0.0%) | 0 (0.0%) |
| Total | 37 (100.0%) | 45 (100.0%) |
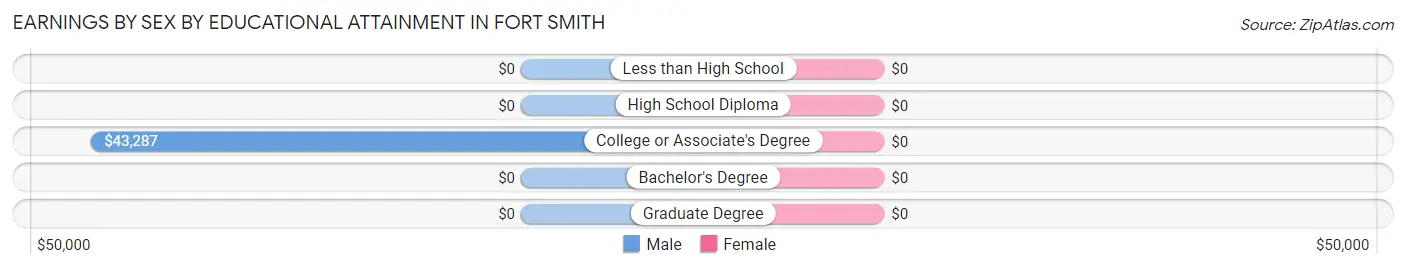
Earnings by Sex by Educational Attainment in Fort Smith
| Educational Attainment | Male Income | Female Income |
| Less than High School | - | - |
| High School Diploma | - | - |
| College or Associate's Degree | $43,287 | $0 |
| Bachelor's Degree | - | - |
| Graduate Degree | - | - |
| Total | $43,287 | $32,554 |
Family Income in Fort Smith
Family Income Brackets in Fort Smith
According to the Fort Smith family income data, there are 25 families falling into the $50,000 to $74,999 income range, which is the most common income bracket and makes up 100.0% of all families.
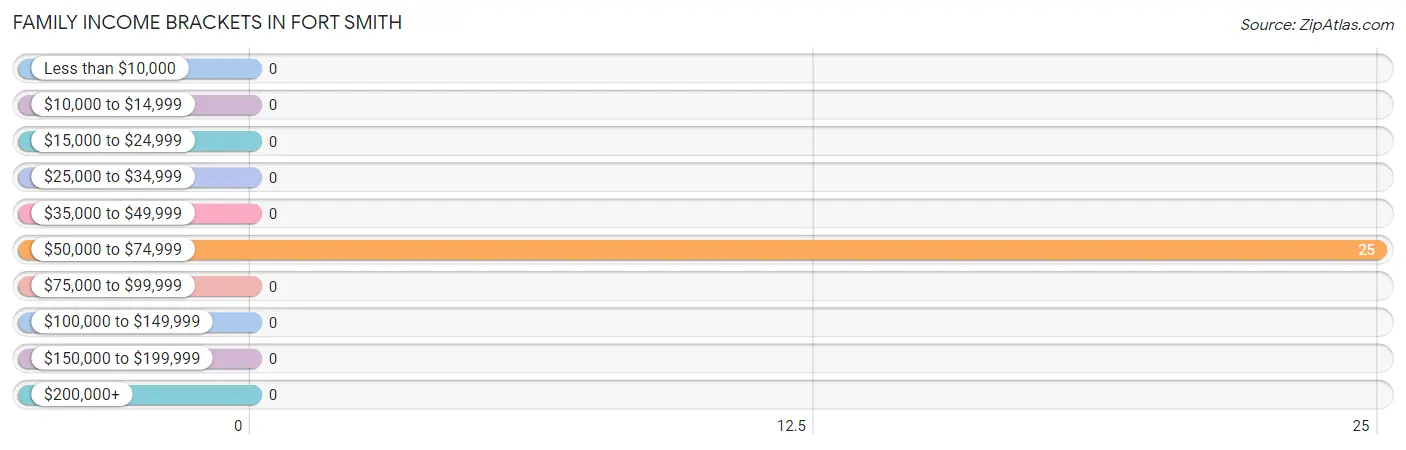
| Income Bracket | # Families | % Families |
| Less than $10,000 | 0 | 0.0% |
| $10,000 to $14,999 | 0 | 0.0% |
| $15,000 to $24,999 | 0 | 0.0% |
| $25,000 to $34,999 | 0 | 0.0% |
| $35,000 to $49,999 | 0 | 0.0% |
| $50,000 to $74,999 | 25 | 100.0% |
| $75,000 to $99,999 | 0 | 0.0% |
| $100,000 to $149,999 | 0 | 0.0% |
| $150,000 to $199,999 | 0 | 0.0% |
| $200,000+ | 0 | 0.0% |
Family Income by Famaliy Size in Fort Smith
2-person families (25 | 100.0%) account for the highest median family income in Fort Smith with $53,920 per family, while 2-person families (25 | 100.0%) have the highest median income of $26,960 per family member.
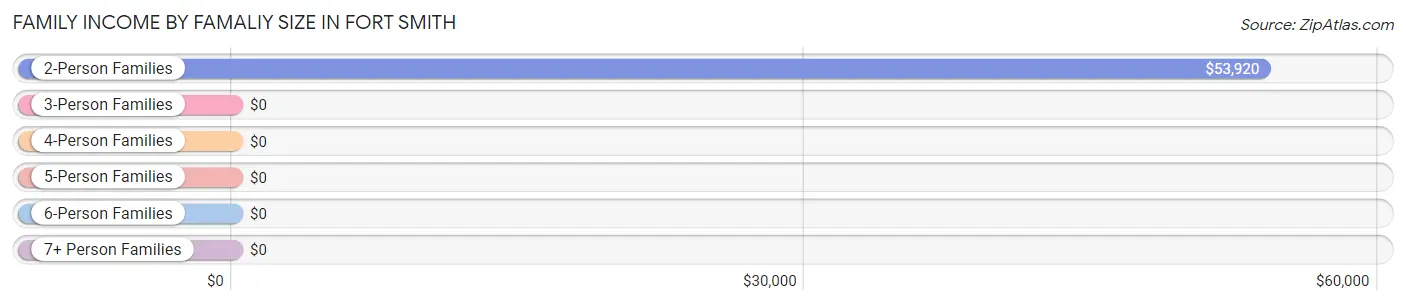
| Income Bracket | # Families | Median Income |
| 2-Person Families | 25 (100.0%) | $53,920 |
| 3-Person Families | 0 (0.0%) | $0 |
| 4-Person Families | 0 (0.0%) | $0 |
| 5-Person Families | 0 (0.0%) | $0 |
| 6-Person Families | 0 (0.0%) | $0 |
| 7+ Person Families | 0 (0.0%) | $0 |
| Total | 25 (100.0%) | $53,920 |
Family Income by Number of Earners in Fort Smith
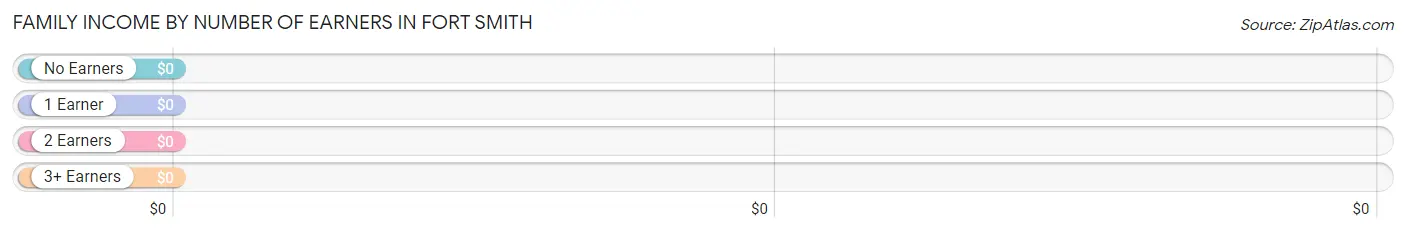
| Number of Earners | # Families | Median Income |
| No Earners | 0 (0.0%) | $0 |
| 1 Earner | 22 (88.0%) | $0 |
| 2 Earners | 3 (12.0%) | $0 |
| 3+ Earners | 0 (0.0%) | $0 |
| Total | 25 (100.0%) | $53,920 |
Household Income in Fort Smith
Household Income Brackets in Fort Smith
With 33 households falling in the category, the $35,000 to $49,999 income range is the most frequent in Fort Smith, accounting for 44.0% of all households.
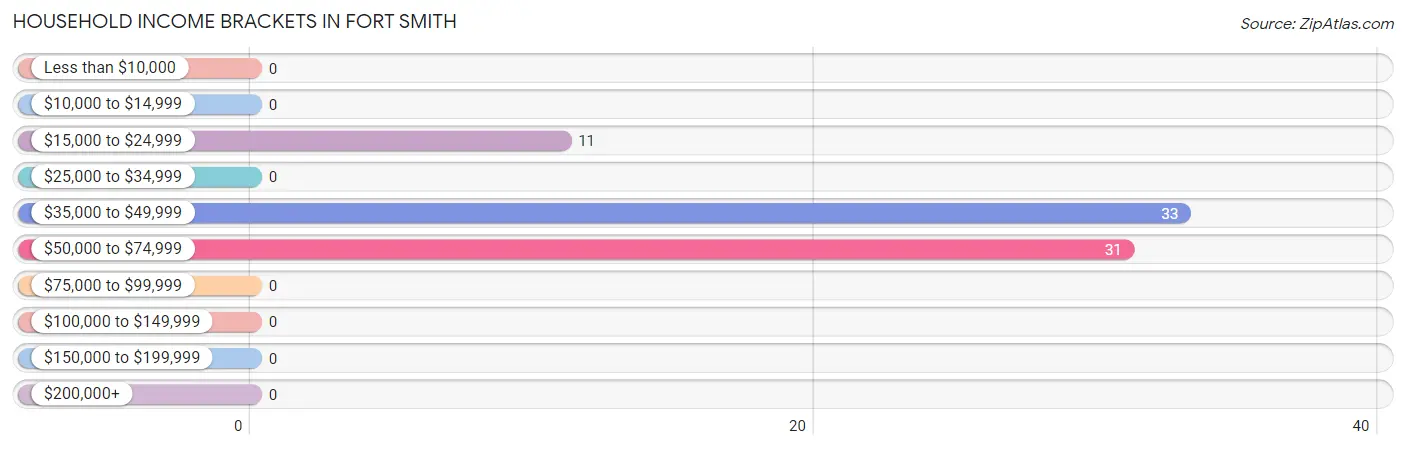
| Income Bracket | # Households | % Households |
| Less than $10,000 | 0 | 0.0% |
| $10,000 to $14,999 | 0 | 0.0% |
| $15,000 to $24,999 | 11 | 14.7% |
| $25,000 to $34,999 | 0 | 0.0% |
| $35,000 to $49,999 | 33 | 44.0% |
| $50,000 to $74,999 | 31 | 41.3% |
| $75,000 to $99,999 | 0 | 0.0% |
| $100,000 to $149,999 | 0 | 0.0% |
| $150,000 to $199,999 | 0 | 0.0% |
| $200,000+ | 0 | 0.0% |
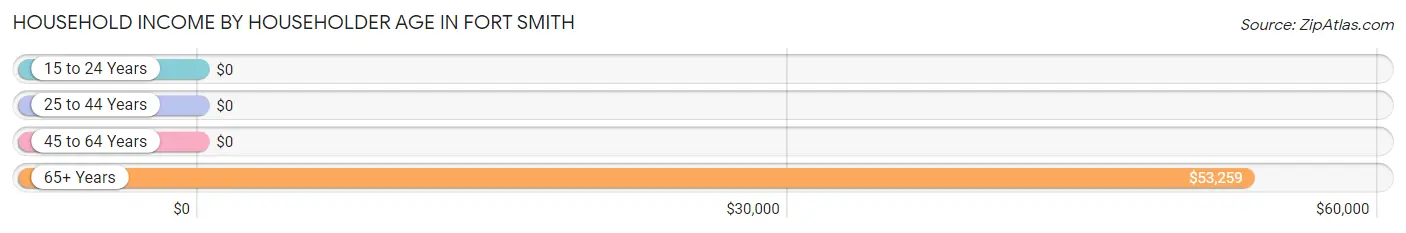
Household Income by Householder Age in Fort Smith
The median household income in Fort Smith is $49,398, with the highest median household income of $53,259 found in the 65+ years age bracket for the primary householder. A total of 39 households (52.0%) fall into this category.
| Income Bracket | # Households | Median Income |
| 15 to 24 Years | 0 (0.0%) | $0 |
| 25 to 44 Years | 27 (36.0%) | $0 |
| 45 to 64 Years | 9 (12.0%) | $0 |
| 65+ Years | 39 (52.0%) | $53,259 |
| Total | 75 (100.0%) | $49,398 |
Poverty in Fort Smith
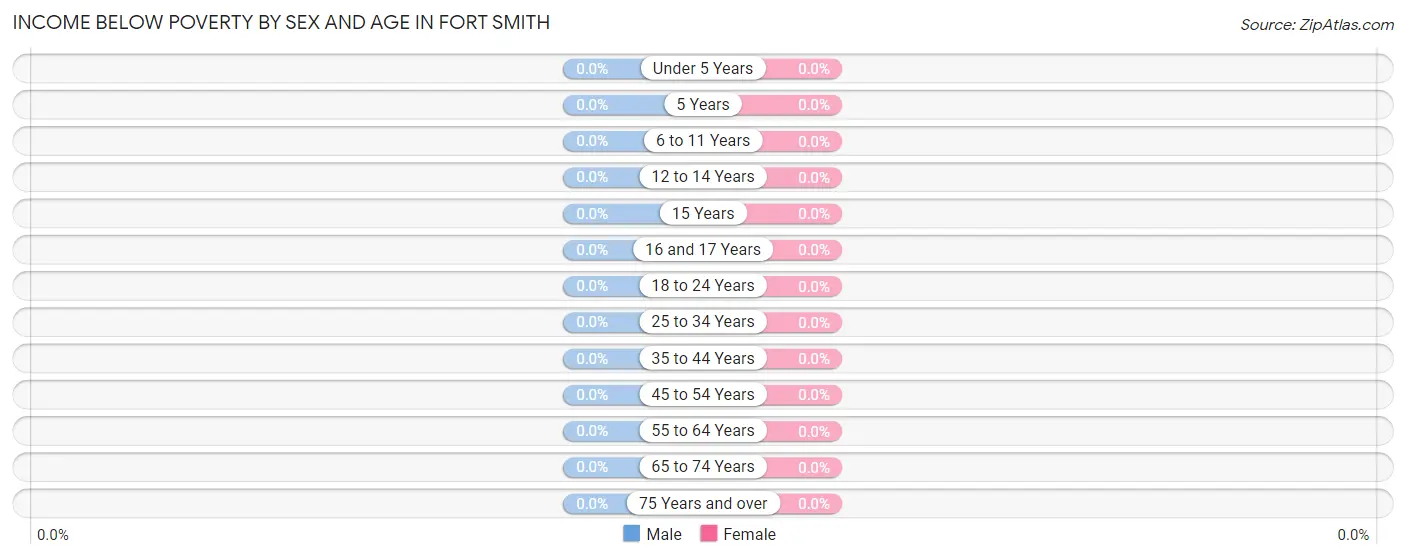
Income Below Poverty by Sex and Age in Fort Smith
| Age Bracket | Male | Female |
| Under 5 Years | 0 (0.0%) | 0 (0.0%) |
| 5 Years | 0 (0.0%) | 0 (0.0%) |
| 6 to 11 Years | 0 (0.0%) | 0 (0.0%) |
| 12 to 14 Years | 0 (0.0%) | 0 (0.0%) |
| 15 Years | 0 (0.0%) | 0 (0.0%) |
| 16 and 17 Years | 0 (0.0%) | 0 (0.0%) |
| 18 to 24 Years | 0 (0.0%) | 0 (0.0%) |
| 25 to 34 Years | 0 (0.0%) | 0 (0.0%) |
| 35 to 44 Years | 0 (0.0%) | 0 (0.0%) |
| 45 to 54 Years | 0 (0.0%) | 0 (0.0%) |
| 55 to 64 Years | 0 (0.0%) | 0 (0.0%) |
| 65 to 74 Years | 0 (0.0%) | 0 (0.0%) |
| 75 Years and over | 0 (0.0%) | 0 (0.0%) |
| Total | 0 (0.0%) | 0 (0.0%) |
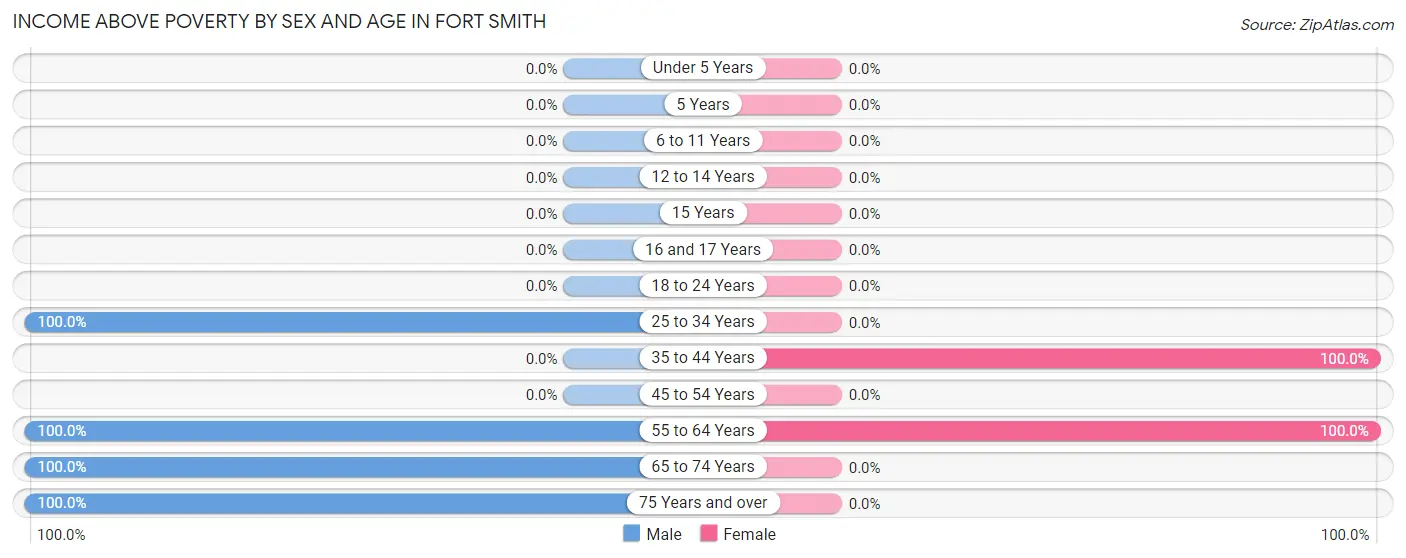
Income Above Poverty by Sex and Age in Fort Smith
According to the poverty statistics in Fort Smith, males aged 25 to 34 years and females aged 35 to 44 years are the age groups that are most secure financially, with 100.0% of males and 100.0% of females in these age groups living above the poverty line.
| Age Bracket | Male | Female |
| Under 5 Years | 0 (0.0%) | 0 (0.0%) |
| 5 Years | 0 (0.0%) | 0 (0.0%) |
| 6 to 11 Years | 0 (0.0%) | 0 (0.0%) |
| 12 to 14 Years | 0 (0.0%) | 0 (0.0%) |
| 15 Years | 0 (0.0%) | 0 (0.0%) |
| 16 and 17 Years | 0 (0.0%) | 0 (0.0%) |
| 18 to 24 Years | 0 (0.0%) | 0 (0.0%) |
| 25 to 34 Years | 27 (100.0%) | 0 (0.0%) |
| 35 to 44 Years | 0 (0.0%) | 20 (100.0%) |
| 45 to 54 Years | 0 (0.0%) | 0 (0.0%) |
| 55 to 64 Years | 4 (100.0%) | 25 (100.0%) |
| 65 to 74 Years | 6 (100.0%) | 0 (0.0%) |
| 75 Years and over | 33 (100.0%) | 0 (0.0%) |
| Total | 70 (100.0%) | 45 (100.0%) |
Income Below Poverty Among Married-Couple Families in Fort Smith
| Children | Above Poverty | Below Poverty |
| No Children | 3 (100.0%) | 0 (0.0%) |
| 1 or 2 Children | 0 (0.0%) | 0 (0.0%) |
| 3 or 4 Children | 0 (0.0%) | 0 (0.0%) |
| 5 or more Children | 0 (0.0%) | 0 (0.0%) |
| Total | 3 (100.0%) | 0 (0.0%) |
Income Below Poverty Among Single-Parent Households in Fort Smith
| Children | Single Father | Single Mother |
| No Children | 0 (0.0%) | 0 (0.0%) |
| 1 or 2 Children | 0 (0.0%) | 0 (0.0%) |
| 3 or 4 Children | 0 (0.0%) | 0 (0.0%) |
| 5 or more Children | 0 (0.0%) | 0 (0.0%) |
| Total | 0 (0.0%) | 0 (0.0%) |
Income Below Poverty Among Married-Couple vs Single-Parent Households in Fort Smith
| Children | Married-Couple Families | Single-Parent Households |
| No Children | 0 (0.0%) | 0 (0.0%) |
| 1 or 2 Children | 0 (0.0%) | 0 (0.0%) |
| 3 or 4 Children | 0 (0.0%) | 0 (0.0%) |
| 5 or more Children | 0 (0.0%) | 0 (0.0%) |
| Total | 0 (0.0%) | 0 (0.0%) |
Race in Fort Smith
The most populous races in Fort Smith are White / Caucasian (88 | 76.5%), Hispanic or Latino (27 | 23.5%), and Two or more Races (27 | 23.5%).
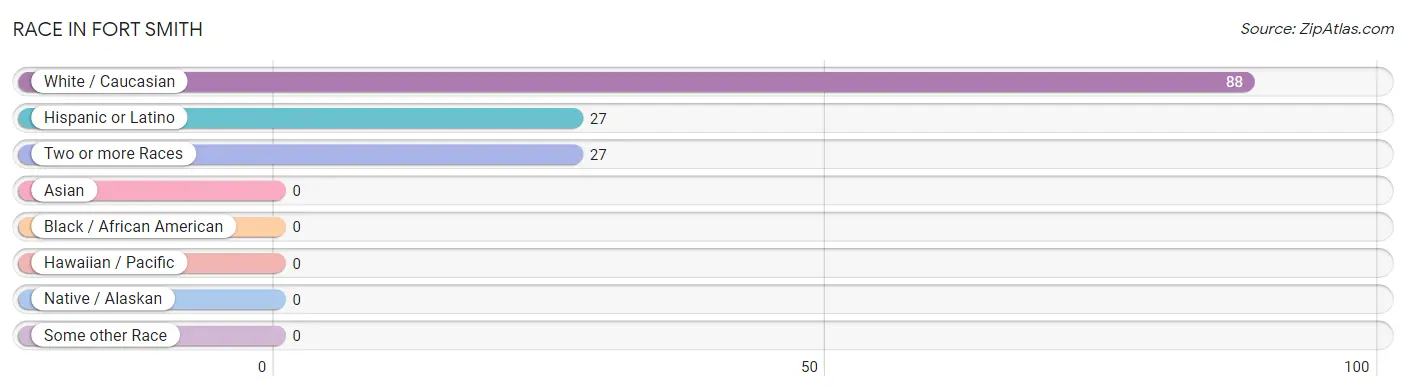
| Race | # Population | % Population |
| Asian | 0 | 0.0% |
| Black / African American | 0 | 0.0% |
| Hawaiian / Pacific | 0 | 0.0% |
| Hispanic or Latino | 27 | 23.5% |
| Native / Alaskan | 0 | 0.0% |
| White / Caucasian | 88 | 76.5% |
| Two or more Races | 27 | 23.5% |
| Some other Race | 0 | 0.0% |
| Total | 115 | 100.0% |
Ancestry in Fort Smith
The most populous ancestries reported in Fort Smith are Dutch (44 | 38.3%), German (36 | 31.3%), Spaniard (27 | 23.5%), Polish (22 | 19.1%), and Irish (16 | 13.9%), together accounting for 126.1% of all Fort Smith residents.
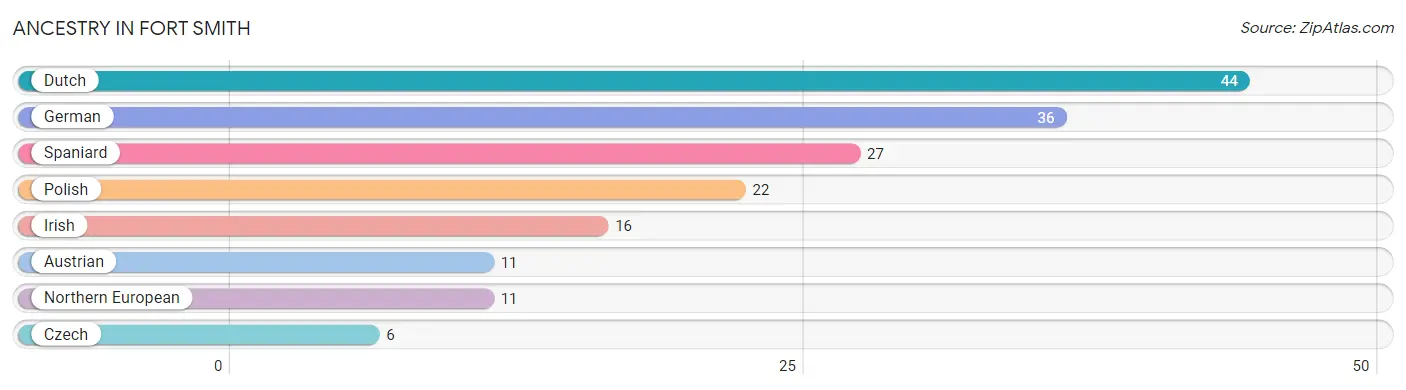
| Ancestry | # Population | % Population |
| Austrian | 11 | 9.6% |
| Czech | 6 | 5.2% |
| Dutch | 44 | 38.3% |
| German | 36 | 31.3% |
| Irish | 16 | 13.9% |
| Northern European | 11 | 9.6% |
| Polish | 22 | 19.1% |
| Spaniard | 27 | 23.5% | View All 8 Rows |
Immigrants in Fort Smith

| Immigration Origin | # Population | % Population | View All 0 Rows |
Sex and Age in Fort Smith
Sex and Age in Fort Smith
The most populous age groups in Fort Smith are 30 to 34 Years (27 | 38.6%) for men and 40 to 44 Years (20 | 44.4%) for women.
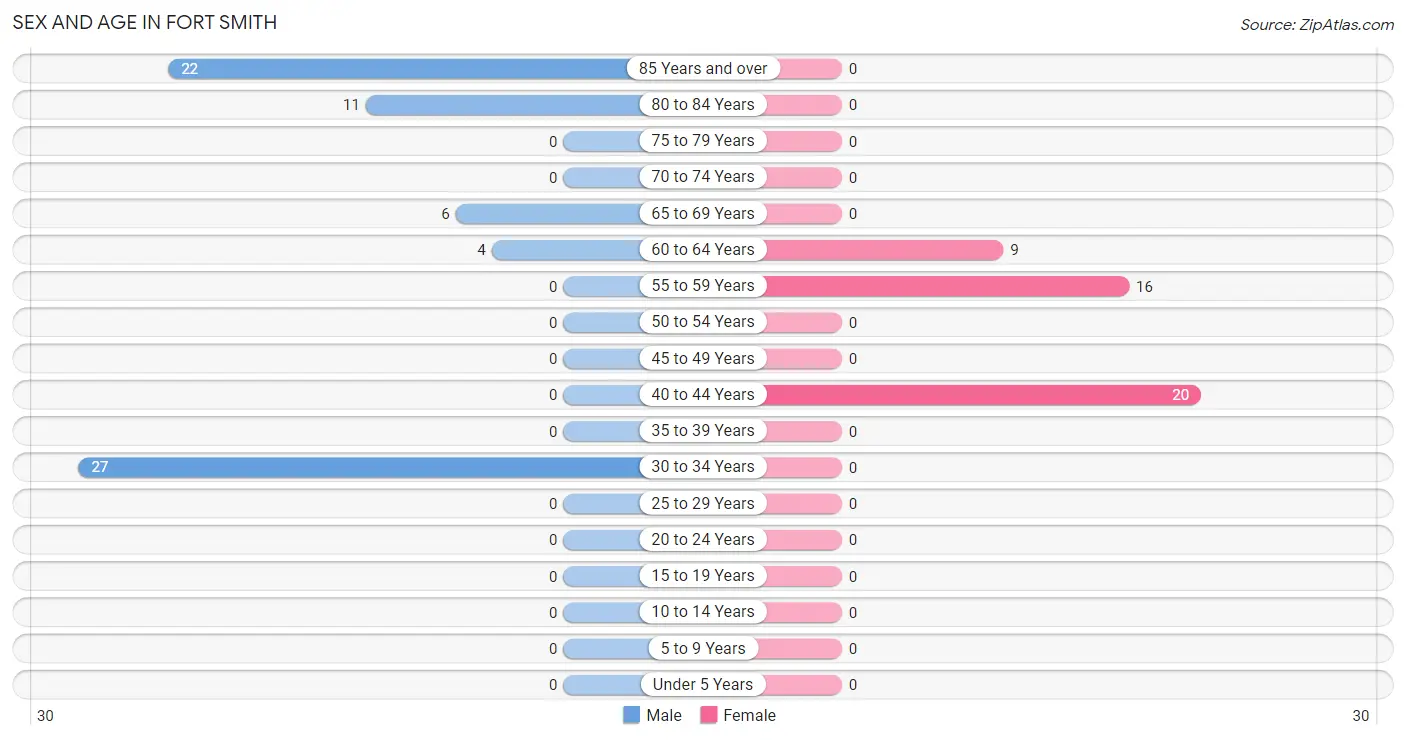
| Age Bracket | Male | Female |
| Under 5 Years | 0 (0.0%) | 0 (0.0%) |
| 5 to 9 Years | 0 (0.0%) | 0 (0.0%) |
| 10 to 14 Years | 0 (0.0%) | 0 (0.0%) |
| 15 to 19 Years | 0 (0.0%) | 0 (0.0%) |
| 20 to 24 Years | 0 (0.0%) | 0 (0.0%) |
| 25 to 29 Years | 0 (0.0%) | 0 (0.0%) |
| 30 to 34 Years | 27 (38.6%) | 0 (0.0%) |
| 35 to 39 Years | 0 (0.0%) | 0 (0.0%) |
| 40 to 44 Years | 0 (0.0%) | 20 (44.4%) |
| 45 to 49 Years | 0 (0.0%) | 0 (0.0%) |
| 50 to 54 Years | 0 (0.0%) | 0 (0.0%) |
| 55 to 59 Years | 0 (0.0%) | 16 (35.6%) |
| 60 to 64 Years | 4 (5.7%) | 9 (20.0%) |
| 65 to 69 Years | 6 (8.6%) | 0 (0.0%) |
| 70 to 74 Years | 0 (0.0%) | 0 (0.0%) |
| 75 to 79 Years | 0 (0.0%) | 0 (0.0%) |
| 80 to 84 Years | 11 (15.7%) | 0 (0.0%) |
| 85 Years and over | 22 (31.4%) | 0 (0.0%) |
| Total | 70 (100.0%) | 45 (100.0%) |
Families and Households in Fort Smith
Median Family Size in Fort Smith
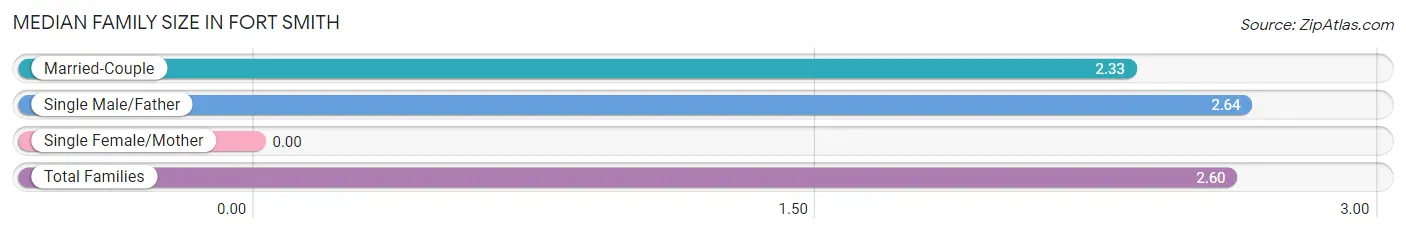
| Family Type | # Families | Family Size |
| Married-Couple | 3 (12.0%) | 2.33 |
| Single Male/Father | 22 (88.0%) | 2.64 |
| Single Female/Mother | 0 (0.0%) | - |
| Total Families | 25 (100.0%) | 2.60 |
Median Household Size in Fort Smith
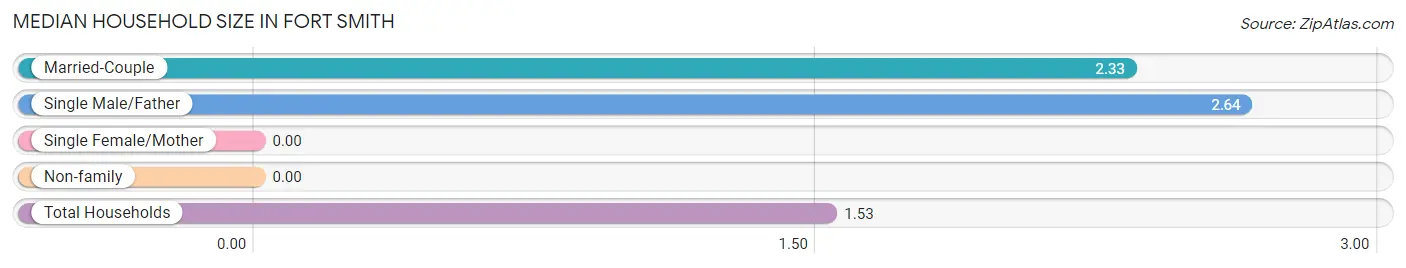
| Household Type | # Households | Household Size |
| Married-Couple | 3 (4.0%) | 2.33 |
| Single Male/Father | 22 (29.3%) | 2.64 |
| Single Female/Mother | 0 (0.0%) | - |
| Non-family | 50 (66.7%) | - |
| Total Households | 75 (100.0%) | 1.53 |
Household Size by Marriage Status in Fort Smith
Out of a total of 75 households in Fort Smith, 25 (33.3%) are family households, while 50 (66.7%) are nonfamily households. The most numerous type of family households are 2-person households, comprising 25, and the most common type of nonfamily households are 1-person households, comprising 50.
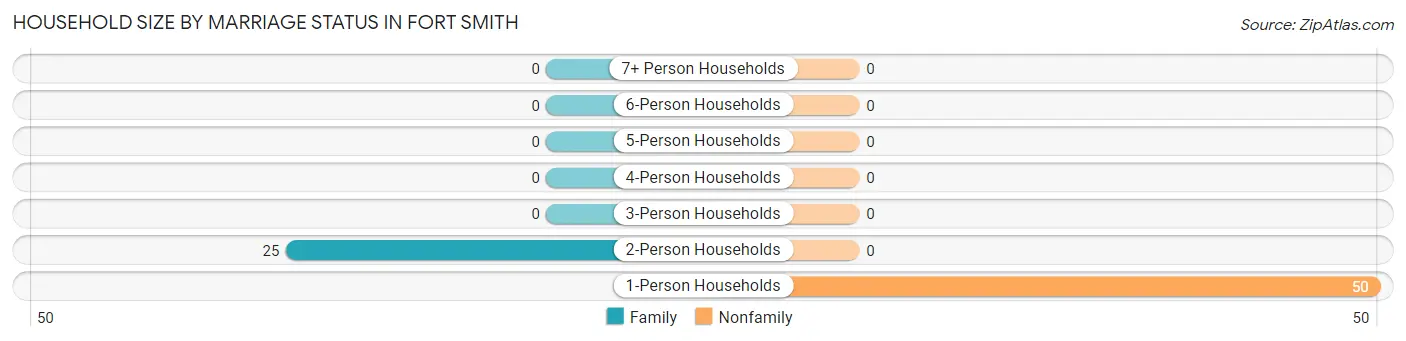
| Household Size | Family Households | Nonfamily Households |
| 1-Person Households | - | 50 (66.7%) |
| 2-Person Households | 25 (33.3%) | 0 (0.0%) |
| 3-Person Households | 0 (0.0%) | 0 (0.0%) |
| 4-Person Households | 0 (0.0%) | 0 (0.0%) |
| 5-Person Households | 0 (0.0%) | 0 (0.0%) |
| 6-Person Households | 0 (0.0%) | 0 (0.0%) |
| 7+ Person Households | 0 (0.0%) | 0 (0.0%) |
| Total | 25 (33.3%) | 50 (66.7%) |
Female Fertility in Fort Smith
Fertility by Age in Fort Smith
| Age Bracket | Women with Births | Births / 1,000 Women |
| 15 to 19 years | 0 (0.0%) | 0.0 |
| 20 to 34 years | 0 (0.0%) | 0.0 |
| 35 to 50 years | 0 (0.0%) | 0.0 |
| Total | 0 (0.0%) | 0.0 |
Fertility by Age by Marriage Status in Fort Smith
| Age Bracket | Married | Unmarried |
| 15 to 19 years | 0 (0.0%) | 0 (0.0%) |
| 20 to 34 years | 0 (0.0%) | 0 (0.0%) |
| 35 to 50 years | 0 (0.0%) | 0 (0.0%) |
| Total | 0 (0.0%) | 0 (0.0%) |
Fertility by Education in Fort Smith
| Educational Attainment | Women with Births | Births / 1,000 Women |
| Less than High School | 0 (0.0%) | 0.0 |
| High School Diploma | 0 (0.0%) | 0.0 |
| College or Associate's Degree | 0 (0.0%) | 0.0 |
| Bachelor's Degree | 0 (0.0%) | 0.0 |
| Graduate Degree | 0 (0.0%) | 0.0 |
| Total | 0 (0.0%) | 0.0 |
Fertility by Education by Marriage Status in Fort Smith
| Educational Attainment | Married | Unmarried |
| Less than High School | 0 (0.0%) | 0 (0.0%) |
| High School Diploma | 0 (0.0%) | 0 (0.0%) |
| College or Associate's Degree | 0 (0.0%) | 0 (0.0%) |
| Bachelor's Degree | 0 (0.0%) | 0 (0.0%) |
| Graduate Degree | 0 (0.0%) | 0 (0.0%) |
| Total | 0 (0.0%) | 0 (0.0%) |
Employment Characteristics in Fort Smith
Employment by Class of Employer in Fort Smith
Among the 49 employed individuals in Fort Smith, local government employees (36 | 73.5%), self-employed (not incorporated) (7 | 14.3%), and private company employees (6 | 12.2%) make up the most common classes of employment.
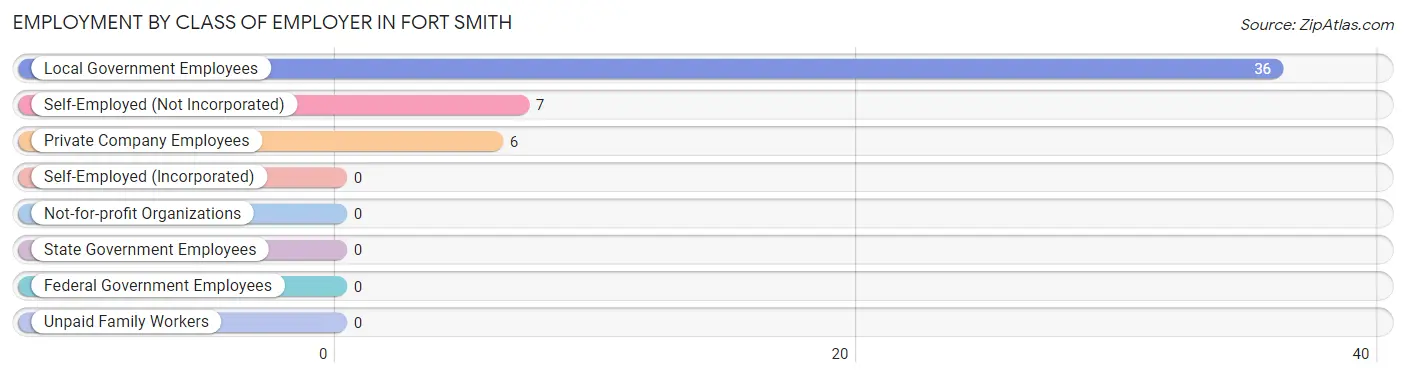
| Employer Class | # Employees | % Employees |
| Private Company Employees | 6 | 12.2% |
| Self-Employed (Incorporated) | 0 | 0.0% |
| Self-Employed (Not Incorporated) | 7 | 14.3% |
| Not-for-profit Organizations | 0 | 0.0% |
| Local Government Employees | 36 | 73.5% |
| State Government Employees | 0 | 0.0% |
| Federal Government Employees | 0 | 0.0% |
| Unpaid Family Workers | 0 | 0.0% |
| Total | 49 | 100.0% |
Employment Status by Age in Fort Smith
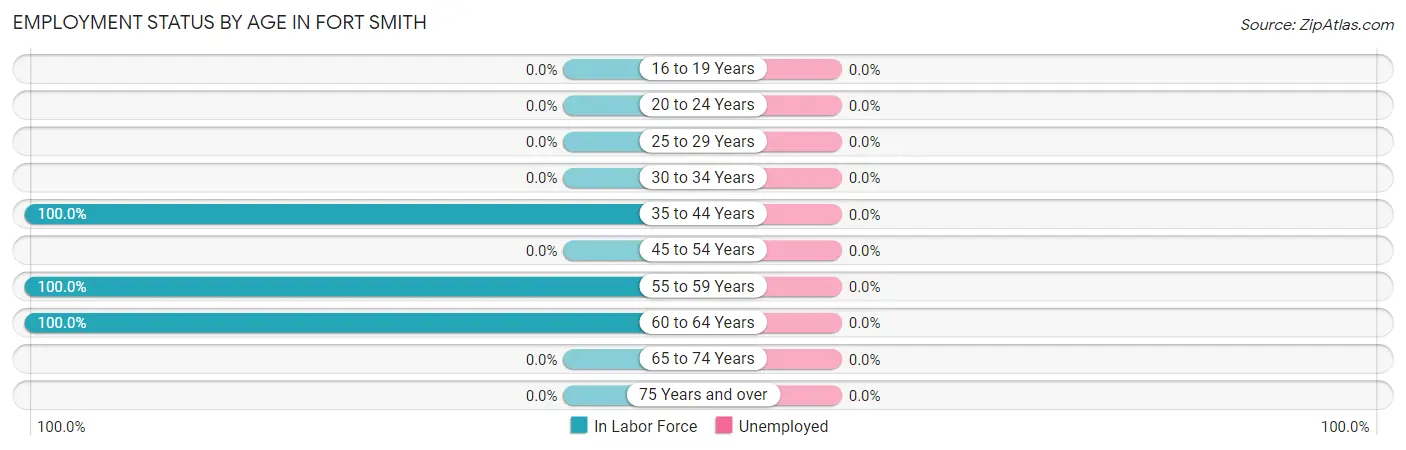
| Age Bracket | In Labor Force | Unemployed |
| 16 to 19 Years | 0 (0.0%) | 0 (0.0%) |
| 20 to 24 Years | 0 (0.0%) | 0 (0.0%) |
| 25 to 29 Years | 0 (0.0%) | 0 (0.0%) |
| 30 to 34 Years | 0 (0.0%) | 0 (0.0%) |
| 35 to 44 Years | 20 (100.0%) | 0 (0.0%) |
| 45 to 54 Years | 0 (0.0%) | 0 (0.0%) |
| 55 to 59 Years | 16 (100.0%) | 0 (0.0%) |
| 60 to 64 Years | 13 (100.0%) | 0 (0.0%) |
| 65 to 74 Years | 0 (0.0%) | 0 (0.0%) |
| 75 Years and over | 0 (0.0%) | 0 (0.0%) |
| Total | 49 (42.6%) | 0 (0.0%) |
Employment Status by Educational Attainment in Fort Smith
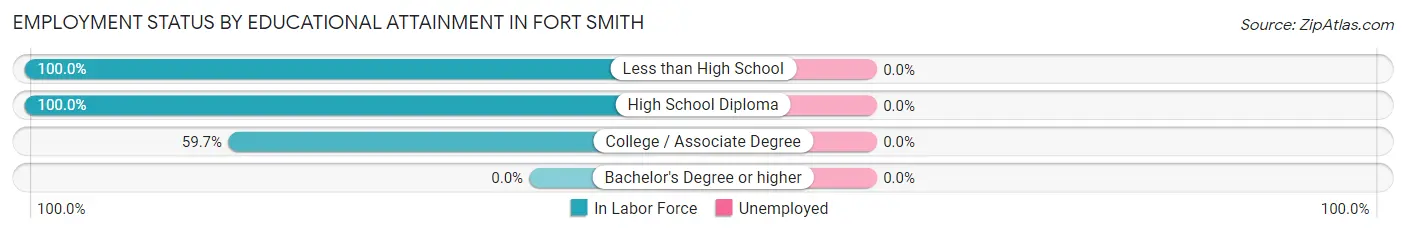
| Educational Attainment | In Labor Force | Unemployed |
| Less than High School | 3 (100.0%) | 0 (0.0%) |
| High School Diploma | 6 (100.0%) | 0 (0.0%) |
| College / Associate Degree | 40 (59.7%) | 0 (0.0%) |
| Bachelor's Degree or higher | 0 (0.0%) | 0 (0.0%) |
| Total | 49 (64.5%) | 0 (0.0%) |
Employment Occupations by Sex in Fort Smith
Management, Business, Science and Arts Occupations
The most common Management, Business, Science and Arts occupations in Fort Smith are , and Management (7 | 14.3%).
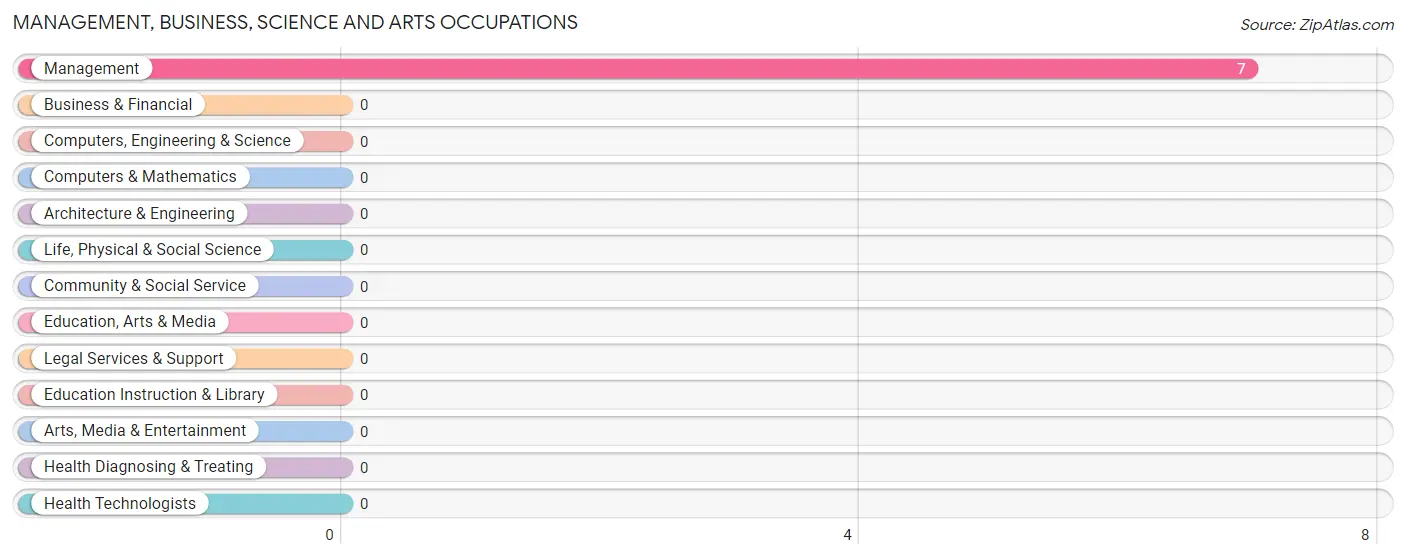
Management, Business, Science and Arts Occupations by Sex
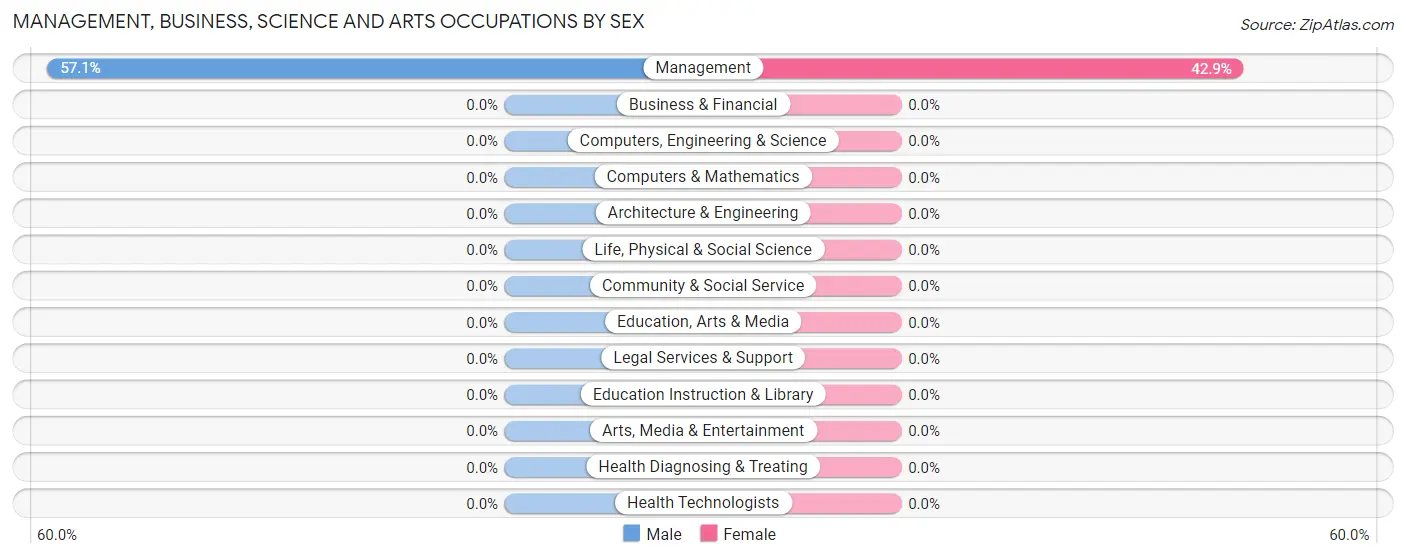
| Occupation | Male | Female |
| Management | 4 (57.1%) | 3 (42.9%) |
| Business & Financial | 0 (0.0%) | 0 (0.0%) |
| Computers, Engineering & Science | 0 (0.0%) | 0 (0.0%) |
| Computers & Mathematics | 0 (0.0%) | 0 (0.0%) |
| Architecture & Engineering | 0 (0.0%) | 0 (0.0%) |
| Life, Physical & Social Science | 0 (0.0%) | 0 (0.0%) |
| Community & Social Service | 0 (0.0%) | 0 (0.0%) |
| Education, Arts & Media | 0 (0.0%) | 0 (0.0%) |
| Legal Services & Support | 0 (0.0%) | 0 (0.0%) |
| Education Instruction & Library | 0 (0.0%) | 0 (0.0%) |
| Arts, Media & Entertainment | 0 (0.0%) | 0 (0.0%) |
| Health Diagnosing & Treating | 0 (0.0%) | 0 (0.0%) |
| Health Technologists | 0 (0.0%) | 0 (0.0%) |
| Total (Category) | 4 (57.1%) | 3 (42.9%) |
| Total (Overall) | 4 (8.2%) | 45 (91.8%) |
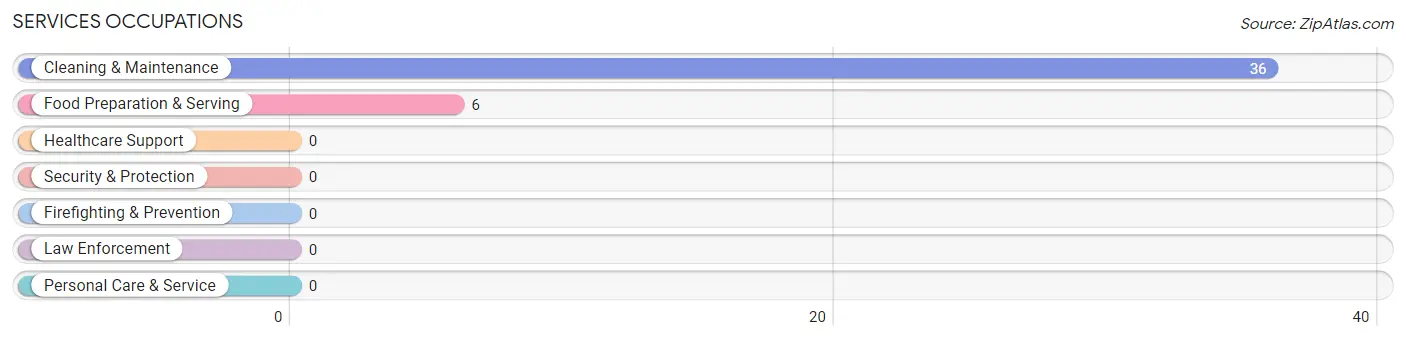
Services Occupations
The most common Services occupations in Fort Smith are Cleaning & Maintenance (36 | 73.5%), and Food Preparation & Serving (6 | 12.2%).
Services Occupations by Sex
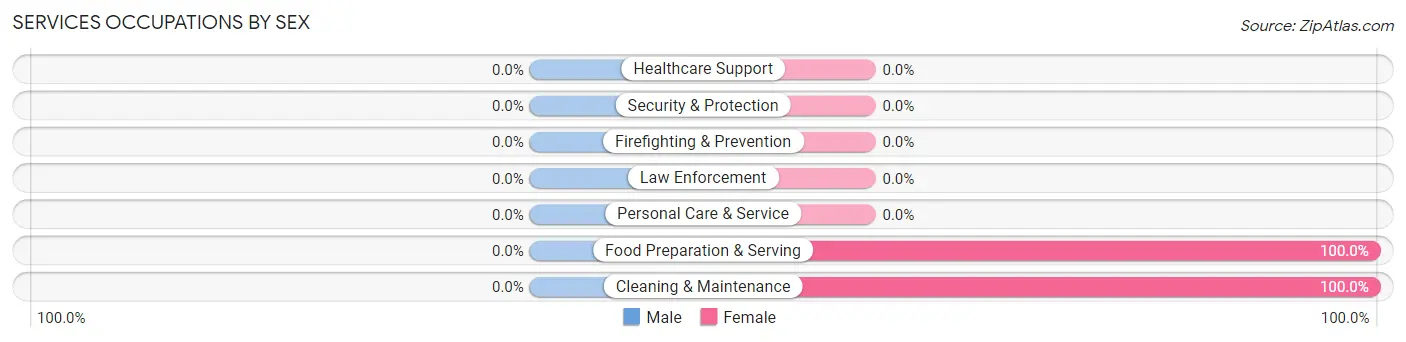
| Occupation | Male | Female |
| Healthcare Support | 0 (0.0%) | 0 (0.0%) |
| Security & Protection | 0 (0.0%) | 0 (0.0%) |
| Firefighting & Prevention | 0 (0.0%) | 0 (0.0%) |
| Law Enforcement | 0 (0.0%) | 0 (0.0%) |
| Food Preparation & Serving | 0 (0.0%) | 6 (100.0%) |
| Cleaning & Maintenance | 0 (0.0%) | 36 (100.0%) |
| Personal Care & Service | 0 (0.0%) | 0 (0.0%) |
| Total (Category) | 0 (0.0%) | 42 (100.0%) |
| Total (Overall) | 4 (8.2%) | 45 (91.8%) |
Sales and Office Occupations
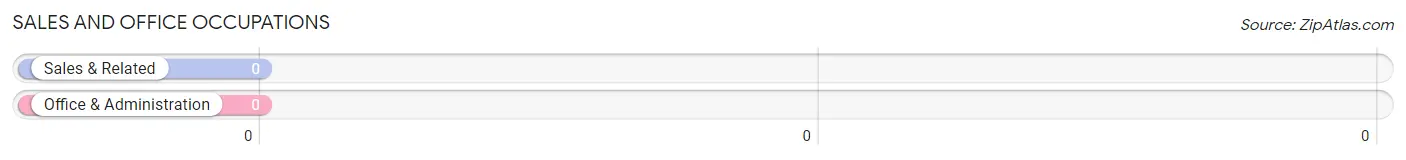
Sales and Office Occupations by Sex
| Occupation | Male | Female |
| Sales & Related | 0 (0.0%) | 0 (0.0%) |
| Office & Administration | 0 (0.0%) | 0 (0.0%) |
| Total (Category) | 0 (0.0%) | 0 (0.0%) |
| Total (Overall) | 4 (8.2%) | 45 (91.8%) |
Natural Resources, Construction and Maintenance Occupations
Natural Resources, Construction and Maintenance Occupations by Sex
| Occupation | Male | Female |
| Farming, Fishing & Forestry | 0 (0.0%) | 0 (0.0%) |
| Construction & Extraction | 0 (0.0%) | 0 (0.0%) |
| Installation, Maintenance & Repair | 0 (0.0%) | 0 (0.0%) |
| Total (Category) | 0 (0.0%) | 0 (0.0%) |
| Total (Overall) | 4 (8.2%) | 45 (91.8%) |
Production, Transportation and Moving Occupations
Production, Transportation and Moving Occupations by Sex
| Occupation | Male | Female |
| Production | 0 (0.0%) | 0 (0.0%) |
| Transportation | 0 (0.0%) | 0 (0.0%) |
| Material Moving | 0 (0.0%) | 0 (0.0%) |
| Total (Category) | 0 (0.0%) | 0 (0.0%) |
| Total (Overall) | 4 (8.2%) | 45 (91.8%) |
Employment Industries by Sex in Fort Smith
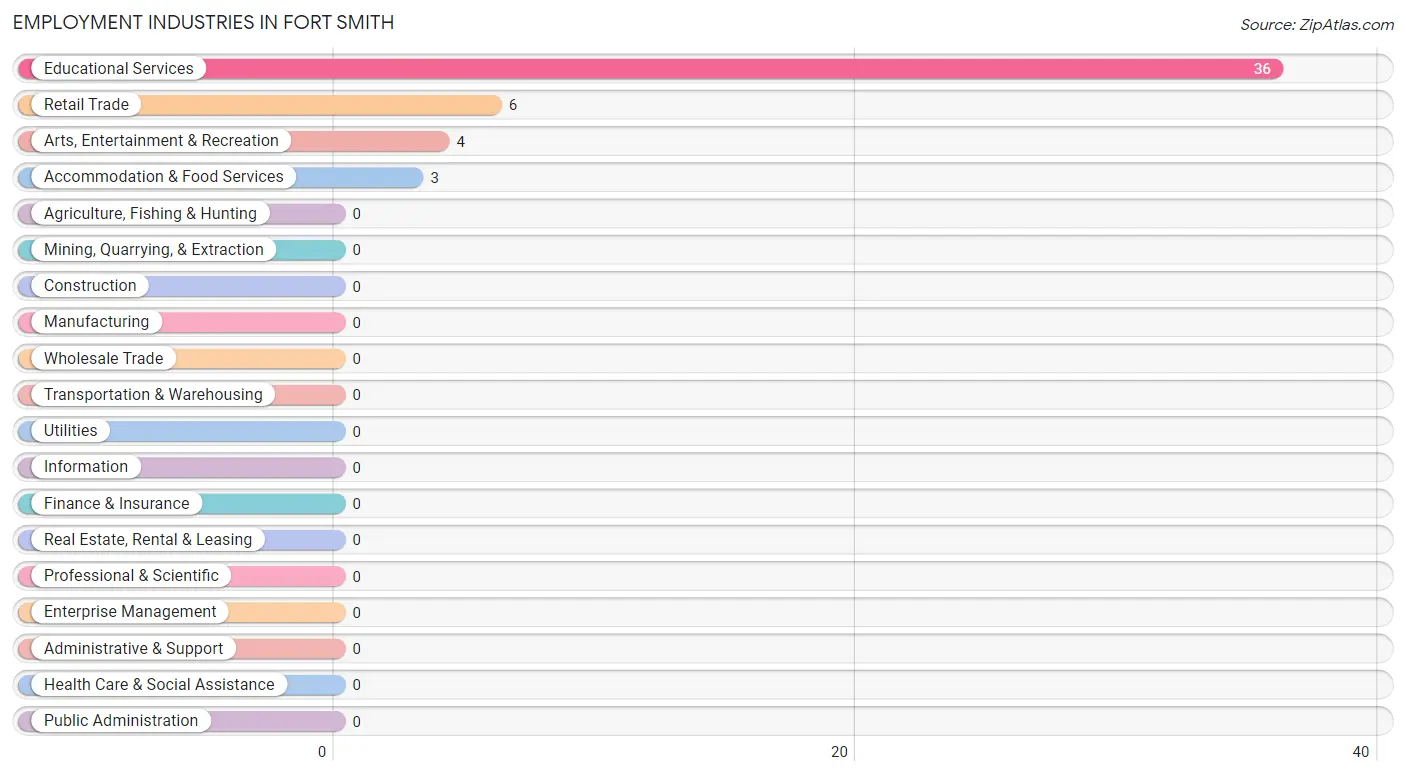
Employment Industries in Fort Smith
The major employment industries in Fort Smith include Educational Services (36 | 73.5%), Retail Trade (6 | 12.2%), Arts, Entertainment & Recreation (4 | 8.2%), and Accommodation & Food Services (3 | 6.1%).
Employment Industries by Sex in Fort Smith
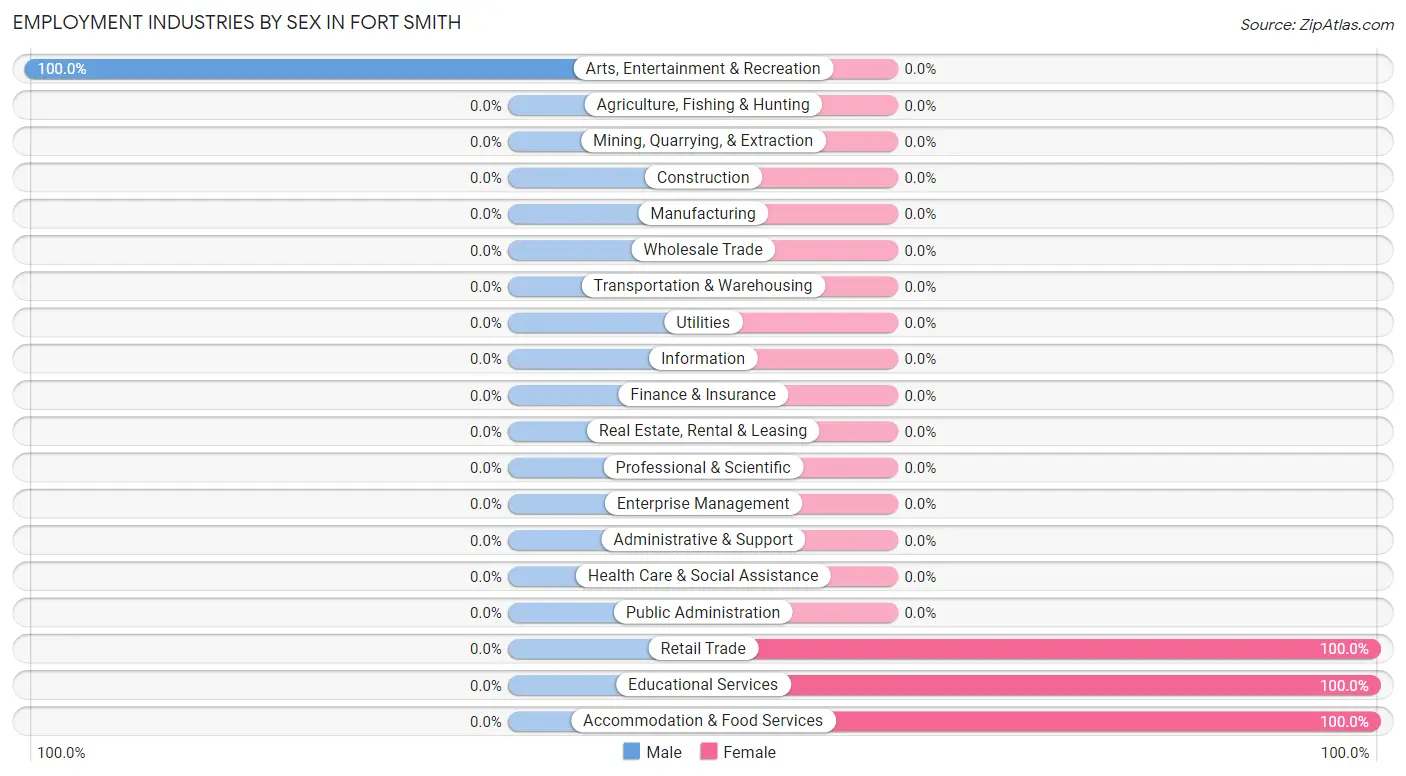
| Industry | Male | Female |
| Agriculture, Fishing & Hunting | 0 (0.0%) | 0 (0.0%) |
| Mining, Quarrying, & Extraction | 0 (0.0%) | 0 (0.0%) |
| Construction | 0 (0.0%) | 0 (0.0%) |
| Manufacturing | 0 (0.0%) | 0 (0.0%) |
| Wholesale Trade | 0 (0.0%) | 0 (0.0%) |
| Retail Trade | 0 (0.0%) | 6 (100.0%) |
| Transportation & Warehousing | 0 (0.0%) | 0 (0.0%) |
| Utilities | 0 (0.0%) | 0 (0.0%) |
| Information | 0 (0.0%) | 0 (0.0%) |
| Finance & Insurance | 0 (0.0%) | 0 (0.0%) |
| Real Estate, Rental & Leasing | 0 (0.0%) | 0 (0.0%) |
| Professional & Scientific | 0 (0.0%) | 0 (0.0%) |
| Enterprise Management | 0 (0.0%) | 0 (0.0%) |
| Administrative & Support | 0 (0.0%) | 0 (0.0%) |
| Educational Services | 0 (0.0%) | 36 (100.0%) |
| Health Care & Social Assistance | 0 (0.0%) | 0 (0.0%) |
| Arts, Entertainment & Recreation | 4 (100.0%) | 0 (0.0%) |
| Accommodation & Food Services | 0 (0.0%) | 3 (100.0%) |
| Public Administration | 0 (0.0%) | 0 (0.0%) |
| Total | 4 (8.2%) | 45 (91.8%) |
Education in Fort Smith
School Enrollment in Fort Smith
| School Level | # Students | % Students |
| Nursery / Preschool | 0 | 0.0% |
| Kindergarten | 0 | 0.0% |
| Elementary School | 0 | 0.0% |
| Middle School | 0 | 0.0% |
| High School | 0 | 0.0% |
| College / Undergraduate | 0 | 0.0% |
| Graduate / Professional | 0 | 0.0% |
| Total | 0 | 0.0% |
School Enrollment by Age by Funding Source in Fort Smith
| Age Bracket | Public School | Private School |
| 3 to 4 Year Olds | 0 (0.0%) | 0 (0.0%) |
| 5 to 9 Year Old | 0 (0.0%) | 0 (0.0%) |
| 10 to 14 Year Olds | 0 (0.0%) | 0 (0.0%) |
| 15 to 17 Year Olds | 0 (0.0%) | 0 (0.0%) |
| 18 to 19 Year Olds | 0 (0.0%) | 0 (0.0%) |
| 20 to 24 Year Olds | 0 (0.0%) | 0 (0.0%) |
| 25 to 34 Year Olds | 0 (0.0%) | 0 (0.0%) |
| 35 Years and over | 0 (0.0%) | 0 (0.0%) |
| Total | 0 (0.0%) | 0 (0.0%) |
Educational Attainment by Field of Study in Fort Smith
| Field of Study | # Graduates | % Graduates |
| Computers & Mathematics | 0 | 0.0% |
| Bio, Nature & Agricultural | 0 | 0.0% |
| Physical & Health Sciences | 0 | 0.0% |
| Psychology | 0 | 0.0% |
| Social Sciences | 0 | 0.0% |
| Engineering | 0 | 0.0% |
| Multidisciplinary Studies | 0 | 0.0% |
| Science & Technology | 0 | 0.0% |
| Business | 0 | 0.0% |
| Education | 0 | 0.0% |
| Literature & Languages | 0 | 0.0% |
| Liberal Arts & History | 0 | 0.0% |
| Visual & Performing Arts | 0 | 0.0% |
| Communications | 0 | 0.0% |
| Arts & Humanities | 0 | 0.0% |
| Total | 0 | 0.0% |
Transportation & Commute in Fort Smith
Vehicle Availability by Sex in Fort Smith
The most prevalent vehicle ownership categories in Fort Smith are males with 2 vehicles (4, accounting for 100.0%) and females with 2 vehicles (39, making up 8.9%).
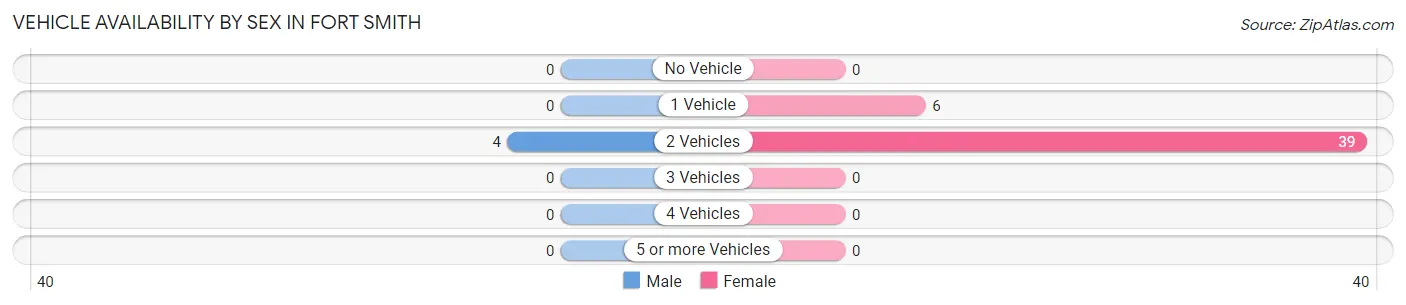
| Vehicles Available | Male | Female |
| No Vehicle | 0 (0.0%) | 0 (0.0%) |
| 1 Vehicle | 0 (0.0%) | 6 (13.3%) |
| 2 Vehicles | 4 (100.0%) | 39 (86.7%) |
| 3 Vehicles | 0 (0.0%) | 0 (0.0%) |
| 4 Vehicles | 0 (0.0%) | 0 (0.0%) |
| 5 or more Vehicles | 0 (0.0%) | 0 (0.0%) |
| Total | 4 (100.0%) | 45 (100.0%) |
Commute Time in Fort Smith
The most frequently occuring commute durations in Fort Smith are less than 5 minutes (29 commuters, 59.2%), 5 to 9 minutes (20 commuters, 40.8%), and 10 to 14 minutes (0 commuters, 0.0%).
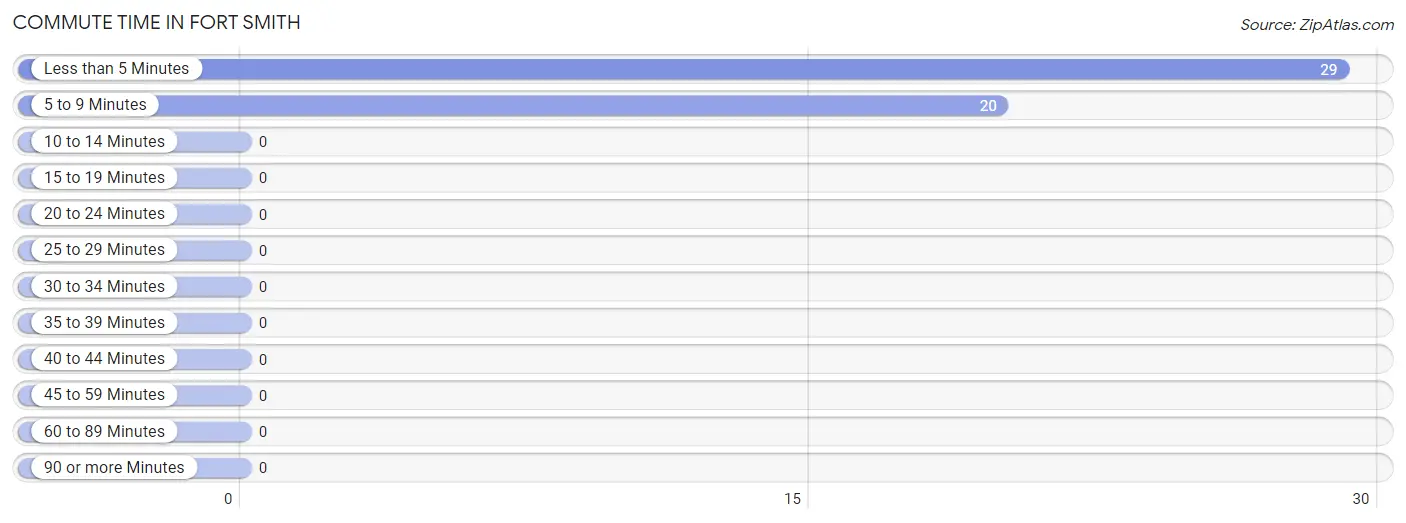
| Commute Time | # Commuters | % Commuters |
| Less than 5 Minutes | 29 | 59.2% |
| 5 to 9 Minutes | 20 | 40.8% |
| 10 to 14 Minutes | 0 | 0.0% |
| 15 to 19 Minutes | 0 | 0.0% |
| 20 to 24 Minutes | 0 | 0.0% |
| 25 to 29 Minutes | 0 | 0.0% |
| 30 to 34 Minutes | 0 | 0.0% |
| 35 to 39 Minutes | 0 | 0.0% |
| 40 to 44 Minutes | 0 | 0.0% |
| 45 to 59 Minutes | 0 | 0.0% |
| 60 to 89 Minutes | 0 | 0.0% |
| 90 or more Minutes | 0 | 0.0% |
Commute Time by Sex in Fort Smith
The most common commute times in Fort Smith are 5 to 9 minutes (4 commuters, 100.0%) for males and less than 5 minutes (29 commuters, 64.4%) for females.
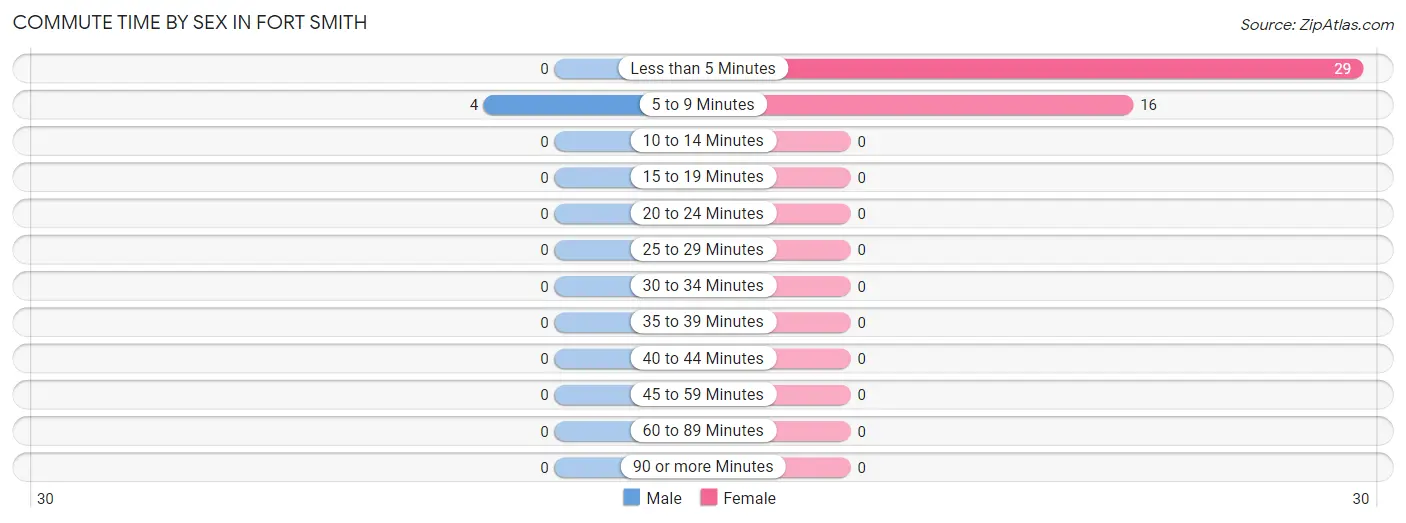
| Commute Time | Male | Female |
| Less than 5 Minutes | 0 (0.0%) | 29 (64.4%) |
| 5 to 9 Minutes | 4 (100.0%) | 16 (35.6%) |
| 10 to 14 Minutes | 0 (0.0%) | 0 (0.0%) |
| 15 to 19 Minutes | 0 (0.0%) | 0 (0.0%) |
| 20 to 24 Minutes | 0 (0.0%) | 0 (0.0%) |
| 25 to 29 Minutes | 0 (0.0%) | 0 (0.0%) |
| 30 to 34 Minutes | 0 (0.0%) | 0 (0.0%) |
| 35 to 39 Minutes | 0 (0.0%) | 0 (0.0%) |
| 40 to 44 Minutes | 0 (0.0%) | 0 (0.0%) |
| 45 to 59 Minutes | 0 (0.0%) | 0 (0.0%) |
| 60 to 89 Minutes | 0 (0.0%) | 0 (0.0%) |
| 90 or more Minutes | 0 (0.0%) | 0 (0.0%) |
Time of Departure to Work by Sex in Fort Smith
The most frequent times of departure to work in Fort Smith are 8:00 AM to 8:29 AM (4, 100.0%) for males and 5:30 AM to 5:59 AM (36, 80.0%) for females.
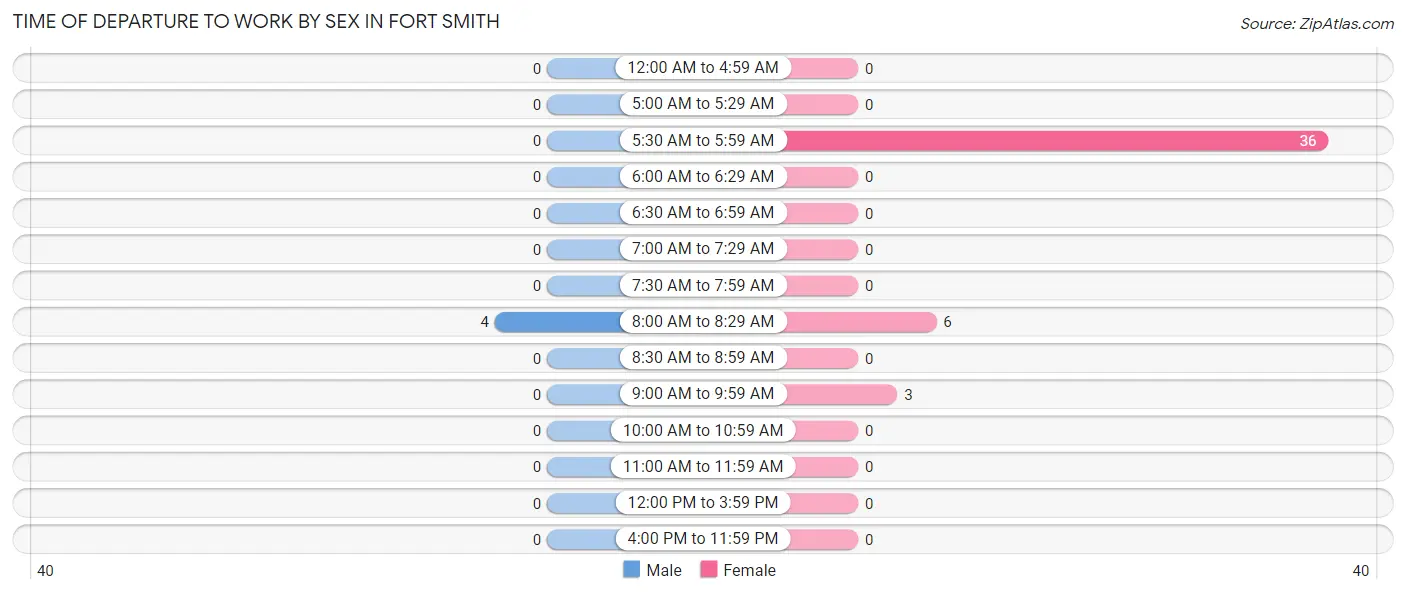
| Time of Departure | Male | Female |
| 12:00 AM to 4:59 AM | 0 (0.0%) | 0 (0.0%) |
| 5:00 AM to 5:29 AM | 0 (0.0%) | 0 (0.0%) |
| 5:30 AM to 5:59 AM | 0 (0.0%) | 36 (80.0%) |
| 6:00 AM to 6:29 AM | 0 (0.0%) | 0 (0.0%) |
| 6:30 AM to 6:59 AM | 0 (0.0%) | 0 (0.0%) |
| 7:00 AM to 7:29 AM | 0 (0.0%) | 0 (0.0%) |
| 7:30 AM to 7:59 AM | 0 (0.0%) | 0 (0.0%) |
| 8:00 AM to 8:29 AM | 4 (100.0%) | 6 (13.3%) |
| 8:30 AM to 8:59 AM | 0 (0.0%) | 0 (0.0%) |
| 9:00 AM to 9:59 AM | 0 (0.0%) | 3 (6.7%) |
| 10:00 AM to 10:59 AM | 0 (0.0%) | 0 (0.0%) |
| 11:00 AM to 11:59 AM | 0 (0.0%) | 0 (0.0%) |
| 12:00 PM to 3:59 PM | 0 (0.0%) | 0 (0.0%) |
| 4:00 PM to 11:59 PM | 0 (0.0%) | 0 (0.0%) |
| Total | 4 (100.0%) | 45 (100.0%) |
Housing Occupancy in Fort Smith
Occupancy by Ownership in Fort Smith
Of the total 75 dwellings in Fort Smith, owner-occupied units account for 69 (92.0%), while renter-occupied units make up 6 (8.0%).
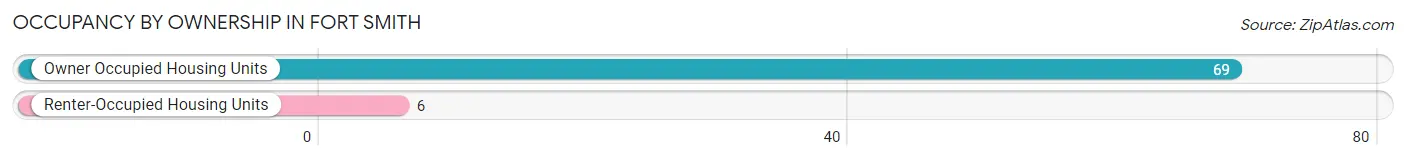
| Occupancy | # Housing Units | % Housing Units |
| Owner Occupied Housing Units | 69 | 92.0% |
| Renter-Occupied Housing Units | 6 | 8.0% |
| Total Occupied Housing Units | 75 | 100.0% |
Occupancy by Household Size in Fort Smith
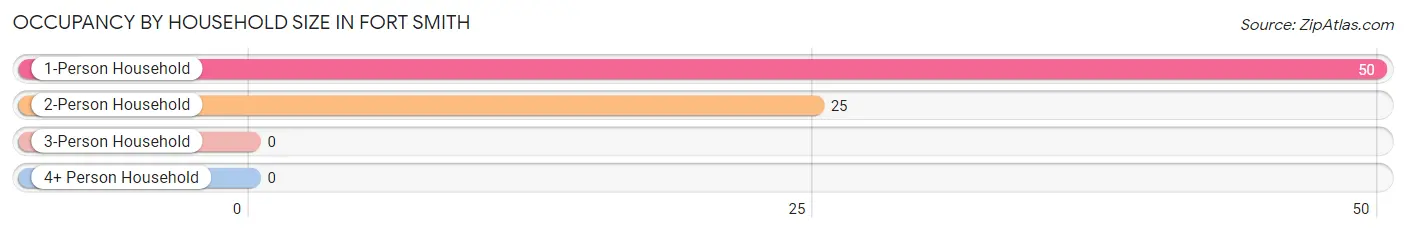
| Household Size | # Housing Units | % Housing Units |
| 1-Person Household | 50 | 66.7% |
| 2-Person Household | 25 | 33.3% |
| 3-Person Household | 0 | 0.0% |
| 4+ Person Household | 0 | 0.0% |
| Total Housing Units | 75 | 100.0% |
Occupancy by Ownership by Household Size in Fort Smith
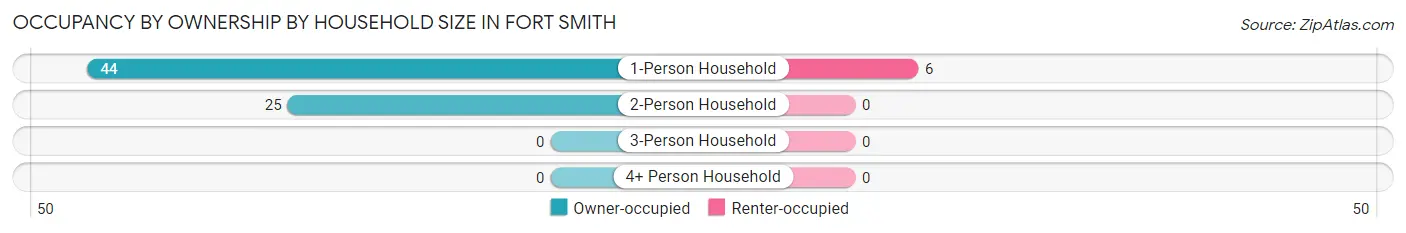
| Household Size | Owner-occupied | Renter-occupied |
| 1-Person Household | 44 (88.0%) | 6 (12.0%) |
| 2-Person Household | 25 (100.0%) | 0 (0.0%) |
| 3-Person Household | 0 (0.0%) | 0 (0.0%) |
| 4+ Person Household | 0 (0.0%) | 0 (0.0%) |
| Total Housing Units | 69 (92.0%) | 6 (8.0%) |
Occupancy by Educational Attainment in Fort Smith
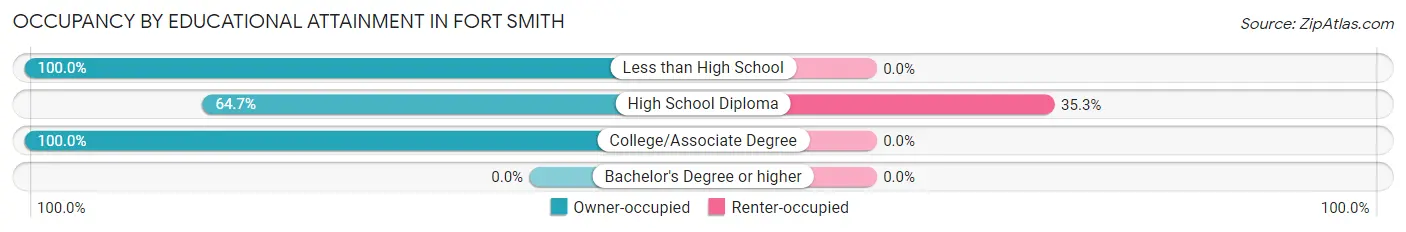
| Household Size | Owner-occupied | Renter-occupied |
| Less than High School | 3 (100.0%) | 0 (0.0%) |
| High School Diploma | 11 (64.7%) | 6 (35.3%) |
| College/Associate Degree | 55 (100.0%) | 0 (0.0%) |
| Bachelor's Degree or higher | 0 (0.0%) | 0 (0.0%) |
Occupancy by Age of Householder in Fort Smith
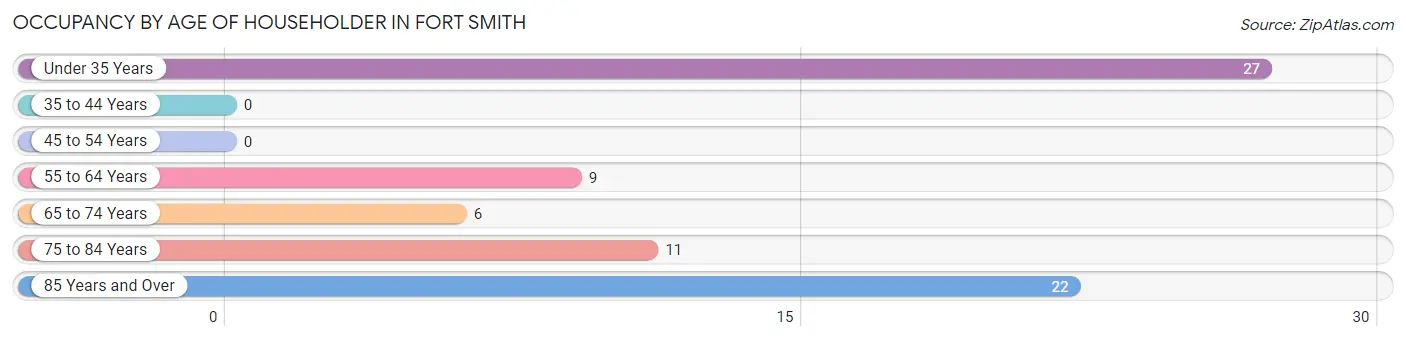
| Age Bracket | # Households | % Households |
| Under 35 Years | 27 | 36.0% |
| 35 to 44 Years | 0 | 0.0% |
| 45 to 54 Years | 0 | 0.0% |
| 55 to 64 Years | 9 | 12.0% |
| 65 to 74 Years | 6 | 8.0% |
| 75 to 84 Years | 11 | 14.7% |
| 85 Years and Over | 22 | 29.3% |
| Total | 75 | 100.0% |
Housing Finances in Fort Smith
Median Income by Occupancy in Fort Smith
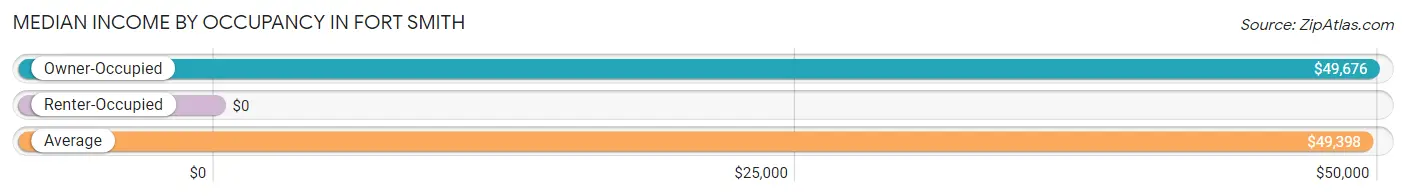
| Occupancy Type | # Households | Median Income |
| Owner-Occupied | 69 (92.0%) | $49,676 |
| Renter-Occupied | 6 (8.0%) | $0 |
| Average | 75 (100.0%) | $49,398 |
Occupancy by Householder Income Bracket in Fort Smith
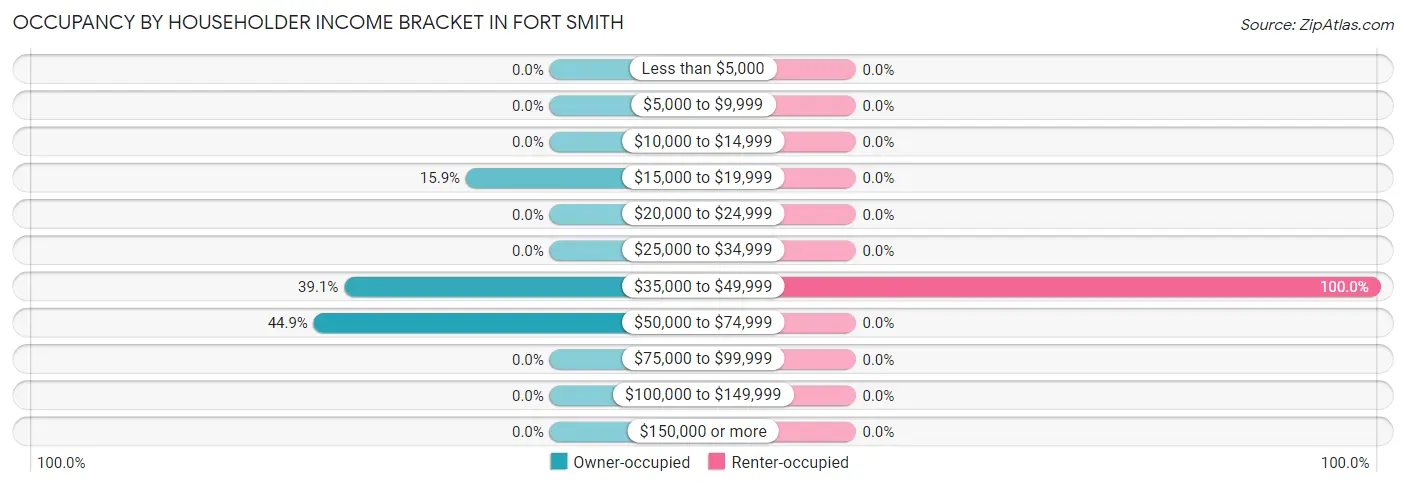
| Income Bracket | Owner-occupied | Renter-occupied |
| Less than $5,000 | 0 (0.0%) | 0 (0.0%) |
| $5,000 to $9,999 | 0 (0.0%) | 0 (0.0%) |
| $10,000 to $14,999 | 0 (0.0%) | 0 (0.0%) |
| $15,000 to $19,999 | 11 (15.9%) | 0 (0.0%) |
| $20,000 to $24,999 | 0 (0.0%) | 0 (0.0%) |
| $25,000 to $34,999 | 0 (0.0%) | 0 (0.0%) |
| $35,000 to $49,999 | 27 (39.1%) | 6 (100.0%) |
| $50,000 to $74,999 | 31 (44.9%) | 0 (0.0%) |
| $75,000 to $99,999 | 0 (0.0%) | 0 (0.0%) |
| $100,000 to $149,999 | 0 (0.0%) | 0 (0.0%) |
| $150,000 or more | 0 (0.0%) | 0 (0.0%) |
| Total | 69 (100.0%) | 6 (100.0%) |
Monthly Housing Cost Tiers in Fort Smith
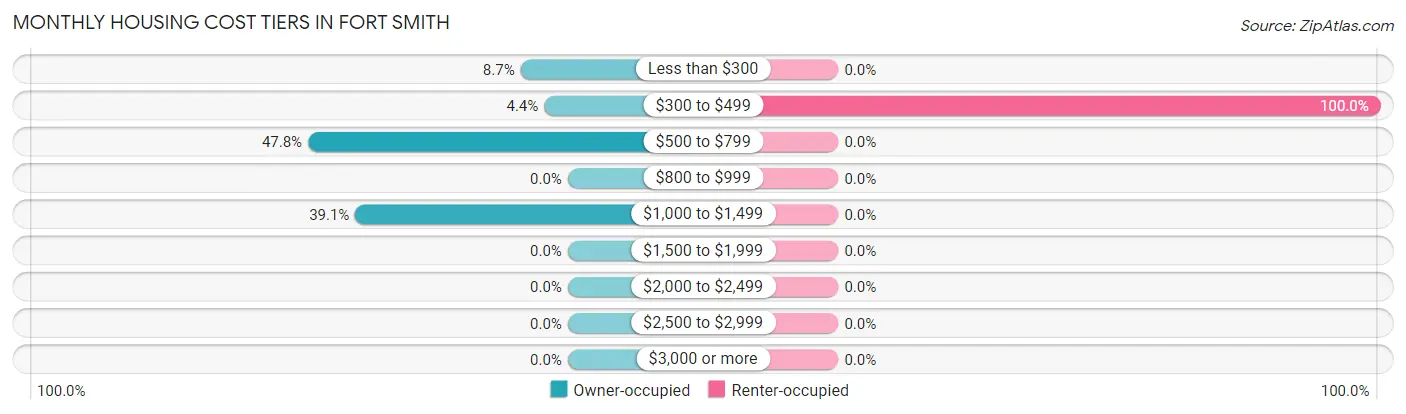
| Monthly Cost | Owner-occupied | Renter-occupied |
| Less than $300 | 6 (8.7%) | 0 (0.0%) |
| $300 to $499 | 3 (4.3%) | 6 (100.0%) |
| $500 to $799 | 33 (47.8%) | 0 (0.0%) |
| $800 to $999 | 0 (0.0%) | 0 (0.0%) |
| $1,000 to $1,499 | 27 (39.1%) | 0 (0.0%) |
| $1,500 to $1,999 | 0 (0.0%) | 0 (0.0%) |
| $2,000 to $2,499 | 0 (0.0%) | 0 (0.0%) |
| $2,500 to $2,999 | 0 (0.0%) | 0 (0.0%) |
| $3,000 or more | 0 (0.0%) | 0 (0.0%) |
| Total | 69 (100.0%) | 6 (100.0%) |
Physical Housing Characteristics in Fort Smith
Housing Structures in Fort Smith
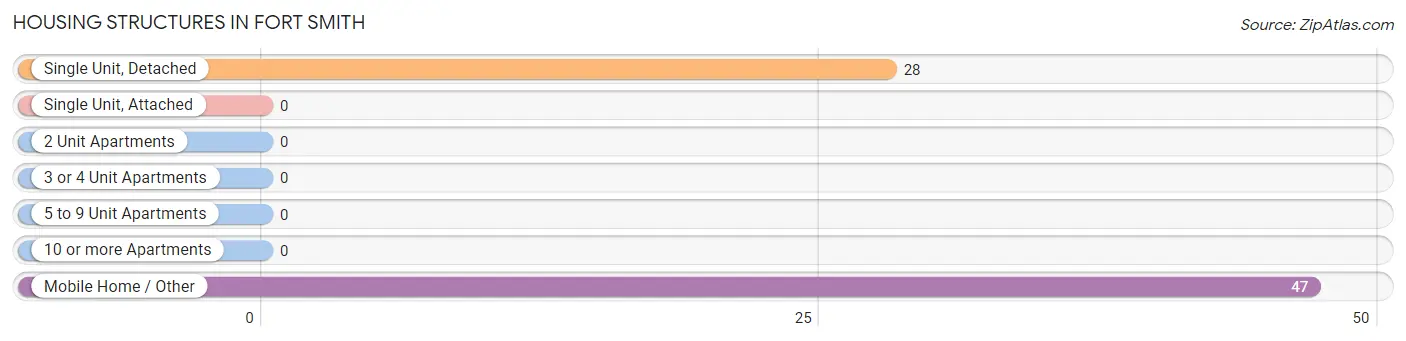
| Structure Type | # Housing Units | % Housing Units |
| Single Unit, Detached | 28 | 37.3% |
| Single Unit, Attached | 0 | 0.0% |
| 2 Unit Apartments | 0 | 0.0% |
| 3 or 4 Unit Apartments | 0 | 0.0% |
| 5 to 9 Unit Apartments | 0 | 0.0% |
| 10 or more Apartments | 0 | 0.0% |
| Mobile Home / Other | 47 | 62.7% |
| Total | 75 | 100.0% |
Housing Structures by Occupancy in Fort Smith
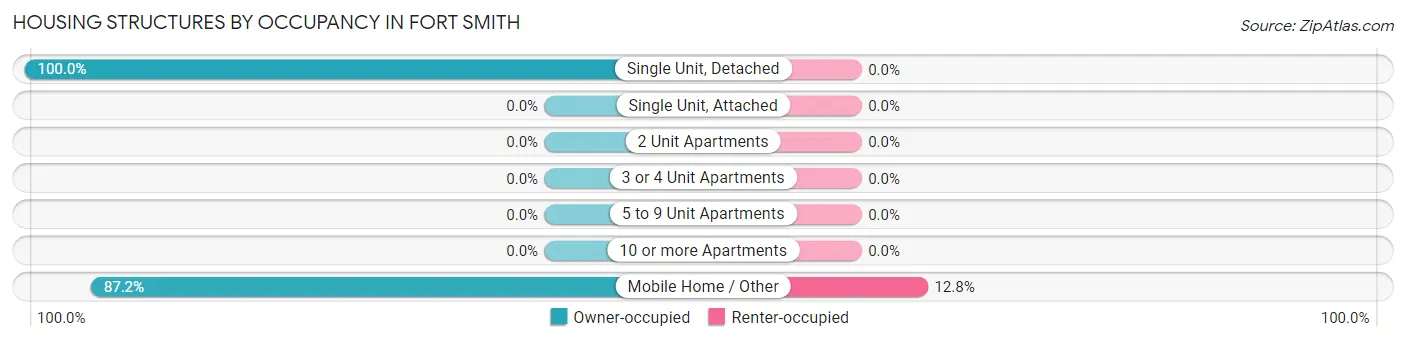
| Structure Type | Owner-occupied | Renter-occupied |
| Single Unit, Detached | 28 (100.0%) | 0 (0.0%) |
| Single Unit, Attached | 0 (0.0%) | 0 (0.0%) |
| 2 Unit Apartments | 0 (0.0%) | 0 (0.0%) |
| 3 or 4 Unit Apartments | 0 (0.0%) | 0 (0.0%) |
| 5 to 9 Unit Apartments | 0 (0.0%) | 0 (0.0%) |
| 10 or more Apartments | 0 (0.0%) | 0 (0.0%) |
| Mobile Home / Other | 41 (87.2%) | 6 (12.8%) |
| Total | 69 (92.0%) | 6 (8.0%) |
Housing Structures by Number of Rooms in Fort Smith
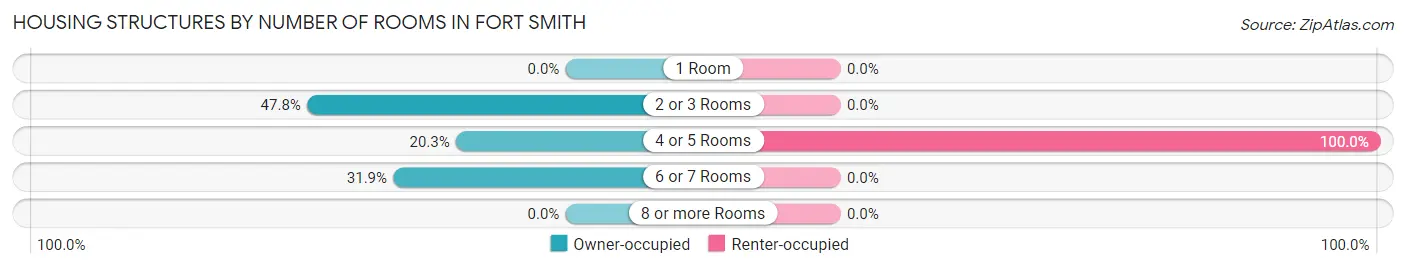
| Number of Rooms | Owner-occupied | Renter-occupied |
| 1 Room | 0 (0.0%) | 0 (0.0%) |
| 2 or 3 Rooms | 33 (47.8%) | 0 (0.0%) |
| 4 or 5 Rooms | 14 (20.3%) | 6 (100.0%) |
| 6 or 7 Rooms | 22 (31.9%) | 0 (0.0%) |
| 8 or more Rooms | 0 (0.0%) | 0 (0.0%) |
| Total | 69 (100.0%) | 6 (100.0%) |
Housing Structure by Heating Type in Fort Smith
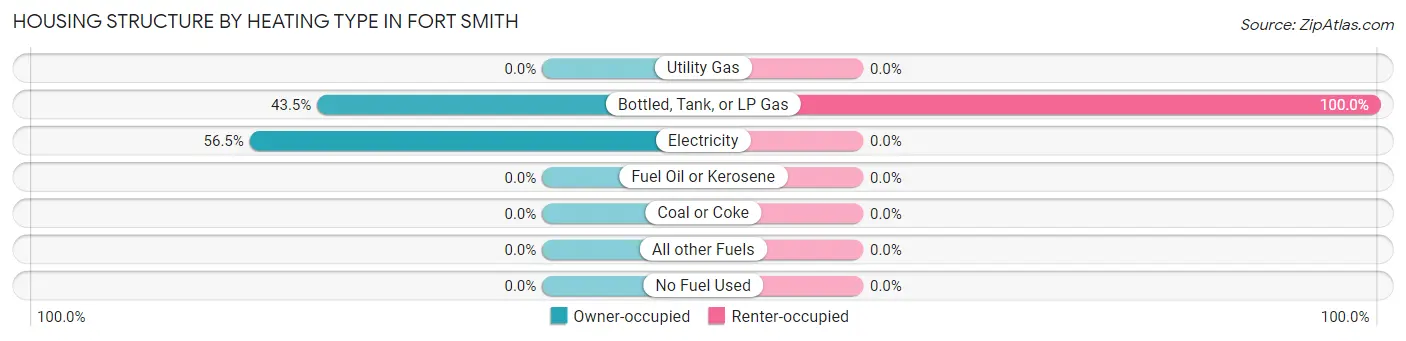
| Heating Type | Owner-occupied | Renter-occupied |
| Utility Gas | 0 (0.0%) | 0 (0.0%) |
| Bottled, Tank, or LP Gas | 30 (43.5%) | 6 (100.0%) |
| Electricity | 39 (56.5%) | 0 (0.0%) |
| Fuel Oil or Kerosene | 0 (0.0%) | 0 (0.0%) |
| Coal or Coke | 0 (0.0%) | 0 (0.0%) |
| All other Fuels | 0 (0.0%) | 0 (0.0%) |
| No Fuel Used | 0 (0.0%) | 0 (0.0%) |
| Total | 69 (100.0%) | 6 (100.0%) |
Household Vehicle Usage in Fort Smith
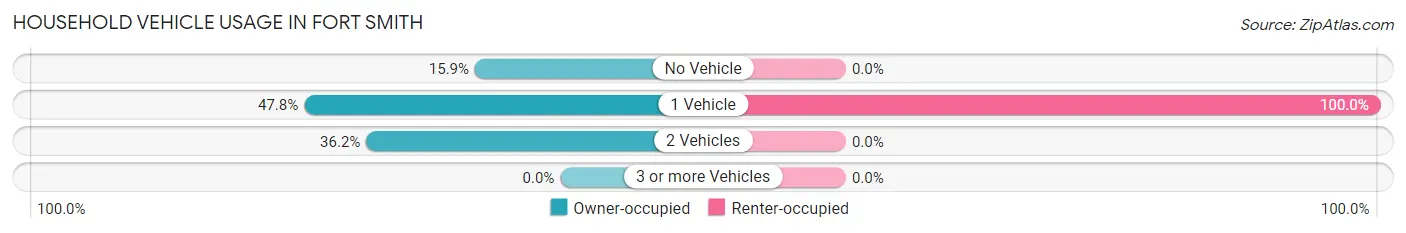
| Vehicles per Household | Owner-occupied | Renter-occupied |
| No Vehicle | 11 (15.9%) | 0 (0.0%) |
| 1 Vehicle | 33 (47.8%) | 6 (100.0%) |
| 2 Vehicles | 25 (36.2%) | 0 (0.0%) |
| 3 or more Vehicles | 0 (0.0%) | 0 (0.0%) |
| Total | 69 (100.0%) | 6 (100.0%) |
Real Estate & Mortgages in Fort Smith
Real Estate and Mortgage Overview in Fort Smith
| Characteristic | Without Mortgage | With Mortgage |
| Housing Units | 42 | 27 |
| Median Property Value | $152,300 | $0 |
| Median Household Income | $53,393 | $0 |
| Monthly Housing Costs | $555 | $0 |
| Real Estate Taxes | $1,545 | $0 |
Property Value by Mortgage Status in Fort Smith
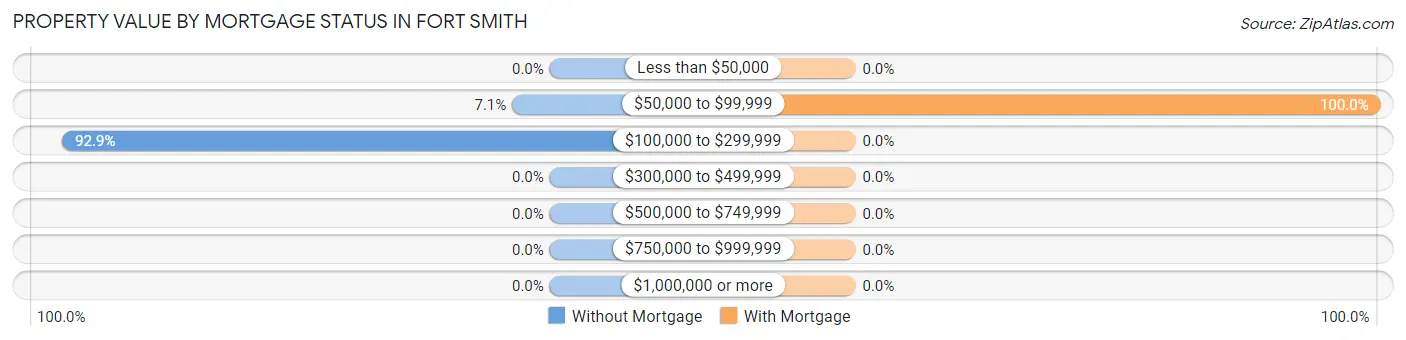
| Property Value | Without Mortgage | With Mortgage |
| Less than $50,000 | 0 (0.0%) | 0 (0.0%) |
| $50,000 to $99,999 | 3 (7.1%) | 27 (100.0%) |
| $100,000 to $299,999 | 39 (92.9%) | 0 (0.0%) |
| $300,000 to $499,999 | 0 (0.0%) | 0 (0.0%) |
| $500,000 to $749,999 | 0 (0.0%) | 0 (0.0%) |
| $750,000 to $999,999 | 0 (0.0%) | 0 (0.0%) |
| $1,000,000 or more | 0 (0.0%) | 0 (0.0%) |
| Total | 42 (100.0%) | 27 (100.0%) |
Household Income by Mortgage Status in Fort Smith
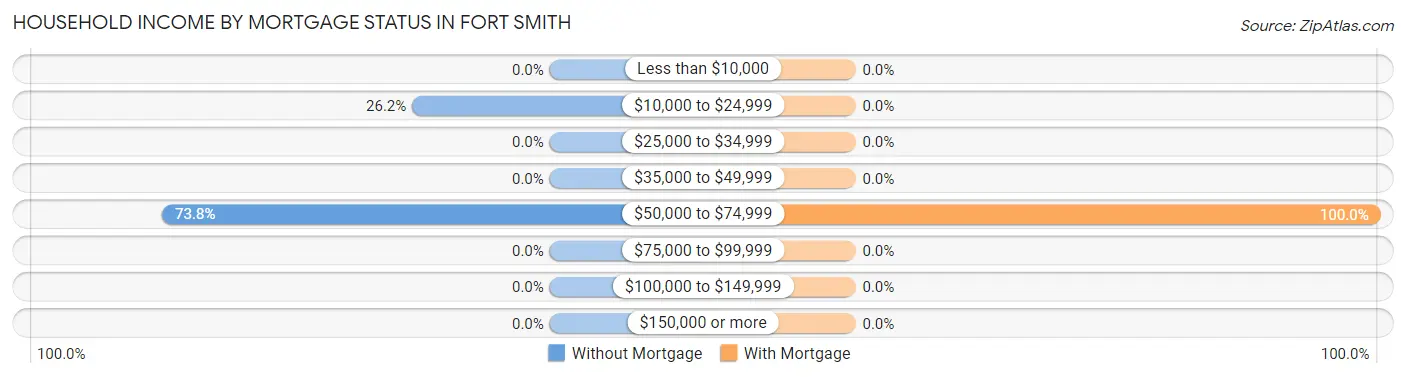
| Household Income | Without Mortgage | With Mortgage |
| Less than $10,000 | 0 (0.0%) | 0 (0.0%) |
| $10,000 to $24,999 | 11 (26.2%) | 0 (0.0%) |
| $25,000 to $34,999 | 0 (0.0%) | 0 (0.0%) |
| $35,000 to $49,999 | 0 (0.0%) | 0 (0.0%) |
| $50,000 to $74,999 | 31 (73.8%) | 27 (100.0%) |
| $75,000 to $99,999 | 0 (0.0%) | 0 (0.0%) |
| $100,000 to $149,999 | 0 (0.0%) | 0 (0.0%) |
| $150,000 or more | 0 (0.0%) | 0 (0.0%) |
| Total | 42 (100.0%) | 27 (100.0%) |
Property Value to Household Income Ratio in Fort Smith
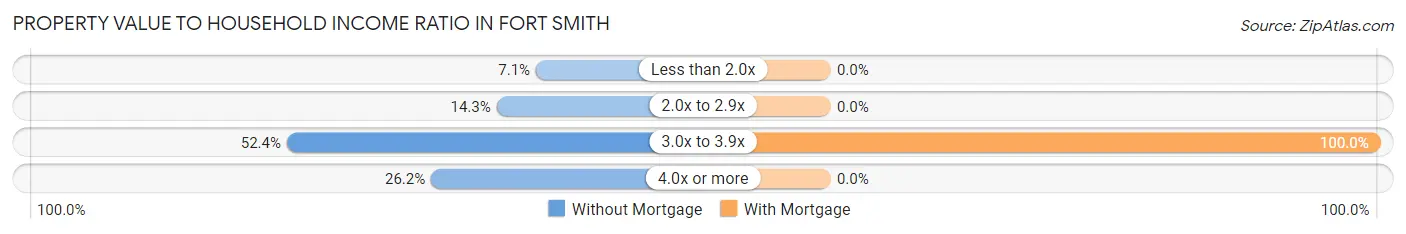
| Value-to-Income Ratio | Without Mortgage | With Mortgage |
| Less than 2.0x | 3 (7.1%) | 0 (0.0%) |
| 2.0x to 2.9x | 6 (14.3%) | 0 (0.0%) |
| 3.0x to 3.9x | 22 (52.4%) | 27 (100.0%) |
| 4.0x or more | 11 (26.2%) | 0 (0.0%) |
| Total | 42 (100.0%) | 27 (100.0%) |
Real Estate Taxes by Mortgage Status in Fort Smith
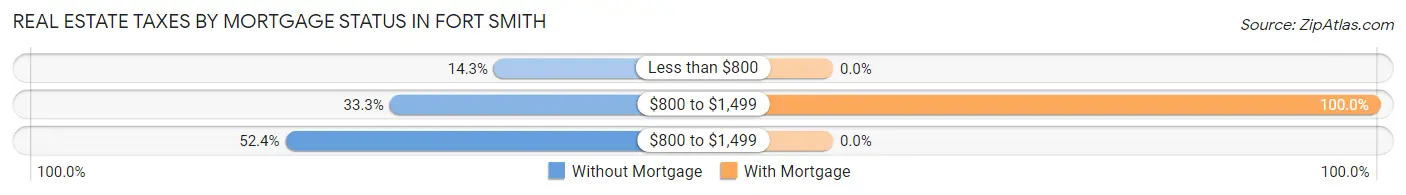
| Property Taxes | Without Mortgage | With Mortgage |
| Less than $800 | 6 (14.3%) | 0 (0.0%) |
| $800 to $1,499 | 14 (33.3%) | 27 (100.0%) |
| $800 to $1,499 | 22 (52.4%) | 0 (0.0%) |
| Total | 42 (100.0%) | 27 (100.0%) |
Health & Disability in Fort Smith
Health Insurance Coverage by Age in Fort Smith
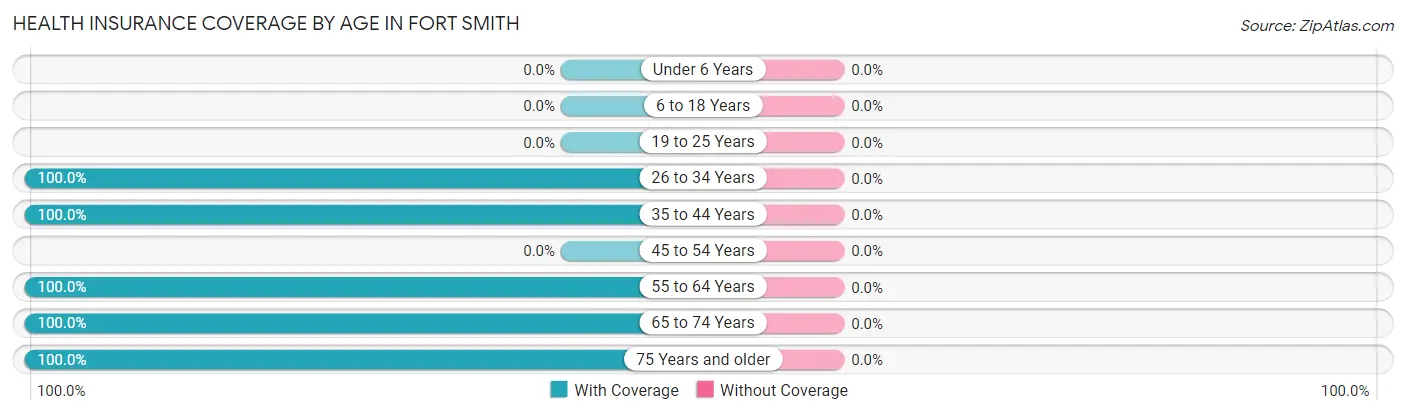
| Age Bracket | With Coverage | Without Coverage |
| Under 6 Years | 0 (0.0%) | 0 (0.0%) |
| 6 to 18 Years | 0 (0.0%) | 0 (0.0%) |
| 19 to 25 Years | 0 (0.0%) | 0 (0.0%) |
| 26 to 34 Years | 27 (100.0%) | 0 (0.0%) |
| 35 to 44 Years | 20 (100.0%) | 0 (0.0%) |
| 45 to 54 Years | 0 (0.0%) | 0 (0.0%) |
| 55 to 64 Years | 29 (100.0%) | 0 (0.0%) |
| 65 to 74 Years | 6 (100.0%) | 0 (0.0%) |
| 75 Years and older | 33 (100.0%) | 0 (0.0%) |
| Total | 115 (100.0%) | 0 (0.0%) |
Health Insurance Coverage by Citizenship Status in Fort Smith
| Citizenship Status | With Coverage | Without Coverage |
| Native Born | 0 (0.0%) | 0 (0.0%) |
| Foreign Born, Citizen | 0 (0.0%) | 0 (0.0%) |
| Foreign Born, not a Citizen | 0 (0.0%) | 0 (0.0%) |
Health Insurance Coverage by Household Income in Fort Smith
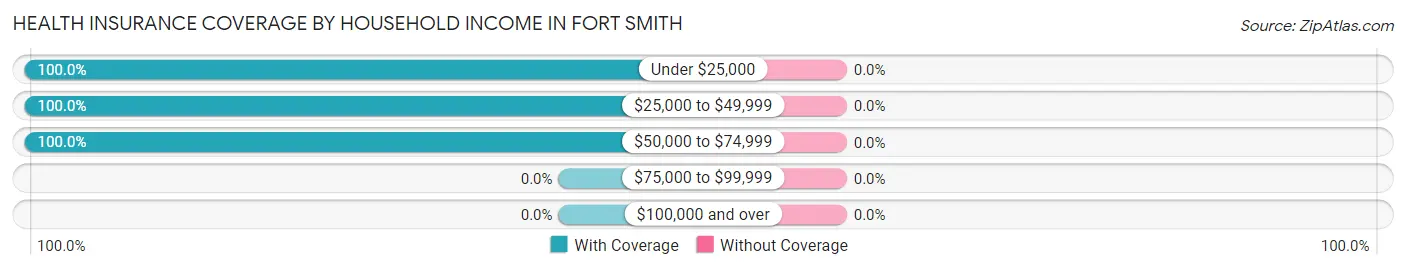
| Household Income | With Coverage | Without Coverage |
| Under $25,000 | 11 (100.0%) | 0 (0.0%) |
| $25,000 to $49,999 | 33 (100.0%) | 0 (0.0%) |
| $50,000 to $74,999 | 71 (100.0%) | 0 (0.0%) |
| $75,000 to $99,999 | 0 (0.0%) | 0 (0.0%) |
| $100,000 and over | 0 (0.0%) | 0 (0.0%) |
Public vs Private Health Insurance Coverage by Age in Fort Smith
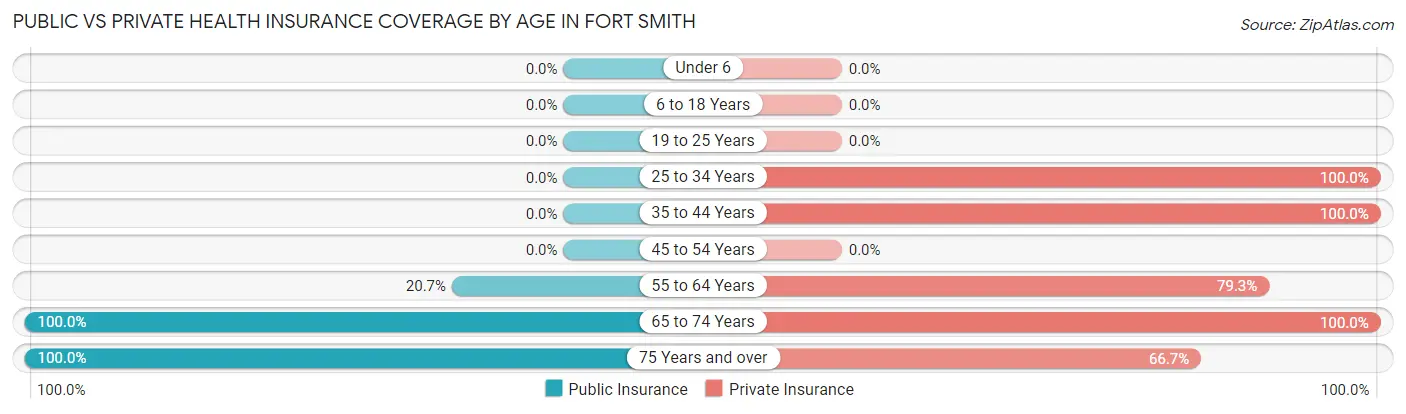
| Age Bracket | Public Insurance | Private Insurance |
| Under 6 | 0 (0.0%) | 0 (0.0%) |
| 6 to 18 Years | 0 (0.0%) | 0 (0.0%) |
| 19 to 25 Years | 0 (0.0%) | 0 (0.0%) |
| 25 to 34 Years | 0 (0.0%) | 27 (100.0%) |
| 35 to 44 Years | 0 (0.0%) | 20 (100.0%) |
| 45 to 54 Years | 0 (0.0%) | 0 (0.0%) |
| 55 to 64 Years | 6 (20.7%) | 23 (79.3%) |
| 65 to 74 Years | 6 (100.0%) | 6 (100.0%) |
| 75 Years and over | 33 (100.0%) | 22 (66.7%) |
| Total | 45 (39.1%) | 98 (85.2%) |
Disability Status by Sex by Age in Fort Smith
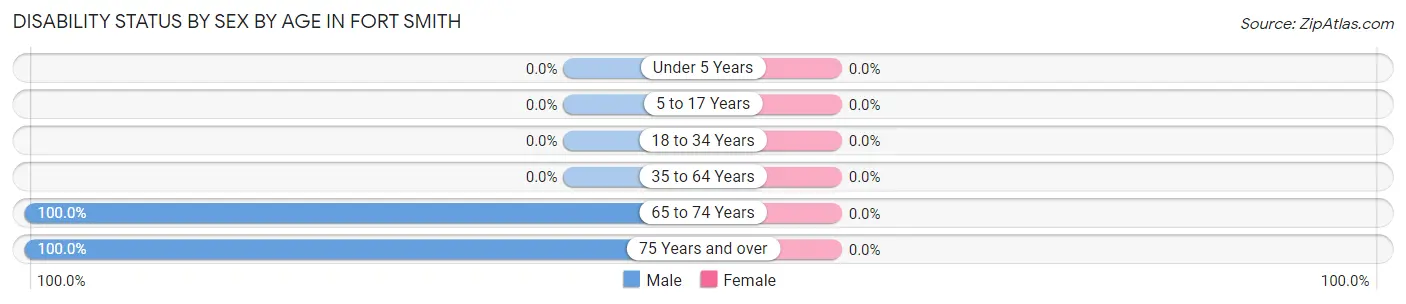
| Age Bracket | Male | Female |
| Under 5 Years | 0 (0.0%) | 0 (0.0%) |
| 5 to 17 Years | 0 (0.0%) | 0 (0.0%) |
| 18 to 34 Years | 0 (0.0%) | 0 (0.0%) |
| 35 to 64 Years | 0 (0.0%) | 0 (0.0%) |
| 65 to 74 Years | 6 (100.0%) | 0 (0.0%) |
| 75 Years and over | 33 (100.0%) | 0 (0.0%) |
Disability Class by Sex by Age in Fort Smith
Disability Class: Hearing Difficulty
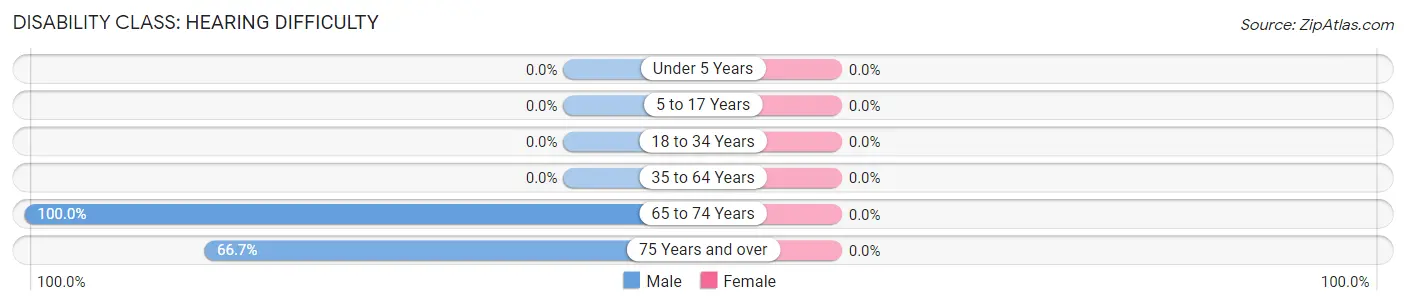
| Age Bracket | Male | Female |
| Under 5 Years | 0 (0.0%) | 0 (0.0%) |
| 5 to 17 Years | 0 (0.0%) | 0 (0.0%) |
| 18 to 34 Years | 0 (0.0%) | 0 (0.0%) |
| 35 to 64 Years | 0 (0.0%) | 0 (0.0%) |
| 65 to 74 Years | 6 (100.0%) | 0 (0.0%) |
| 75 Years and over | 22 (66.7%) | 0 (0.0%) |
Disability Class: Vision Difficulty
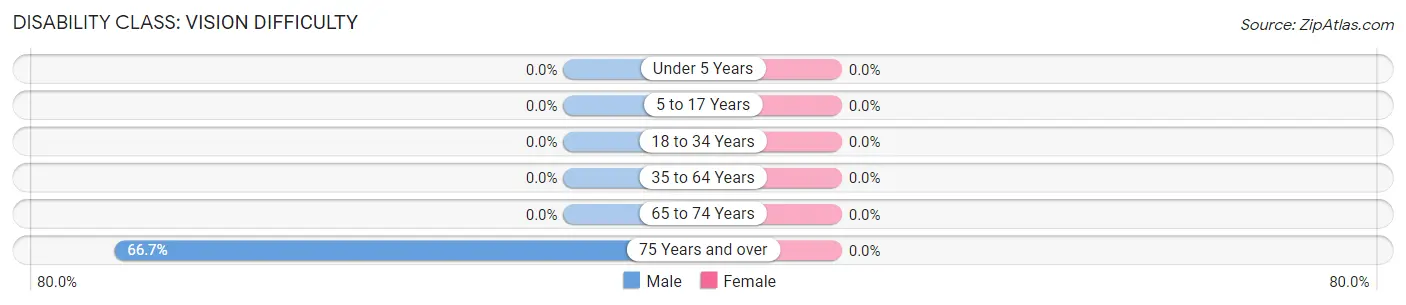
| Age Bracket | Male | Female |
| Under 5 Years | 0 (0.0%) | 0 (0.0%) |
| 5 to 17 Years | 0 (0.0%) | 0 (0.0%) |
| 18 to 34 Years | 0 (0.0%) | 0 (0.0%) |
| 35 to 64 Years | 0 (0.0%) | 0 (0.0%) |
| 65 to 74 Years | 0 (0.0%) | 0 (0.0%) |
| 75 Years and over | 22 (66.7%) | 0 (0.0%) |
Disability Class: Cognitive Difficulty
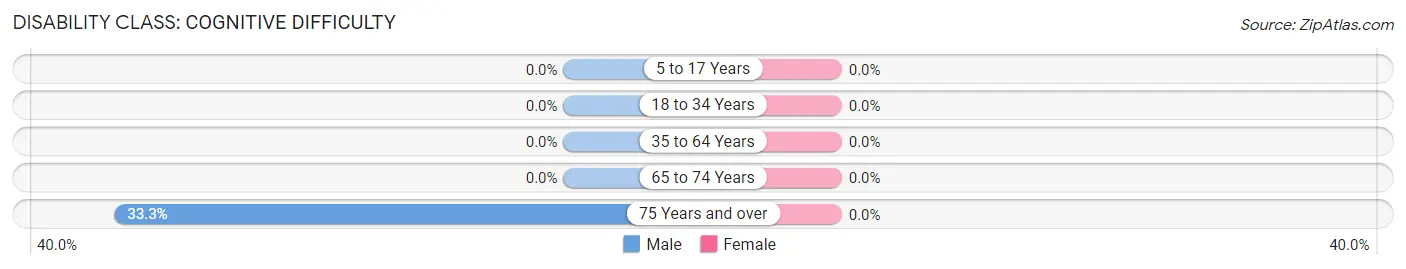
| Age Bracket | Male | Female |
| 5 to 17 Years | 0 (0.0%) | 0 (0.0%) |
| 18 to 34 Years | 0 (0.0%) | 0 (0.0%) |
| 35 to 64 Years | 0 (0.0%) | 0 (0.0%) |
| 65 to 74 Years | 0 (0.0%) | 0 (0.0%) |
| 75 Years and over | 11 (33.3%) | 0 (0.0%) |
Disability Class: Ambulatory Difficulty
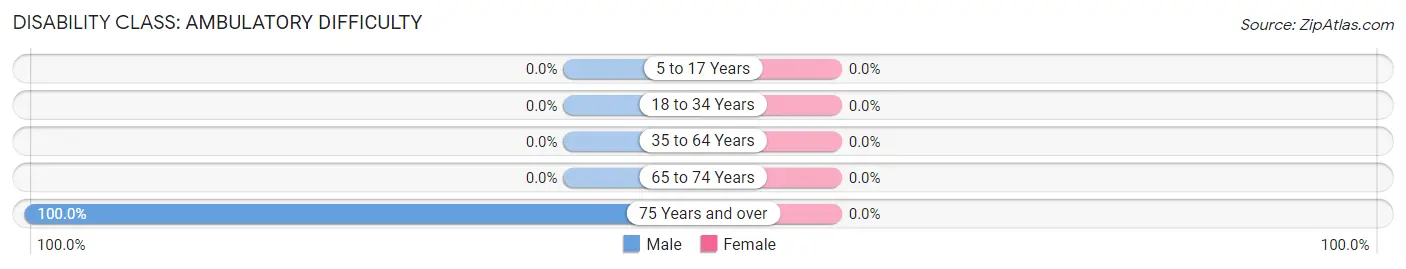
| Age Bracket | Male | Female |
| 5 to 17 Years | 0 (0.0%) | 0 (0.0%) |
| 18 to 34 Years | 0 (0.0%) | 0 (0.0%) |
| 35 to 64 Years | 0 (0.0%) | 0 (0.0%) |
| 65 to 74 Years | 0 (0.0%) | 0 (0.0%) |
| 75 Years and over | 33 (100.0%) | 0 (0.0%) |
Disability Class: Self-Care Difficulty
| Age Bracket | Male | Female |
| 5 to 17 Years | 0 (0.0%) | 0 (0.0%) |
| 18 to 34 Years | 0 (0.0%) | 0 (0.0%) |
| 35 to 64 Years | 0 (0.0%) | 0 (0.0%) |
| 65 to 74 Years | 0 (0.0%) | 0 (0.0%) |
| 75 Years and over | 0 (0.0%) | 0 (0.0%) |
Technology Access in Fort Smith
Computing Device Access in Fort Smith
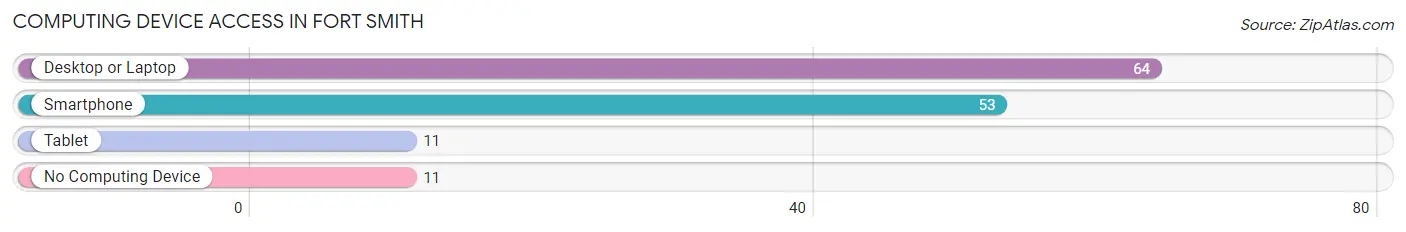
| Device Type | # Households | % Households |
| Desktop or Laptop | 64 | 85.3% |
| Smartphone | 53 | 70.7% |
| Tablet | 11 | 14.7% |
| No Computing Device | 11 | 14.7% |
| Total | 75 | 100.0% |
Internet Access in Fort Smith
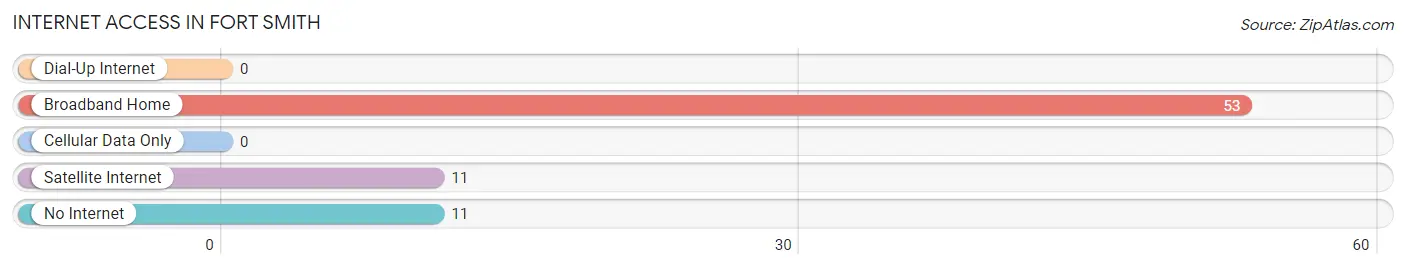
| Internet Type | # Households | % Households |
| Dial-Up Internet | 0 | 0.0% |
| Broadband Home | 53 | 70.7% |
| Cellular Data Only | 0 | 0.0% |
| Satellite Internet | 11 | 14.7% |
| No Internet | 11 | 14.7% |
| Total | 75 | 100.0% |
Fort Smith Summary
Fort Smith, Montana is a small town located in the northwest corner of the state, near the border of Idaho and Montana. It is situated in the Flathead Valley, a region of the Rocky Mountains known for its stunning scenery and outdoor recreation opportunities. The town has a population of just over 1,000 people and is the county seat of Flathead County.
History
Fort Smith was founded in 1883 as a trading post and military outpost. The town was named after the nearby Fort Smith, which was established in 1877 by the U.S. Army to protect settlers from Native American attacks. The fort was abandoned in 1891, but the town of Fort Smith remained.
In the early 1900s, Fort Smith was a bustling center of commerce and transportation. The Great Northern Railway ran through the town, connecting it to other parts of Montana and the Pacific Northwest. The town also had a number of businesses, including a hotel, a bank, a general store, and a saloon.
In the 1920s, Fort Smith began to decline as the railroad industry shifted away from the area. The town’s population dwindled and many of the businesses closed. In the 1950s, the town was revitalized when the Flathead Valley was designated as a National Forest. This brought new visitors to the area and helped to revive the local economy.
Geography
Fort Smith is located in the Flathead Valley, a region of the Rocky Mountains. The town is situated at the confluence of the Flathead River and the Clark Fork River. The surrounding area is characterized by rolling hills, lush forests, and numerous lakes and streams.
The town is located near the Idaho border and is about an hour’s drive from Missoula, Montana’s second-largest city. It is also close to Glacier National Park, one of the most popular tourist destinations in the state.
Economy
Fort Smith’s economy is largely based on tourism. The town is a popular destination for outdoor recreation, such as fishing, hunting, camping, and hiking. The nearby Flathead National Forest is a popular destination for visitors, and the town is also home to a number of resorts and lodges.
The town also has a number of small businesses, including restaurants, shops, and galleries. The local economy is also supported by the nearby timber industry and agriculture.
Demographics
As of the 2010 census, the population of Fort Smith was 1,072. The town is predominantly white, with a small Native American population. The median household income is $37,500, and the median age is 44.
Fort Smith is a small town with a rich history and a vibrant economy. It is a popular destination for outdoor recreation and is home to a number of small businesses. The town is a great place to live, work, and play.
Common Questions
What is Per Capita Income in Fort Smith?
Per Capita income in Fort Smith is $34,023.
What is the Median Family Income in Fort Smith?
Median Family Income in Fort Smith is $53,920.
What is the Median Household income in Fort Smith?
Median Household Income in Fort Smith is $49,398.
What is Income or Wage Gap in Fort Smith?
Income or Wage Gap in Fort Smith is 24.8%.
Women in Fort Smith earn 75.2 cents for every dollar earned by a man.
What is Inequality or Gini Index in Fort Smith?
Inequality or Gini Index in Fort Smith is 0.13.
What is the Total Population of Fort Smith?
Total Population of Fort Smith is 115.
What is the Total Male Population of Fort Smith?
Total Male Population of Fort Smith is 70.
What is the Total Female Population of Fort Smith?
Total Female Population of Fort Smith is 45.
What is the Ratio of Males per 100 Females in Fort Smith?
There are 155.56 Males per 100 Females in Fort Smith.
What is the Ratio of Females per 100 Males in Fort Smith?
There are 64.29 Females per 100 Males in Fort Smith.
What is the Median Population Age in Fort Smith?
Median Population Age in Fort Smith is 56.7 Years.
What is the Average Family Size in Fort Smith
Average Family Size in Fort Smith is 2.6 People.
What is the Average Household Size in Fort Smith
Average Household Size in Fort Smith is 1.5 People.
How Large is the Labor Force in Fort Smith?
There are 49 People in the Labor Forcein in Fort Smith.
What is the Percentage of People in the Labor Force in Fort Smith?
42.6% of People are in the Labor Force in Fort Smith.