Zip Codes with the Highest Percentage of Population Employed in Food Preparation & Serving in Helena, MT
RELATED REPORTS & OPTIONS
Food Preparation & Serving
Helena
Compare Zip Codes
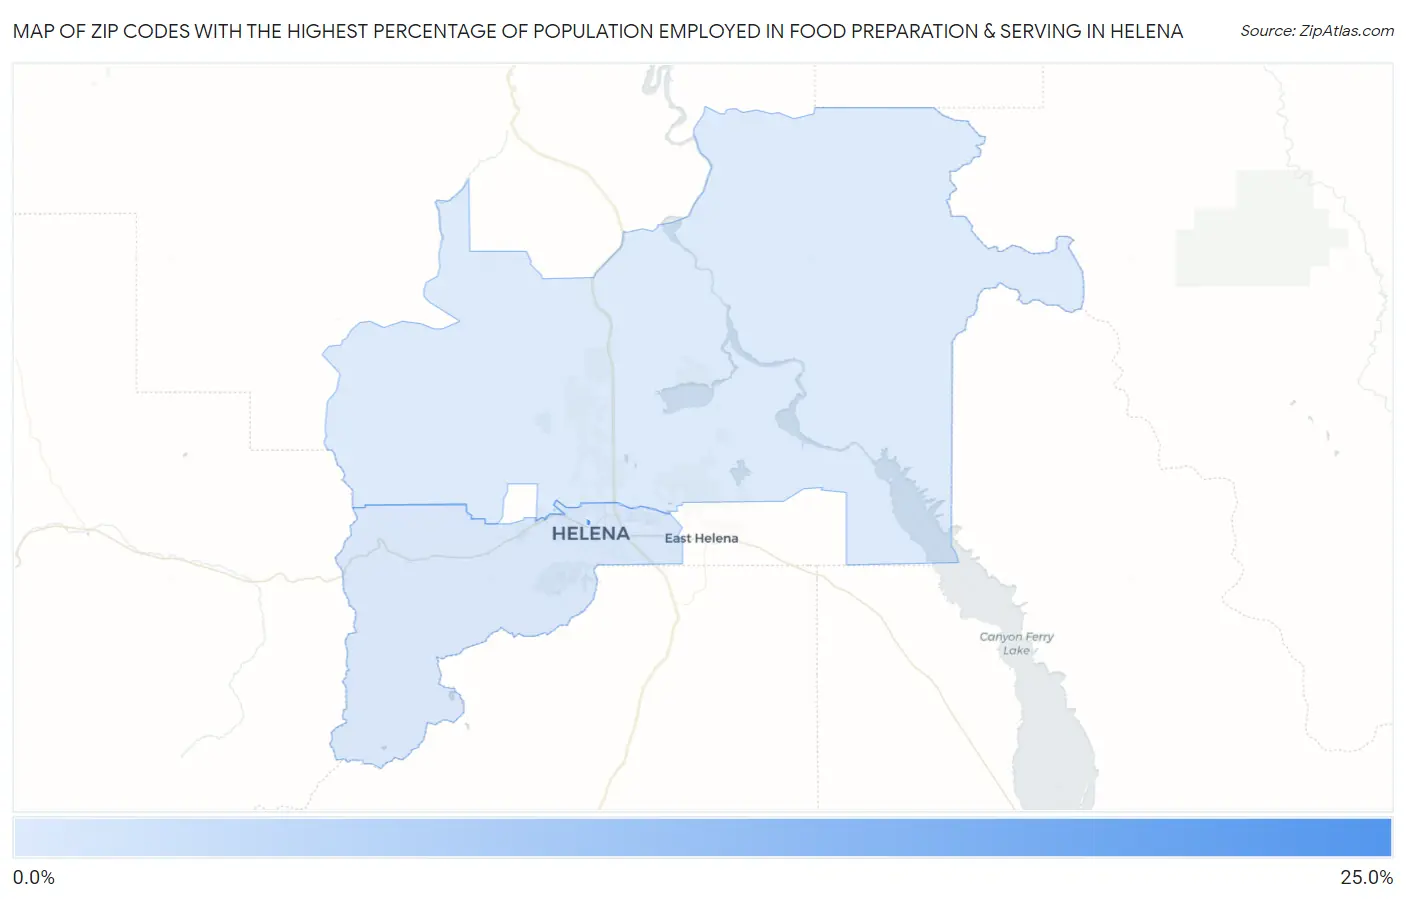
Map of Zip Codes with the Highest Percentage of Population Employed in Food Preparation & Serving in Helena
4.3%
21.8%
Zip Codes with the Highest Percentage of Population Employed in Food Preparation & Serving in Helena, MT
| Zip Code | % Employed | vs State | vs National | |
| 1. | 59625 | 21.8% | 6.7%(+15.1)#15 | 5.3%(+16.5)#426 |
| 2. | 59601 | 4.7% | 6.7%(-2.05)#173 | 5.3%(-0.613)#14,273 |
| 3. | 59602 | 4.3% | 6.7%(-2.45)#185 | 5.3%(-1.02)#16,026 |
1
Common Questions
What are the Top Zip Codes with the Highest Percentage of Population Employed in Food Preparation & Serving in Helena, MT?
Top Zip Codes with the Highest Percentage of Population Employed in Food Preparation & Serving in Helena, MT are:
What zip code has the Highest Percentage of Population Employed in Food Preparation & Serving in Helena, MT?
59625 has the Highest Percentage of Population Employed in Food Preparation & Serving in Helena, MT with 21.8%.
What is the Percentage of Population Employed in Food Preparation & Serving in Helena, MT?
Percentage of Population Employed in Food Preparation & Serving in Helena is 4.8%.
What is the Percentage of Population Employed in Food Preparation & Serving in Montana?
Percentage of Population Employed in Food Preparation & Serving in Montana is 6.7%.
What is the Percentage of Population Employed in Food Preparation & Serving in the United States?
Percentage of Population Employed in Food Preparation & Serving in the United States is 5.3%.