Carytown, MO Map & Demographics
Carytown Map
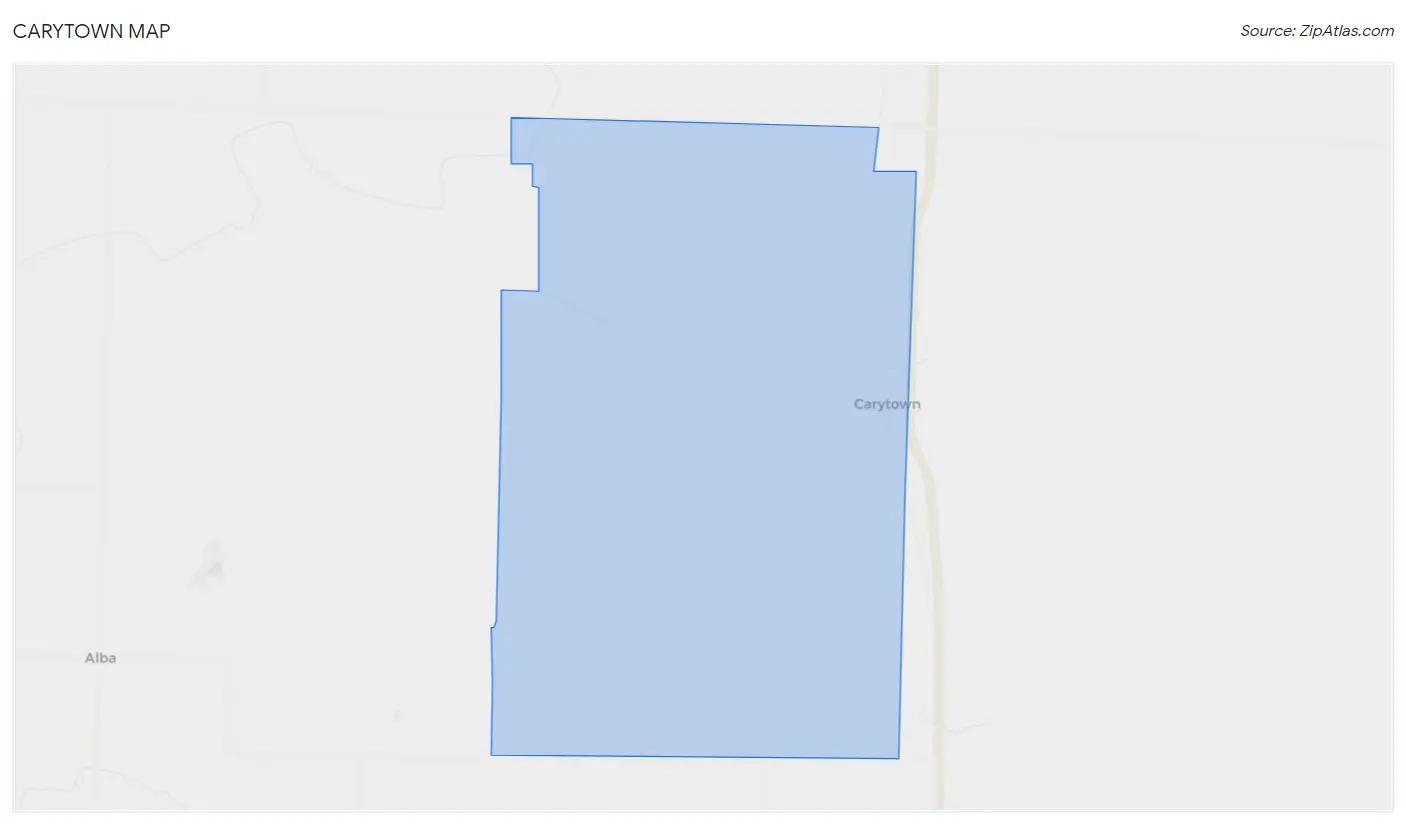
Carytown Overview
$30,880
PER CAPITA INCOME
$81,964
AVG FAMILY INCOME
$72,708
AVG HOUSEHOLD INCOME
56.5%
WAGE / INCOME GAP [ % ]
43.5¢/ $1
WAGE / INCOME GAP [ $ ]
0.37
INEQUALITY / GINI INDEX
304
TOTAL POPULATION
157
MALE POPULATION
147
FEMALE POPULATION
106.80
MALES / 100 FEMALES
93.63
FEMALES / 100 MALES
51.7
MEDIAN AGE
2.8
AVG FAMILY SIZE
2.5
AVG HOUSEHOLD SIZE
134
LABOR FORCE [ PEOPLE ]
51.5%
PERCENT IN LABOR FORCE
Income in Carytown
Income Overview in Carytown
Per Capita Income in Carytown is $30,880, while median incomes of families and households are $81,964 and $72,708 respectively.
| Characteristic | Number | Measure |
| Per Capita Income | 304 | $30,880 |
| Median Family Income | 91 | $81,964 |
| Mean Family Income | 91 | $95,556 |
| Median Household Income | 121 | $72,708 |
| Mean Household Income | 121 | $79,483 |
| Income Deficit | 91 | $0 |
| Wage / Income Gap (%) | 304 | 56.48% |
| Wage / Income Gap ($) | 304 | 43.52¢ per $1 |
| Gini / Inequality Index | 304 | 0.37 |
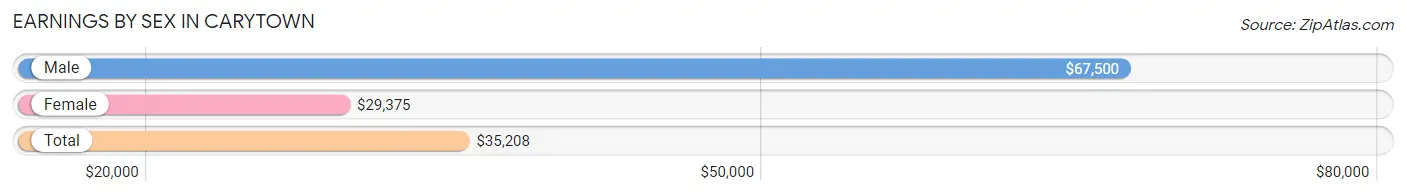
Earnings by Sex in Carytown
Average Earnings in Carytown are $35,208, $67,500 for men and $29,375 for women, a difference of 56.5%.
| Sex | Number | Average Earnings |
| Male | 78 (51.0%) | $67,500 |
| Female | 75 (49.0%) | $29,375 |
| Total | 153 (100.0%) | $35,208 |
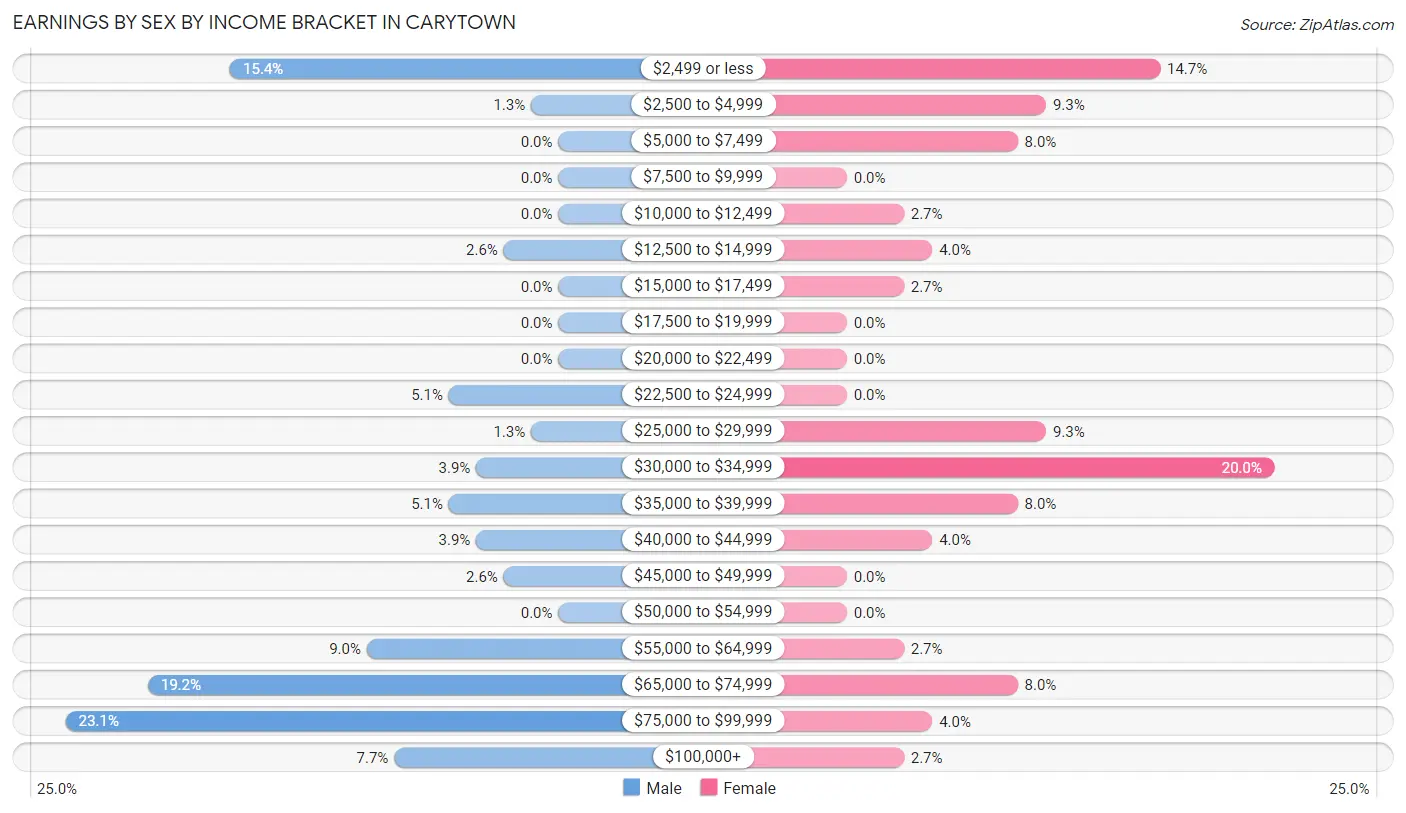
Earnings by Sex by Income Bracket in Carytown
The most common earnings brackets in Carytown are $75,000 to $99,999 for men (18 | 23.1%) and $30,000 to $34,999 for women (15 | 20.0%).
| Income | Male | Female |
| $2,499 or less | 12 (15.4%) | 11 (14.7%) |
| $2,500 to $4,999 | 1 (1.3%) | 7 (9.3%) |
| $5,000 to $7,499 | 0 (0.0%) | 6 (8.0%) |
| $7,500 to $9,999 | 0 (0.0%) | 0 (0.0%) |
| $10,000 to $12,499 | 0 (0.0%) | 2 (2.7%) |
| $12,500 to $14,999 | 2 (2.6%) | 3 (4.0%) |
| $15,000 to $17,499 | 0 (0.0%) | 2 (2.7%) |
| $17,500 to $19,999 | 0 (0.0%) | 0 (0.0%) |
| $20,000 to $22,499 | 0 (0.0%) | 0 (0.0%) |
| $22,500 to $24,999 | 4 (5.1%) | 0 (0.0%) |
| $25,000 to $29,999 | 1 (1.3%) | 7 (9.3%) |
| $30,000 to $34,999 | 3 (3.8%) | 15 (20.0%) |
| $35,000 to $39,999 | 4 (5.1%) | 6 (8.0%) |
| $40,000 to $44,999 | 3 (3.8%) | 3 (4.0%) |
| $45,000 to $49,999 | 2 (2.6%) | 0 (0.0%) |
| $50,000 to $54,999 | 0 (0.0%) | 0 (0.0%) |
| $55,000 to $64,999 | 7 (9.0%) | 2 (2.7%) |
| $65,000 to $74,999 | 15 (19.2%) | 6 (8.0%) |
| $75,000 to $99,999 | 18 (23.1%) | 3 (4.0%) |
| $100,000+ | 6 (7.7%) | 2 (2.7%) |
| Total | 78 (100.0%) | 75 (100.0%) |
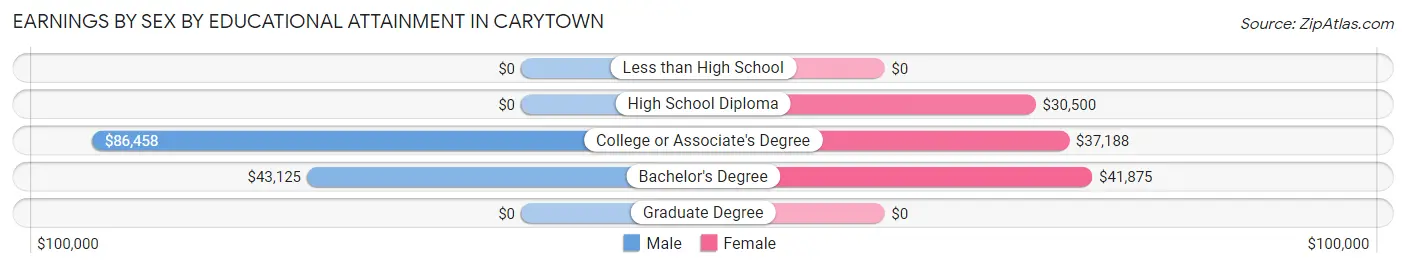
Earnings by Sex by Educational Attainment in Carytown
Average earnings in Carytown are $67,500 for men and $33,250 for women, a difference of 50.7%. Men with an educational attainment of college or associate's degree enjoy the highest average annual earnings of $86,458, while those with bachelor's degree education earn the least with $43,125. Women with an educational attainment of bachelor's degree earn the most with the average annual earnings of $41,875, while those with high school diploma education have the smallest earnings of $30,500.
| Educational Attainment | Male Income | Female Income |
| Less than High School | - | - |
| High School Diploma | - | - |
| College or Associate's Degree | $86,458 | $37,188 |
| Bachelor's Degree | $43,125 | $41,875 |
| Graduate Degree | - | - |
| Total | $67,500 | $33,250 |
Family Income in Carytown
Family Income Brackets in Carytown
According to the Carytown family income data, there are 29 families falling into the $100,000 to $149,999 income range, which is the most common income bracket and makes up 31.9% of all families.
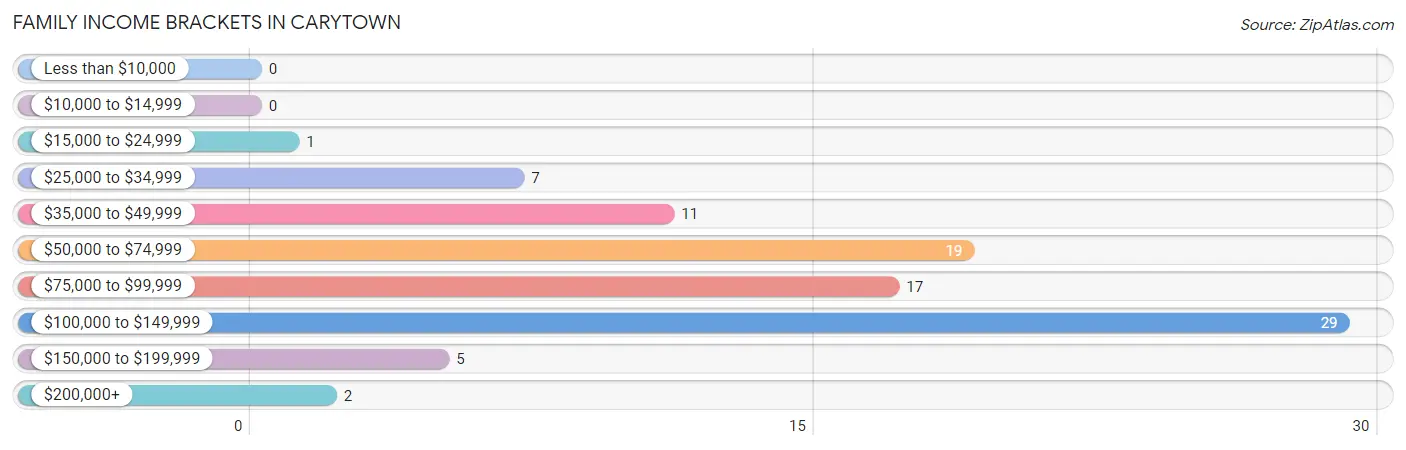
| Income Bracket | # Families | % Families |
| Less than $10,000 | 0 | 0.0% |
| $10,000 to $14,999 | 0 | 0.0% |
| $15,000 to $24,999 | 1 | 1.1% |
| $25,000 to $34,999 | 7 | 7.7% |
| $35,000 to $49,999 | 11 | 12.1% |
| $50,000 to $74,999 | 19 | 20.9% |
| $75,000 to $99,999 | 17 | 18.7% |
| $100,000 to $149,999 | 29 | 31.9% |
| $150,000 to $199,999 | 5 | 5.5% |
| $200,000+ | 2 | 2.2% |
Family Income by Famaliy Size in Carytown
3-person families (7 | 7.7%) account for the highest median family income in Carytown with $138,125 per family, while 3-person families (7 | 7.7%) have the highest median income of $46,042 per family member.
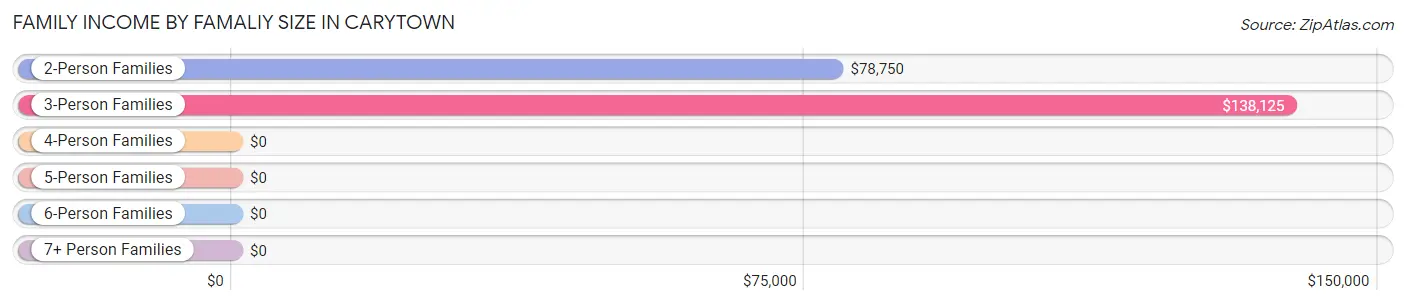
| Income Bracket | # Families | Median Income |
| 2-Person Families | 63 (69.2%) | $78,750 |
| 3-Person Families | 7 (7.7%) | $138,125 |
| 4-Person Families | 8 (8.8%) | $0 |
| 5-Person Families | 10 (11.0%) | $0 |
| 6-Person Families | 3 (3.3%) | $0 |
| 7+ Person Families | 0 (0.0%) | $0 |
| Total | 91 (100.0%) | $81,964 |
Family Income by Number of Earners in Carytown
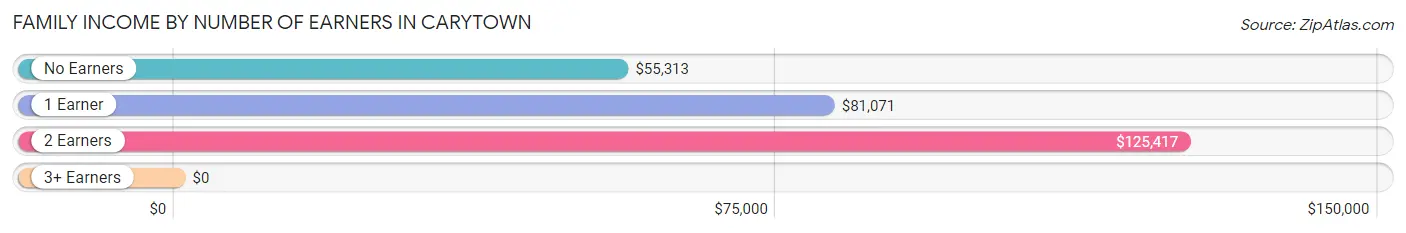
| Number of Earners | # Families | Median Income |
| No Earners | 23 (25.3%) | $55,313 |
| 1 Earner | 16 (17.6%) | $81,071 |
| 2 Earners | 43 (47.2%) | $125,417 |
| 3+ Earners | 9 (9.9%) | $0 |
| Total | 91 (100.0%) | $81,964 |
Household Income in Carytown
Household Income Brackets in Carytown
With 29 households falling in the category, the $100,000 to $149,999 income range is the most frequent in Carytown, accounting for 24.0% of all households.
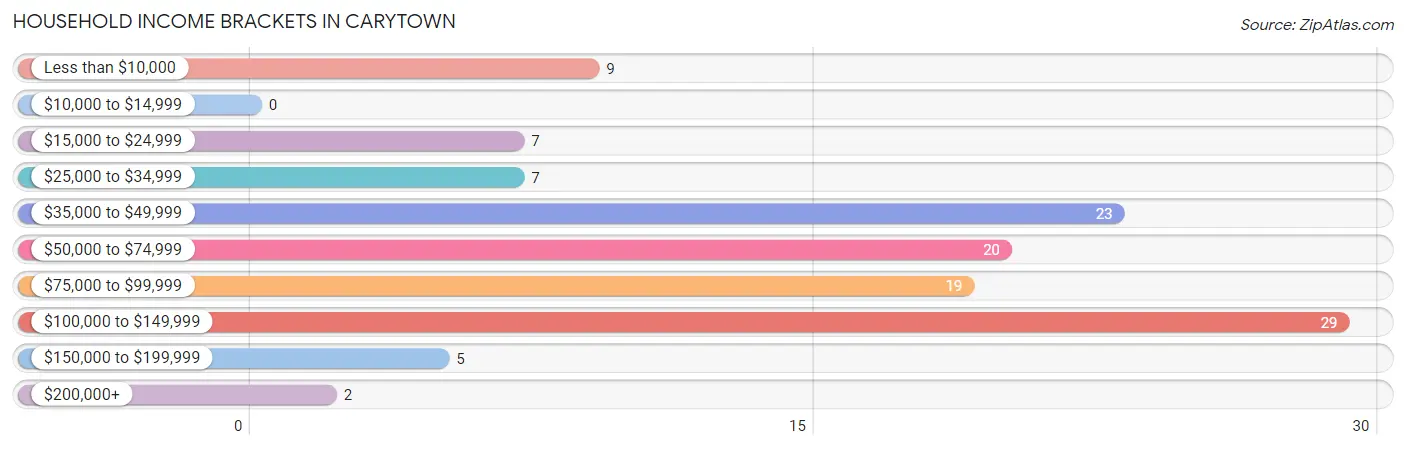
| Income Bracket | # Households | % Households |
| Less than $10,000 | 9 | 7.4% |
| $10,000 to $14,999 | 0 | 0.0% |
| $15,000 to $24,999 | 7 | 5.8% |
| $25,000 to $34,999 | 7 | 5.8% |
| $35,000 to $49,999 | 23 | 19.0% |
| $50,000 to $74,999 | 20 | 16.5% |
| $75,000 to $99,999 | 19 | 15.7% |
| $100,000 to $149,999 | 29 | 24.0% |
| $150,000 to $199,999 | 5 | 4.1% |
| $200,000+ | 2 | 1.7% |
Household Income by Householder Age in Carytown
The median household income in Carytown is $72,708, with the highest median household income of $80,357 found in the 45 to 64 years age bracket for the primary householder. A total of 68 households (56.2%) fall into this category.
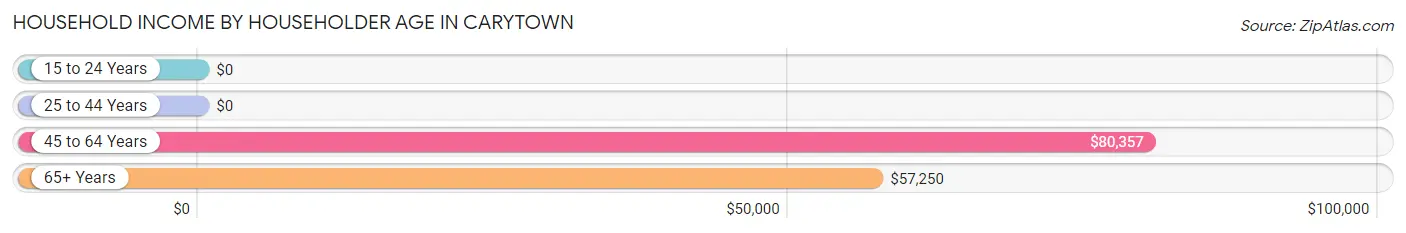
| Income Bracket | # Households | Median Income |
| 15 to 24 Years | 0 (0.0%) | $0 |
| 25 to 44 Years | 20 (16.5%) | $0 |
| 45 to 64 Years | 68 (56.2%) | $80,357 |
| 65+ Years | 33 (27.3%) | $57,250 |
| Total | 121 (100.0%) | $72,708 |
Poverty in Carytown
Income Below Poverty by Sex and Age in Carytown
With 11.5% poverty level for males and 26.5% for females among the residents of Carytown, 35 to 44 year old males and 12 to 14 year old females are the most vulnerable to poverty, with 9 males (37.5%) and 8 females (100.0%) in their respective age groups living below the poverty level.
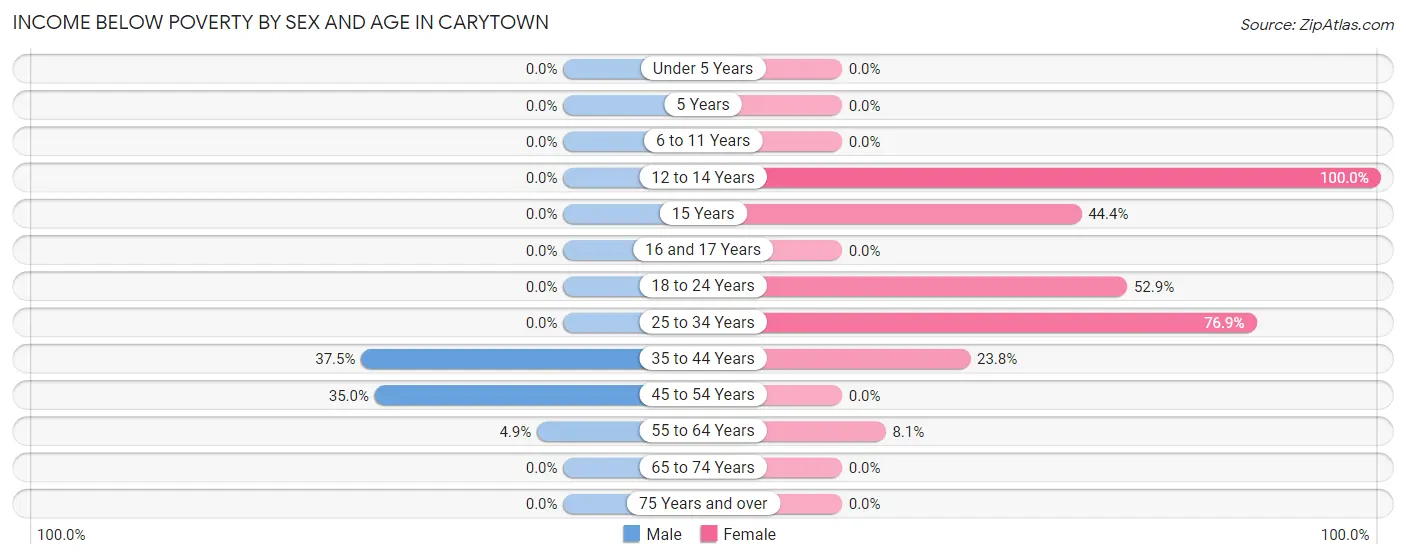
| Age Bracket | Male | Female |
| Under 5 Years | 0 (0.0%) | 0 (0.0%) |
| 5 Years | 0 (0.0%) | 0 (0.0%) |
| 6 to 11 Years | 0 (0.0%) | 0 (0.0%) |
| 12 to 14 Years | 0 (0.0%) | 8 (100.0%) |
| 15 Years | 0 (0.0%) | 4 (44.4%) |
| 16 and 17 Years | 0 (0.0%) | 0 (0.0%) |
| 18 to 24 Years | 0 (0.0%) | 9 (52.9%) |
| 25 to 34 Years | 0 (0.0%) | 10 (76.9%) |
| 35 to 44 Years | 9 (37.5%) | 5 (23.8%) |
| 45 to 54 Years | 7 (35.0%) | 0 (0.0%) |
| 55 to 64 Years | 2 (4.9%) | 3 (8.1%) |
| 65 to 74 Years | 0 (0.0%) | 0 (0.0%) |
| 75 Years and over | 0 (0.0%) | 0 (0.0%) |
| Total | 18 (11.5%) | 39 (26.5%) |
Income Above Poverty by Sex and Age in Carytown
According to the poverty statistics in Carytown, males aged under 5 years and females aged under 5 years are the age groups that are most secure financially, with 100.0% of males and 100.0% of females in these age groups living above the poverty line.
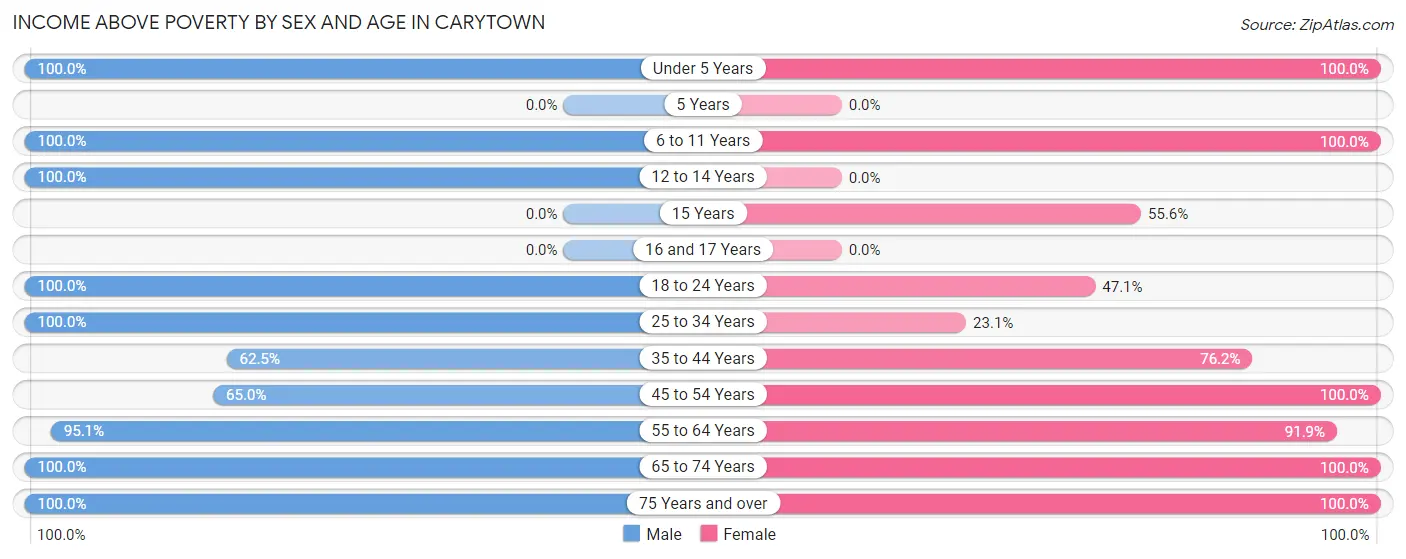
| Age Bracket | Male | Female |
| Under 5 Years | 3 (100.0%) | 2 (100.0%) |
| 5 Years | 0 (0.0%) | 0 (0.0%) |
| 6 to 11 Years | 8 (100.0%) | 2 (100.0%) |
| 12 to 14 Years | 12 (100.0%) | 0 (0.0%) |
| 15 Years | 0 (0.0%) | 5 (55.6%) |
| 16 and 17 Years | 0 (0.0%) | 0 (0.0%) |
| 18 to 24 Years | 9 (100.0%) | 8 (47.1%) |
| 25 to 34 Years | 4 (100.0%) | 3 (23.1%) |
| 35 to 44 Years | 15 (62.5%) | 16 (76.2%) |
| 45 to 54 Years | 13 (65.0%) | 10 (100.0%) |
| 55 to 64 Years | 39 (95.1%) | 34 (91.9%) |
| 65 to 74 Years | 27 (100.0%) | 17 (100.0%) |
| 75 Years and over | 9 (100.0%) | 11 (100.0%) |
| Total | 139 (88.5%) | 108 (73.5%) |
Income Below Poverty Among Married-Couple Families in Carytown
The poverty statistics for married-couple families in Carytown show that 7.8% or 7 of the total 90 families live below the poverty line. Families with 1 or 2 children have the highest poverty rate of 58.3%, comprising of 7 families. On the other hand, families with no children have the lowest poverty rate of 0.0%, which includes 0 families.
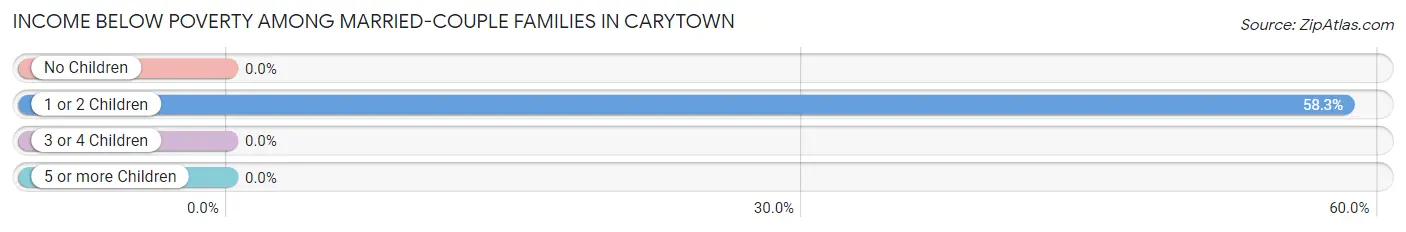
| Children | Above Poverty | Below Poverty |
| No Children | 74 (100.0%) | 0 (0.0%) |
| 1 or 2 Children | 5 (41.7%) | 7 (58.3%) |
| 3 or 4 Children | 4 (100.0%) | 0 (0.0%) |
| 5 or more Children | 0 (0.0%) | 0 (0.0%) |
| Total | 83 (92.2%) | 7 (7.8%) |
Income Below Poverty Among Single-Parent Households in Carytown
| Children | Single Father | Single Mother |
| No Children | 0 (0.0%) | 0 (0.0%) |
| 1 or 2 Children | 0 (0.0%) | 0 (0.0%) |
| 3 or 4 Children | 0 (0.0%) | 0 (0.0%) |
| 5 or more Children | 0 (0.0%) | 0 (0.0%) |
| Total | 0 (0.0%) | 0 (0.0%) |
Income Below Poverty Among Married-Couple vs Single-Parent Households in Carytown
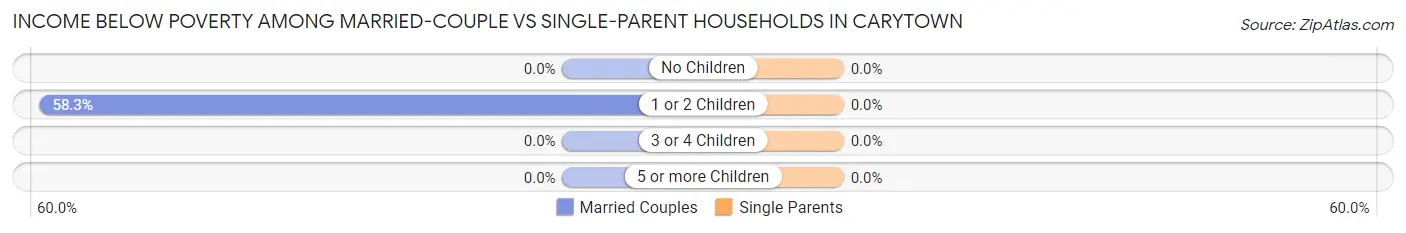
| Children | Married-Couple Families | Single-Parent Households |
| No Children | 0 (0.0%) | 0 (0.0%) |
| 1 or 2 Children | 7 (58.3%) | 0 (0.0%) |
| 3 or 4 Children | 0 (0.0%) | 0 (0.0%) |
| 5 or more Children | 0 (0.0%) | 0 (0.0%) |
| Total | 7 (7.8%) | 0 (0.0%) |
Race in Carytown
The most populous races in Carytown are White / Caucasian (268 | 88.2%), Two or more Races (35 | 11.5%), and Native / Alaskan (1 | 0.3%).
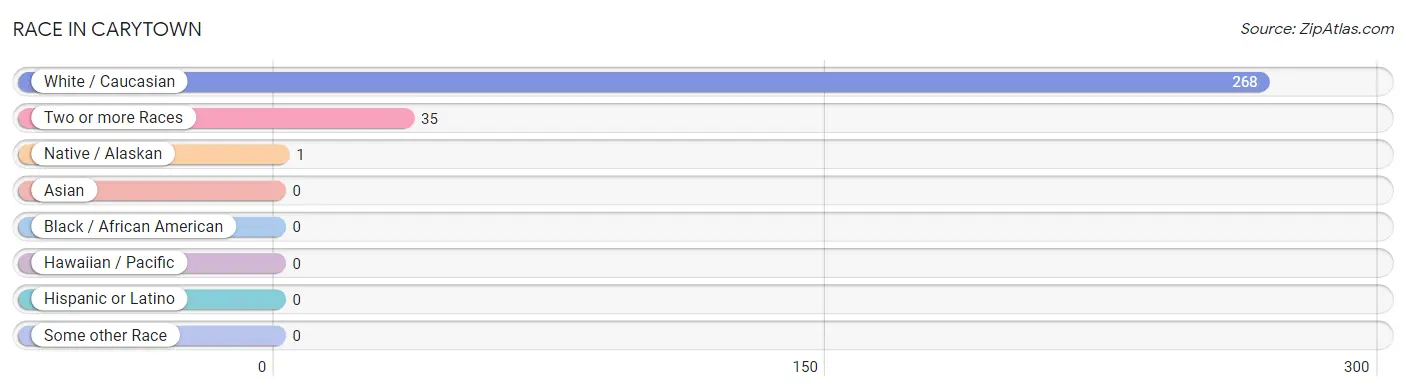
| Race | # Population | % Population |
| Asian | 0 | 0.0% |
| Black / African American | 0 | 0.0% |
| Hawaiian / Pacific | 0 | 0.0% |
| Hispanic or Latino | 0 | 0.0% |
| Native / Alaskan | 1 | 0.3% |
| White / Caucasian | 268 | 88.2% |
| Two or more Races | 35 | 11.5% |
| Some other Race | 0 | 0.0% |
| Total | 304 | 100.0% |
Ancestry in Carytown
The most populous ancestries reported in Carytown are German (85 | 28.0%), English (35 | 11.5%), Irish (29 | 9.5%), American (27 | 8.9%), and Scottish (27 | 8.9%), together accounting for 66.8% of all Carytown residents.
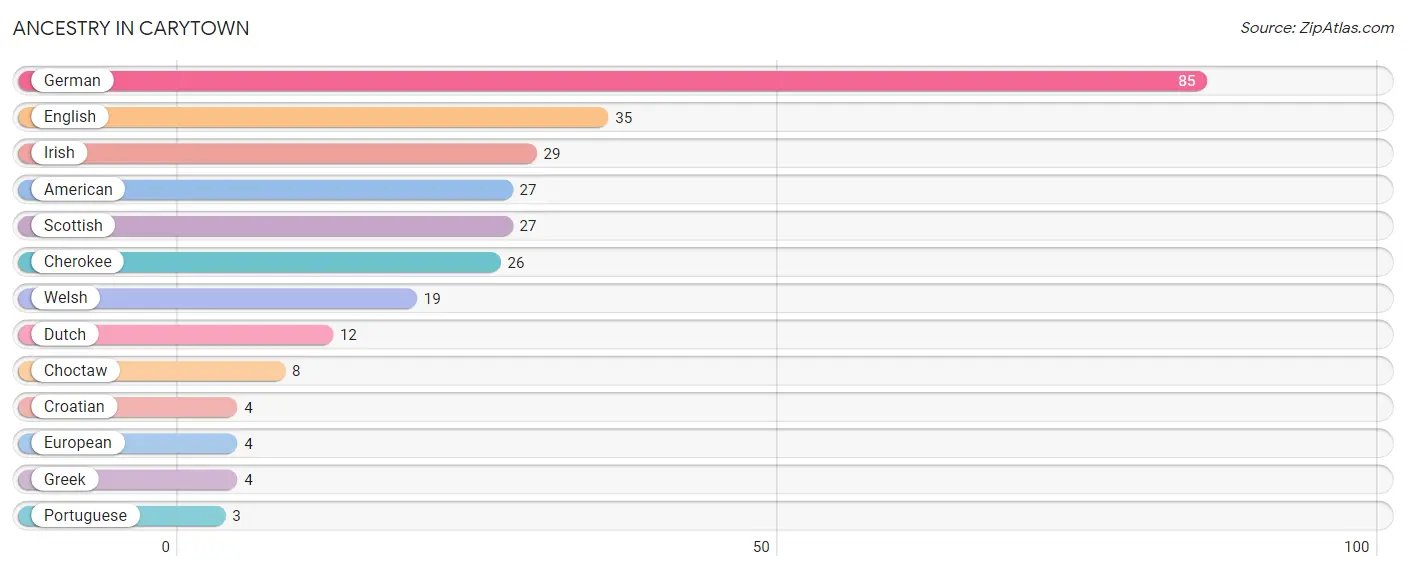
| Ancestry | # Population | % Population |
| American | 27 | 8.9% |
| Cherokee | 26 | 8.6% |
| Choctaw | 8 | 2.6% |
| Croatian | 4 | 1.3% |
| Dutch | 12 | 4.0% |
| English | 35 | 11.5% |
| European | 4 | 1.3% |
| German | 85 | 28.0% |
| Greek | 4 | 1.3% |
| Irish | 29 | 9.5% |
| Portuguese | 3 | 1.0% |
| Scottish | 27 | 8.9% |
| Welsh | 19 | 6.2% | View All 13 Rows |
Immigrants in Carytown

| Immigration Origin | # Population | % Population | View All 0 Rows |
Sex and Age in Carytown
Sex and Age in Carytown
The most populous age groups in Carytown are 55 to 59 Years (27 | 17.2%) for men and 60 to 64 Years (21 | 14.3%) for women.
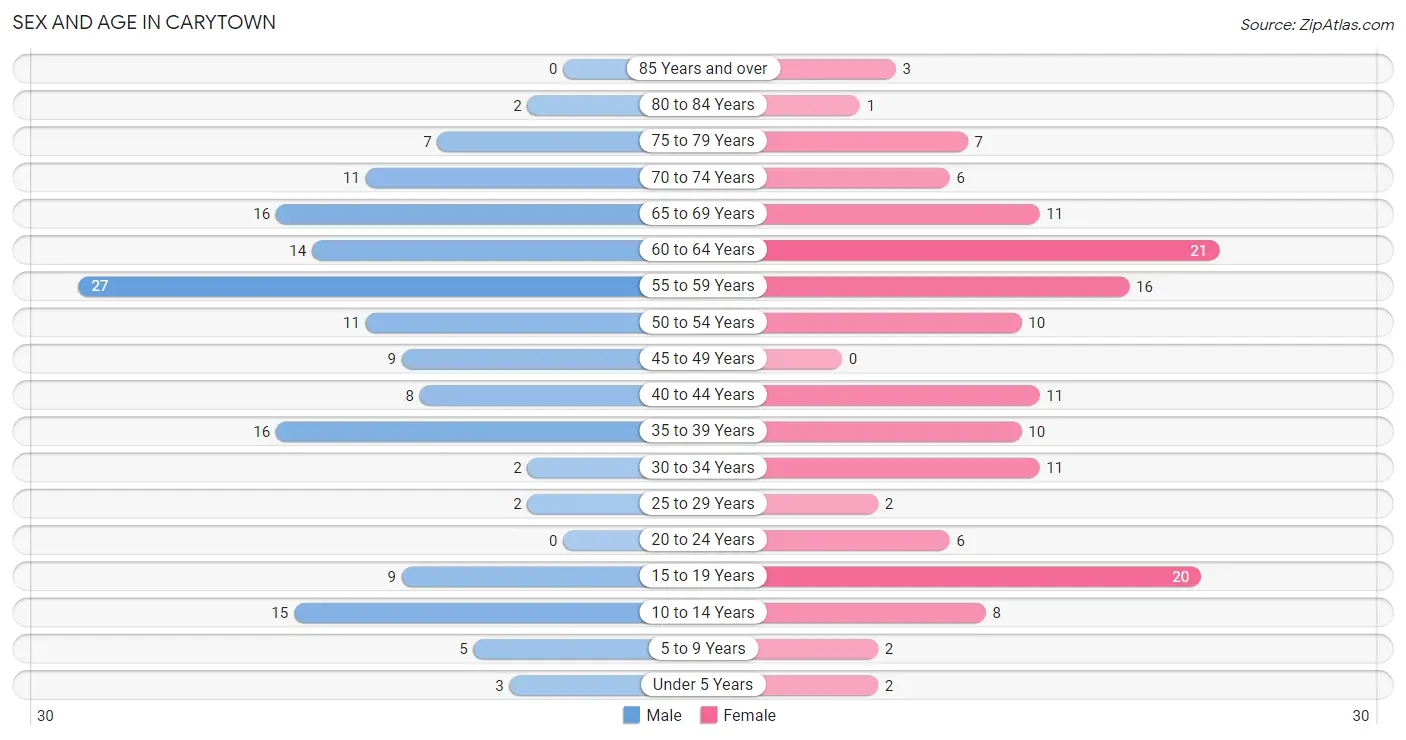
| Age Bracket | Male | Female |
| Under 5 Years | 3 (1.9%) | 2 (1.4%) |
| 5 to 9 Years | 5 (3.2%) | 2 (1.4%) |
| 10 to 14 Years | 15 (9.6%) | 8 (5.4%) |
| 15 to 19 Years | 9 (5.7%) | 20 (13.6%) |
| 20 to 24 Years | 0 (0.0%) | 6 (4.1%) |
| 25 to 29 Years | 2 (1.3%) | 2 (1.4%) |
| 30 to 34 Years | 2 (1.3%) | 11 (7.5%) |
| 35 to 39 Years | 16 (10.2%) | 10 (6.8%) |
| 40 to 44 Years | 8 (5.1%) | 11 (7.5%) |
| 45 to 49 Years | 9 (5.7%) | 0 (0.0%) |
| 50 to 54 Years | 11 (7.0%) | 10 (6.8%) |
| 55 to 59 Years | 27 (17.2%) | 16 (10.9%) |
| 60 to 64 Years | 14 (8.9%) | 21 (14.3%) |
| 65 to 69 Years | 16 (10.2%) | 11 (7.5%) |
| 70 to 74 Years | 11 (7.0%) | 6 (4.1%) |
| 75 to 79 Years | 7 (4.5%) | 7 (4.8%) |
| 80 to 84 Years | 2 (1.3%) | 1 (0.7%) |
| 85 Years and over | 0 (0.0%) | 3 (2.0%) |
| Total | 157 (100.0%) | 147 (100.0%) |
Families and Households in Carytown
Median Family Size in Carytown
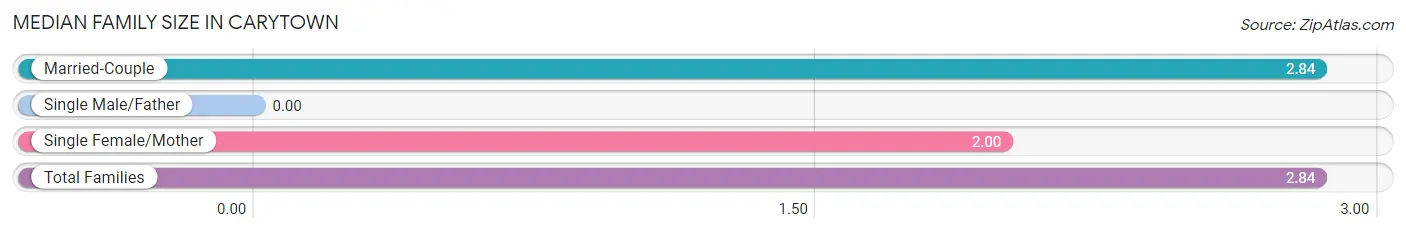
| Family Type | # Families | Family Size |
| Married-Couple | 90 (98.9%) | 2.84 |
| Single Male/Father | 0 (0.0%) | - |
| Single Female/Mother | 1 (1.1%) | 2.00 |
| Total Families | 91 (100.0%) | 2.84 |
Median Household Size in Carytown
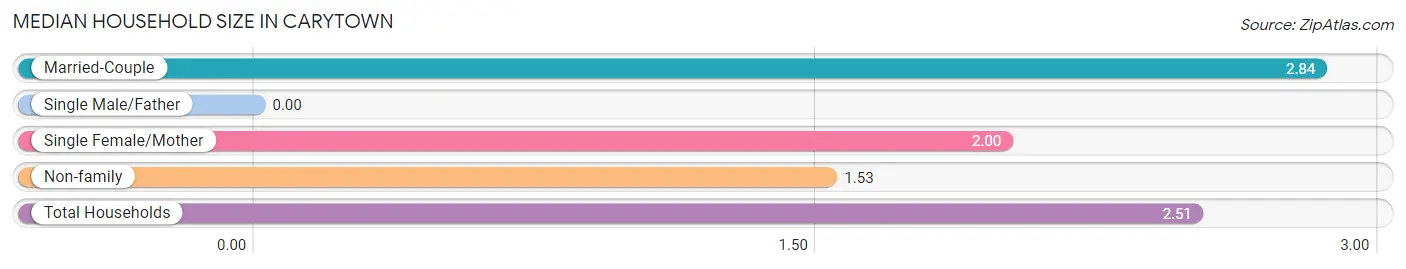
| Household Type | # Households | Household Size |
| Married-Couple | 90 (74.4%) | 2.84 |
| Single Male/Father | 0 (0.0%) | - |
| Single Female/Mother | 1 (0.8%) | 2.00 |
| Non-family | 30 (24.8%) | 1.53 |
| Total Households | 121 (100.0%) | 2.51 |
Household Size by Marriage Status in Carytown
Out of a total of 121 households in Carytown, 91 (75.2%) are family households, while 30 (24.8%) are nonfamily households. The most numerous type of family households are 2-person households, comprising 63, and the most common type of nonfamily households are 1-person households, comprising 16.
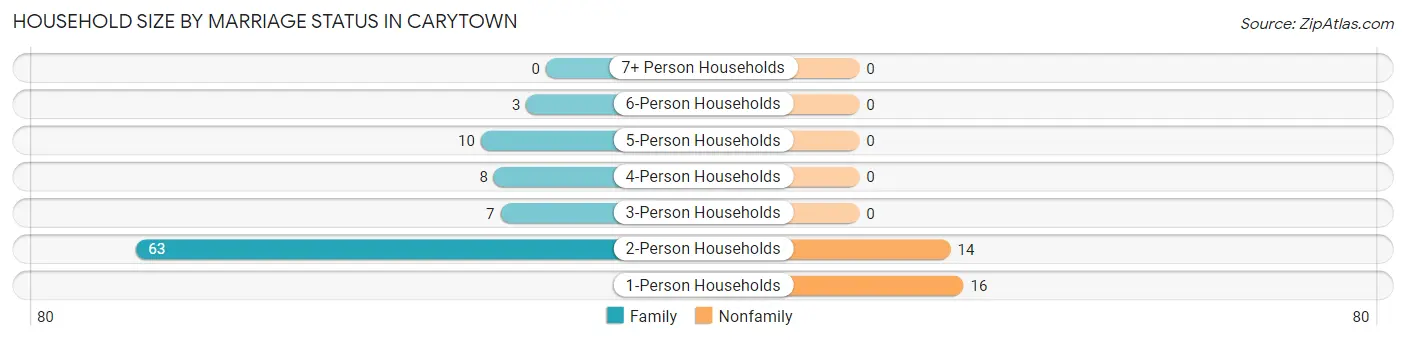
| Household Size | Family Households | Nonfamily Households |
| 1-Person Households | - | 16 (13.2%) |
| 2-Person Households | 63 (52.1%) | 14 (11.6%) |
| 3-Person Households | 7 (5.8%) | 0 (0.0%) |
| 4-Person Households | 8 (6.6%) | 0 (0.0%) |
| 5-Person Households | 10 (8.3%) | 0 (0.0%) |
| 6-Person Households | 3 (2.5%) | 0 (0.0%) |
| 7+ Person Households | 0 (0.0%) | 0 (0.0%) |
| Total | 91 (75.2%) | 30 (24.8%) |
Female Fertility in Carytown
Fertility by Age in Carytown
| Age Bracket | Women with Births | Births / 1,000 Women |
| 15 to 19 years | 0 (0.0%) | 0.0 |
| 20 to 34 years | 0 (0.0%) | 0.0 |
| 35 to 50 years | 0 (0.0%) | 0.0 |
| Total | 0 (0.0%) | 0.0 |
Fertility by Age by Marriage Status in Carytown
| Age Bracket | Married | Unmarried |
| 15 to 19 years | 0 (0.0%) | 0 (0.0%) |
| 20 to 34 years | 0 (0.0%) | 0 (0.0%) |
| 35 to 50 years | 0 (0.0%) | 0 (0.0%) |
| Total | 0 (0.0%) | 0 (0.0%) |
Fertility by Education in Carytown
| Educational Attainment | Women with Births | Births / 1,000 Women |
| Less than High School | 0 (0.0%) | 0.0 |
| High School Diploma | 0 (0.0%) | 0.0 |
| College or Associate's Degree | 0 (0.0%) | 0.0 |
| Bachelor's Degree | 0 (0.0%) | 0.0 |
| Graduate Degree | 0 (0.0%) | 0.0 |
| Total | 0 (0.0%) | 0.0 |
Fertility by Education by Marriage Status in Carytown
| Educational Attainment | Married | Unmarried |
| Less than High School | 0 (0.0%) | 0 (0.0%) |
| High School Diploma | 0 (0.0%) | 0 (0.0%) |
| College or Associate's Degree | 0 (0.0%) | 0 (0.0%) |
| Bachelor's Degree | 0 (0.0%) | 0 (0.0%) |
| Graduate Degree | 0 (0.0%) | 0 (0.0%) |
| Total | 0 (0.0%) | 0 (0.0%) |
Employment Characteristics in Carytown
Employment by Class of Employer in Carytown
Among the 129 employed individuals in Carytown, private company employees (86 | 66.7%), local government employees (17 | 13.2%), and not-for-profit organizations (14 | 10.8%) make up the most common classes of employment.
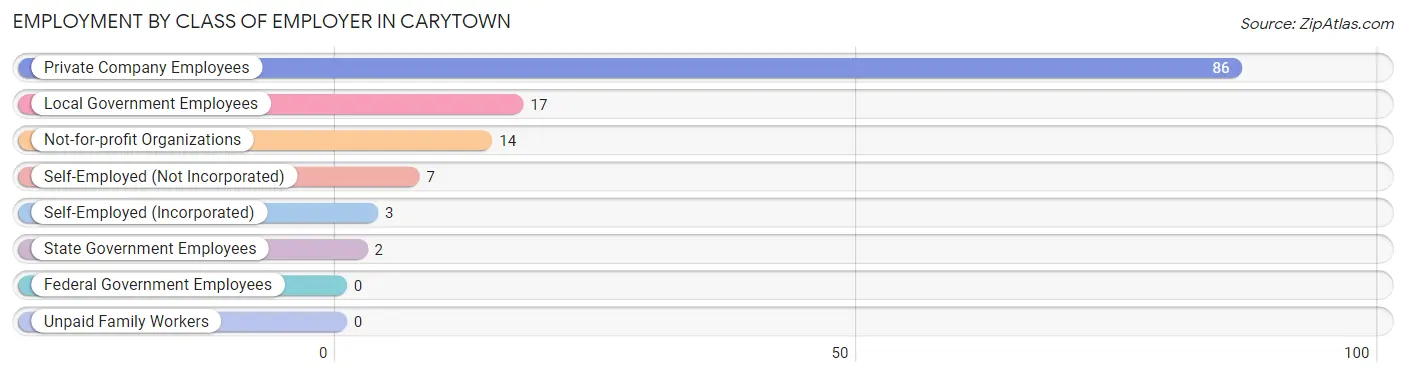
| Employer Class | # Employees | % Employees |
| Private Company Employees | 86 | 66.7% |
| Self-Employed (Incorporated) | 3 | 2.3% |
| Self-Employed (Not Incorporated) | 7 | 5.4% |
| Not-for-profit Organizations | 14 | 10.8% |
| Local Government Employees | 17 | 13.2% |
| State Government Employees | 2 | 1.5% |
| Federal Government Employees | 0 | 0.0% |
| Unpaid Family Workers | 0 | 0.0% |
| Total | 129 | 100.0% |
Employment Status by Age in Carytown
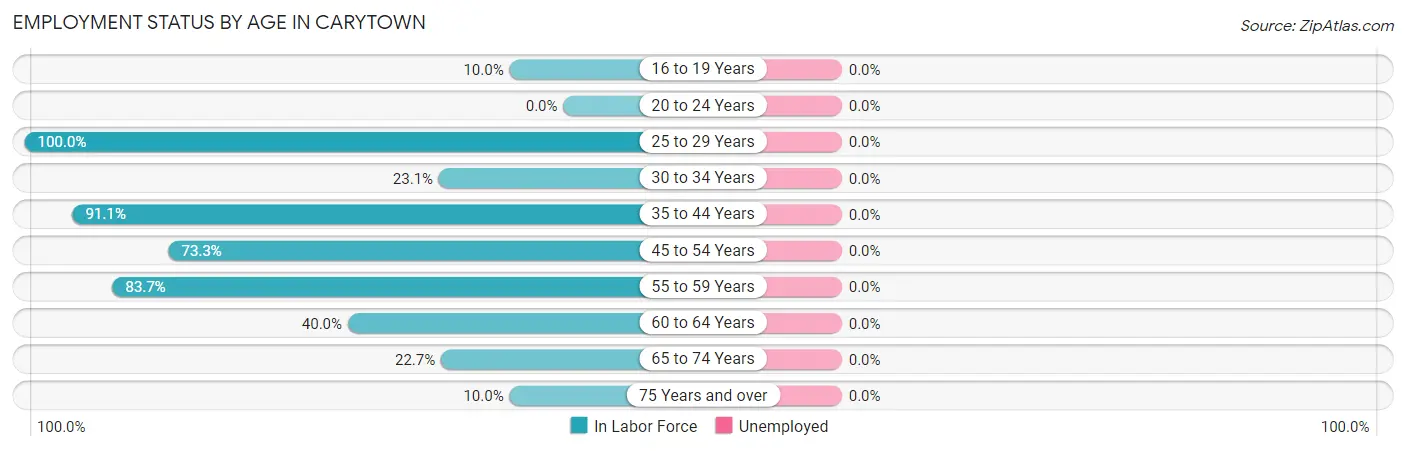
| Age Bracket | In Labor Force | Unemployed |
| 16 to 19 Years | 2 (10.0%) | 0 (0.0%) |
| 20 to 24 Years | 0 (0.0%) | 0 (0.0%) |
| 25 to 29 Years | 4 (100.0%) | 0 (0.0%) |
| 30 to 34 Years | 3 (23.1%) | 0 (0.0%) |
| 35 to 44 Years | 41 (91.1%) | 0 (0.0%) |
| 45 to 54 Years | 22 (73.3%) | 0 (0.0%) |
| 55 to 59 Years | 36 (83.7%) | 0 (0.0%) |
| 60 to 64 Years | 14 (40.0%) | 0 (0.0%) |
| 65 to 74 Years | 10 (22.7%) | 0 (0.0%) |
| 75 Years and over | 2 (10.0%) | 0 (0.0%) |
| Total | 134 (51.5%) | 0 (0.0%) |
Employment Status by Educational Attainment in Carytown
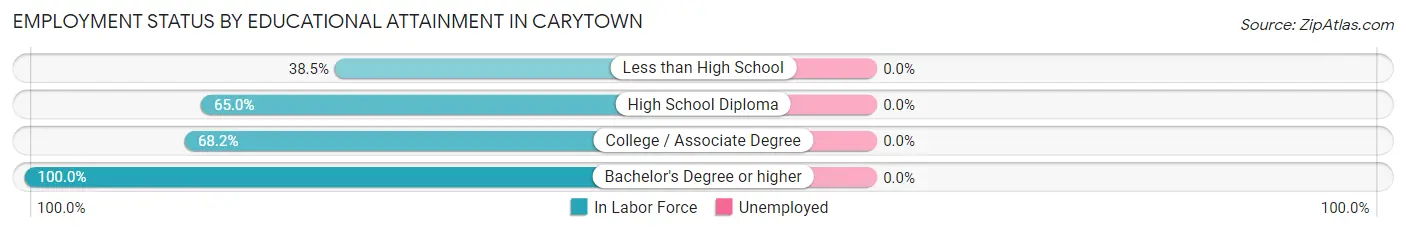
| Educational Attainment | In Labor Force | Unemployed |
| Less than High School | 5 (38.5%) | 0 (0.0%) |
| High School Diploma | 52 (65.0%) | 0 (0.0%) |
| College / Associate Degree | 30 (68.2%) | 0 (0.0%) |
| Bachelor's Degree or higher | 33 (100.0%) | 0 (0.0%) |
| Total | 120 (70.6%) | 0 (0.0%) |
Employment Occupations by Sex in Carytown
Management, Business, Science and Arts Occupations
The most common Management, Business, Science and Arts occupations in Carytown are Community & Social Service (22 | 16.4%), Health Diagnosing & Treating (22 | 16.4%), Education Instruction & Library (19 | 14.2%), Management (18 | 13.4%), and Health Technologists (14 | 10.4%).
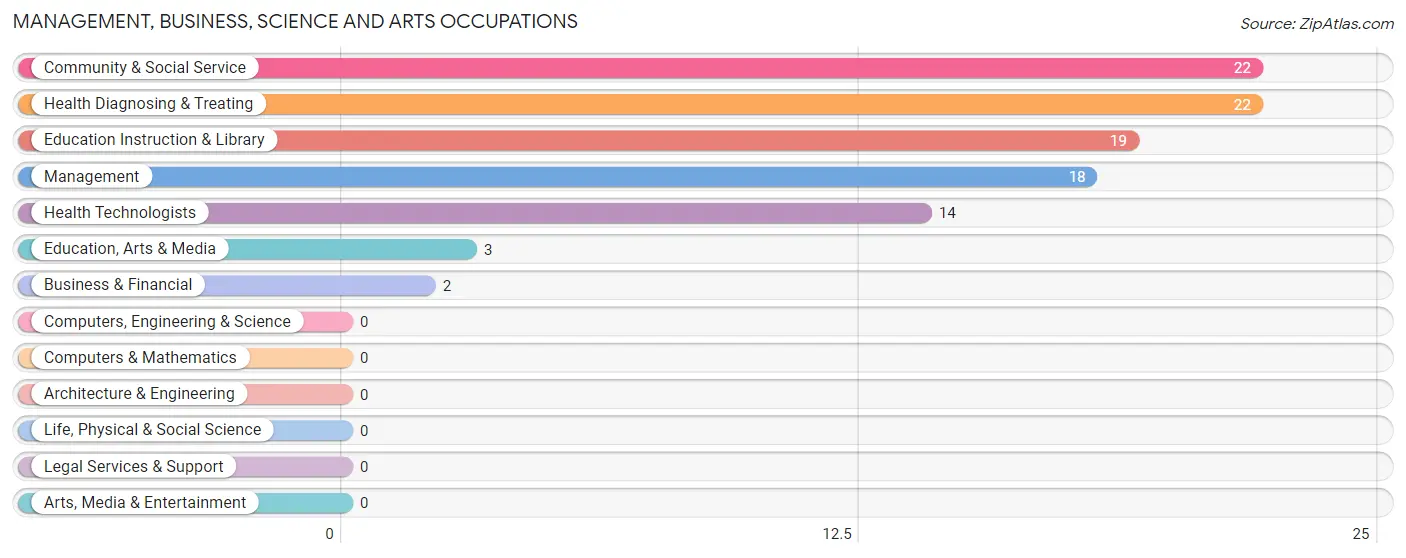
Management, Business, Science and Arts Occupations by Sex
Within the Management, Business, Science and Arts occupations in Carytown, the most male-oriented occupations are Business & Financial (100.0%), Education Instruction & Library (94.7%), and Community & Social Service (81.8%), while the most female-oriented occupations are Education, Arts & Media (100.0%), Health Technologists (100.0%), and Health Diagnosing & Treating (95.5%).
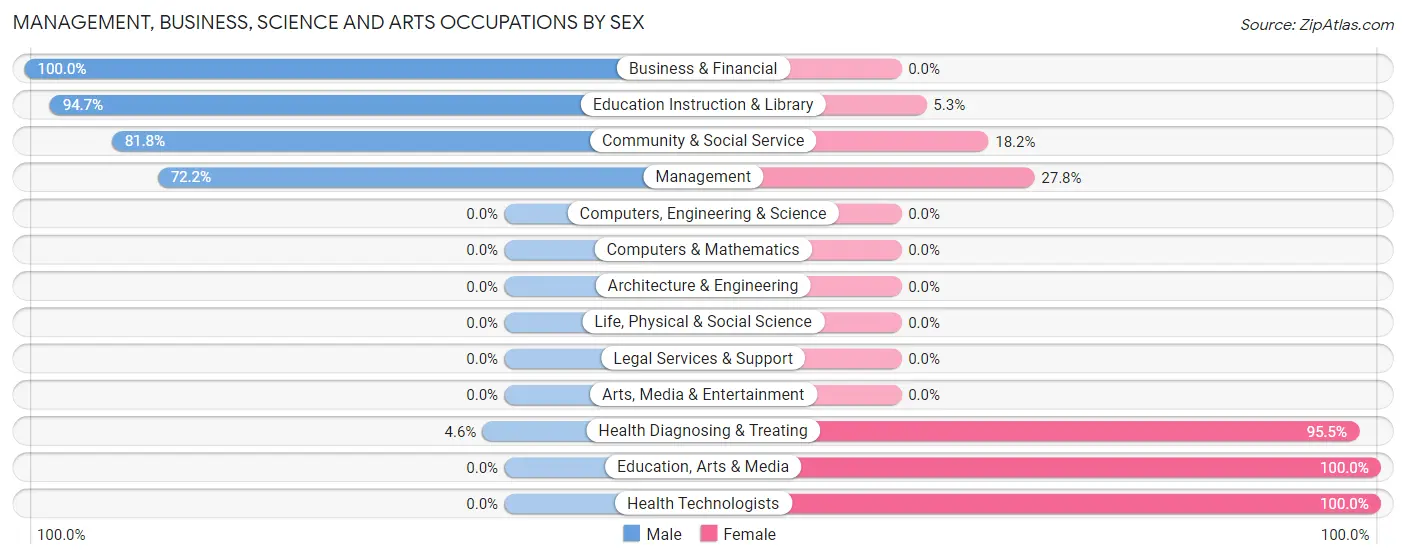
| Occupation | Male | Female |
| Management | 13 (72.2%) | 5 (27.8%) |
| Business & Financial | 2 (100.0%) | 0 (0.0%) |
| Computers, Engineering & Science | 0 (0.0%) | 0 (0.0%) |
| Computers & Mathematics | 0 (0.0%) | 0 (0.0%) |
| Architecture & Engineering | 0 (0.0%) | 0 (0.0%) |
| Life, Physical & Social Science | 0 (0.0%) | 0 (0.0%) |
| Community & Social Service | 18 (81.8%) | 4 (18.2%) |
| Education, Arts & Media | 0 (0.0%) | 3 (100.0%) |
| Legal Services & Support | 0 (0.0%) | 0 (0.0%) |
| Education Instruction & Library | 18 (94.7%) | 1 (5.3%) |
| Arts, Media & Entertainment | 0 (0.0%) | 0 (0.0%) |
| Health Diagnosing & Treating | 1 (4.5%) | 21 (95.5%) |
| Health Technologists | 0 (0.0%) | 14 (100.0%) |
| Total (Category) | 34 (53.1%) | 30 (46.9%) |
| Total (Overall) | 76 (56.7%) | 58 (43.3%) |
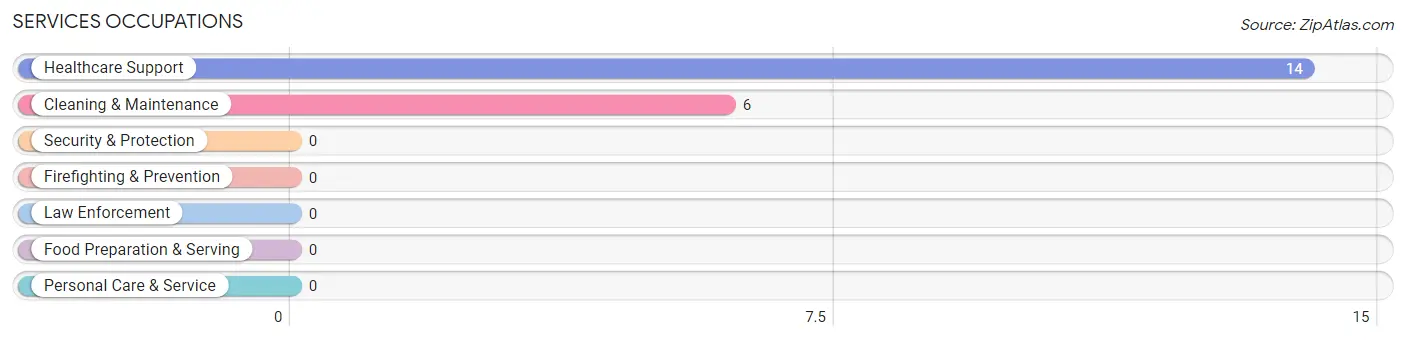
Services Occupations
The most common Services occupations in Carytown are Healthcare Support (14 | 10.4%), and Cleaning & Maintenance (6 | 4.5%).
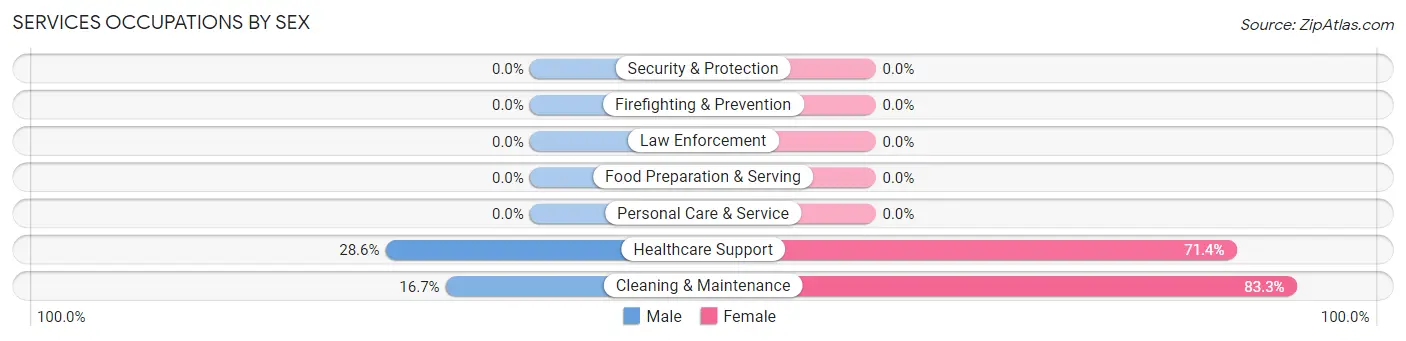
Services Occupations by Sex
Within the Services occupations in Carytown, the most male-oriented occupations are Healthcare Support (28.6%), and Cleaning & Maintenance (16.7%), while the most female-oriented occupations are Cleaning & Maintenance (83.3%), and Healthcare Support (71.4%).
| Occupation | Male | Female |
| Healthcare Support | 4 (28.6%) | 10 (71.4%) |
| Security & Protection | 0 (0.0%) | 0 (0.0%) |
| Firefighting & Prevention | 0 (0.0%) | 0 (0.0%) |
| Law Enforcement | 0 (0.0%) | 0 (0.0%) |
| Food Preparation & Serving | 0 (0.0%) | 0 (0.0%) |
| Cleaning & Maintenance | 1 (16.7%) | 5 (83.3%) |
| Personal Care & Service | 0 (0.0%) | 0 (0.0%) |
| Total (Category) | 5 (25.0%) | 15 (75.0%) |
| Total (Overall) | 76 (56.7%) | 58 (43.3%) |
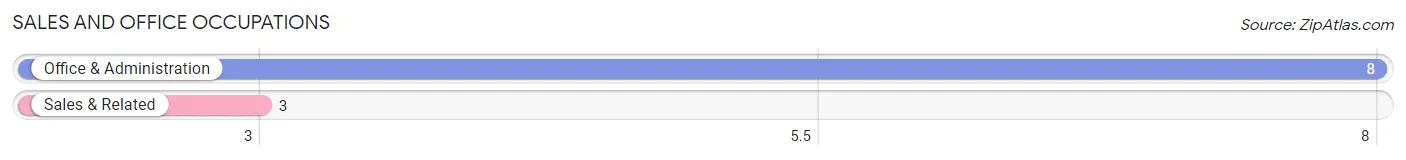
Sales and Office Occupations
The most common Sales and Office occupations in Carytown are Office & Administration (8 | 6.0%), and Sales & Related (3 | 2.2%).
Sales and Office Occupations by Sex
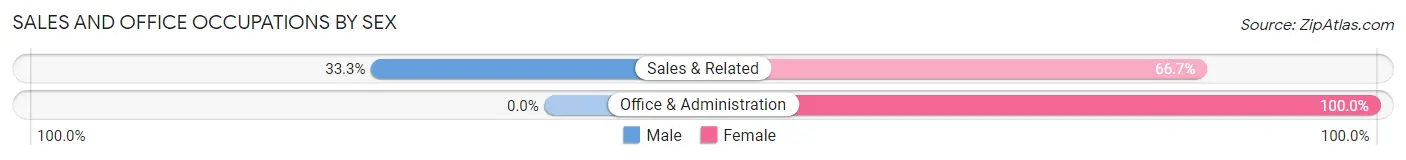
| Occupation | Male | Female |
| Sales & Related | 1 (33.3%) | 2 (66.7%) |
| Office & Administration | 0 (0.0%) | 8 (100.0%) |
| Total (Category) | 1 (9.1%) | 10 (90.9%) |
| Total (Overall) | 76 (56.7%) | 58 (43.3%) |
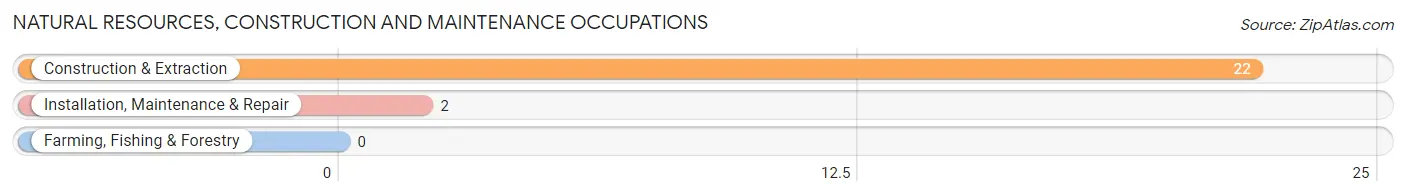
Natural Resources, Construction and Maintenance Occupations
The most common Natural Resources, Construction and Maintenance occupations in Carytown are Construction & Extraction (22 | 16.4%), and Installation, Maintenance & Repair (2 | 1.5%).
Natural Resources, Construction and Maintenance Occupations by Sex
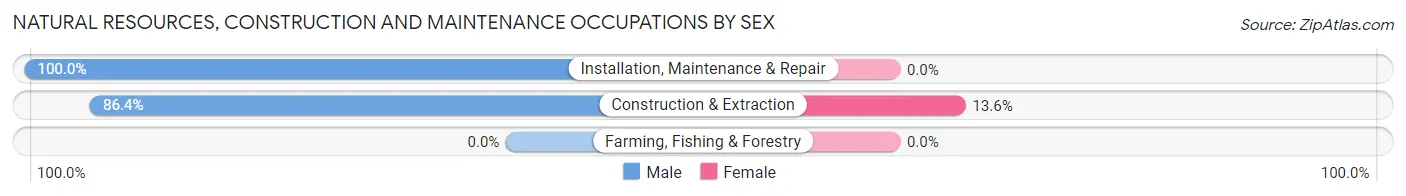
| Occupation | Male | Female |
| Farming, Fishing & Forestry | 0 (0.0%) | 0 (0.0%) |
| Construction & Extraction | 19 (86.4%) | 3 (13.6%) |
| Installation, Maintenance & Repair | 2 (100.0%) | 0 (0.0%) |
| Total (Category) | 21 (87.5%) | 3 (12.5%) |
| Total (Overall) | 76 (56.7%) | 58 (43.3%) |
Production, Transportation and Moving Occupations
The most common Production, Transportation and Moving occupations in Carytown are Production (10 | 7.5%), Material Moving (3 | 2.2%), and Transportation (2 | 1.5%).
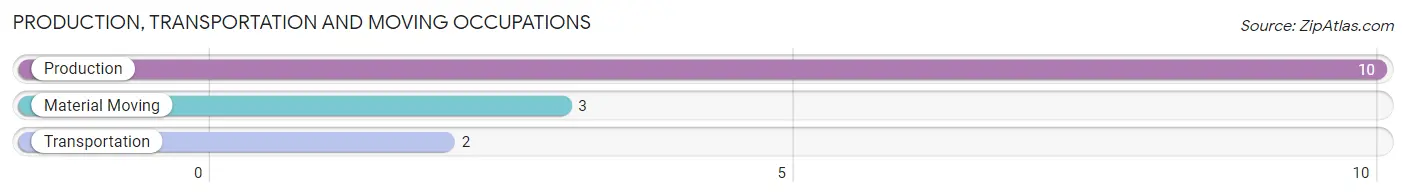
Production, Transportation and Moving Occupations by Sex
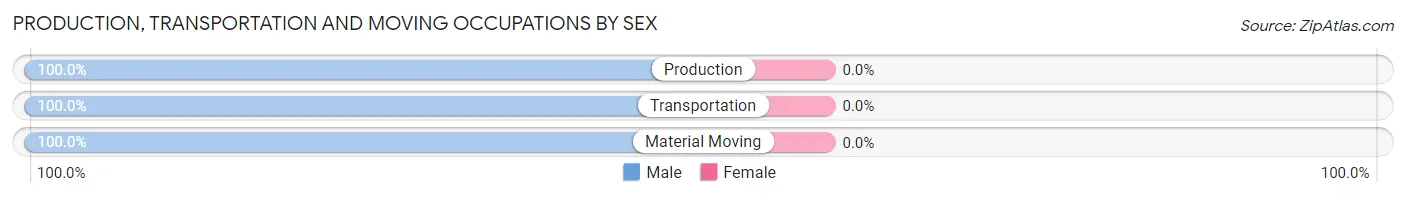
| Occupation | Male | Female |
| Production | 10 (100.0%) | 0 (0.0%) |
| Transportation | 2 (100.0%) | 0 (0.0%) |
| Material Moving | 3 (100.0%) | 0 (0.0%) |
| Total (Category) | 15 (100.0%) | 0 (0.0%) |
| Total (Overall) | 76 (56.7%) | 58 (43.3%) |
Employment Industries by Sex in Carytown
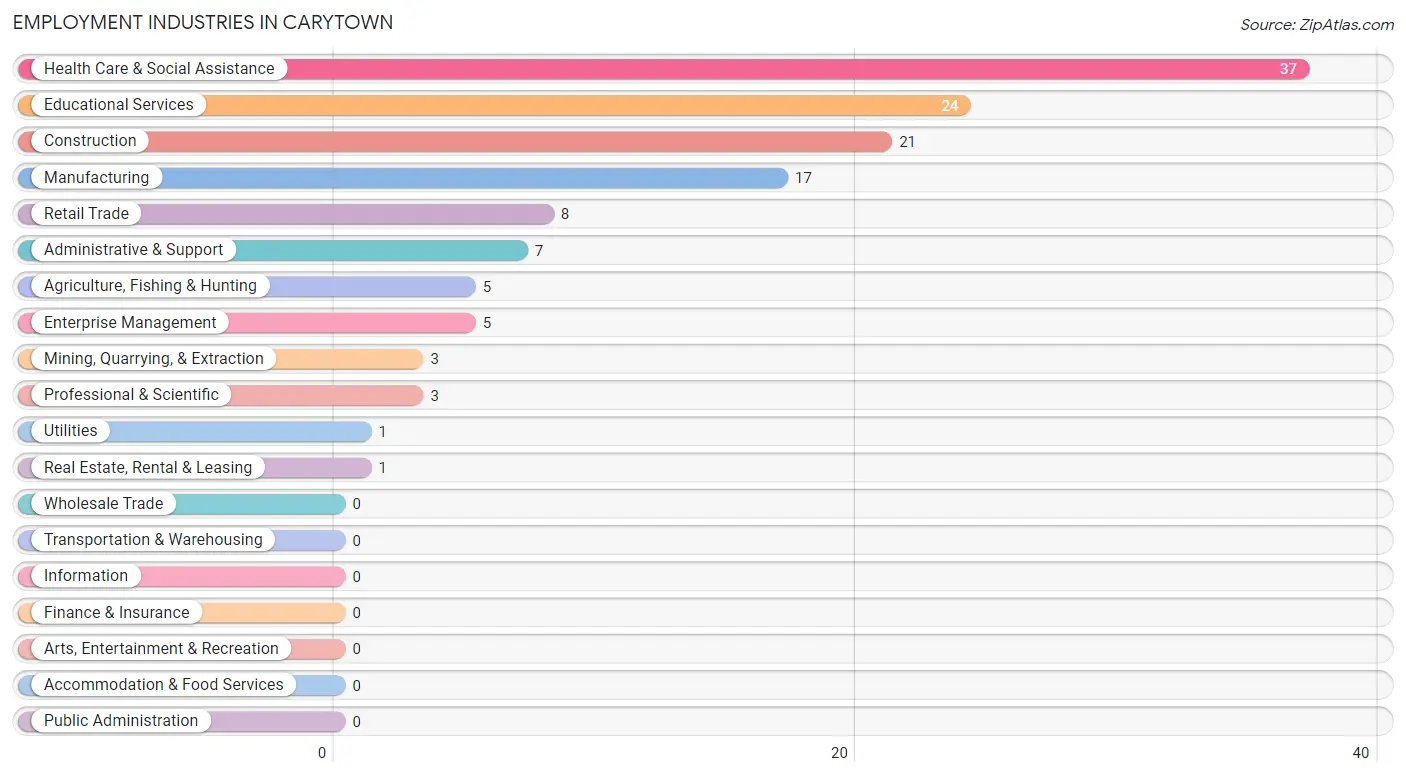
Employment Industries in Carytown
The major employment industries in Carytown include Health Care & Social Assistance (37 | 27.6%), Educational Services (24 | 17.9%), Construction (21 | 15.7%), Manufacturing (17 | 12.7%), and Retail Trade (8 | 6.0%).
Employment Industries by Sex in Carytown
The Carytown industries that see more men than women are Agriculture, Fishing & Hunting (100.0%), Mining, Quarrying, & Extraction (100.0%), and Utilities (100.0%), whereas the industries that tend to have a higher number of women are Real Estate, Rental & Leasing (100.0%), Enterprise Management (100.0%), and Health Care & Social Assistance (86.5%).
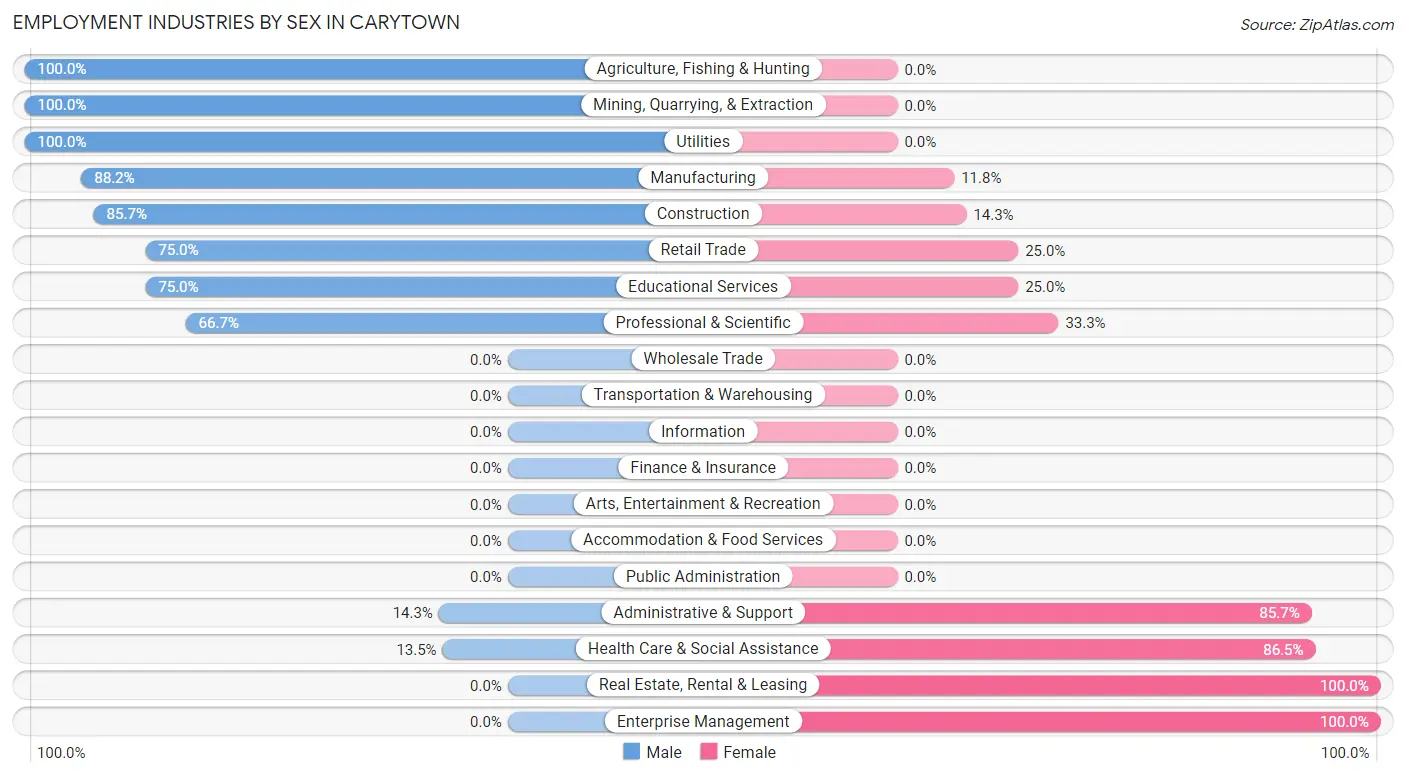
| Industry | Male | Female |
| Agriculture, Fishing & Hunting | 5 (100.0%) | 0 (0.0%) |
| Mining, Quarrying, & Extraction | 3 (100.0%) | 0 (0.0%) |
| Construction | 18 (85.7%) | 3 (14.3%) |
| Manufacturing | 15 (88.2%) | 2 (11.8%) |
| Wholesale Trade | 0 (0.0%) | 0 (0.0%) |
| Retail Trade | 6 (75.0%) | 2 (25.0%) |
| Transportation & Warehousing | 0 (0.0%) | 0 (0.0%) |
| Utilities | 1 (100.0%) | 0 (0.0%) |
| Information | 0 (0.0%) | 0 (0.0%) |
| Finance & Insurance | 0 (0.0%) | 0 (0.0%) |
| Real Estate, Rental & Leasing | 0 (0.0%) | 1 (100.0%) |
| Professional & Scientific | 2 (66.7%) | 1 (33.3%) |
| Enterprise Management | 0 (0.0%) | 5 (100.0%) |
| Administrative & Support | 1 (14.3%) | 6 (85.7%) |
| Educational Services | 18 (75.0%) | 6 (25.0%) |
| Health Care & Social Assistance | 5 (13.5%) | 32 (86.5%) |
| Arts, Entertainment & Recreation | 0 (0.0%) | 0 (0.0%) |
| Accommodation & Food Services | 0 (0.0%) | 0 (0.0%) |
| Public Administration | 0 (0.0%) | 0 (0.0%) |
| Total | 76 (56.7%) | 58 (43.3%) |
Education in Carytown
School Enrollment in Carytown
The most common levels of schooling among the 77 students in Carytown are high school (27 | 35.1%), middle school (23 | 29.9%), and college / undergraduate (18 | 23.4%).
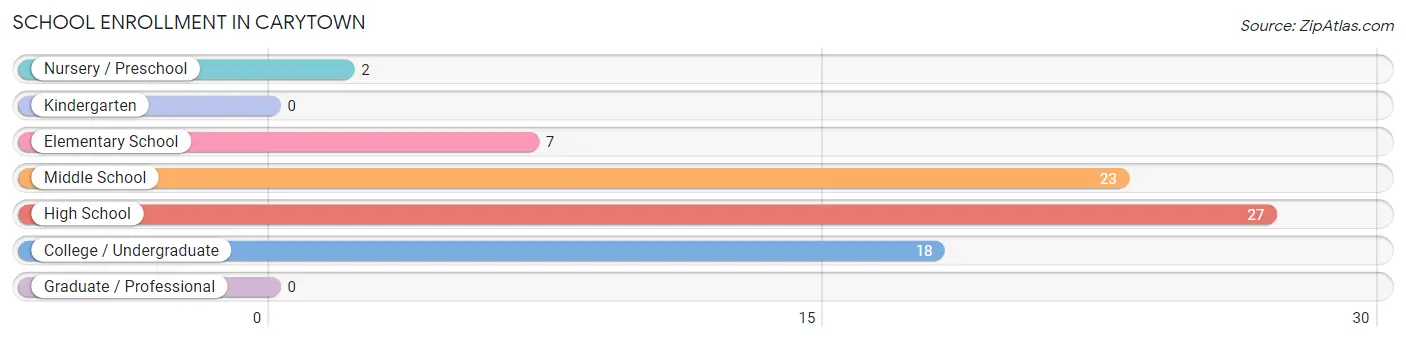
| School Level | # Students | % Students |
| Nursery / Preschool | 2 | 2.6% |
| Kindergarten | 0 | 0.0% |
| Elementary School | 7 | 9.1% |
| Middle School | 23 | 29.9% |
| High School | 27 | 35.1% |
| College / Undergraduate | 18 | 23.4% |
| Graduate / Professional | 0 | 0.0% |
| Total | 77 | 100.0% |
School Enrollment by Age by Funding Source in Carytown
Out of a total of 77 students who are enrolled in schools in Carytown, 8 (10.4%) attend a private institution, while the remaining 69 (89.6%) are enrolled in public schools. The age group of 3 to 4 year olds has the highest likelihood of being enrolled in private schools, with 2 (100.0% in the age bracket) enrolled. Conversely, the age group of 5 to 9 year old has the lowest likelihood of being enrolled in a private school, with 7 (100.0% in the age bracket) attending a public institution.
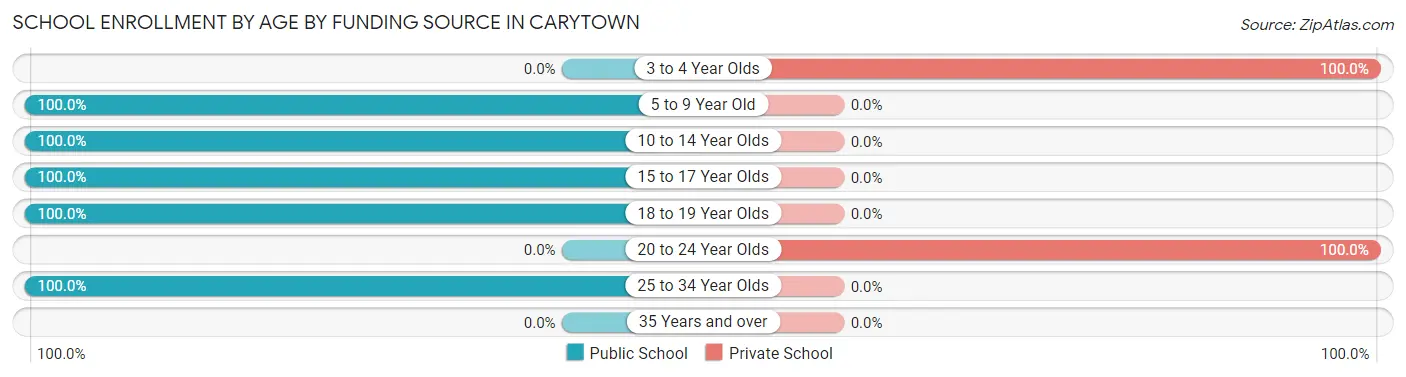
| Age Bracket | Public School | Private School |
| 3 to 4 Year Olds | 0 (0.0%) | 2 (100.0%) |
| 5 to 9 Year Old | 7 (100.0%) | 0 (0.0%) |
| 10 to 14 Year Olds | 23 (100.0%) | 0 (0.0%) |
| 15 to 17 Year Olds | 9 (100.0%) | 0 (0.0%) |
| 18 to 19 Year Olds | 20 (100.0%) | 0 (0.0%) |
| 20 to 24 Year Olds | 0 (0.0%) | 6 (100.0%) |
| 25 to 34 Year Olds | 10 (100.0%) | 0 (0.0%) |
| 35 Years and over | 0 (0.0%) | 0 (0.0%) |
| Total | 69 (89.6%) | 8 (10.4%) |
Educational Attainment by Field of Study in Carytown
Education (28 | 35.9%), bio, nature & agricultural (16 | 20.5%), science & technology (13 | 16.7%), computers & mathematics (4 | 5.1%), and psychology (4 | 5.1%) are the most common fields of study among 78 individuals in Carytown who have obtained a bachelor's degree or higher.
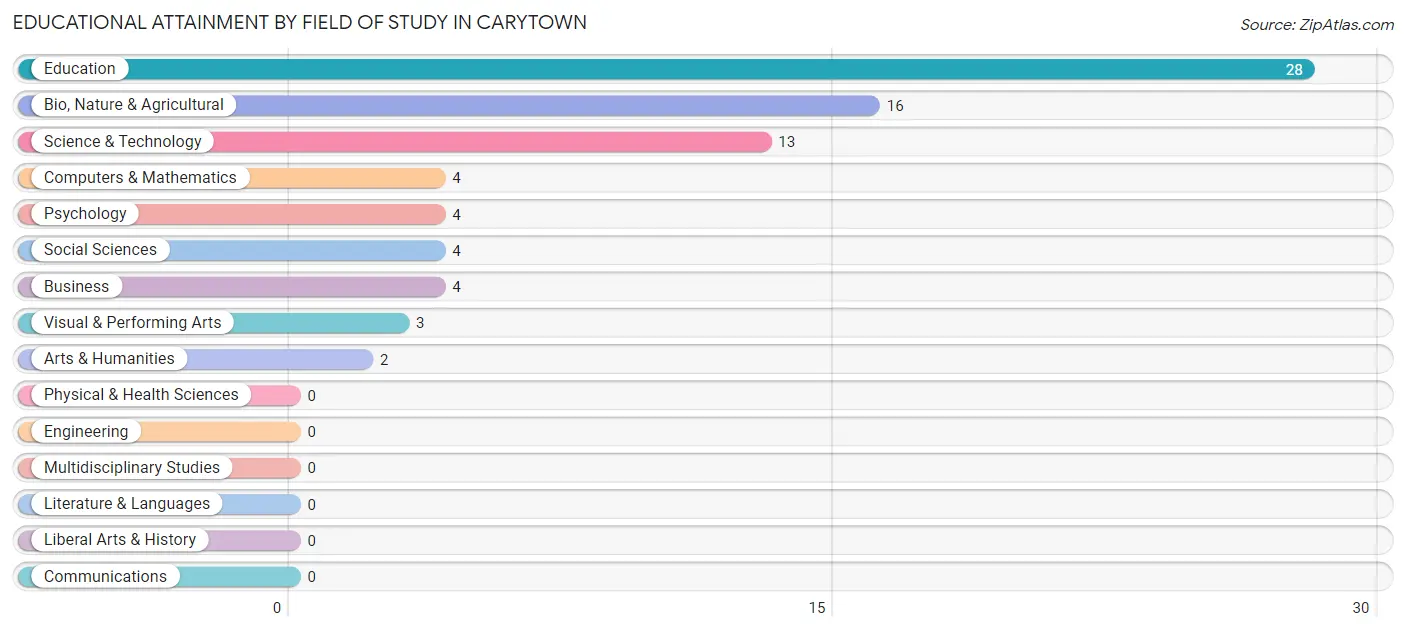
| Field of Study | # Graduates | % Graduates |
| Computers & Mathematics | 4 | 5.1% |
| Bio, Nature & Agricultural | 16 | 20.5% |
| Physical & Health Sciences | 0 | 0.0% |
| Psychology | 4 | 5.1% |
| Social Sciences | 4 | 5.1% |
| Engineering | 0 | 0.0% |
| Multidisciplinary Studies | 0 | 0.0% |
| Science & Technology | 13 | 16.7% |
| Business | 4 | 5.1% |
| Education | 28 | 35.9% |
| Literature & Languages | 0 | 0.0% |
| Liberal Arts & History | 0 | 0.0% |
| Visual & Performing Arts | 3 | 3.8% |
| Communications | 0 | 0.0% |
| Arts & Humanities | 2 | 2.6% |
| Total | 78 | 100.0% |
Transportation & Commute in Carytown
Vehicle Availability by Sex in Carytown
The most prevalent vehicle ownership categories in Carytown are males with 2 vehicles (39, accounting for 52.7%) and females with 2 vehicles (28, making up 70.9%).
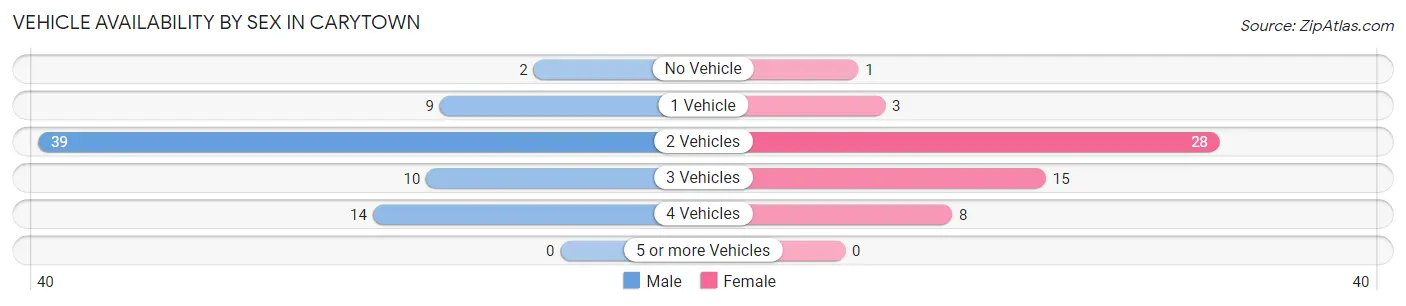
| Vehicles Available | Male | Female |
| No Vehicle | 2 (2.7%) | 1 (1.8%) |
| 1 Vehicle | 9 (12.2%) | 3 (5.4%) |
| 2 Vehicles | 39 (52.7%) | 28 (50.9%) |
| 3 Vehicles | 10 (13.5%) | 15 (27.3%) |
| 4 Vehicles | 14 (18.9%) | 8 (14.5%) |
| 5 or more Vehicles | 0 (0.0%) | 0 (0.0%) |
| Total | 74 (100.0%) | 55 (100.0%) |
Commute Time in Carytown
The most frequently occuring commute durations in Carytown are 10 to 14 minutes (36 commuters, 29.0%), 20 to 24 minutes (30 commuters, 24.2%), and 15 to 19 minutes (17 commuters, 13.7%).
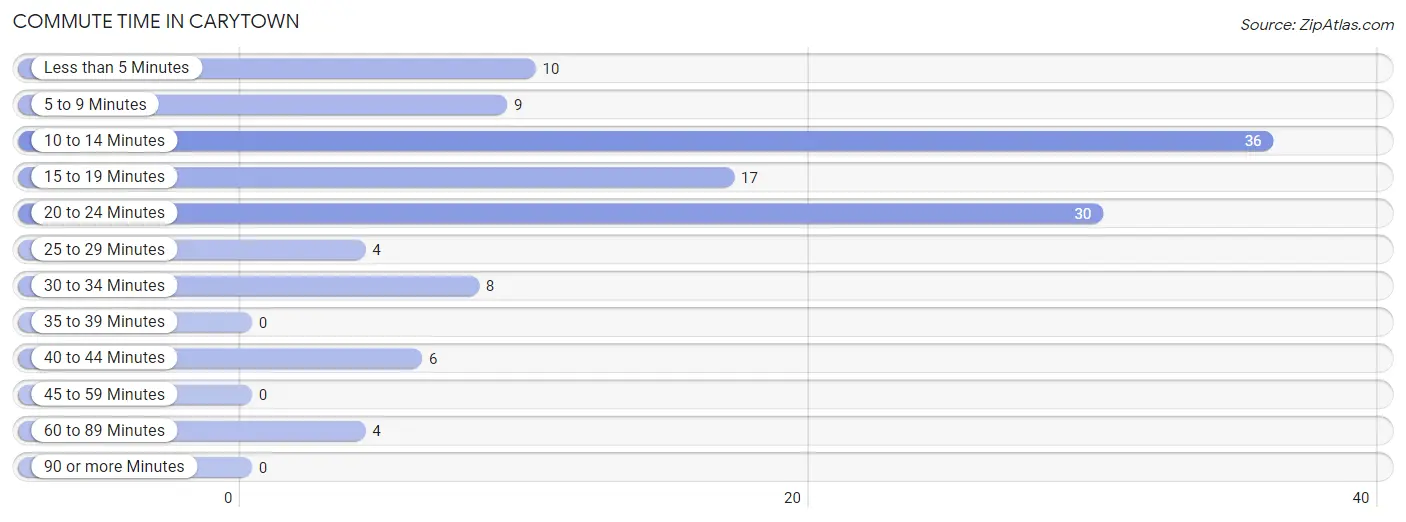
| Commute Time | # Commuters | % Commuters |
| Less than 5 Minutes | 10 | 8.1% |
| 5 to 9 Minutes | 9 | 7.3% |
| 10 to 14 Minutes | 36 | 29.0% |
| 15 to 19 Minutes | 17 | 13.7% |
| 20 to 24 Minutes | 30 | 24.2% |
| 25 to 29 Minutes | 4 | 3.2% |
| 30 to 34 Minutes | 8 | 6.5% |
| 35 to 39 Minutes | 0 | 0.0% |
| 40 to 44 Minutes | 6 | 4.8% |
| 45 to 59 Minutes | 0 | 0.0% |
| 60 to 89 Minutes | 4 | 3.2% |
| 90 or more Minutes | 0 | 0.0% |
Commute Time by Sex in Carytown
The most common commute times in Carytown are 10 to 14 minutes (25 commuters, 36.2%) for males and 15 to 19 minutes (16 commuters, 29.1%) for females.
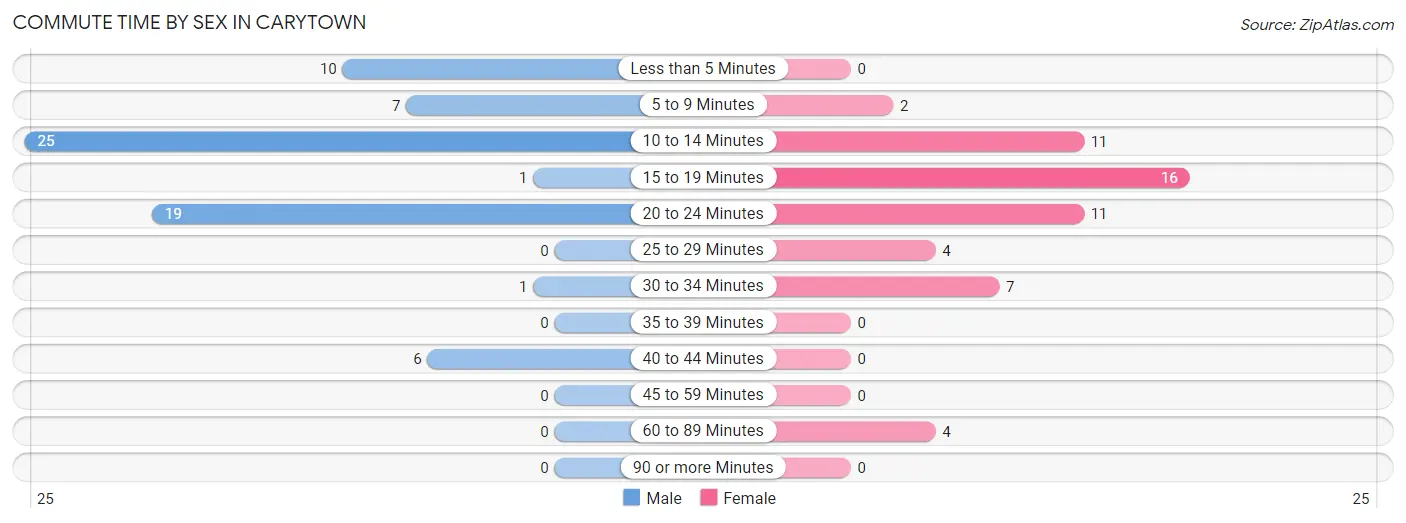
| Commute Time | Male | Female |
| Less than 5 Minutes | 10 (14.5%) | 0 (0.0%) |
| 5 to 9 Minutes | 7 (10.1%) | 2 (3.6%) |
| 10 to 14 Minutes | 25 (36.2%) | 11 (20.0%) |
| 15 to 19 Minutes | 1 (1.5%) | 16 (29.1%) |
| 20 to 24 Minutes | 19 (27.5%) | 11 (20.0%) |
| 25 to 29 Minutes | 0 (0.0%) | 4 (7.3%) |
| 30 to 34 Minutes | 1 (1.5%) | 7 (12.7%) |
| 35 to 39 Minutes | 0 (0.0%) | 0 (0.0%) |
| 40 to 44 Minutes | 6 (8.7%) | 0 (0.0%) |
| 45 to 59 Minutes | 0 (0.0%) | 0 (0.0%) |
| 60 to 89 Minutes | 0 (0.0%) | 4 (7.3%) |
| 90 or more Minutes | 0 (0.0%) | 0 (0.0%) |
Time of Departure to Work by Sex in Carytown
The most frequent times of departure to work in Carytown are 5:30 AM to 5:59 AM (16, 23.2%) for males and 7:30 AM to 7:59 AM (21, 38.2%) for females.
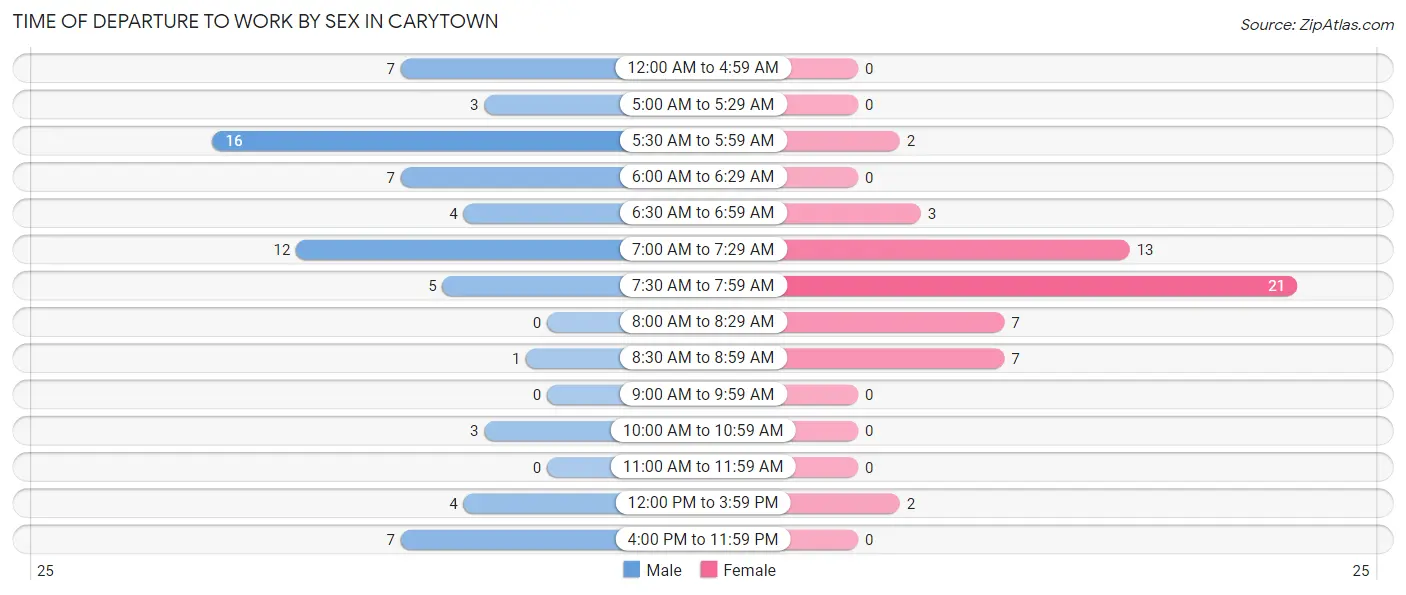
| Time of Departure | Male | Female |
| 12:00 AM to 4:59 AM | 7 (10.1%) | 0 (0.0%) |
| 5:00 AM to 5:29 AM | 3 (4.3%) | 0 (0.0%) |
| 5:30 AM to 5:59 AM | 16 (23.2%) | 2 (3.6%) |
| 6:00 AM to 6:29 AM | 7 (10.1%) | 0 (0.0%) |
| 6:30 AM to 6:59 AM | 4 (5.8%) | 3 (5.4%) |
| 7:00 AM to 7:29 AM | 12 (17.4%) | 13 (23.6%) |
| 7:30 AM to 7:59 AM | 5 (7.2%) | 21 (38.2%) |
| 8:00 AM to 8:29 AM | 0 (0.0%) | 7 (12.7%) |
| 8:30 AM to 8:59 AM | 1 (1.5%) | 7 (12.7%) |
| 9:00 AM to 9:59 AM | 0 (0.0%) | 0 (0.0%) |
| 10:00 AM to 10:59 AM | 3 (4.3%) | 0 (0.0%) |
| 11:00 AM to 11:59 AM | 0 (0.0%) | 0 (0.0%) |
| 12:00 PM to 3:59 PM | 4 (5.8%) | 2 (3.6%) |
| 4:00 PM to 11:59 PM | 7 (10.1%) | 0 (0.0%) |
| Total | 69 (100.0%) | 55 (100.0%) |
Housing Occupancy in Carytown
Occupancy by Ownership in Carytown
Of the total 121 dwellings in Carytown, owner-occupied units account for 111 (91.7%), while renter-occupied units make up 10 (8.3%).
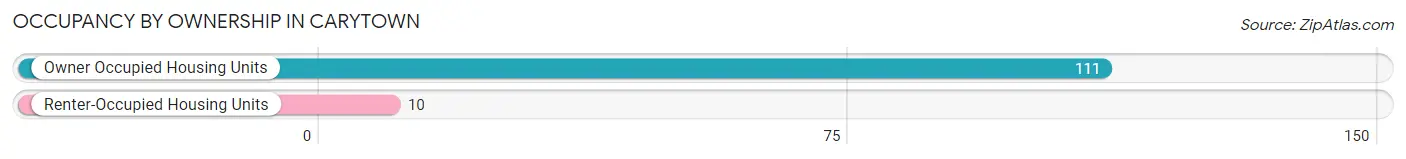
| Occupancy | # Housing Units | % Housing Units |
| Owner Occupied Housing Units | 111 | 91.7% |
| Renter-Occupied Housing Units | 10 | 8.3% |
| Total Occupied Housing Units | 121 | 100.0% |
Occupancy by Household Size in Carytown
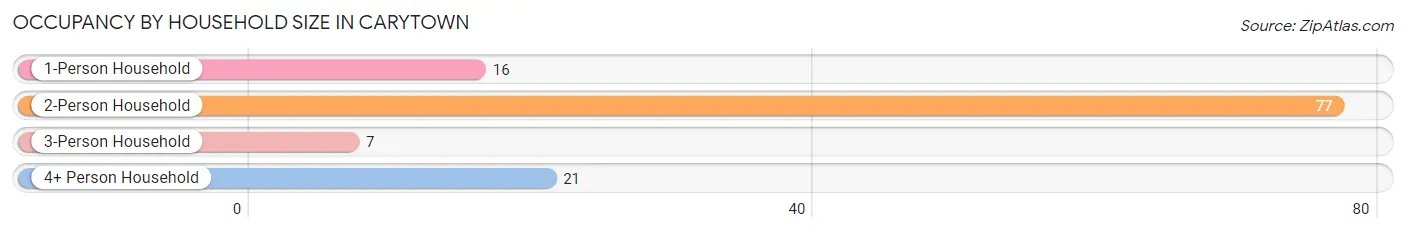
| Household Size | # Housing Units | % Housing Units |
| 1-Person Household | 16 | 13.2% |
| 2-Person Household | 77 | 63.6% |
| 3-Person Household | 7 | 5.8% |
| 4+ Person Household | 21 | 17.4% |
| Total Housing Units | 121 | 100.0% |
Occupancy by Ownership by Household Size in Carytown
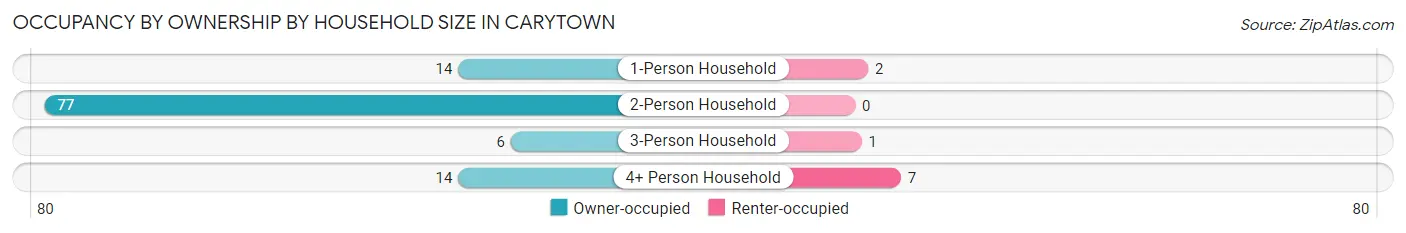
| Household Size | Owner-occupied | Renter-occupied |
| 1-Person Household | 14 (87.5%) | 2 (12.5%) |
| 2-Person Household | 77 (100.0%) | 0 (0.0%) |
| 3-Person Household | 6 (85.7%) | 1 (14.3%) |
| 4+ Person Household | 14 (66.7%) | 7 (33.3%) |
| Total Housing Units | 111 (91.7%) | 10 (8.3%) |
Occupancy by Educational Attainment in Carytown
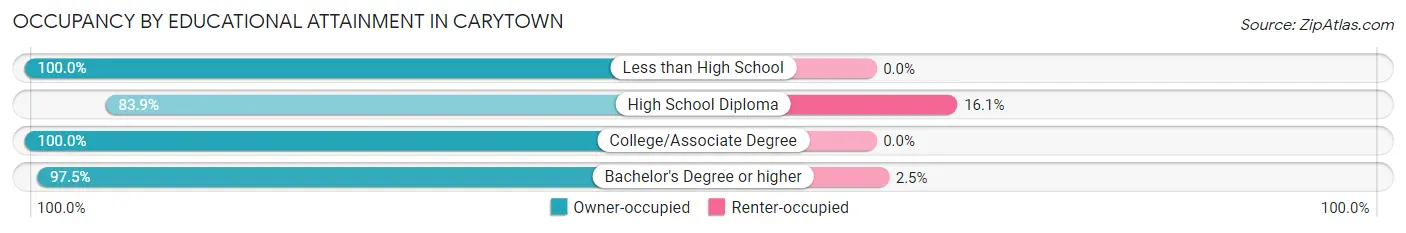
| Household Size | Owner-occupied | Renter-occupied |
| Less than High School | 10 (100.0%) | 0 (0.0%) |
| High School Diploma | 47 (83.9%) | 9 (16.1%) |
| College/Associate Degree | 15 (100.0%) | 0 (0.0%) |
| Bachelor's Degree or higher | 39 (97.5%) | 1 (2.5%) |
Occupancy by Age of Householder in Carytown
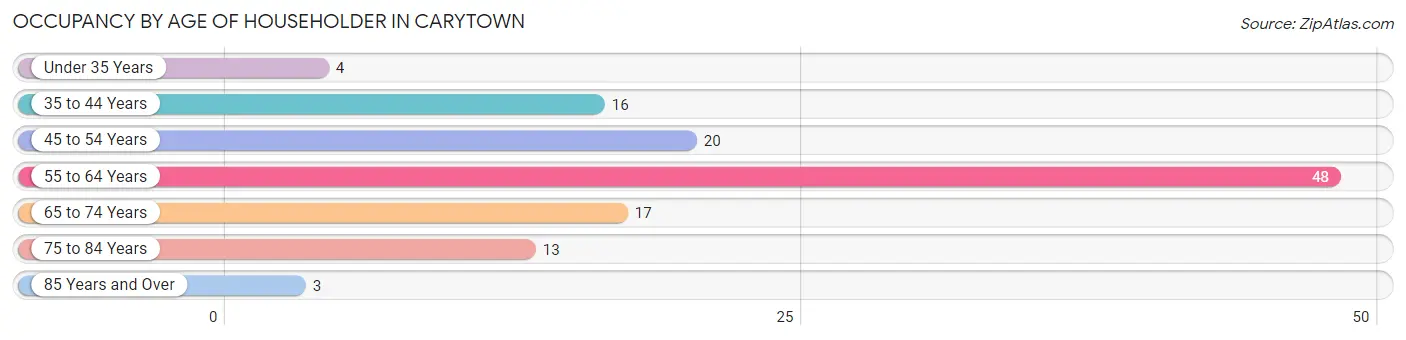
| Age Bracket | # Households | % Households |
| Under 35 Years | 4 | 3.3% |
| 35 to 44 Years | 16 | 13.2% |
| 45 to 54 Years | 20 | 16.5% |
| 55 to 64 Years | 48 | 39.7% |
| 65 to 74 Years | 17 | 14.1% |
| 75 to 84 Years | 13 | 10.7% |
| 85 Years and Over | 3 | 2.5% |
| Total | 121 | 100.0% |
Housing Finances in Carytown
Median Income by Occupancy in Carytown
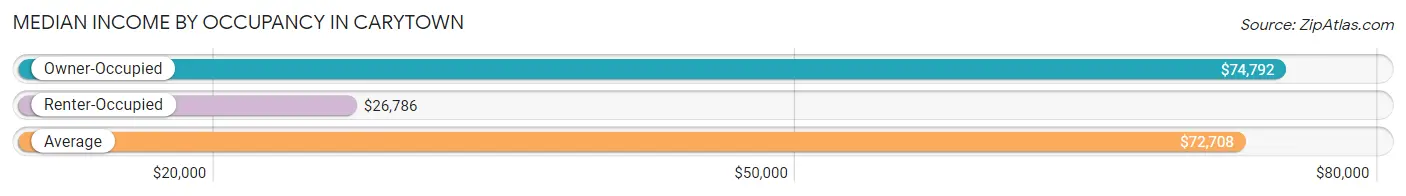
| Occupancy Type | # Households | Median Income |
| Owner-Occupied | 111 (91.7%) | $74,792 |
| Renter-Occupied | 10 (8.3%) | $26,786 |
| Average | 121 (100.0%) | $72,708 |
Occupancy by Householder Income Bracket in Carytown
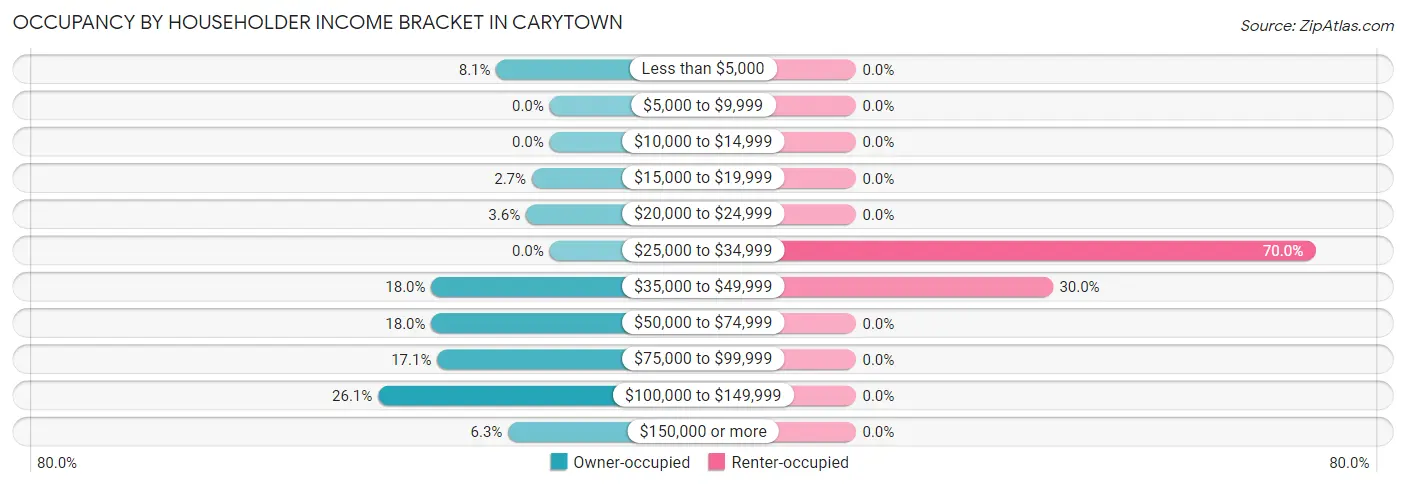
| Income Bracket | Owner-occupied | Renter-occupied |
| Less than $5,000 | 9 (8.1%) | 0 (0.0%) |
| $5,000 to $9,999 | 0 (0.0%) | 0 (0.0%) |
| $10,000 to $14,999 | 0 (0.0%) | 0 (0.0%) |
| $15,000 to $19,999 | 3 (2.7%) | 0 (0.0%) |
| $20,000 to $24,999 | 4 (3.6%) | 0 (0.0%) |
| $25,000 to $34,999 | 0 (0.0%) | 7 (70.0%) |
| $35,000 to $49,999 | 20 (18.0%) | 3 (30.0%) |
| $50,000 to $74,999 | 20 (18.0%) | 0 (0.0%) |
| $75,000 to $99,999 | 19 (17.1%) | 0 (0.0%) |
| $100,000 to $149,999 | 29 (26.1%) | 0 (0.0%) |
| $150,000 or more | 7 (6.3%) | 0 (0.0%) |
| Total | 111 (100.0%) | 10 (100.0%) |
Monthly Housing Cost Tiers in Carytown
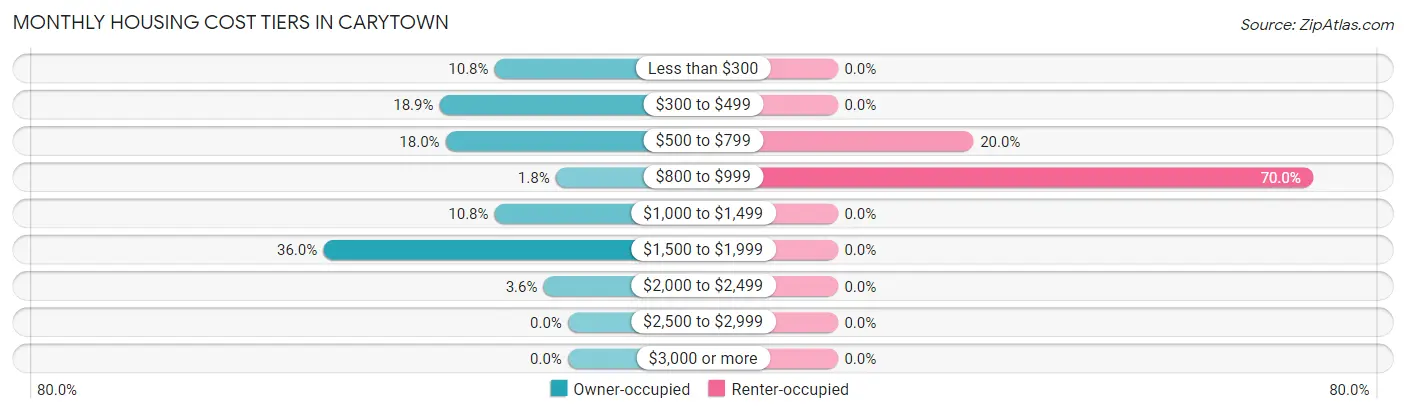
| Monthly Cost | Owner-occupied | Renter-occupied |
| Less than $300 | 12 (10.8%) | 0 (0.0%) |
| $300 to $499 | 21 (18.9%) | 0 (0.0%) |
| $500 to $799 | 20 (18.0%) | 2 (20.0%) |
| $800 to $999 | 2 (1.8%) | 7 (70.0%) |
| $1,000 to $1,499 | 12 (10.8%) | 0 (0.0%) |
| $1,500 to $1,999 | 40 (36.0%) | 0 (0.0%) |
| $2,000 to $2,499 | 4 (3.6%) | 0 (0.0%) |
| $2,500 to $2,999 | 0 (0.0%) | 0 (0.0%) |
| $3,000 or more | 0 (0.0%) | 0 (0.0%) |
| Total | 111 (100.0%) | 10 (100.0%) |
Physical Housing Characteristics in Carytown
Housing Structures in Carytown
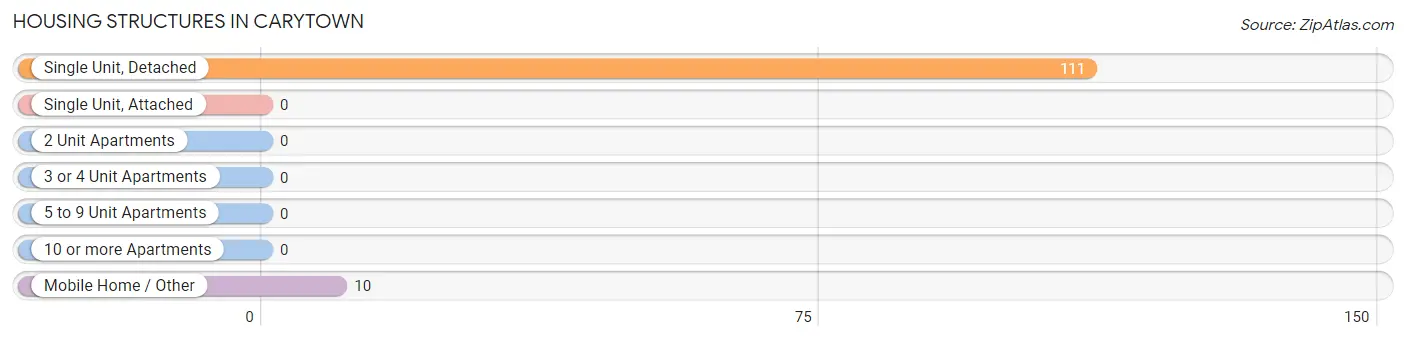
| Structure Type | # Housing Units | % Housing Units |
| Single Unit, Detached | 111 | 91.7% |
| Single Unit, Attached | 0 | 0.0% |
| 2 Unit Apartments | 0 | 0.0% |
| 3 or 4 Unit Apartments | 0 | 0.0% |
| 5 to 9 Unit Apartments | 0 | 0.0% |
| 10 or more Apartments | 0 | 0.0% |
| Mobile Home / Other | 10 | 8.3% |
| Total | 121 | 100.0% |
Housing Structures by Occupancy in Carytown
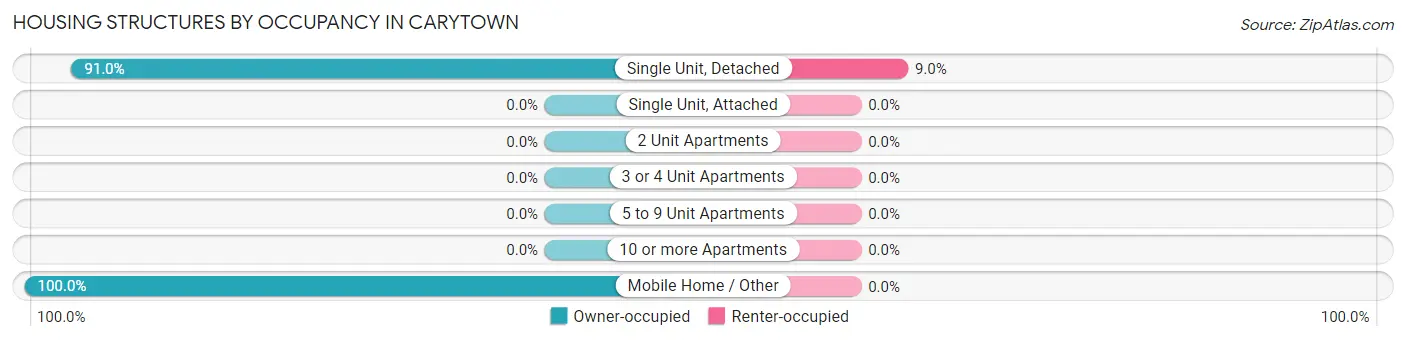
| Structure Type | Owner-occupied | Renter-occupied |
| Single Unit, Detached | 101 (91.0%) | 10 (9.0%) |
| Single Unit, Attached | 0 (0.0%) | 0 (0.0%) |
| 2 Unit Apartments | 0 (0.0%) | 0 (0.0%) |
| 3 or 4 Unit Apartments | 0 (0.0%) | 0 (0.0%) |
| 5 to 9 Unit Apartments | 0 (0.0%) | 0 (0.0%) |
| 10 or more Apartments | 0 (0.0%) | 0 (0.0%) |
| Mobile Home / Other | 10 (100.0%) | 0 (0.0%) |
| Total | 111 (91.7%) | 10 (8.3%) |
Housing Structures by Number of Rooms in Carytown
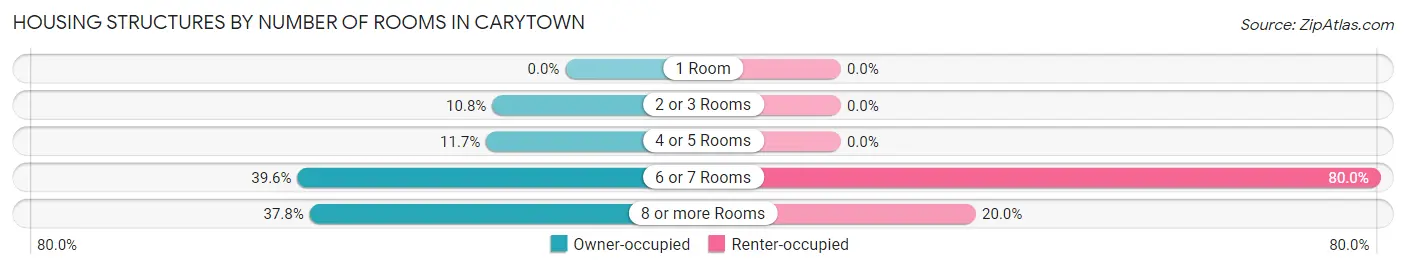
| Number of Rooms | Owner-occupied | Renter-occupied |
| 1 Room | 0 (0.0%) | 0 (0.0%) |
| 2 or 3 Rooms | 12 (10.8%) | 0 (0.0%) |
| 4 or 5 Rooms | 13 (11.7%) | 0 (0.0%) |
| 6 or 7 Rooms | 44 (39.6%) | 8 (80.0%) |
| 8 or more Rooms | 42 (37.8%) | 2 (20.0%) |
| Total | 111 (100.0%) | 10 (100.0%) |
Housing Structure by Heating Type in Carytown
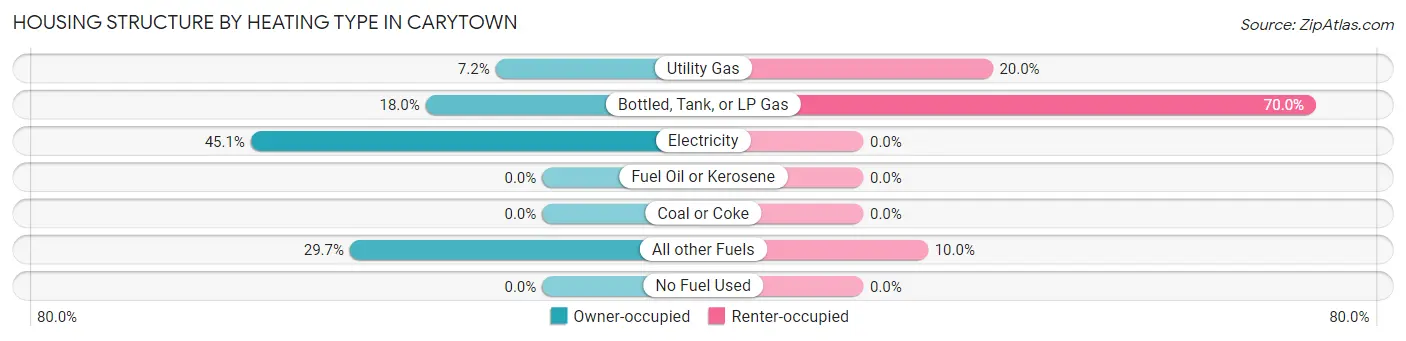
| Heating Type | Owner-occupied | Renter-occupied |
| Utility Gas | 8 (7.2%) | 2 (20.0%) |
| Bottled, Tank, or LP Gas | 20 (18.0%) | 7 (70.0%) |
| Electricity | 50 (45.1%) | 0 (0.0%) |
| Fuel Oil or Kerosene | 0 (0.0%) | 0 (0.0%) |
| Coal or Coke | 0 (0.0%) | 0 (0.0%) |
| All other Fuels | 33 (29.7%) | 1 (10.0%) |
| No Fuel Used | 0 (0.0%) | 0 (0.0%) |
| Total | 111 (100.0%) | 10 (100.0%) |
Household Vehicle Usage in Carytown
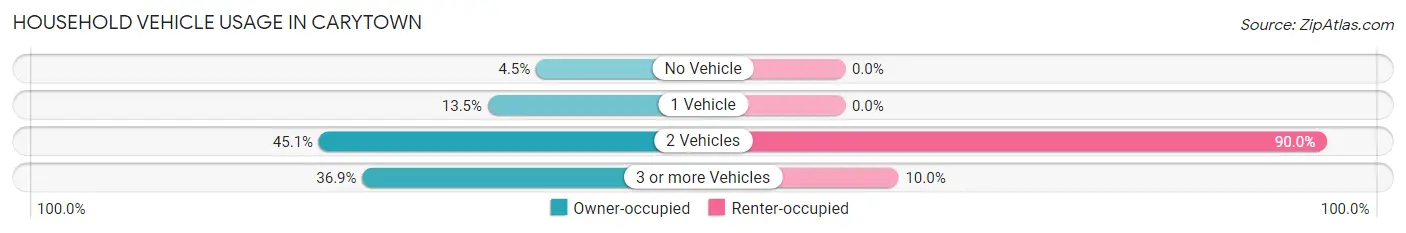
| Vehicles per Household | Owner-occupied | Renter-occupied |
| No Vehicle | 5 (4.5%) | 0 (0.0%) |
| 1 Vehicle | 15 (13.5%) | 0 (0.0%) |
| 2 Vehicles | 50 (45.1%) | 9 (90.0%) |
| 3 or more Vehicles | 41 (36.9%) | 1 (10.0%) |
| Total | 111 (100.0%) | 10 (100.0%) |
Real Estate & Mortgages in Carytown
Real Estate and Mortgage Overview in Carytown
| Characteristic | Without Mortgage | With Mortgage |
| Housing Units | 43 | 68 |
| Median Property Value | $207,500 | $275,700 |
| Median Household Income | $48,750 | $7 |
| Monthly Housing Costs | $412 | $0 |
| Real Estate Taxes | $1,163 | $2 |
Property Value by Mortgage Status in Carytown
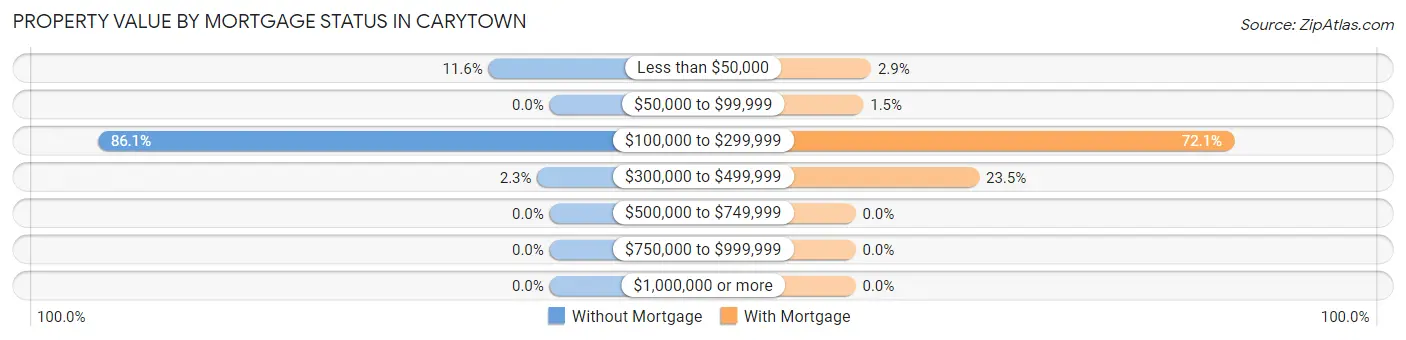
| Property Value | Without Mortgage | With Mortgage |
| Less than $50,000 | 5 (11.6%) | 2 (2.9%) |
| $50,000 to $99,999 | 0 (0.0%) | 1 (1.5%) |
| $100,000 to $299,999 | 37 (86.1%) | 49 (72.1%) |
| $300,000 to $499,999 | 1 (2.3%) | 16 (23.5%) |
| $500,000 to $749,999 | 0 (0.0%) | 0 (0.0%) |
| $750,000 to $999,999 | 0 (0.0%) | 0 (0.0%) |
| $1,000,000 or more | 0 (0.0%) | 0 (0.0%) |
| Total | 43 (100.0%) | 68 (100.0%) |
Household Income by Mortgage Status in Carytown
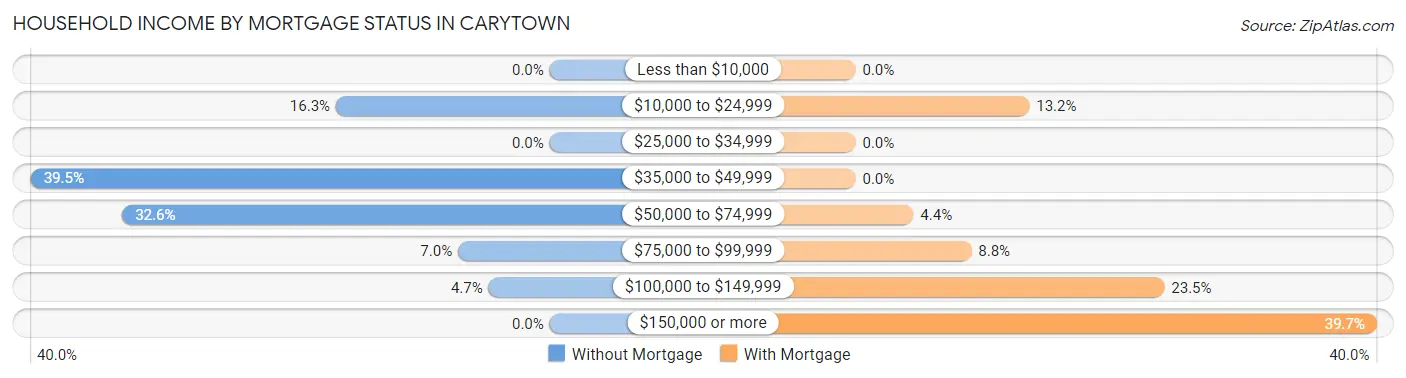
| Household Income | Without Mortgage | With Mortgage |
| Less than $10,000 | 0 (0.0%) | 0 (0.0%) |
| $10,000 to $24,999 | 7 (16.3%) | 9 (13.2%) |
| $25,000 to $34,999 | 0 (0.0%) | 0 (0.0%) |
| $35,000 to $49,999 | 17 (39.5%) | 0 (0.0%) |
| $50,000 to $74,999 | 14 (32.6%) | 3 (4.4%) |
| $75,000 to $99,999 | 3 (7.0%) | 6 (8.8%) |
| $100,000 to $149,999 | 2 (4.6%) | 16 (23.5%) |
| $150,000 or more | 0 (0.0%) | 27 (39.7%) |
| Total | 43 (100.0%) | 68 (100.0%) |
Property Value to Household Income Ratio in Carytown
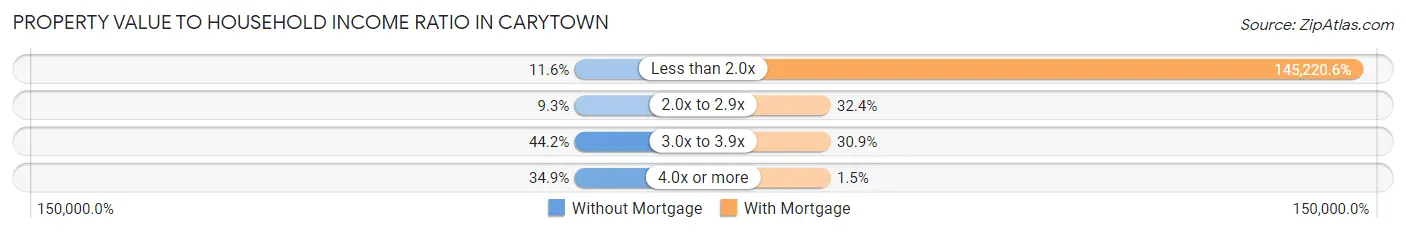
| Value-to-Income Ratio | Without Mortgage | With Mortgage |
| Less than 2.0x | 5 (11.6%) | 98,750 (145,220.6%) |
| 2.0x to 2.9x | 4 (9.3%) | 22 (32.4%) |
| 3.0x to 3.9x | 19 (44.2%) | 21 (30.9%) |
| 4.0x or more | 15 (34.9%) | 1 (1.5%) |
| Total | 43 (100.0%) | 68 (100.0%) |
Real Estate Taxes by Mortgage Status in Carytown
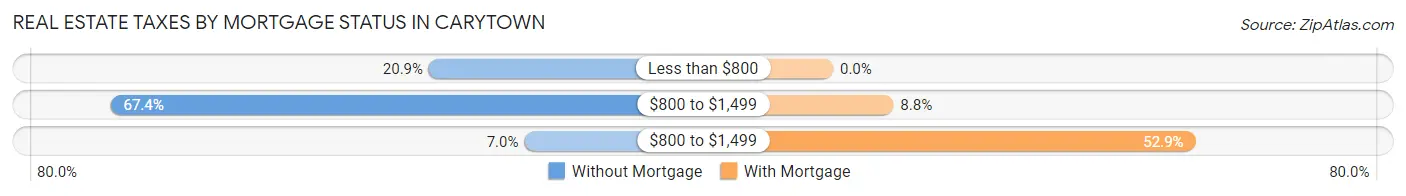
| Property Taxes | Without Mortgage | With Mortgage |
| Less than $800 | 9 (20.9%) | 0 (0.0%) |
| $800 to $1,499 | 29 (67.4%) | 6 (8.8%) |
| $800 to $1,499 | 3 (7.0%) | 36 (52.9%) |
| Total | 43 (100.0%) | 68 (100.0%) |
Health & Disability in Carytown
Health Insurance Coverage by Age in Carytown
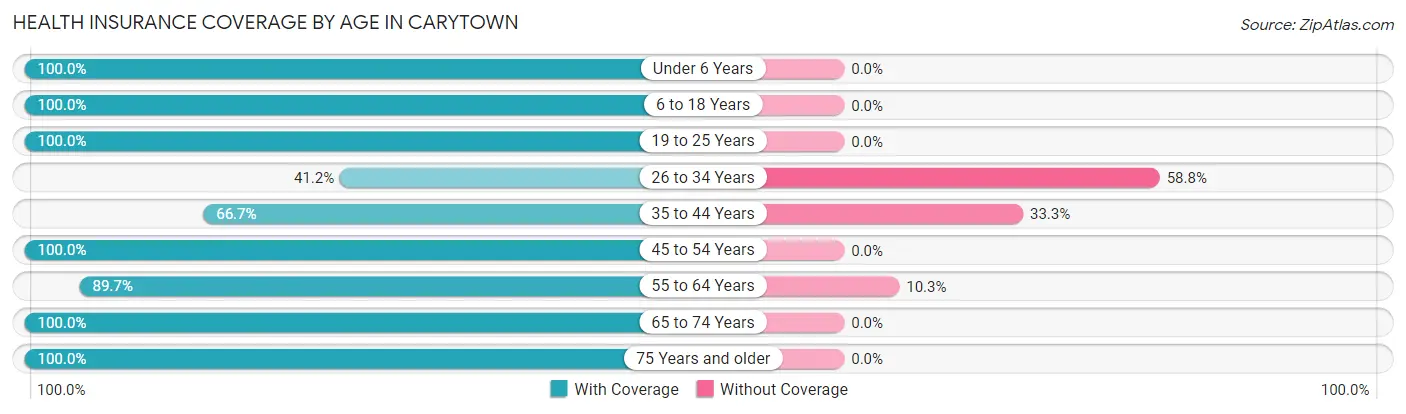
| Age Bracket | With Coverage | Without Coverage |
| Under 6 Years | 5 (100.0%) | 0 (0.0%) |
| 6 to 18 Years | 57 (100.0%) | 0 (0.0%) |
| 19 to 25 Years | 8 (100.0%) | 0 (0.0%) |
| 26 to 34 Years | 7 (41.2%) | 10 (58.8%) |
| 35 to 44 Years | 30 (66.7%) | 15 (33.3%) |
| 45 to 54 Years | 30 (100.0%) | 0 (0.0%) |
| 55 to 64 Years | 70 (89.7%) | 8 (10.3%) |
| 65 to 74 Years | 44 (100.0%) | 0 (0.0%) |
| 75 Years and older | 20 (100.0%) | 0 (0.0%) |
| Total | 271 (89.1%) | 33 (10.9%) |
Health Insurance Coverage by Citizenship Status in Carytown
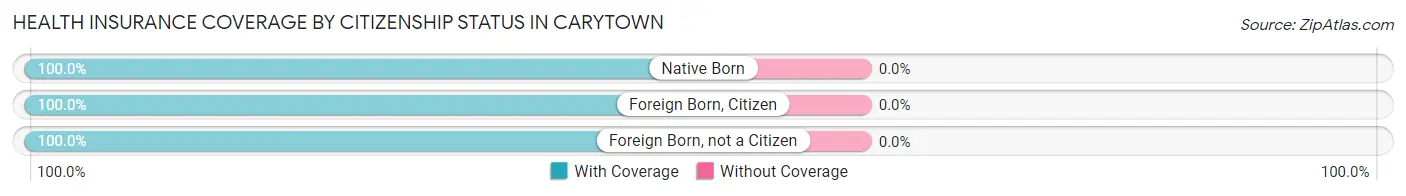
| Citizenship Status | With Coverage | Without Coverage |
| Native Born | 5 (100.0%) | 0 (0.0%) |
| Foreign Born, Citizen | 57 (100.0%) | 0 (0.0%) |
| Foreign Born, not a Citizen | 8 (100.0%) | 0 (0.0%) |
Health Insurance Coverage by Household Income in Carytown
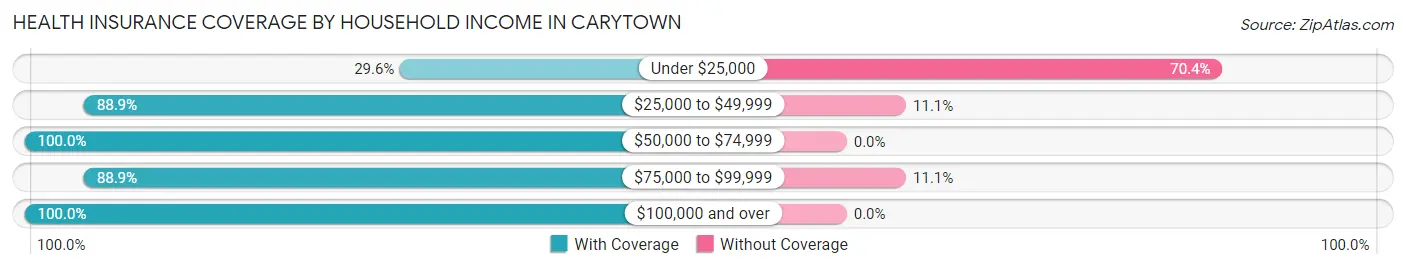
| Household Income | With Coverage | Without Coverage |
| Under $25,000 | 8 (29.6%) | 19 (70.4%) |
| $25,000 to $49,999 | 64 (88.9%) | 8 (11.1%) |
| $50,000 to $74,999 | 37 (100.0%) | 0 (0.0%) |
| $75,000 to $99,999 | 48 (88.9%) | 6 (11.1%) |
| $100,000 and over | 114 (100.0%) | 0 (0.0%) |
Public vs Private Health Insurance Coverage by Age in Carytown
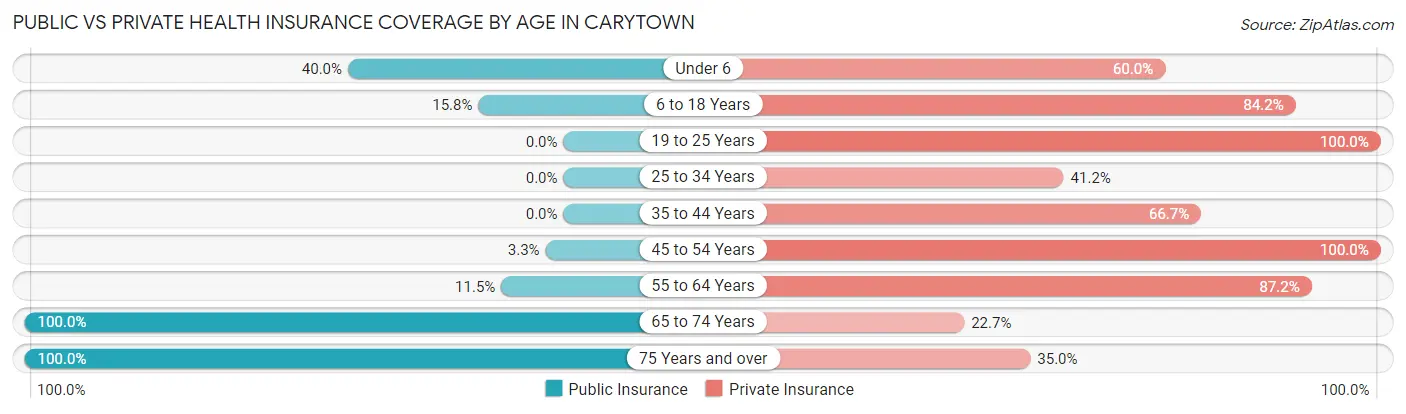
| Age Bracket | Public Insurance | Private Insurance |
| Under 6 | 2 (40.0%) | 3 (60.0%) |
| 6 to 18 Years | 9 (15.8%) | 48 (84.2%) |
| 19 to 25 Years | 0 (0.0%) | 8 (100.0%) |
| 25 to 34 Years | 0 (0.0%) | 7 (41.2%) |
| 35 to 44 Years | 0 (0.0%) | 30 (66.7%) |
| 45 to 54 Years | 1 (3.3%) | 30 (100.0%) |
| 55 to 64 Years | 9 (11.5%) | 68 (87.2%) |
| 65 to 74 Years | 44 (100.0%) | 10 (22.7%) |
| 75 Years and over | 20 (100.0%) | 7 (35.0%) |
| Total | 85 (28.0%) | 211 (69.4%) |
Disability Status by Sex by Age in Carytown
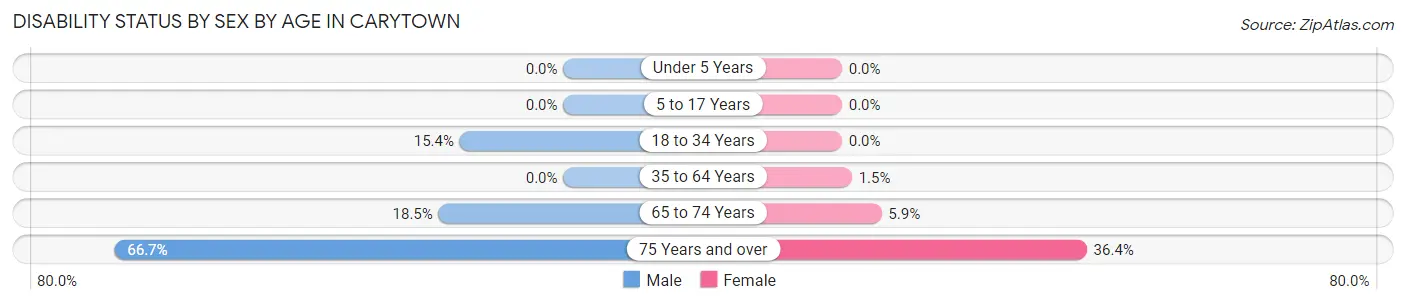
| Age Bracket | Male | Female |
| Under 5 Years | 0 (0.0%) | 0 (0.0%) |
| 5 to 17 Years | 0 (0.0%) | 0 (0.0%) |
| 18 to 34 Years | 2 (15.4%) | 0 (0.0%) |
| 35 to 64 Years | 0 (0.0%) | 1 (1.5%) |
| 65 to 74 Years | 5 (18.5%) | 1 (5.9%) |
| 75 Years and over | 6 (66.7%) | 4 (36.4%) |
Disability Class by Sex by Age in Carytown
Disability Class: Hearing Difficulty
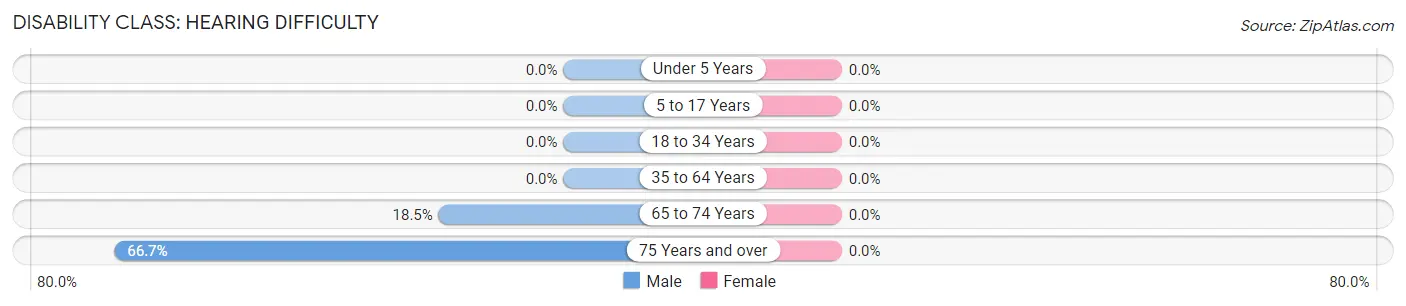
| Age Bracket | Male | Female |
| Under 5 Years | 0 (0.0%) | 0 (0.0%) |
| 5 to 17 Years | 0 (0.0%) | 0 (0.0%) |
| 18 to 34 Years | 0 (0.0%) | 0 (0.0%) |
| 35 to 64 Years | 0 (0.0%) | 0 (0.0%) |
| 65 to 74 Years | 5 (18.5%) | 0 (0.0%) |
| 75 Years and over | 6 (66.7%) | 0 (0.0%) |
Disability Class: Vision Difficulty
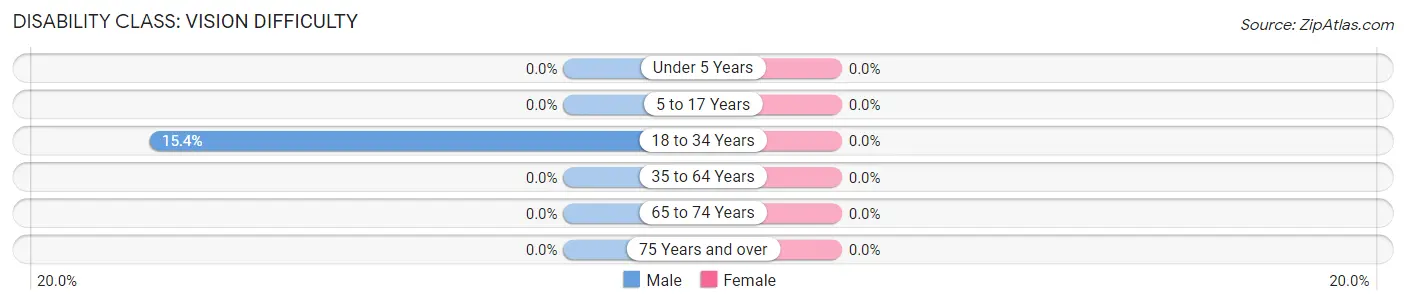
| Age Bracket | Male | Female |
| Under 5 Years | 0 (0.0%) | 0 (0.0%) |
| 5 to 17 Years | 0 (0.0%) | 0 (0.0%) |
| 18 to 34 Years | 2 (15.4%) | 0 (0.0%) |
| 35 to 64 Years | 0 (0.0%) | 0 (0.0%) |
| 65 to 74 Years | 0 (0.0%) | 0 (0.0%) |
| 75 Years and over | 0 (0.0%) | 0 (0.0%) |
Disability Class: Cognitive Difficulty
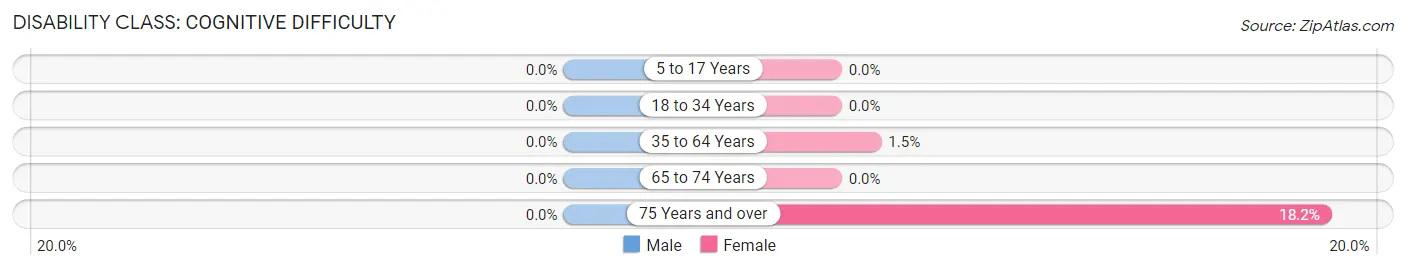
| Age Bracket | Male | Female |
| 5 to 17 Years | 0 (0.0%) | 0 (0.0%) |
| 18 to 34 Years | 0 (0.0%) | 0 (0.0%) |
| 35 to 64 Years | 0 (0.0%) | 1 (1.5%) |
| 65 to 74 Years | 0 (0.0%) | 0 (0.0%) |
| 75 Years and over | 0 (0.0%) | 2 (18.2%) |
Disability Class: Ambulatory Difficulty
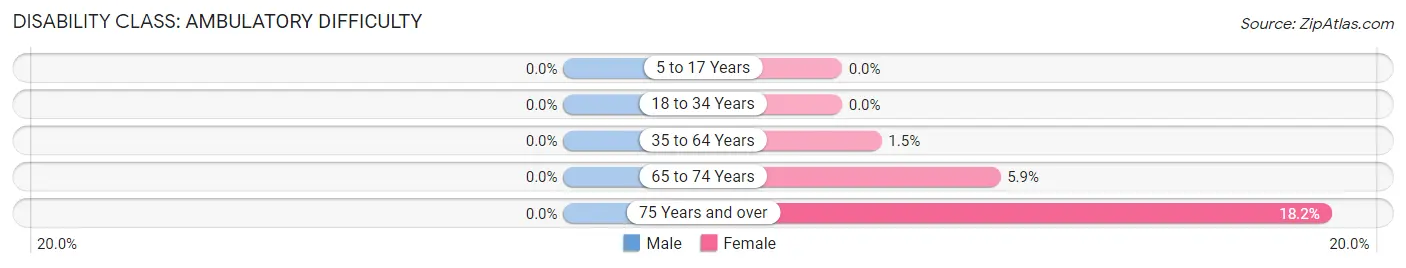
| Age Bracket | Male | Female |
| 5 to 17 Years | 0 (0.0%) | 0 (0.0%) |
| 18 to 34 Years | 0 (0.0%) | 0 (0.0%) |
| 35 to 64 Years | 0 (0.0%) | 1 (1.5%) |
| 65 to 74 Years | 0 (0.0%) | 1 (5.9%) |
| 75 Years and over | 0 (0.0%) | 2 (18.2%) |
Disability Class: Self-Care Difficulty
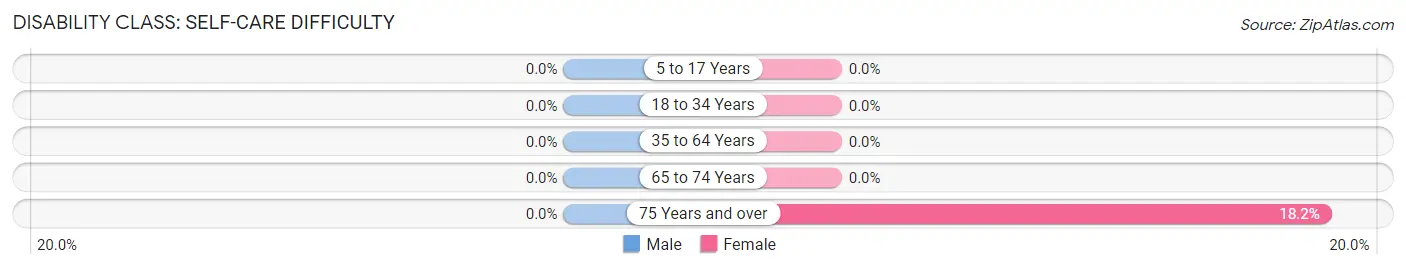
| Age Bracket | Male | Female |
| 5 to 17 Years | 0 (0.0%) | 0 (0.0%) |
| 18 to 34 Years | 0 (0.0%) | 0 (0.0%) |
| 35 to 64 Years | 0 (0.0%) | 0 (0.0%) |
| 65 to 74 Years | 0 (0.0%) | 0 (0.0%) |
| 75 Years and over | 0 (0.0%) | 2 (18.2%) |
Technology Access in Carytown
Computing Device Access in Carytown
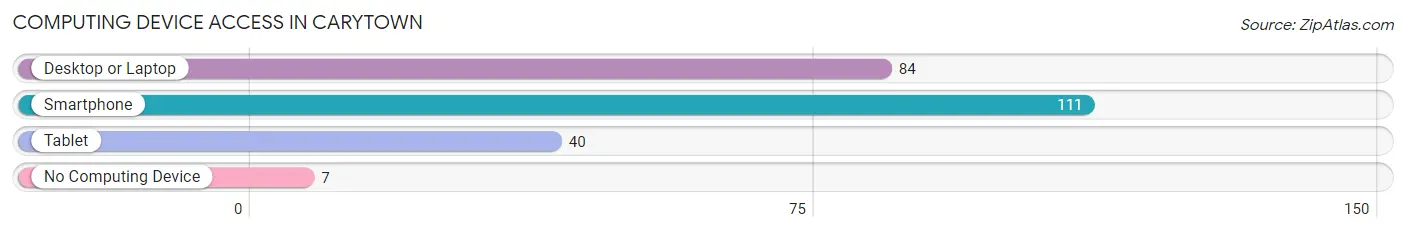
| Device Type | # Households | % Households |
| Desktop or Laptop | 84 | 69.4% |
| Smartphone | 111 | 91.7% |
| Tablet | 40 | 33.1% |
| No Computing Device | 7 | 5.8% |
| Total | 121 | 100.0% |
Internet Access in Carytown
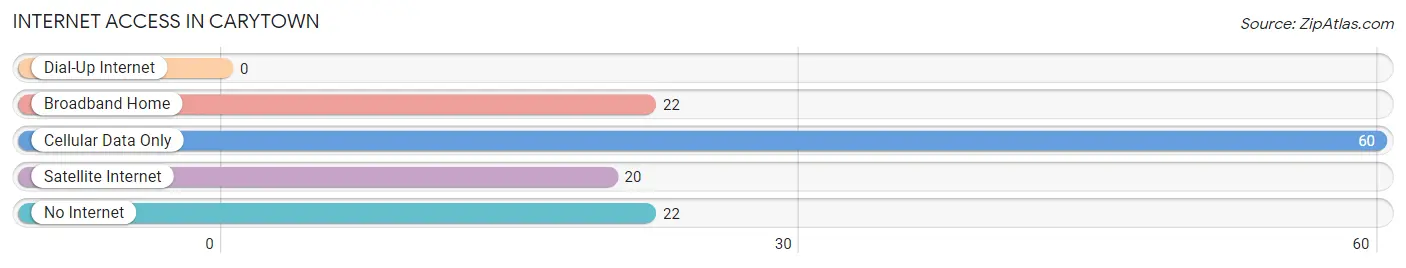
| Internet Type | # Households | % Households |
| Dial-Up Internet | 0 | 0.0% |
| Broadband Home | 22 | 18.2% |
| Cellular Data Only | 60 | 49.6% |
| Satellite Internet | 20 | 16.5% |
| No Internet | 22 | 18.2% |
| Total | 121 | 100.0% |
Carytown Summary
Carytown is a small town located in the state of Missouri, United States. It is situated in the southeastern corner of the state, near the border with Arkansas. The town is part of the Ozark Mountains region and is located in the Ozark Plateau. The town is situated on the banks of the White River, which is a tributary of the Mississippi River.
History
Carytown was founded in 1845 by a group of settlers from the nearby town of Springfield. The town was named after the first settler, William Cary, who was a veteran of the War of 1812. The town was originally a small farming community, but it soon grew to become a bustling trading center. The town was also known for its whiskey distilleries, which were popular in the area.
In the late 19th century, the town began to experience a period of growth and prosperity. The railroad was built through the town, and it became a major hub for the transportation of goods and people. The town also became a popular tourist destination, as it was located near the Ozark Mountains.
In the early 20th century, the town experienced a period of decline. The railroad was abandoned, and the town's economy suffered. However, in the late 20th century, the town began to experience a resurgence. The town was revitalized with the opening of a new shopping center, and the town has since become a popular destination for tourists and locals alike.
Geography
Carytown is located in the southeastern corner of Missouri, near the border with Arkansas. The town is situated in the Ozark Plateau, which is part of the Ozark Mountains region. The town is situated on the banks of the White River, which is a tributary of the Mississippi River. The town is surrounded by rolling hills and forests, and it is located near several state parks and recreational areas.
Economy
Carytown's economy is largely based on tourism and retail. The town is home to several shops and restaurants, as well as a number of tourist attractions. The town is also home to several manufacturing companies, which produce a variety of products. The town is also home to a number of small businesses, such as auto repair shops and other service-based businesses.
Demographics
As of the 2010 census, the population of Carytown was 1,845. The town has a population that is predominantly white, with a small percentage of African Americans and other minorities. The median household income in the town is $37,000, and the median home value is $125,000. The town has a low unemployment rate, and the majority of the population is employed in the retail and tourism industries.
Common Questions
What is Per Capita Income in Carytown?
Per Capita income in Carytown is $30,880.
What is the Median Family Income in Carytown?
Median Family Income in Carytown is $81,964.
What is the Median Household income in Carytown?
Median Household Income in Carytown is $72,708.
What is Income or Wage Gap in Carytown?
Income or Wage Gap in Carytown is 56.5%.
Women in Carytown earn 43.5 cents for every dollar earned by a man.
What is Inequality or Gini Index in Carytown?
Inequality or Gini Index in Carytown is 0.37.
What is the Total Population of Carytown?
Total Population of Carytown is 304.
What is the Total Male Population of Carytown?
Total Male Population of Carytown is 157.
What is the Total Female Population of Carytown?
Total Female Population of Carytown is 147.
What is the Ratio of Males per 100 Females in Carytown?
There are 106.80 Males per 100 Females in Carytown.
What is the Ratio of Females per 100 Males in Carytown?
There are 93.63 Females per 100 Males in Carytown.
What is the Median Population Age in Carytown?
Median Population Age in Carytown is 51.7 Years.
What is the Average Family Size in Carytown
Average Family Size in Carytown is 2.8 People.
What is the Average Household Size in Carytown
Average Household Size in Carytown is 2.5 People.
How Large is the Labor Force in Carytown?
There are 134 People in the Labor Forcein in Carytown.
What is the Percentage of People in the Labor Force in Carytown?
51.5% of People are in the Labor Force in Carytown.