Anson, ME Map & Demographics
Anson Map
Anson Overview
$28,708
PER CAPITA INCOME
59.1%
WAGE / INCOME GAP [ % ]
40.9¢/ $1
WAGE / INCOME GAP [ $ ]
$5,665
FAMILY INCOME DEFICIT
0.47
INEQUALITY / GINI INDEX
837
TOTAL POPULATION
543
MALE POPULATION
294
FEMALE POPULATION
184.69
MALES / 100 FEMALES
54.14
FEMALES / 100 MALES
40.0
MEDIAN AGE
3.0
AVG FAMILY SIZE
2.4
AVG HOUSEHOLD SIZE
369
LABOR FORCE [ PEOPLE ]
54.4%
PERCENT IN LABOR FORCE
11.6%
UNEMPLOYMENT RATE
Anson Zip Codes
Anson Area Codes
Income in Anson
Income Overview in Anson
| Characteristic | Number | Measure |
| Per Capita Income | 837 | $28,708 |
| Median Family Income | 182 | $0 |
| Mean Family Income | 182 | $85,799 |
| Median Household Income | 346 | $0 |
| Mean Household Income | 346 | $70,277 |
| Income Deficit | 182 | $5,665 |
| Wage / Income Gap (%) | 837 | 59.13% |
| Wage / Income Gap ($) | 837 | 40.87¢ per $1 |
| Gini / Inequality Index | 837 | 0.47 |
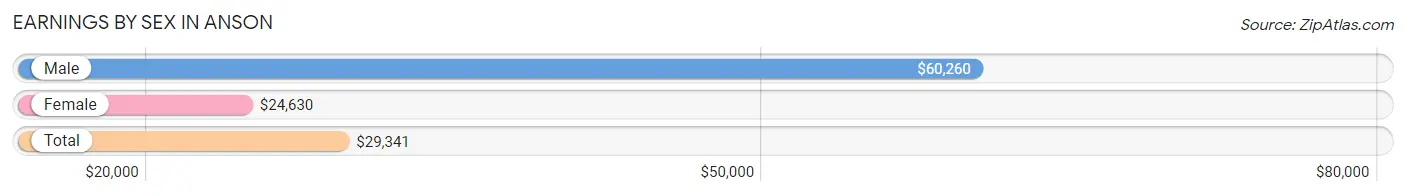
Earnings by Sex in Anson
Average Earnings in Anson are $29,341, $60,260 for men and $24,630 for women, a difference of 59.1%.
| Sex | Number | Average Earnings |
| Male | 239 (62.1%) | $60,260 |
| Female | 146 (37.9%) | $24,630 |
| Total | 385 (100.0%) | $29,341 |
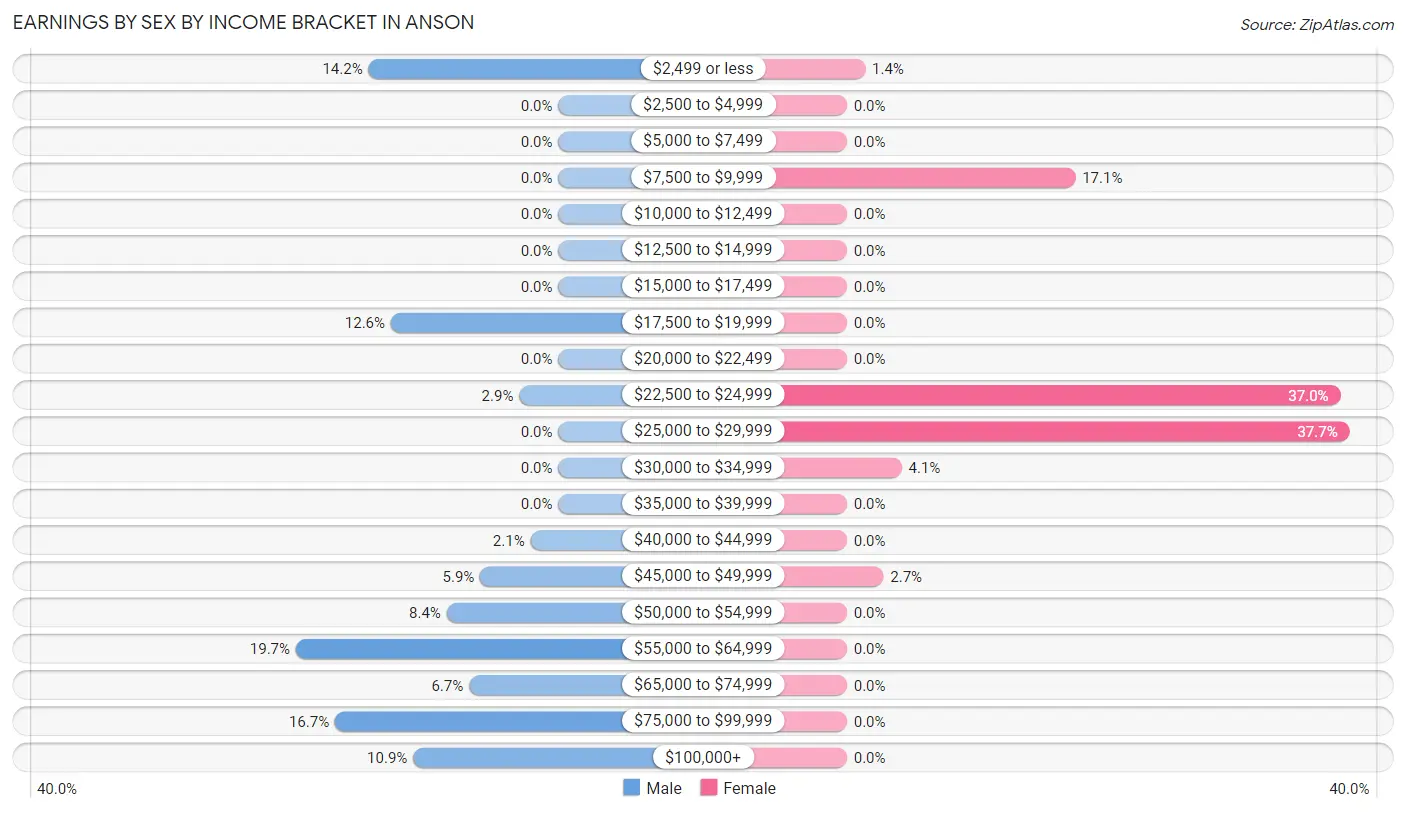
Earnings by Sex by Income Bracket in Anson
The most common earnings brackets in Anson are $55,000 to $64,999 for men (47 | 19.7%) and $25,000 to $29,999 for women (55 | 37.7%).
| Income | Male | Female |
| $2,499 or less | 34 (14.2%) | 2 (1.4%) |
| $2,500 to $4,999 | 0 (0.0%) | 0 (0.0%) |
| $5,000 to $7,499 | 0 (0.0%) | 0 (0.0%) |
| $7,500 to $9,999 | 0 (0.0%) | 25 (17.1%) |
| $10,000 to $12,499 | 0 (0.0%) | 0 (0.0%) |
| $12,500 to $14,999 | 0 (0.0%) | 0 (0.0%) |
| $15,000 to $17,499 | 0 (0.0%) | 0 (0.0%) |
| $17,500 to $19,999 | 30 (12.6%) | 0 (0.0%) |
| $20,000 to $22,499 | 0 (0.0%) | 0 (0.0%) |
| $22,500 to $24,999 | 7 (2.9%) | 54 (37.0%) |
| $25,000 to $29,999 | 0 (0.0%) | 55 (37.7%) |
| $30,000 to $34,999 | 0 (0.0%) | 6 (4.1%) |
| $35,000 to $39,999 | 0 (0.0%) | 0 (0.0%) |
| $40,000 to $44,999 | 5 (2.1%) | 0 (0.0%) |
| $45,000 to $49,999 | 14 (5.9%) | 4 (2.7%) |
| $50,000 to $54,999 | 20 (8.4%) | 0 (0.0%) |
| $55,000 to $64,999 | 47 (19.7%) | 0 (0.0%) |
| $65,000 to $74,999 | 16 (6.7%) | 0 (0.0%) |
| $75,000 to $99,999 | 40 (16.7%) | 0 (0.0%) |
| $100,000+ | 26 (10.9%) | 0 (0.0%) |
| Total | 239 (100.0%) | 146 (100.0%) |
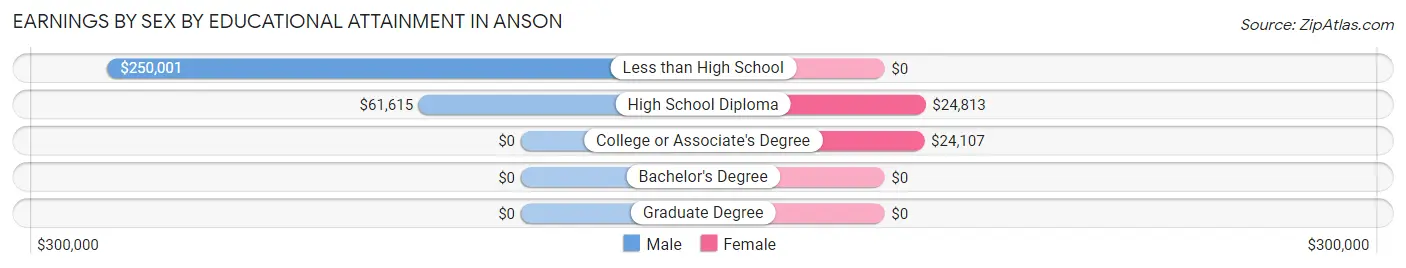
Earnings by Sex by Educational Attainment in Anson
Average earnings in Anson are $61,354 for men and $24,630 for women, a difference of 59.9%. Men with an educational attainment of less than high school enjoy the highest average annual earnings of $250,001, while those with high school diploma education earn the least with $61,615. Women with an educational attainment of high school diploma earn the most with the average annual earnings of $24,813, while those with college or associate's degree education have the smallest earnings of $24,107.
| Educational Attainment | Male Income | Female Income |
| Less than High School | $250,001 | $0 |
| High School Diploma | $61,615 | $24,813 |
| College or Associate's Degree | - | - |
| Bachelor's Degree | - | - |
| Graduate Degree | - | - |
| Total | $61,354 | $24,630 |
Family Income in Anson
Family Income Brackets in Anson
According to the Anson family income data, there are 54 families falling into the $75,000 to $99,999 income range, which is the most common income bracket and makes up 29.7% of all families.
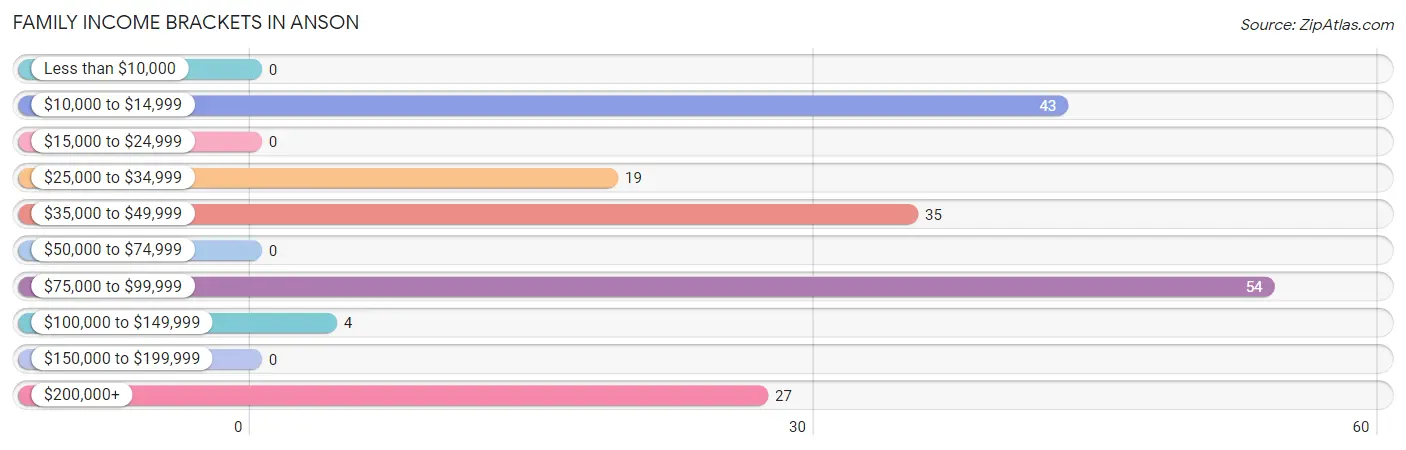
| Income Bracket | # Families | % Families |
| Less than $10,000 | 0 | 0.0% |
| $10,000 to $14,999 | 43 | 23.6% |
| $15,000 to $24,999 | 0 | 0.0% |
| $25,000 to $34,999 | 19 | 10.4% |
| $35,000 to $49,999 | 35 | 19.2% |
| $50,000 to $74,999 | 0 | 0.0% |
| $75,000 to $99,999 | 54 | 29.7% |
| $100,000 to $149,999 | 4 | 2.2% |
| $150,000 to $199,999 | 0 | 0.0% |
| $200,000+ | 27 | 14.8% |
Family Income by Famaliy Size in Anson
| Income Bracket | # Families | Median Income |
| 2-Person Families | 95 (52.2%) | $0 |
| 3-Person Families | 41 (22.5%) | $0 |
| 4-Person Families | 27 (14.8%) | $0 |
| 5-Person Families | 19 (10.4%) | $0 |
| 6-Person Families | 0 (0.0%) | $0 |
| 7+ Person Families | 0 (0.0%) | $0 |
| Total | 182 (100.0%) | $0 |
Family Income by Number of Earners in Anson
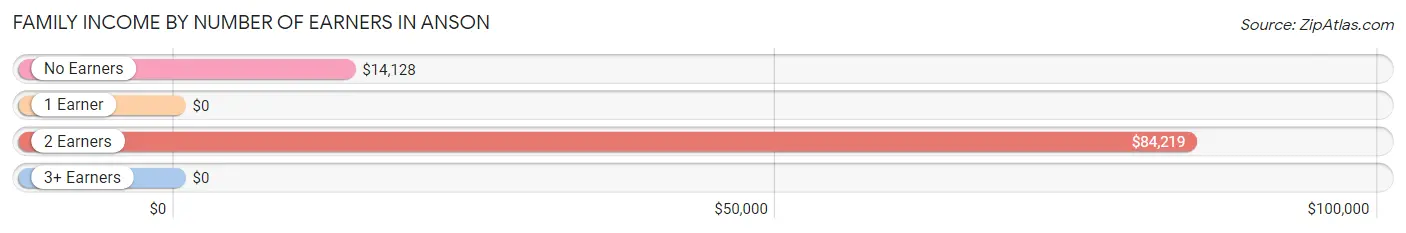
| Number of Earners | # Families | Median Income |
| No Earners | 56 (30.8%) | $14,128 |
| 1 Earner | 65 (35.7%) | $0 |
| 2 Earners | 61 (33.5%) | $84,219 |
| 3+ Earners | 0 (0.0%) | $0 |
| Total | 182 (100.0%) | $0 |
Household Income in Anson
Household Income Brackets in Anson
With 93 households falling in the category, the $75,000 to $99,999 income range is the most frequent in Anson, accounting for 26.9% of all households.
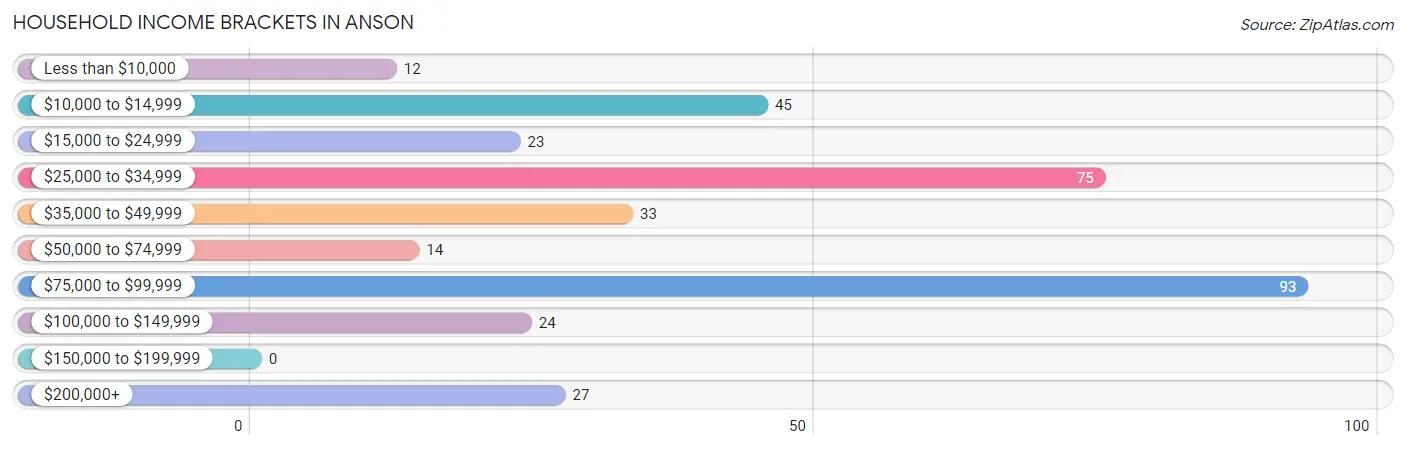
| Income Bracket | # Households | % Households |
| Less than $10,000 | 12 | 3.5% |
| $10,000 to $14,999 | 45 | 13.0% |
| $15,000 to $24,999 | 23 | 6.6% |
| $25,000 to $34,999 | 75 | 21.7% |
| $35,000 to $49,999 | 33 | 9.5% |
| $50,000 to $74,999 | 14 | 4.0% |
| $75,000 to $99,999 | 93 | 26.9% |
| $100,000 to $149,999 | 24 | 6.9% |
| $150,000 to $199,999 | 0 | 0.0% |
| $200,000+ | 27 | 7.8% |
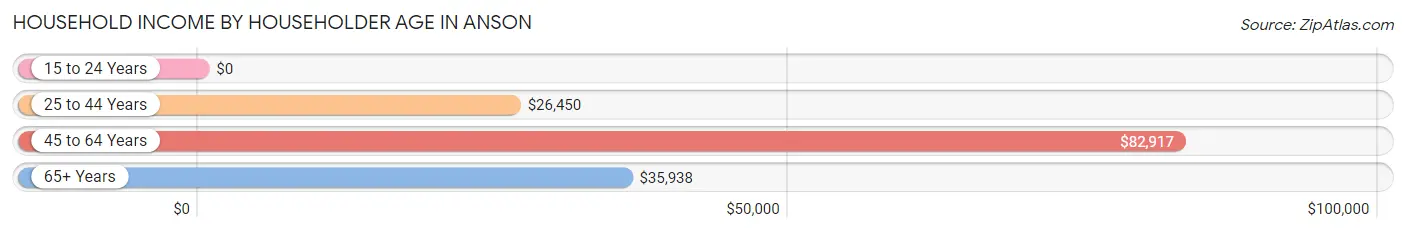
Household Income by Householder Age in Anson
The median household income in Anson is $0, with the highest median household income of $82,917 found in the 45 to 64 years age bracket for the primary householder. A total of 172 households (49.7%) fall into this category.
| Income Bracket | # Households | Median Income |
| 15 to 24 Years | 0 (0.0%) | $0 |
| 25 to 44 Years | 135 (39.0%) | $26,450 |
| 45 to 64 Years | 172 (49.7%) | $82,917 |
| 65+ Years | 39 (11.3%) | $35,938 |
| Total | 346 (100.0%) | $0 |
Poverty in Anson
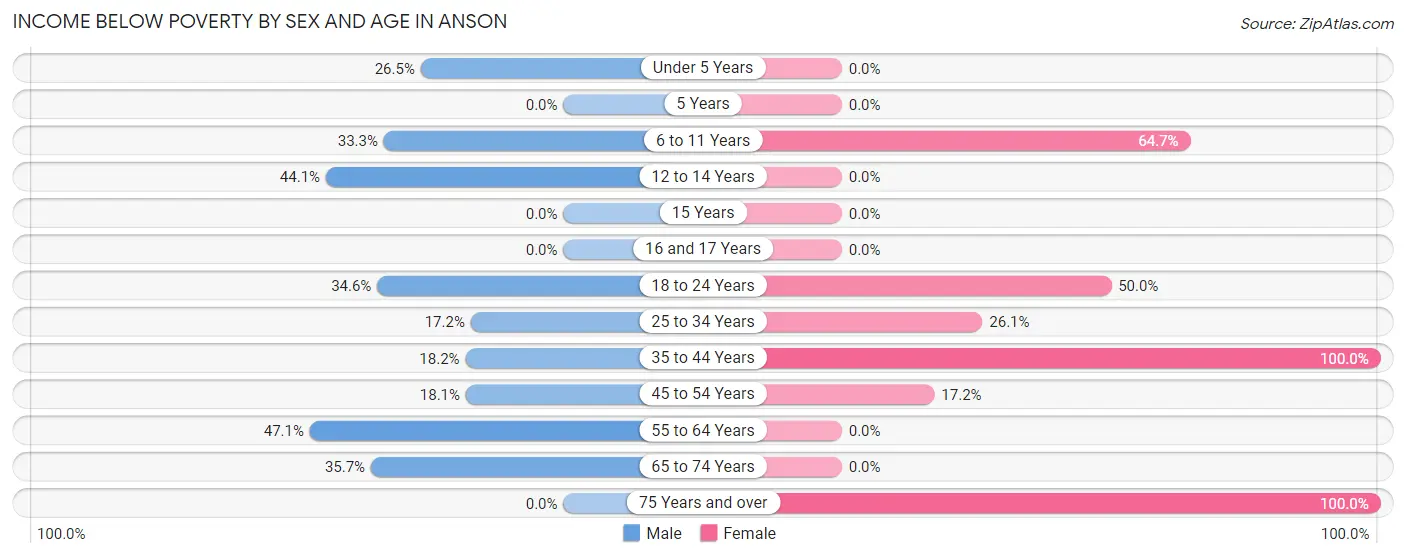
Income Below Poverty by Sex and Age in Anson
With 27.4% poverty level for males and 38.4% for females among the residents of Anson, 55 to 64 year old males and 35 to 44 year old females are the most vulnerable to poverty, with 32 males (47.1%) and 45 females (100.0%) in their respective age groups living below the poverty level.
| Age Bracket | Male | Female |
| Under 5 Years | 9 (26.5%) | 0 (0.0%) |
| 5 Years | 0 (0.0%) | 0 (0.0%) |
| 6 to 11 Years | 13 (33.3%) | 11 (64.7%) |
| 12 to 14 Years | 26 (44.1%) | 0 (0.0%) |
| 15 Years | 0 (0.0%) | 0 (0.0%) |
| 16 and 17 Years | 0 (0.0%) | 0 (0.0%) |
| 18 to 24 Years | 19 (34.5%) | 25 (50.0%) |
| 25 to 34 Years | 11 (17.2%) | 12 (26.1%) |
| 35 to 44 Years | 10 (18.2%) | 45 (100.0%) |
| 45 to 54 Years | 19 (18.1%) | 11 (17.2%) |
| 55 to 64 Years | 32 (47.1%) | 0 (0.0%) |
| 65 to 74 Years | 10 (35.7%) | 0 (0.0%) |
| 75 Years and over | 0 (0.0%) | 9 (100.0%) |
| Total | 149 (27.4%) | 113 (38.4%) |
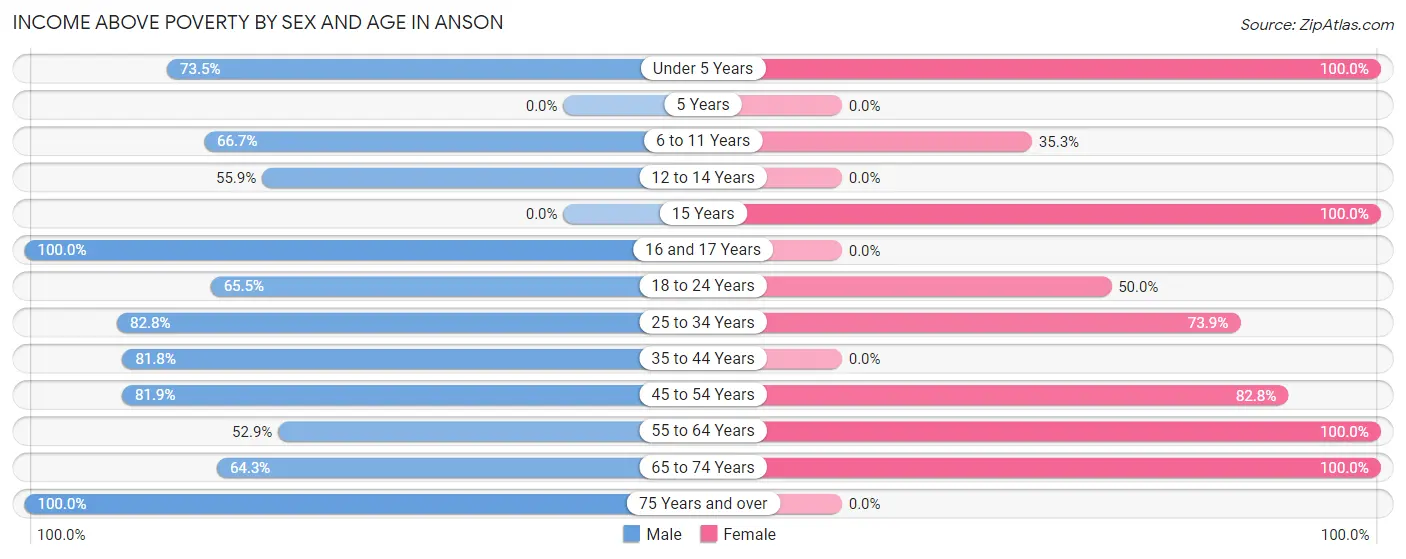
Income Above Poverty by Sex and Age in Anson
According to the poverty statistics in Anson, males aged 16 and 17 years and females aged under 5 years are the age groups that are most secure financially, with 100.0% of males and 100.0% of females in these age groups living above the poverty line.
| Age Bracket | Male | Female |
| Under 5 Years | 25 (73.5%) | 8 (100.0%) |
| 5 Years | 0 (0.0%) | 0 (0.0%) |
| 6 to 11 Years | 26 (66.7%) | 6 (35.3%) |
| 12 to 14 Years | 33 (55.9%) | 0 (0.0%) |
| 15 Years | 0 (0.0%) | 2 (100.0%) |
| 16 and 17 Years | 24 (100.0%) | 0 (0.0%) |
| 18 to 24 Years | 36 (65.4%) | 25 (50.0%) |
| 25 to 34 Years | 53 (82.8%) | 34 (73.9%) |
| 35 to 44 Years | 45 (81.8%) | 0 (0.0%) |
| 45 to 54 Years | 86 (81.9%) | 53 (82.8%) |
| 55 to 64 Years | 36 (52.9%) | 46 (100.0%) |
| 65 to 74 Years | 18 (64.3%) | 7 (100.0%) |
| 75 Years and over | 12 (100.0%) | 0 (0.0%) |
| Total | 394 (72.6%) | 181 (61.6%) |
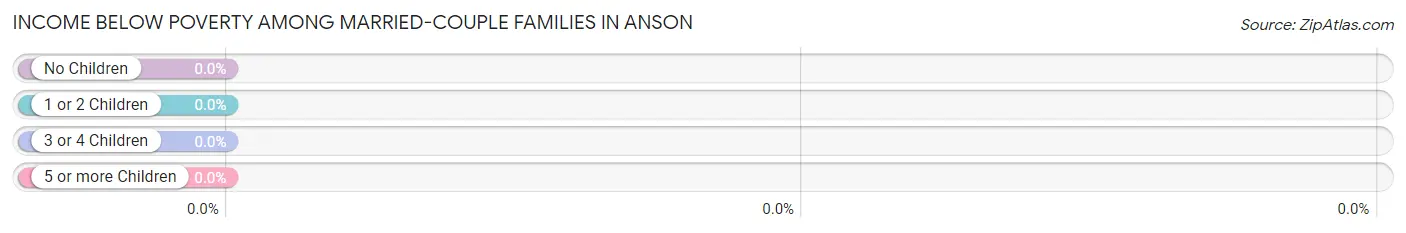
Income Below Poverty Among Married-Couple Families in Anson
| Children | Above Poverty | Below Poverty |
| No Children | 52 (100.0%) | 0 (0.0%) |
| 1 or 2 Children | 46 (100.0%) | 0 (0.0%) |
| 3 or 4 Children | 8 (100.0%) | 0 (0.0%) |
| 5 or more Children | 0 (0.0%) | 0 (0.0%) |
| Total | 106 (100.0%) | 0 (0.0%) |
Income Below Poverty Among Single-Parent Households in Anson
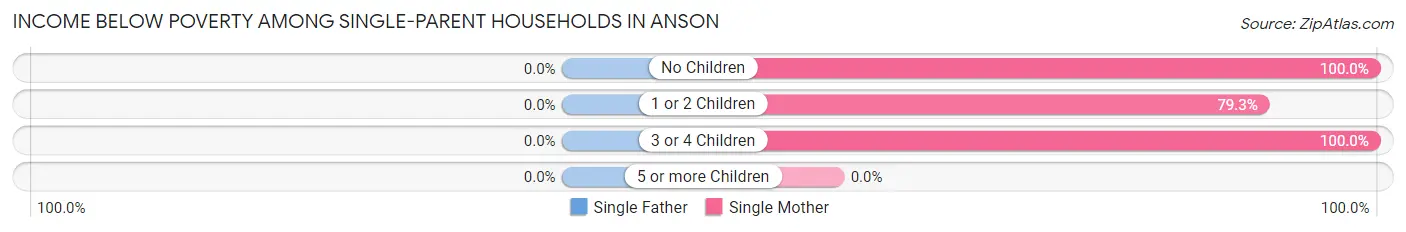
| Children | Single Father | Single Mother |
| No Children | 0 (0.0%) | 20 (100.0%) |
| 1 or 2 Children | 0 (0.0%) | 23 (79.3%) |
| 3 or 4 Children | 0 (0.0%) | 11 (100.0%) |
| 5 or more Children | 0 (0.0%) | 0 (0.0%) |
| Total | 0 (0.0%) | 54 (90.0%) |
Income Below Poverty Among Married-Couple vs Single-Parent Households in Anson
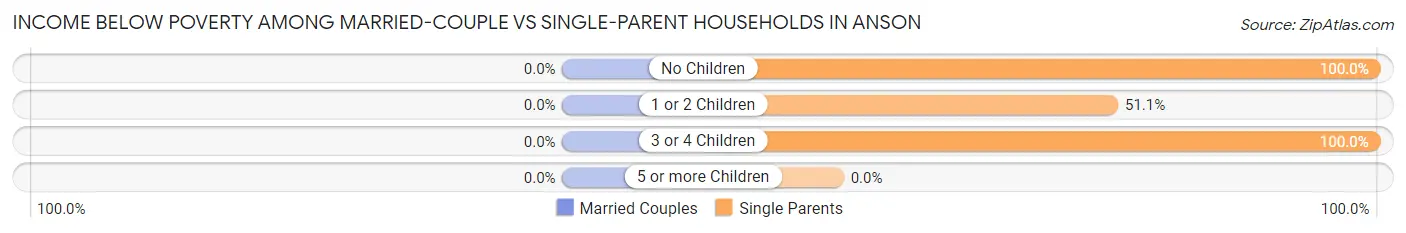
| Children | Married-Couple Families | Single-Parent Households |
| No Children | 0 (0.0%) | 20 (100.0%) |
| 1 or 2 Children | 0 (0.0%) | 23 (51.1%) |
| 3 or 4 Children | 0 (0.0%) | 11 (100.0%) |
| 5 or more Children | 0 (0.0%) | 0 (0.0%) |
| Total | 0 (0.0%) | 54 (71.1%) |
Race in Anson
The most populous races in Anson are , and White / Caucasian (837 | 100.0%).
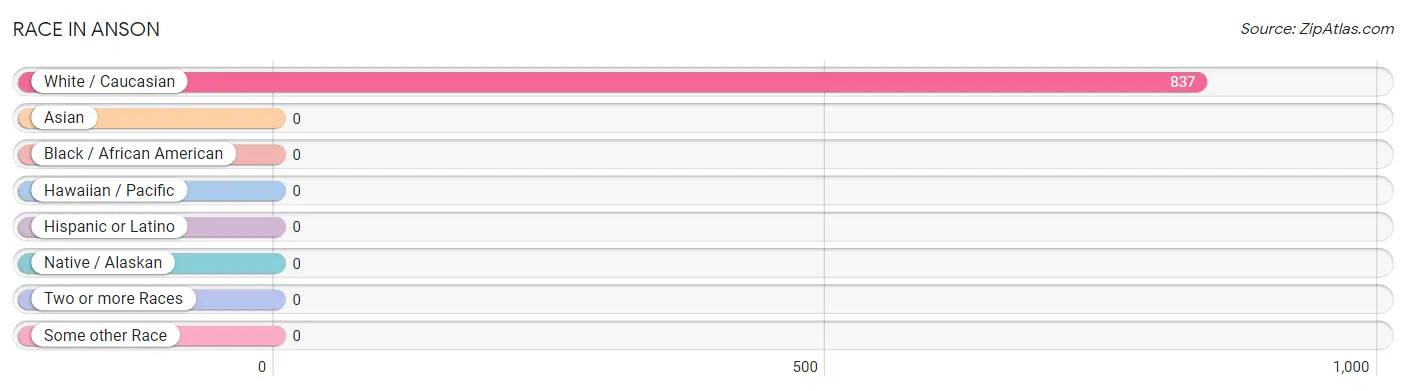
| Race | # Population | % Population |
| Asian | 0 | 0.0% |
| Black / African American | 0 | 0.0% |
| Hawaiian / Pacific | 0 | 0.0% |
| Hispanic or Latino | 0 | 0.0% |
| Native / Alaskan | 0 | 0.0% |
| White / Caucasian | 837 | 100.0% |
| Two or more Races | 0 | 0.0% |
| Some other Race | 0 | 0.0% |
| Total | 837 | 100.0% |
Ancestry in Anson
The most populous ancestries reported in Anson are English (177 | 21.1%), Irish (109 | 13.0%), American (96 | 11.5%), Polish (63 | 7.5%), and French (62 | 7.4%), together accounting for 60.6% of all Anson residents.
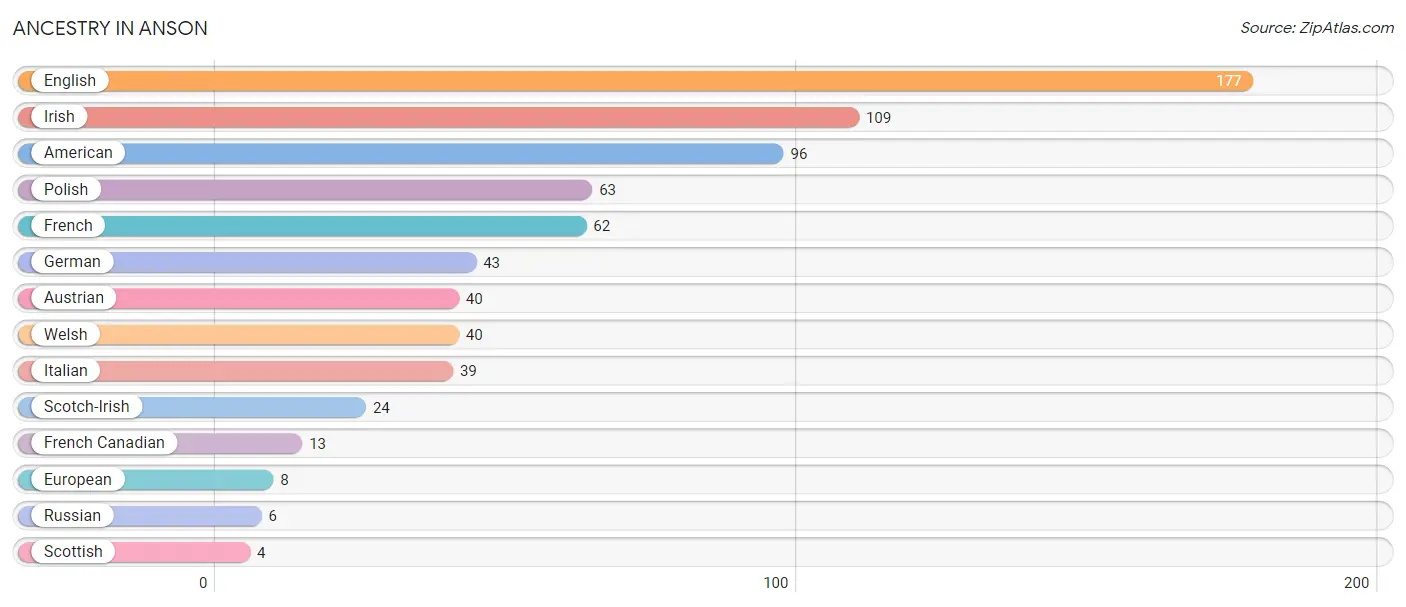
| Ancestry | # Population | % Population |
| American | 96 | 11.5% |
| Austrian | 40 | 4.8% |
| English | 177 | 21.1% |
| European | 8 | 1.0% |
| French | 62 | 7.4% |
| French Canadian | 13 | 1.5% |
| German | 43 | 5.1% |
| Irish | 109 | 13.0% |
| Italian | 39 | 4.7% |
| Polish | 63 | 7.5% |
| Russian | 6 | 0.7% |
| Scotch-Irish | 24 | 2.9% |
| Scottish | 4 | 0.5% |
| Welsh | 40 | 4.8% | View All 14 Rows |
Immigrants in Anson

| Immigration Origin | # Population | % Population | View All 0 Rows |
Sex and Age in Anson
Sex and Age in Anson
The most populous age groups in Anson are 10 to 14 Years (89 | 16.4%) for men and 40 to 44 Years (45 | 15.3%) for women.
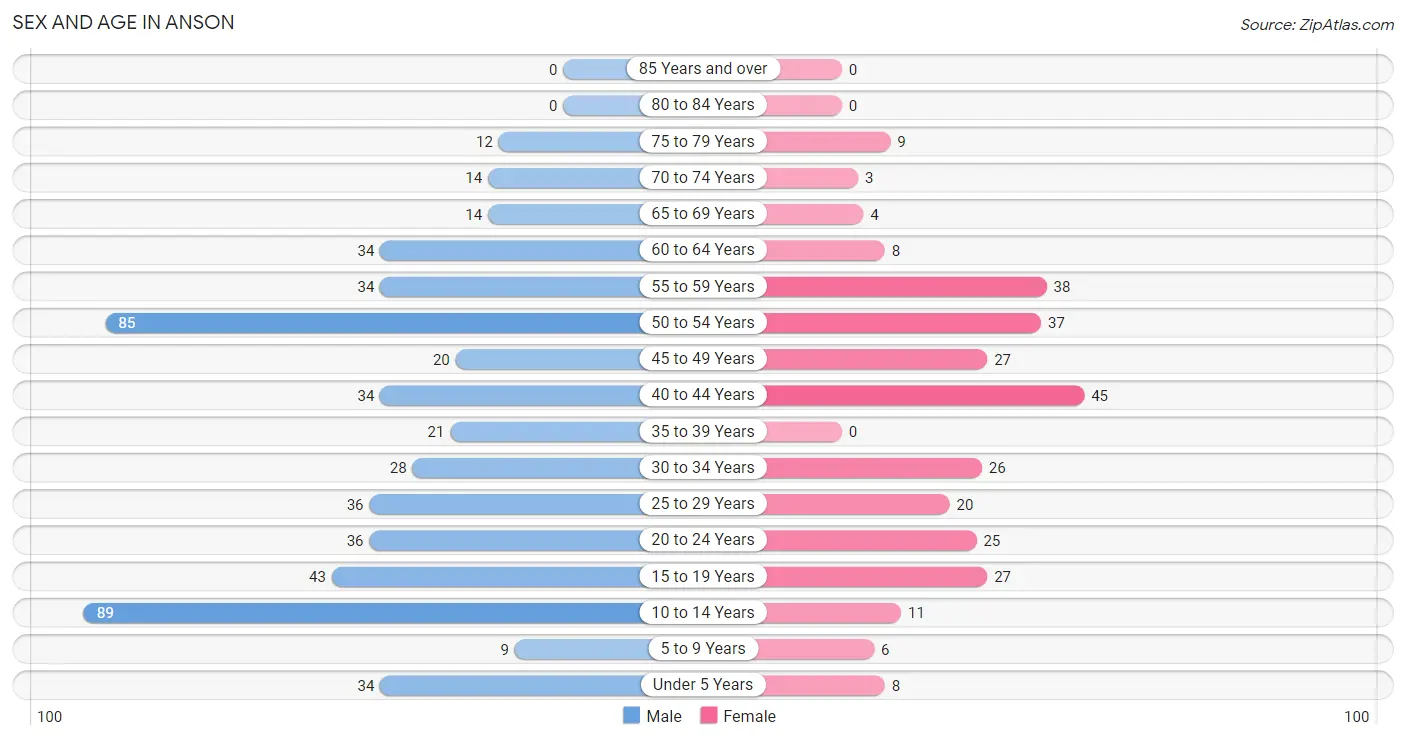
| Age Bracket | Male | Female |
| Under 5 Years | 34 (6.3%) | 8 (2.7%) |
| 5 to 9 Years | 9 (1.7%) | 6 (2.0%) |
| 10 to 14 Years | 89 (16.4%) | 11 (3.7%) |
| 15 to 19 Years | 43 (7.9%) | 27 (9.2%) |
| 20 to 24 Years | 36 (6.6%) | 25 (8.5%) |
| 25 to 29 Years | 36 (6.6%) | 20 (6.8%) |
| 30 to 34 Years | 28 (5.2%) | 26 (8.8%) |
| 35 to 39 Years | 21 (3.9%) | 0 (0.0%) |
| 40 to 44 Years | 34 (6.3%) | 45 (15.3%) |
| 45 to 49 Years | 20 (3.7%) | 27 (9.2%) |
| 50 to 54 Years | 85 (15.7%) | 37 (12.6%) |
| 55 to 59 Years | 34 (6.3%) | 38 (12.9%) |
| 60 to 64 Years | 34 (6.3%) | 8 (2.7%) |
| 65 to 69 Years | 14 (2.6%) | 4 (1.4%) |
| 70 to 74 Years | 14 (2.6%) | 3 (1.0%) |
| 75 to 79 Years | 12 (2.2%) | 9 (3.1%) |
| 80 to 84 Years | 0 (0.0%) | 0 (0.0%) |
| 85 Years and over | 0 (0.0%) | 0 (0.0%) |
| Total | 543 (100.0%) | 294 (100.0%) |
Families and Households in Anson
Median Family Size in Anson
The median family size in Anson is 2.95 persons per family, with single male/father families (16 | 8.8%) accounting for the largest median family size of 3.13 persons per family. On the other hand, single female/mother families (60 | 33.0%) represent the smallest median family size with 2.72 persons per family.
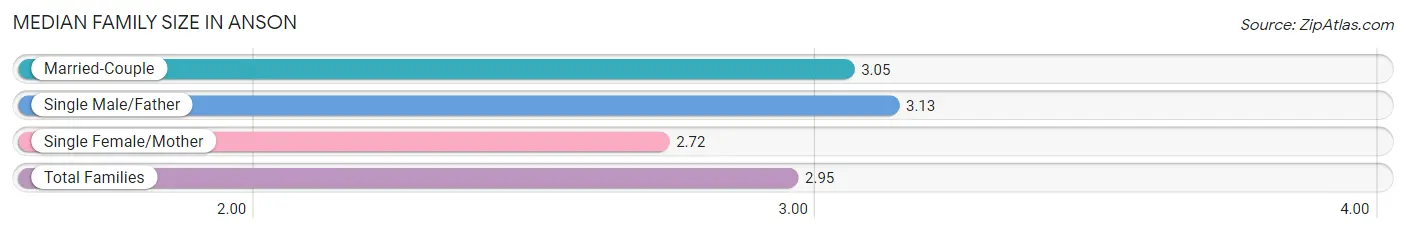
| Family Type | # Families | Family Size |
| Married-Couple | 106 (58.2%) | 3.05 |
| Single Male/Father | 16 (8.8%) | 3.13 |
| Single Female/Mother | 60 (33.0%) | 2.72 |
| Total Families | 182 (100.0%) | 2.95 |
Median Household Size in Anson
The median household size in Anson is 2.39 persons per household, with single male/father households (16 | 4.6%) accounting for the largest median household size of 4.13 persons per household. non-family households (164 | 47.4%) represent the smallest median household size with 1.42 persons per household.
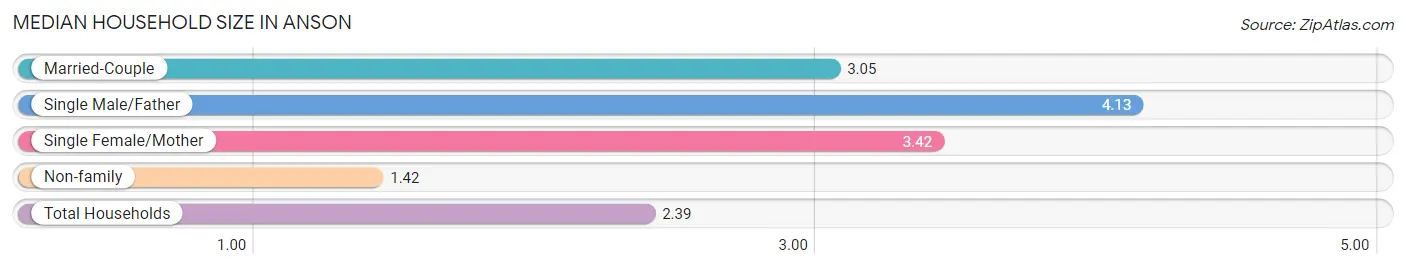
| Household Type | # Households | Household Size |
| Married-Couple | 106 (30.6%) | 3.05 |
| Single Male/Father | 16 (4.6%) | 4.13 |
| Single Female/Mother | 60 (17.3%) | 3.42 |
| Non-family | 164 (47.4%) | 1.42 |
| Total Households | 346 (100.0%) | 2.39 |
Household Size by Marriage Status in Anson
Out of a total of 346 households in Anson, 182 (52.6%) are family households, while 164 (47.4%) are nonfamily households. The most numerous type of family households are 2-person households, comprising 72, and the most common type of nonfamily households are 1-person households, comprising 99.
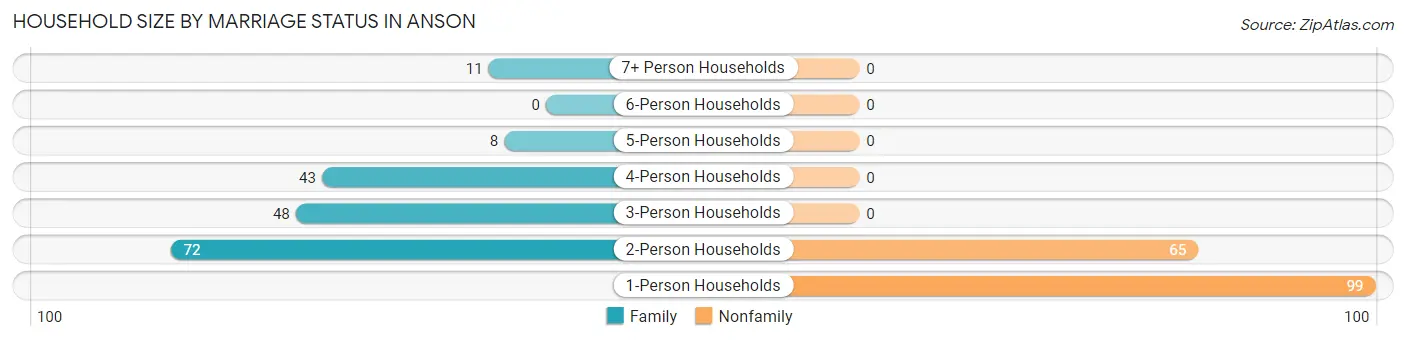
| Household Size | Family Households | Nonfamily Households |
| 1-Person Households | - | 99 (28.6%) |
| 2-Person Households | 72 (20.8%) | 65 (18.8%) |
| 3-Person Households | 48 (13.9%) | 0 (0.0%) |
| 4-Person Households | 43 (12.4%) | 0 (0.0%) |
| 5-Person Households | 8 (2.3%) | 0 (0.0%) |
| 6-Person Households | 0 (0.0%) | 0 (0.0%) |
| 7+ Person Households | 11 (3.2%) | 0 (0.0%) |
| Total | 182 (52.6%) | 164 (47.4%) |
Female Fertility in Anson
Fertility by Age in Anson
Average fertility rate in Anson is 12.0 births per 1,000 women. Women in the age bracket of 35 to 50 years have the highest fertility rate with 28.0 births per 1,000 women. Women in the age bracket of 35 to 50 years acount for 100.0% of all women with births.
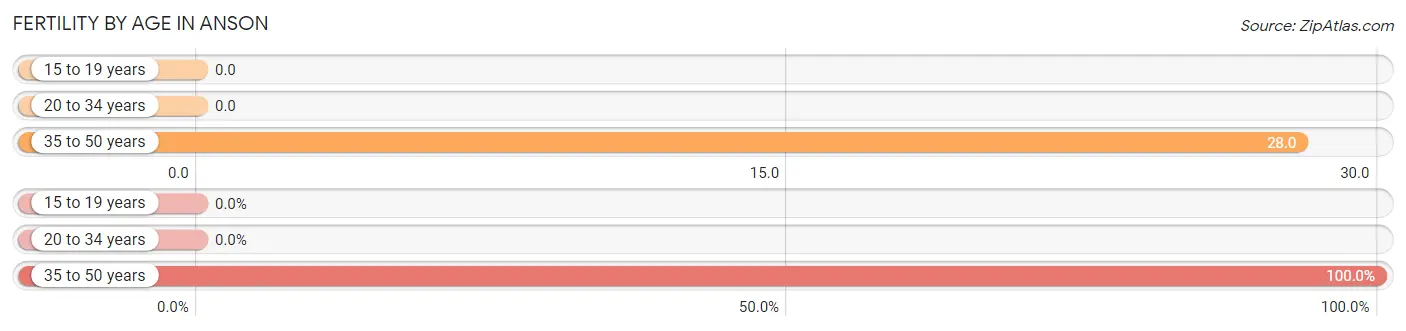
| Age Bracket | Women with Births | Births / 1,000 Women |
| 15 to 19 years | 0 (0.0%) | 0.0 |
| 20 to 34 years | 0 (0.0%) | 0.0 |
| 35 to 50 years | 2 (100.0%) | 28.0 |
| Total | 2 (100.0%) | 12.0 |
Fertility by Age by Marriage Status in Anson
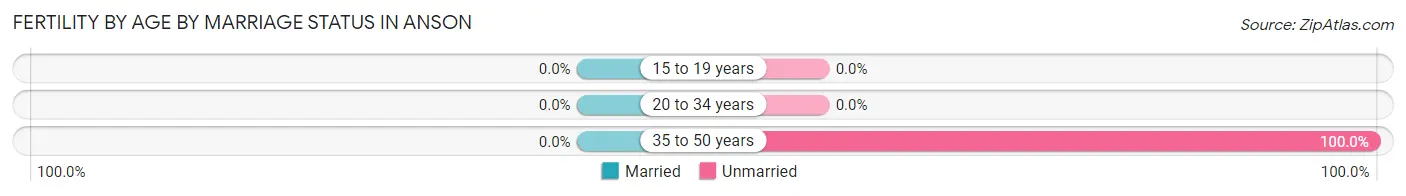
| Age Bracket | Married | Unmarried |
| 15 to 19 years | 0 (0.0%) | 0 (0.0%) |
| 20 to 34 years | 0 (0.0%) | 0 (0.0%) |
| 35 to 50 years | 0 (0.0%) | 2 (100.0%) |
| Total | 0 (0.0%) | 2 (100.0%) |
Fertility by Education in Anson
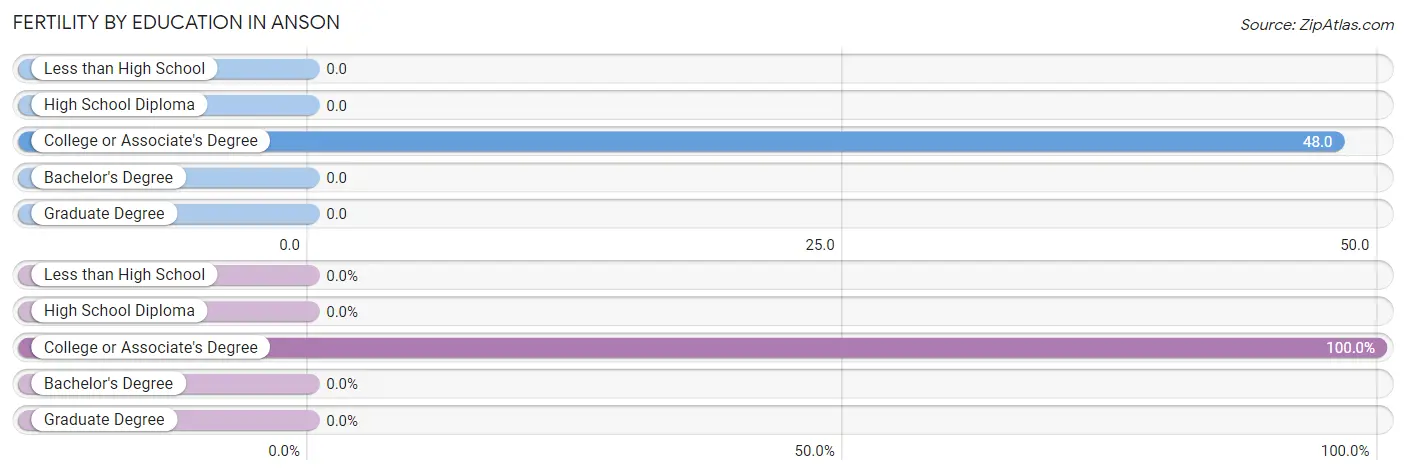
| Educational Attainment | Women with Births | Births / 1,000 Women |
| Less than High School | 0 (0.0%) | 0.0 |
| High School Diploma | 0 (0.0%) | 0.0 |
| College or Associate's Degree | 2 (100.0%) | 48.0 |
| Bachelor's Degree | 0 (0.0%) | 0.0 |
| Graduate Degree | 0 (0.0%) | 0.0 |
| Total | 2 (100.0%) | 12.0 |
Fertility by Education by Marriage Status in Anson
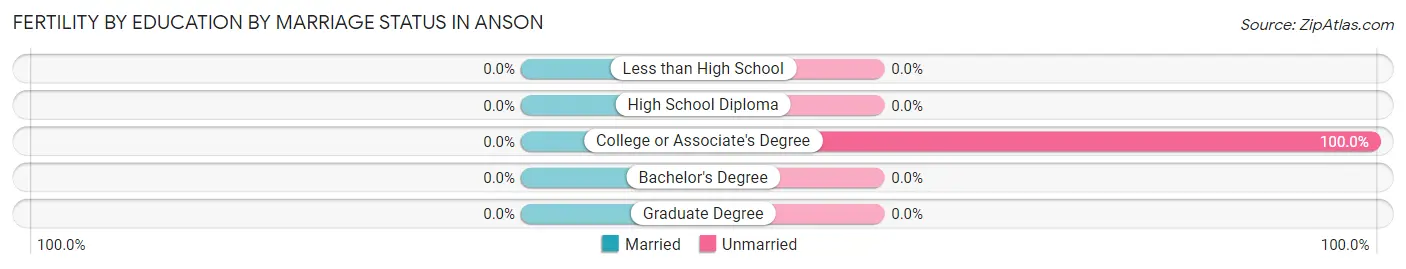
| Educational Attainment | Married | Unmarried |
| Less than High School | 0 (0.0%) | 0 (0.0%) |
| High School Diploma | 0 (0.0%) | 0 (0.0%) |
| College or Associate's Degree | 0 (0.0%) | 2 (100.0%) |
| Bachelor's Degree | 0 (0.0%) | 0 (0.0%) |
| Graduate Degree | 0 (0.0%) | 0 (0.0%) |
| Total | 0 (0.0%) | 2 (100.0%) |
Employment Characteristics in Anson
Employment by Class of Employer in Anson
Among the 328 employed individuals in Anson, private company employees (228 | 69.5%), self-employed (not incorporated) (51 | 15.5%), and not-for-profit organizations (25 | 7.6%) make up the most common classes of employment.
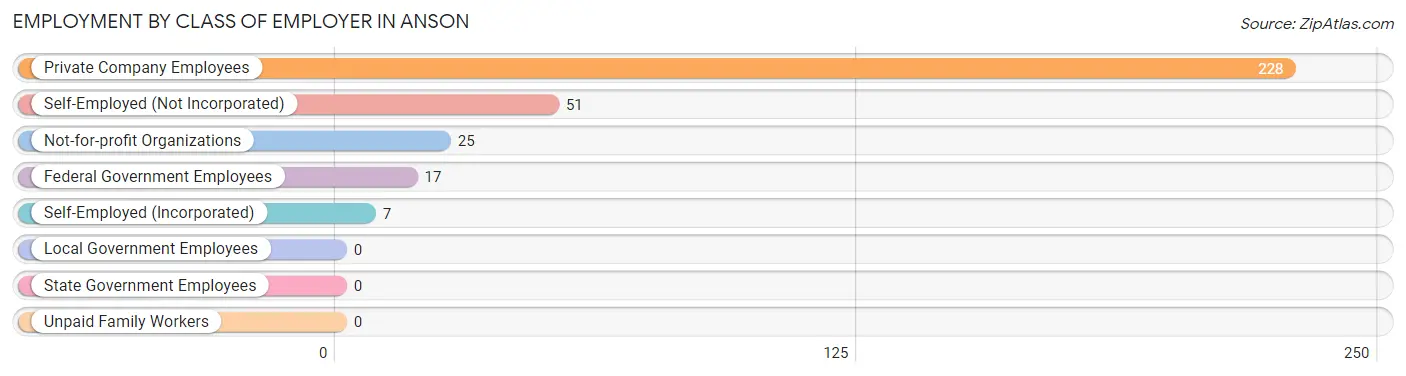
| Employer Class | # Employees | % Employees |
| Private Company Employees | 228 | 69.5% |
| Self-Employed (Incorporated) | 7 | 2.1% |
| Self-Employed (Not Incorporated) | 51 | 15.5% |
| Not-for-profit Organizations | 25 | 7.6% |
| Local Government Employees | 0 | 0.0% |
| State Government Employees | 0 | 0.0% |
| Federal Government Employees | 17 | 5.2% |
| Unpaid Family Workers | 0 | 0.0% |
| Total | 328 | 100.0% |
Employment Status by Age in Anson
According to the labor force statistics for Anson, out of the total population over 16 years of age (678), 54.4% or 369 individuals are in the labor force, with 11.6% or 43 of them unemployed. The age group with the highest labor force participation rate is 25 to 29 years, with 100.0% or 56 individuals in the labor force. Within the labor force, the 25 to 29 years age range has the highest percentage of unemployed individuals, with 41.1% or 23 of them being unemployed.
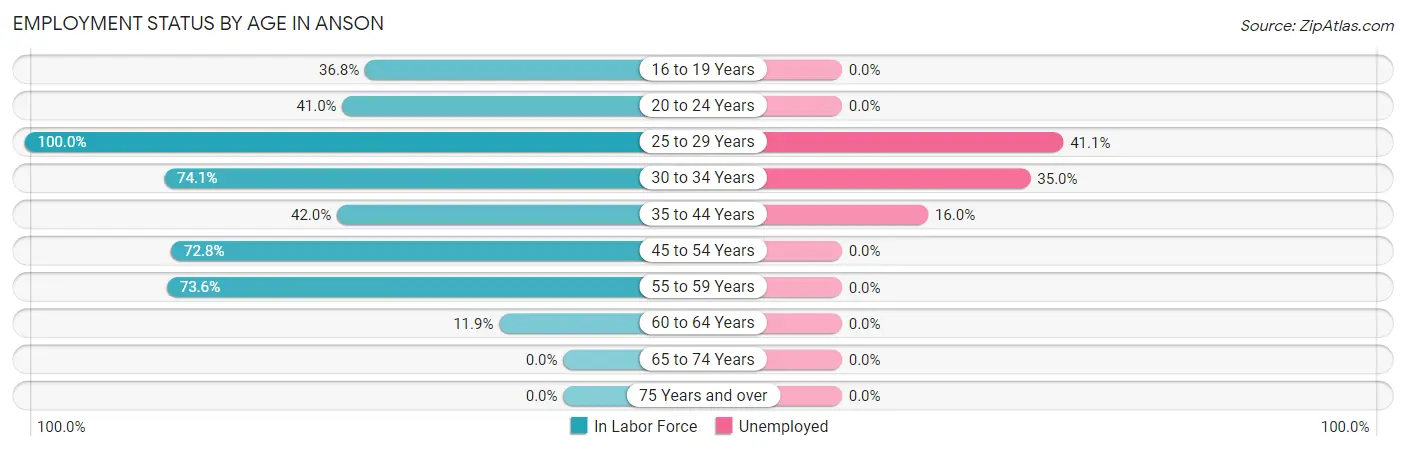
| Age Bracket | In Labor Force | Unemployed |
| 16 to 19 Years | 25 (36.8%) | 0 (0.0%) |
| 20 to 24 Years | 25 (41.0%) | 0 (0.0%) |
| 25 to 29 Years | 56 (100.0%) | 23 (41.1%) |
| 30 to 34 Years | 40 (74.1%) | 14 (35.0%) |
| 35 to 44 Years | 42 (42.0%) | 7 (16.0%) |
| 45 to 54 Years | 123 (72.8%) | 0 (0.0%) |
| 55 to 59 Years | 53 (73.6%) | 0 (0.0%) |
| 60 to 64 Years | 5 (11.9%) | 0 (0.0%) |
| 65 to 74 Years | 0 (0.0%) | 0 (0.0%) |
| 75 Years and over | 0 (0.0%) | 0 (0.0%) |
| Total | 369 (54.4%) | 43 (11.6%) |
Employment Status by Educational Attainment in Anson
According to labor force statistics for Anson, 64.7% of individuals (319) out of the total population between 25 and 64 years of age (493) are in the labor force, with 13.6% or 43 of them being unemployed. The group with the highest labor force participation rate are those with the educational attainment of high school diploma, with 85.1% or 183 individuals in the labor force. Within the labor force, individuals with less than high school education have the highest percentage of unemployment, with 35.4% or 23 of them being unemployed.
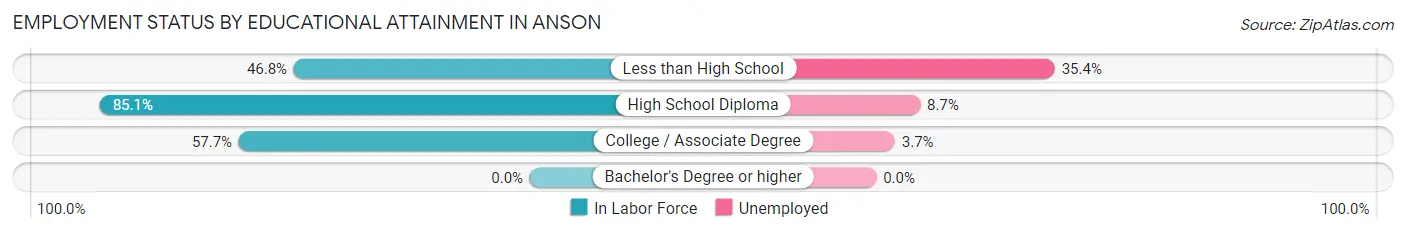
| Educational Attainment | In Labor Force | Unemployed |
| Less than High School | 65 (46.8%) | 49 (35.4%) |
| High School Diploma | 183 (85.1%) | 19 (8.7%) |
| College / Associate Degree | 71 (57.7%) | 5 (3.7%) |
| Bachelor's Degree or higher | 0 (0.0%) | 0 (0.0%) |
| Total | 319 (64.7%) | 67 (13.6%) |
Employment Occupations by Sex in Anson
Management, Business, Science and Arts Occupations
The most common Management, Business, Science and Arts occupations in Anson are Health Diagnosing & Treating (8 | 2.6%), Health Technologists (8 | 2.6%), and Management (6 | 1.9%).
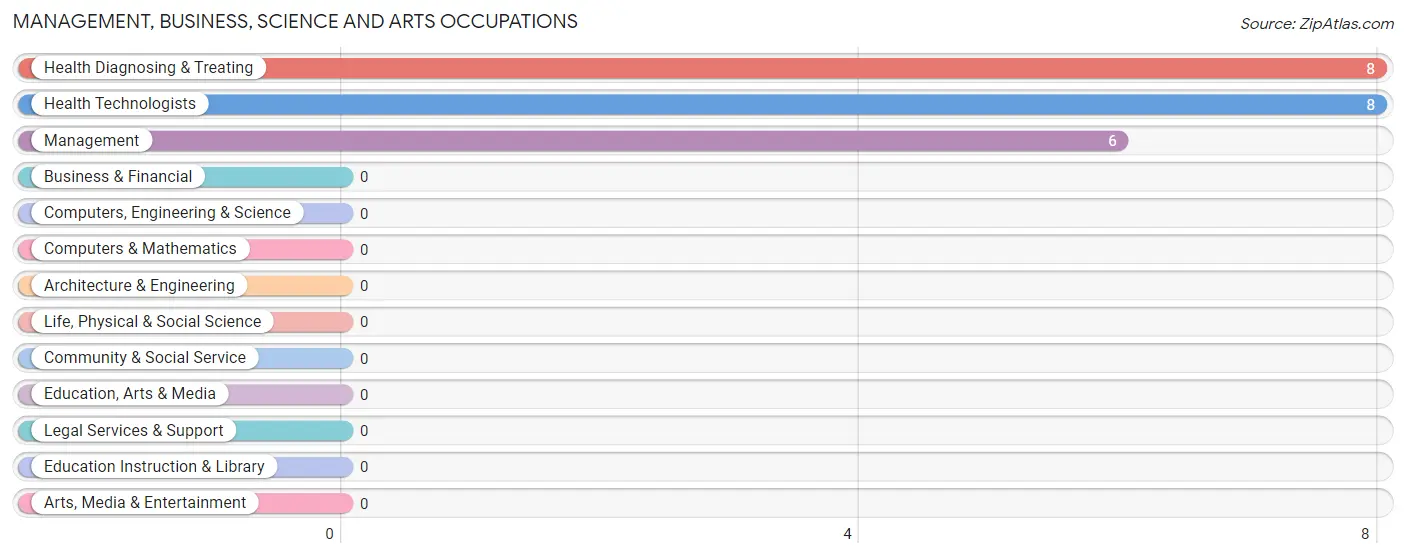
Management, Business, Science and Arts Occupations by Sex
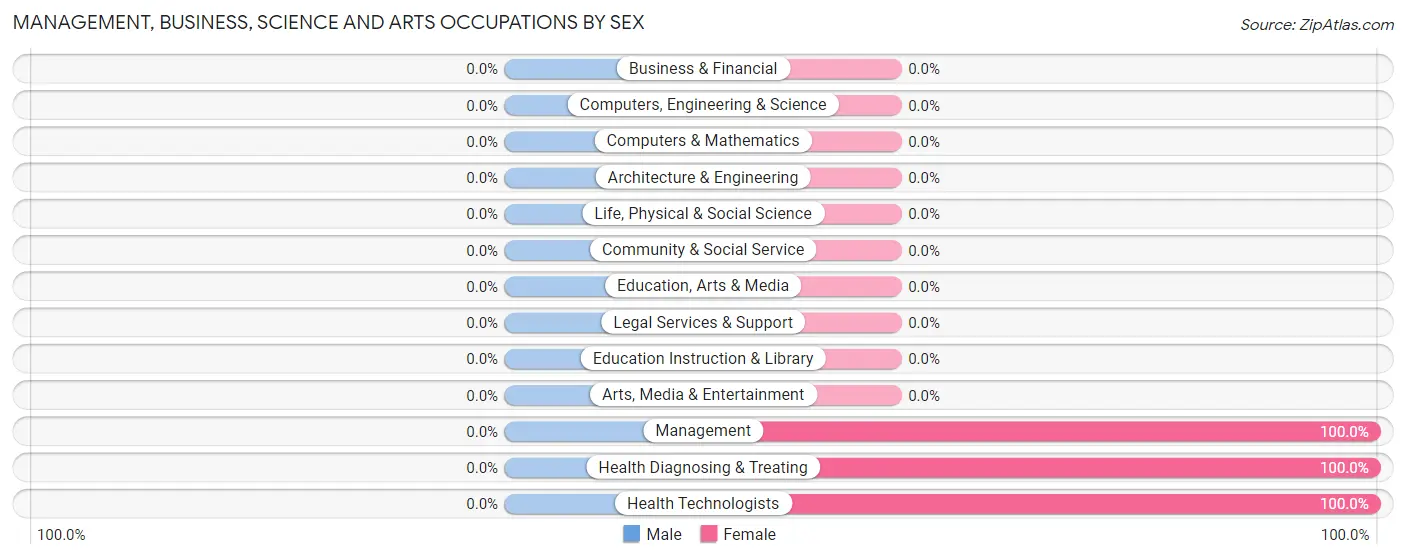
| Occupation | Male | Female |
| Management | 0 (0.0%) | 6 (100.0%) |
| Business & Financial | 0 (0.0%) | 0 (0.0%) |
| Computers, Engineering & Science | 0 (0.0%) | 0 (0.0%) |
| Computers & Mathematics | 0 (0.0%) | 0 (0.0%) |
| Architecture & Engineering | 0 (0.0%) | 0 (0.0%) |
| Life, Physical & Social Science | 0 (0.0%) | 0 (0.0%) |
| Community & Social Service | 0 (0.0%) | 0 (0.0%) |
| Education, Arts & Media | 0 (0.0%) | 0 (0.0%) |
| Legal Services & Support | 0 (0.0%) | 0 (0.0%) |
| Education Instruction & Library | 0 (0.0%) | 0 (0.0%) |
| Arts, Media & Entertainment | 0 (0.0%) | 0 (0.0%) |
| Health Diagnosing & Treating | 0 (0.0%) | 8 (100.0%) |
| Health Technologists | 0 (0.0%) | 8 (100.0%) |
| Total (Category) | 0 (0.0%) | 14 (100.0%) |
| Total (Overall) | 185 (59.5%) | 126 (40.5%) |
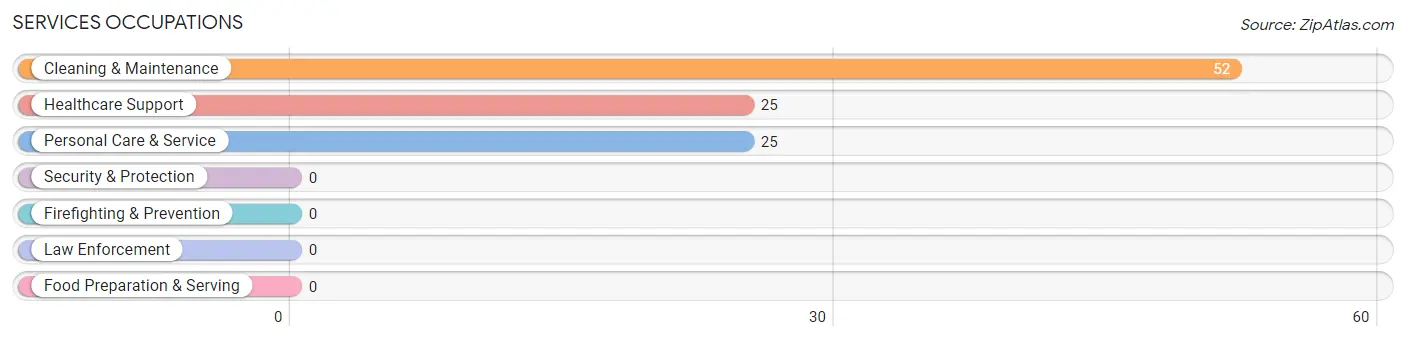
Services Occupations
The most common Services occupations in Anson are Cleaning & Maintenance (52 | 16.7%), Healthcare Support (25 | 8.0%), and Personal Care & Service (25 | 8.0%).
Services Occupations by Sex
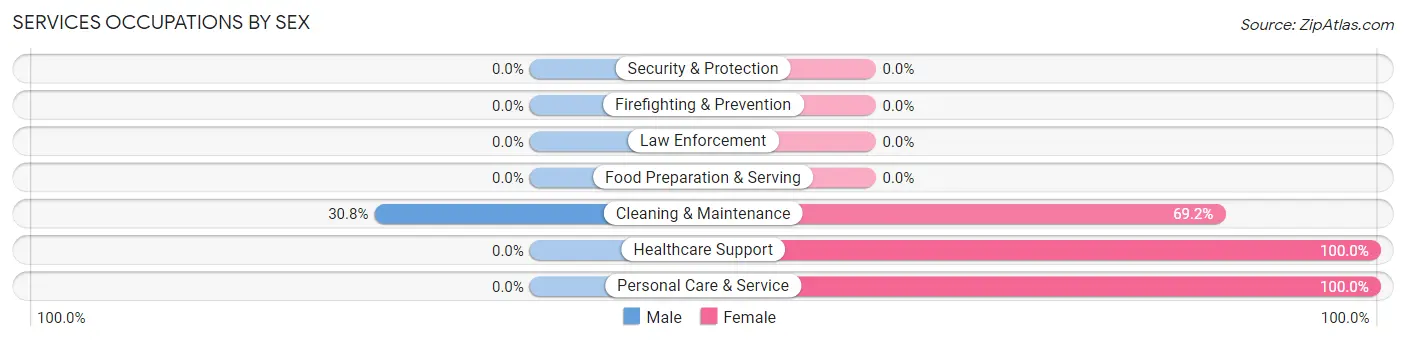
| Occupation | Male | Female |
| Healthcare Support | 0 (0.0%) | 25 (100.0%) |
| Security & Protection | 0 (0.0%) | 0 (0.0%) |
| Firefighting & Prevention | 0 (0.0%) | 0 (0.0%) |
| Law Enforcement | 0 (0.0%) | 0 (0.0%) |
| Food Preparation & Serving | 0 (0.0%) | 0 (0.0%) |
| Cleaning & Maintenance | 16 (30.8%) | 36 (69.2%) |
| Personal Care & Service | 0 (0.0%) | 25 (100.0%) |
| Total (Category) | 16 (15.7%) | 86 (84.3%) |
| Total (Overall) | 185 (59.5%) | 126 (40.5%) |
Sales and Office Occupations
The most common Sales and Office occupations in Anson are Sales & Related (26 | 8.4%), and Office & Administration (25 | 8.0%).
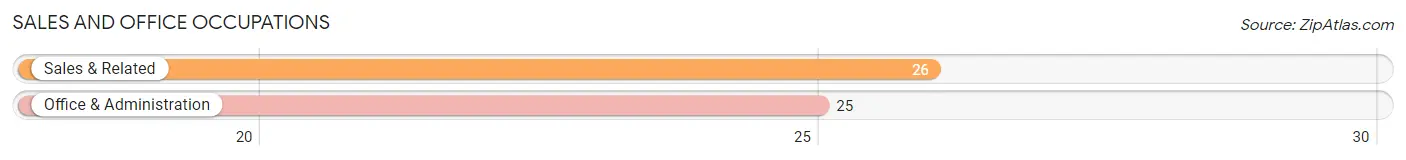
Sales and Office Occupations by Sex
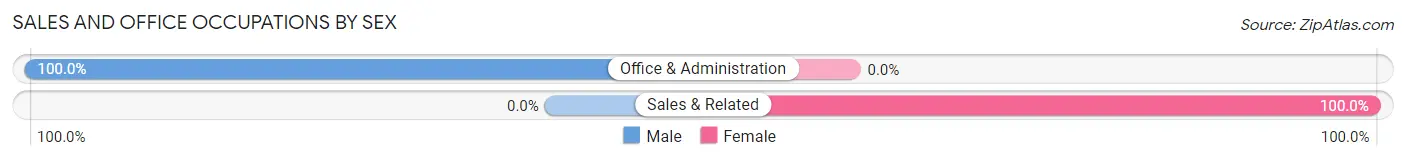
| Occupation | Male | Female |
| Sales & Related | 0 (0.0%) | 26 (100.0%) |
| Office & Administration | 25 (100.0%) | 0 (0.0%) |
| Total (Category) | 25 (49.0%) | 26 (51.0%) |
| Total (Overall) | 185 (59.5%) | 126 (40.5%) |
Natural Resources, Construction and Maintenance Occupations
The most common Natural Resources, Construction and Maintenance occupations in Anson are , and Construction & Extraction (20 | 6.4%).
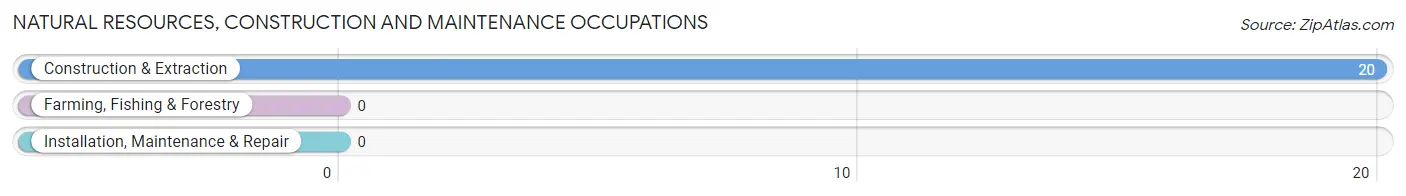
Natural Resources, Construction and Maintenance Occupations by Sex
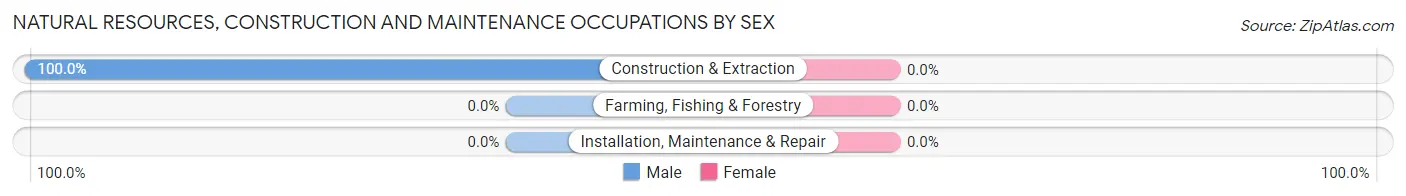
| Occupation | Male | Female |
| Farming, Fishing & Forestry | 0 (0.0%) | 0 (0.0%) |
| Construction & Extraction | 20 (100.0%) | 0 (0.0%) |
| Installation, Maintenance & Repair | 0 (0.0%) | 0 (0.0%) |
| Total (Category) | 20 (100.0%) | 0 (0.0%) |
| Total (Overall) | 185 (59.5%) | 126 (40.5%) |
Production, Transportation and Moving Occupations
The most common Production, Transportation and Moving occupations in Anson are Transportation (68 | 21.9%), Production (51 | 16.4%), and Material Moving (5 | 1.6%).
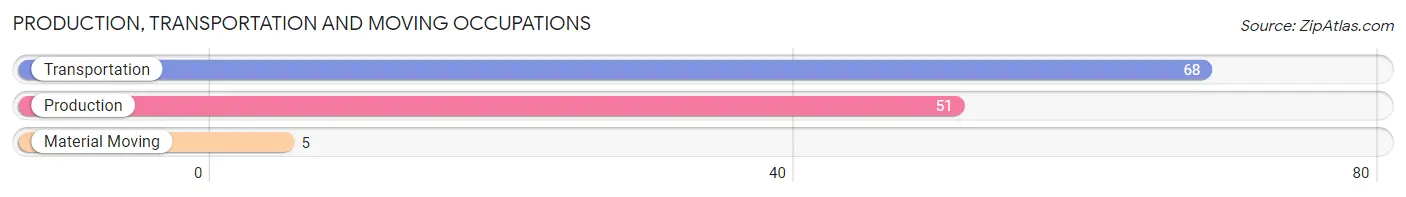
Production, Transportation and Moving Occupations by Sex
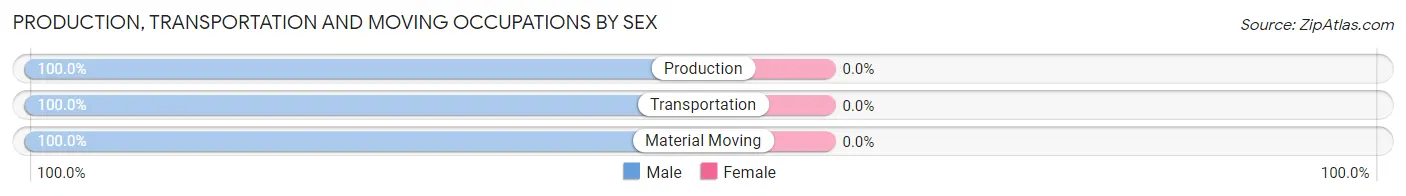
| Occupation | Male | Female |
| Production | 51 (100.0%) | 0 (0.0%) |
| Transportation | 68 (100.0%) | 0 (0.0%) |
| Material Moving | 5 (100.0%) | 0 (0.0%) |
| Total (Category) | 124 (100.0%) | 0 (0.0%) |
| Total (Overall) | 185 (59.5%) | 126 (40.5%) |
Employment Industries by Sex in Anson
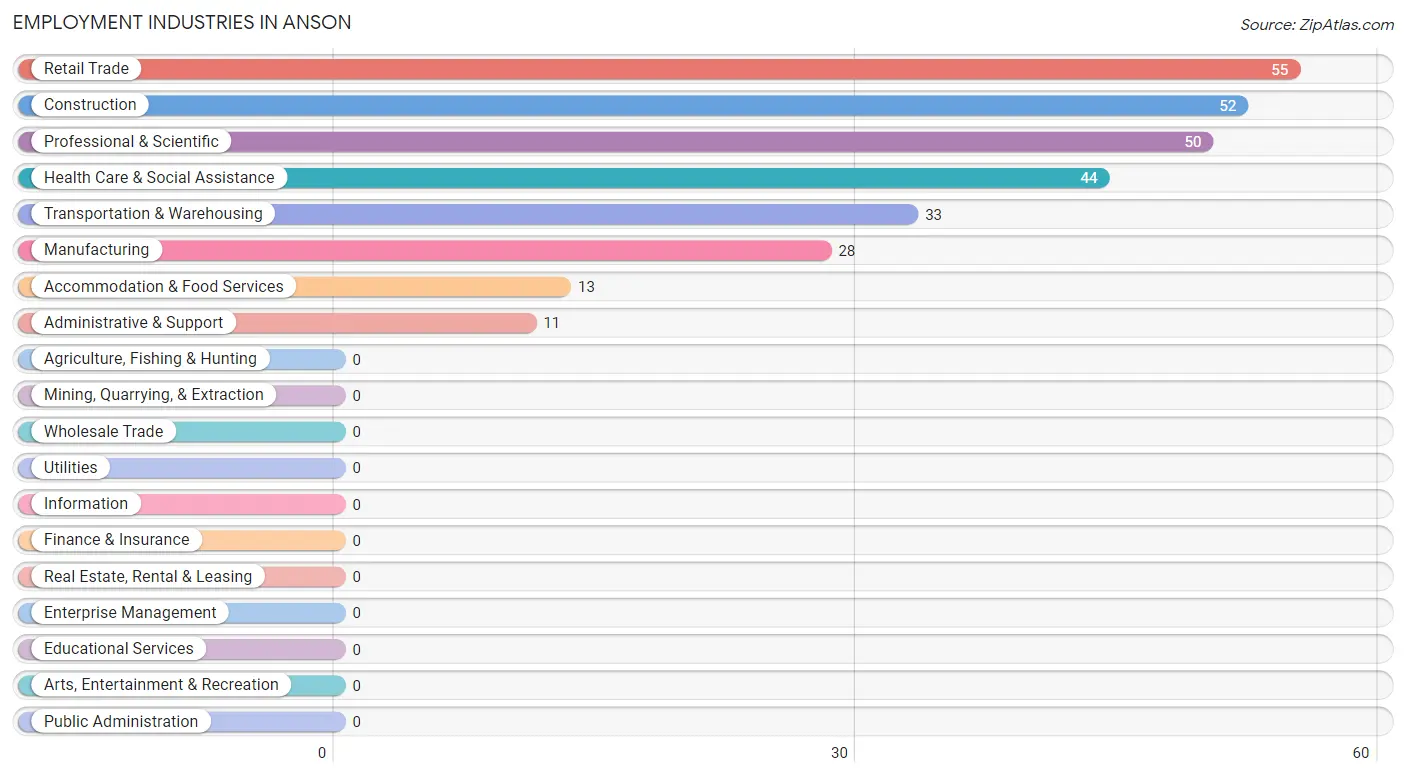
Employment Industries in Anson
The major employment industries in Anson include Retail Trade (55 | 17.7%), Construction (52 | 16.7%), Professional & Scientific (50 | 16.1%), Health Care & Social Assistance (44 | 14.1%), and Transportation & Warehousing (33 | 10.6%).
Employment Industries by Sex in Anson
The Anson industries that see more men than women are Construction (100.0%), Manufacturing (100.0%), and Transportation & Warehousing (100.0%), whereas the industries that tend to have a higher number of women are Health Care & Social Assistance (100.0%), Professional & Scientific (50.0%), and Retail Trade (47.3%).
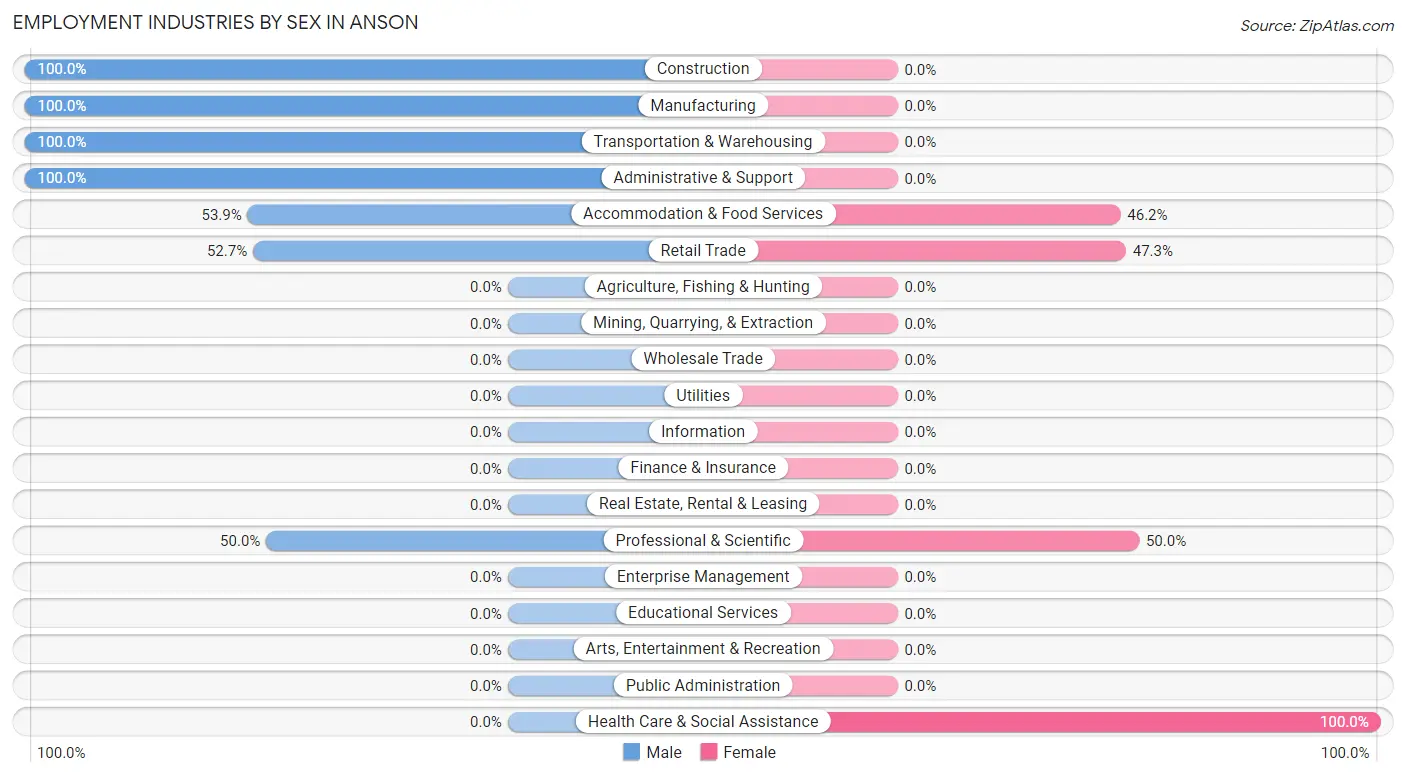
| Industry | Male | Female |
| Agriculture, Fishing & Hunting | 0 (0.0%) | 0 (0.0%) |
| Mining, Quarrying, & Extraction | 0 (0.0%) | 0 (0.0%) |
| Construction | 52 (100.0%) | 0 (0.0%) |
| Manufacturing | 28 (100.0%) | 0 (0.0%) |
| Wholesale Trade | 0 (0.0%) | 0 (0.0%) |
| Retail Trade | 29 (52.7%) | 26 (47.3%) |
| Transportation & Warehousing | 33 (100.0%) | 0 (0.0%) |
| Utilities | 0 (0.0%) | 0 (0.0%) |
| Information | 0 (0.0%) | 0 (0.0%) |
| Finance & Insurance | 0 (0.0%) | 0 (0.0%) |
| Real Estate, Rental & Leasing | 0 (0.0%) | 0 (0.0%) |
| Professional & Scientific | 25 (50.0%) | 25 (50.0%) |
| Enterprise Management | 0 (0.0%) | 0 (0.0%) |
| Administrative & Support | 11 (100.0%) | 0 (0.0%) |
| Educational Services | 0 (0.0%) | 0 (0.0%) |
| Health Care & Social Assistance | 0 (0.0%) | 44 (100.0%) |
| Arts, Entertainment & Recreation | 0 (0.0%) | 0 (0.0%) |
| Accommodation & Food Services | 7 (53.8%) | 6 (46.2%) |
| Public Administration | 0 (0.0%) | 0 (0.0%) |
| Total | 185 (59.5%) | 126 (40.5%) |
Education in Anson
School Enrollment in Anson
The most common levels of schooling among the 166 students in Anson are middle school (83 | 50.0%), high school (45 | 27.1%), and elementary school (32 | 19.3%).
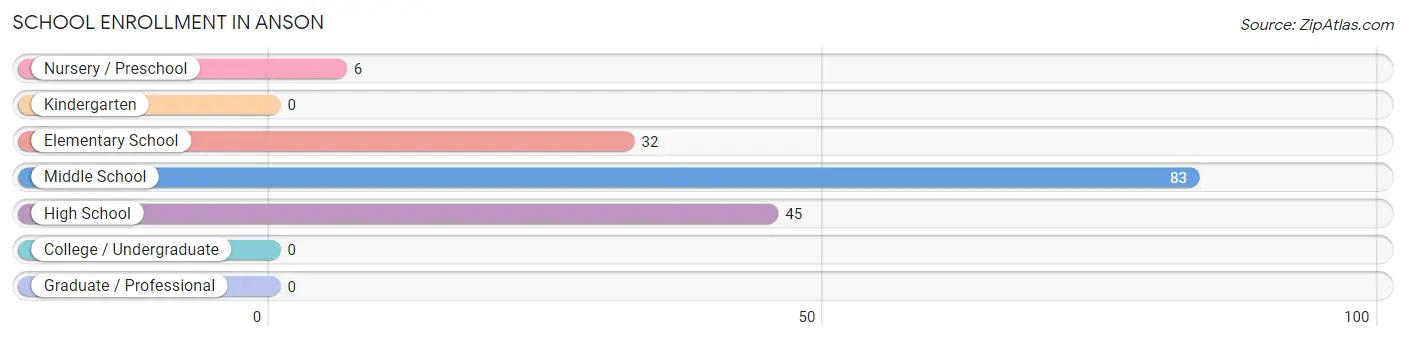
| School Level | # Students | % Students |
| Nursery / Preschool | 6 | 3.6% |
| Kindergarten | 0 | 0.0% |
| Elementary School | 32 | 19.3% |
| Middle School | 83 | 50.0% |
| High School | 45 | 27.1% |
| College / Undergraduate | 0 | 0.0% |
| Graduate / Professional | 0 | 0.0% |
| Total | 166 | 100.0% |
School Enrollment by Age by Funding Source in Anson
Out of a total of 166 students who are enrolled in schools in Anson, 54 (32.5%) attend a private institution, while the remaining 112 (67.5%) are enrolled in public schools. The age group of 3 to 4 year olds has the highest likelihood of being enrolled in private schools, with 6 (100.0% in the age bracket) enrolled. Conversely, the age group of 15 to 17 year olds has the lowest likelihood of being enrolled in a private school, with 26 (100.0% in the age bracket) attending a public institution.
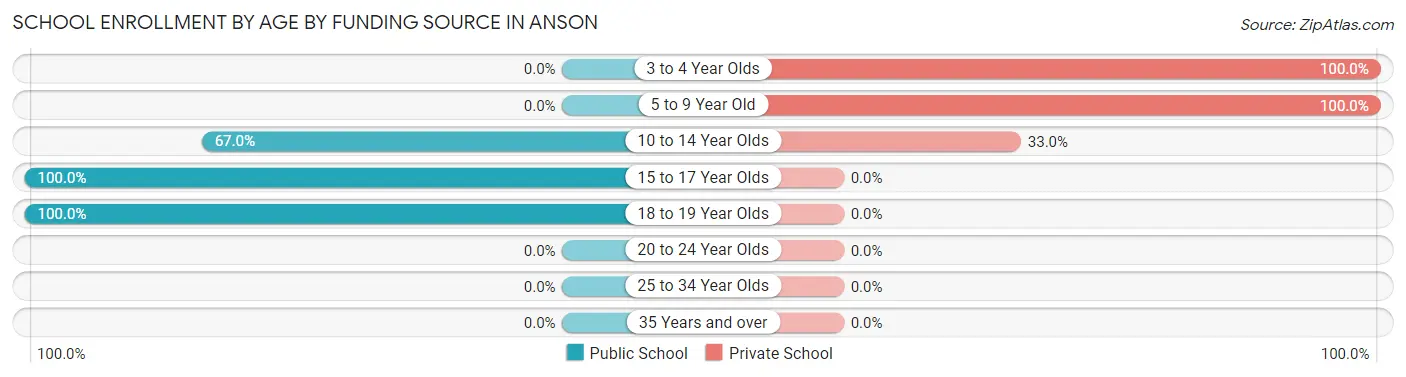
| Age Bracket | Public School | Private School |
| 3 to 4 Year Olds | 0 (0.0%) | 6 (100.0%) |
| 5 to 9 Year Old | 0 (0.0%) | 15 (100.0%) |
| 10 to 14 Year Olds | 67 (67.0%) | 33 (33.0%) |
| 15 to 17 Year Olds | 26 (100.0%) | 0 (0.0%) |
| 18 to 19 Year Olds | 19 (100.0%) | 0 (0.0%) |
| 20 to 24 Year Olds | 0 (0.0%) | 0 (0.0%) |
| 25 to 34 Year Olds | 0 (0.0%) | 0 (0.0%) |
| 35 Years and over | 0 (0.0%) | 0 (0.0%) |
| Total | 112 (67.5%) | 54 (32.5%) |
Educational Attainment by Field of Study in Anson
Computers & mathematics (8 | 22.9%), business (8 | 22.9%), visual & performing arts (8 | 22.9%), literature & languages (7 | 20.0%), and social sciences (4 | 11.4%) are the most common fields of study among 35 individuals in Anson who have obtained a bachelor's degree or higher.
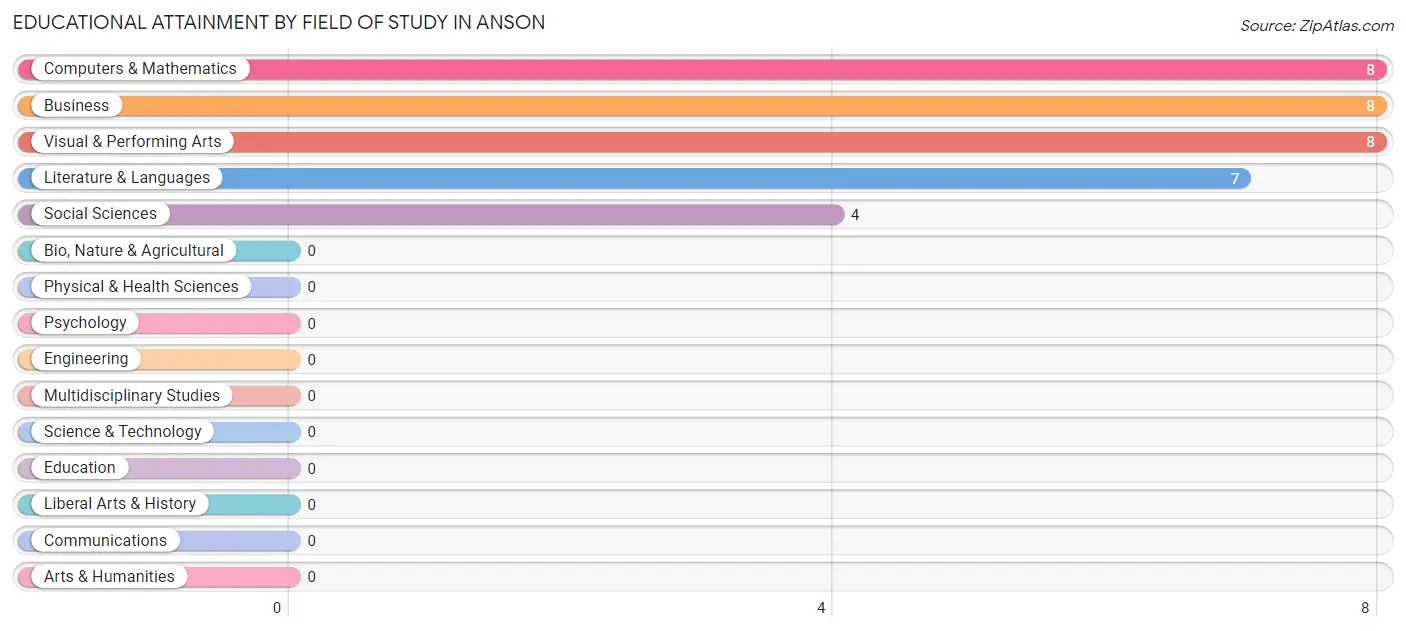
| Field of Study | # Graduates | % Graduates |
| Computers & Mathematics | 8 | 22.9% |
| Bio, Nature & Agricultural | 0 | 0.0% |
| Physical & Health Sciences | 0 | 0.0% |
| Psychology | 0 | 0.0% |
| Social Sciences | 4 | 11.4% |
| Engineering | 0 | 0.0% |
| Multidisciplinary Studies | 0 | 0.0% |
| Science & Technology | 0 | 0.0% |
| Business | 8 | 22.9% |
| Education | 0 | 0.0% |
| Literature & Languages | 7 | 20.0% |
| Liberal Arts & History | 0 | 0.0% |
| Visual & Performing Arts | 8 | 22.9% |
| Communications | 0 | 0.0% |
| Arts & Humanities | 0 | 0.0% |
| Total | 35 | 100.0% |
Transportation & Commute in Anson
Vehicle Availability by Sex in Anson
The most prevalent vehicle ownership categories in Anson are males with 1 vehicle (124, accounting for 61.4%) and females with 1 vehicle (68, making up 98.4%).
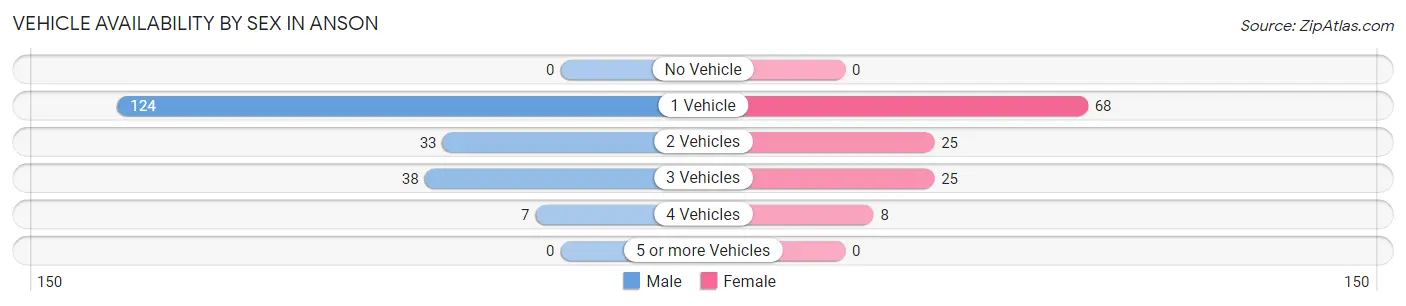
| Vehicles Available | Male | Female |
| No Vehicle | 0 (0.0%) | 0 (0.0%) |
| 1 Vehicle | 124 (61.4%) | 68 (54.0%) |
| 2 Vehicles | 33 (16.3%) | 25 (19.8%) |
| 3 Vehicles | 38 (18.8%) | 25 (19.8%) |
| 4 Vehicles | 7 (3.5%) | 8 (6.4%) |
| 5 or more Vehicles | 0 (0.0%) | 0 (0.0%) |
| Total | 202 (100.0%) | 126 (100.0%) |
Commute Time in Anson
The most frequently occuring commute durations in Anson are 10 to 14 minutes (67 commuters, 22.1%), 30 to 34 minutes (67 commuters, 22.1%), and 60 to 89 minutes (67 commuters, 22.1%).
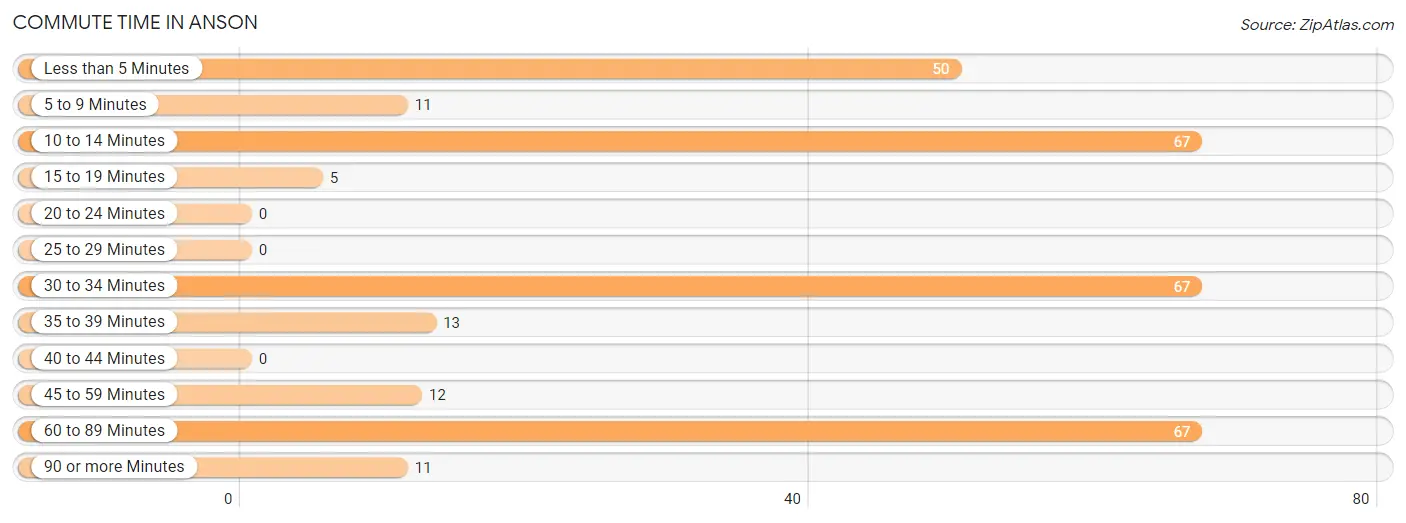
| Commute Time | # Commuters | % Commuters |
| Less than 5 Minutes | 50 | 16.5% |
| 5 to 9 Minutes | 11 | 3.6% |
| 10 to 14 Minutes | 67 | 22.1% |
| 15 to 19 Minutes | 5 | 1.7% |
| 20 to 24 Minutes | 0 | 0.0% |
| 25 to 29 Minutes | 0 | 0.0% |
| 30 to 34 Minutes | 67 | 22.1% |
| 35 to 39 Minutes | 13 | 4.3% |
| 40 to 44 Minutes | 0 | 0.0% |
| 45 to 59 Minutes | 12 | 4.0% |
| 60 to 89 Minutes | 67 | 22.1% |
| 90 or more Minutes | 11 | 3.6% |
Commute Time by Sex in Anson
The most common commute times in Anson are 30 to 34 minutes (67 commuters, 33.2%) for males and 10 to 14 minutes (51 commuters, 50.5%) for females.
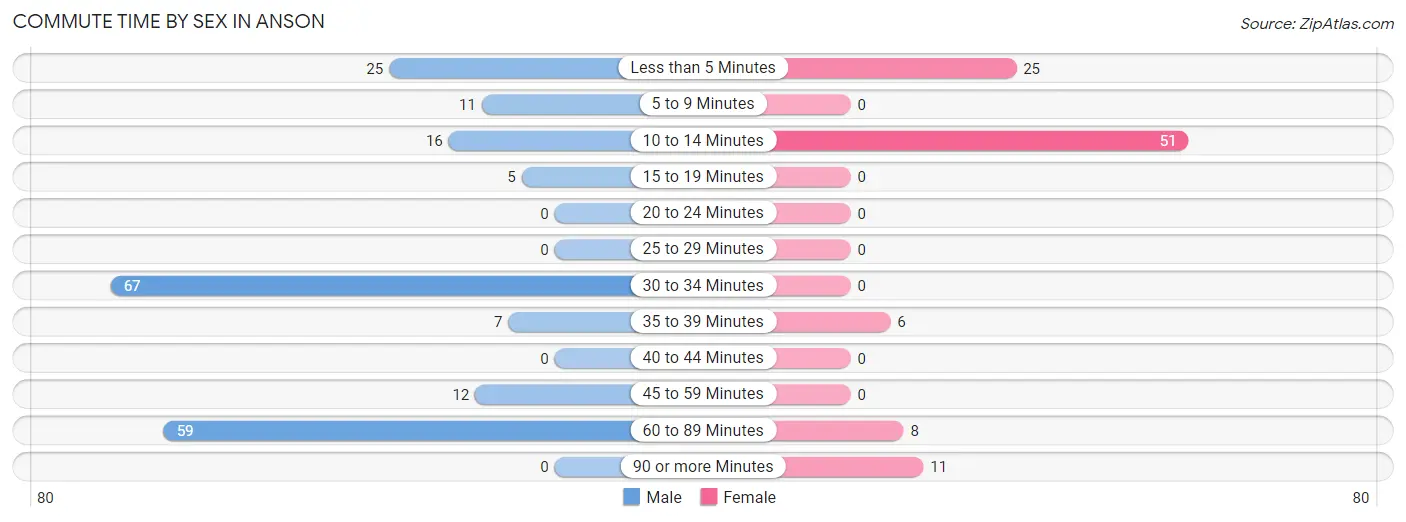
| Commute Time | Male | Female |
| Less than 5 Minutes | 25 (12.4%) | 25 (24.7%) |
| 5 to 9 Minutes | 11 (5.4%) | 0 (0.0%) |
| 10 to 14 Minutes | 16 (7.9%) | 51 (50.5%) |
| 15 to 19 Minutes | 5 (2.5%) | 0 (0.0%) |
| 20 to 24 Minutes | 0 (0.0%) | 0 (0.0%) |
| 25 to 29 Minutes | 0 (0.0%) | 0 (0.0%) |
| 30 to 34 Minutes | 67 (33.2%) | 0 (0.0%) |
| 35 to 39 Minutes | 7 (3.5%) | 6 (5.9%) |
| 40 to 44 Minutes | 0 (0.0%) | 0 (0.0%) |
| 45 to 59 Minutes | 12 (5.9%) | 0 (0.0%) |
| 60 to 89 Minutes | 59 (29.2%) | 8 (7.9%) |
| 90 or more Minutes | 0 (0.0%) | 11 (10.9%) |
Time of Departure to Work by Sex in Anson
The most frequent times of departure to work in Anson are 5:30 AM to 5:59 AM (53, 26.2%) for males and 12:00 PM to 3:59 PM (56, 55.4%) for females.
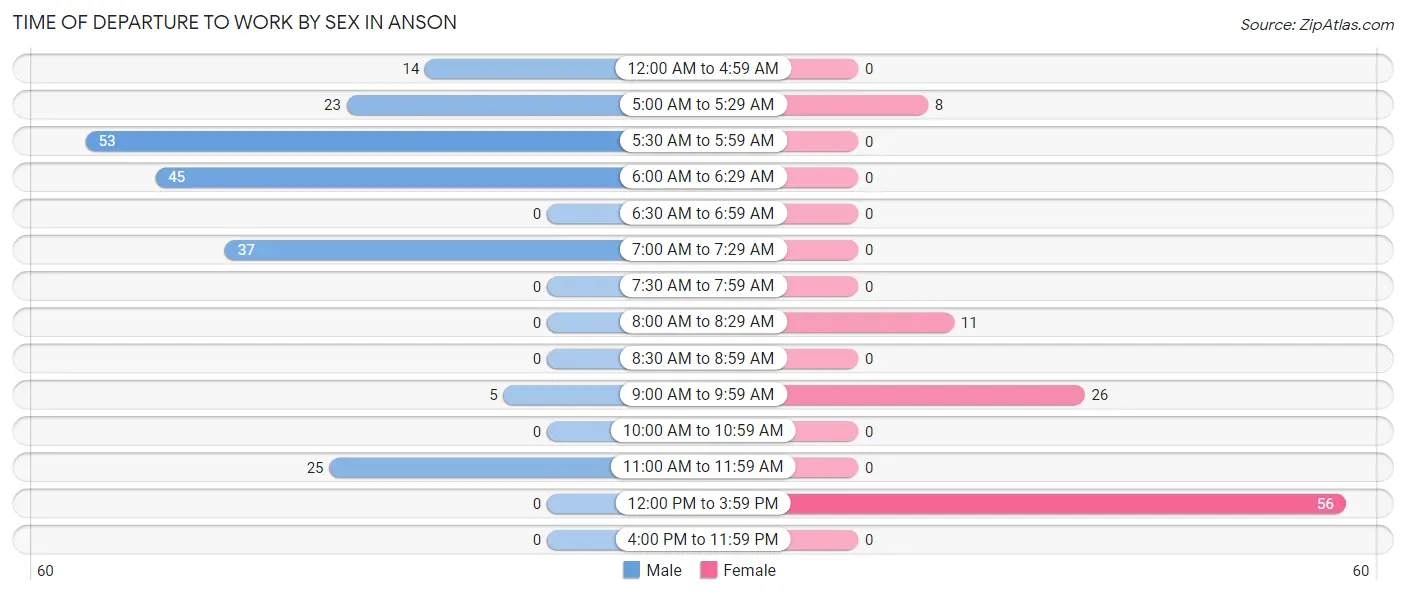
| Time of Departure | Male | Female |
| 12:00 AM to 4:59 AM | 14 (6.9%) | 0 (0.0%) |
| 5:00 AM to 5:29 AM | 23 (11.4%) | 8 (7.9%) |
| 5:30 AM to 5:59 AM | 53 (26.2%) | 0 (0.0%) |
| 6:00 AM to 6:29 AM | 45 (22.3%) | 0 (0.0%) |
| 6:30 AM to 6:59 AM | 0 (0.0%) | 0 (0.0%) |
| 7:00 AM to 7:29 AM | 37 (18.3%) | 0 (0.0%) |
| 7:30 AM to 7:59 AM | 0 (0.0%) | 0 (0.0%) |
| 8:00 AM to 8:29 AM | 0 (0.0%) | 11 (10.9%) |
| 8:30 AM to 8:59 AM | 0 (0.0%) | 0 (0.0%) |
| 9:00 AM to 9:59 AM | 5 (2.5%) | 26 (25.7%) |
| 10:00 AM to 10:59 AM | 0 (0.0%) | 0 (0.0%) |
| 11:00 AM to 11:59 AM | 25 (12.4%) | 0 (0.0%) |
| 12:00 PM to 3:59 PM | 0 (0.0%) | 56 (55.4%) |
| 4:00 PM to 11:59 PM | 0 (0.0%) | 0 (0.0%) |
| Total | 202 (100.0%) | 101 (100.0%) |
Housing Occupancy in Anson
Occupancy by Ownership in Anson
Of the total 346 dwellings in Anson, owner-occupied units account for 199 (57.5%), while renter-occupied units make up 147 (42.5%).
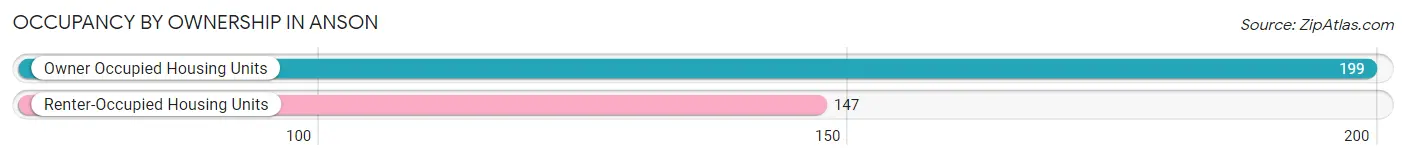
| Occupancy | # Housing Units | % Housing Units |
| Owner Occupied Housing Units | 199 | 57.5% |
| Renter-Occupied Housing Units | 147 | 42.5% |
| Total Occupied Housing Units | 346 | 100.0% |
Occupancy by Household Size in Anson
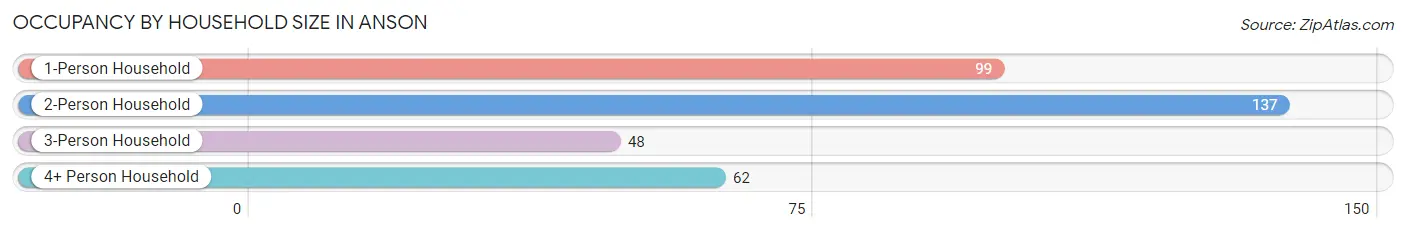
| Household Size | # Housing Units | % Housing Units |
| 1-Person Household | 99 | 28.6% |
| 2-Person Household | 137 | 39.6% |
| 3-Person Household | 48 | 13.9% |
| 4+ Person Household | 62 | 17.9% |
| Total Housing Units | 346 | 100.0% |
Occupancy by Ownership by Household Size in Anson
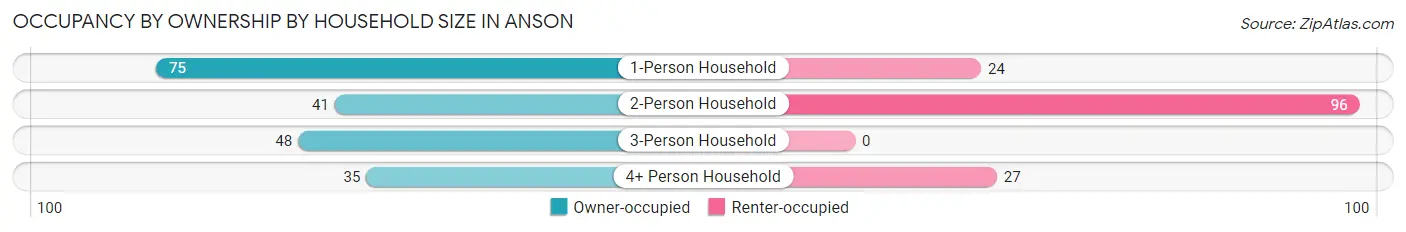
| Household Size | Owner-occupied | Renter-occupied |
| 1-Person Household | 75 (75.8%) | 24 (24.2%) |
| 2-Person Household | 41 (29.9%) | 96 (70.1%) |
| 3-Person Household | 48 (100.0%) | 0 (0.0%) |
| 4+ Person Household | 35 (56.5%) | 27 (43.5%) |
| Total Housing Units | 199 (57.5%) | 147 (42.5%) |
Occupancy by Educational Attainment in Anson
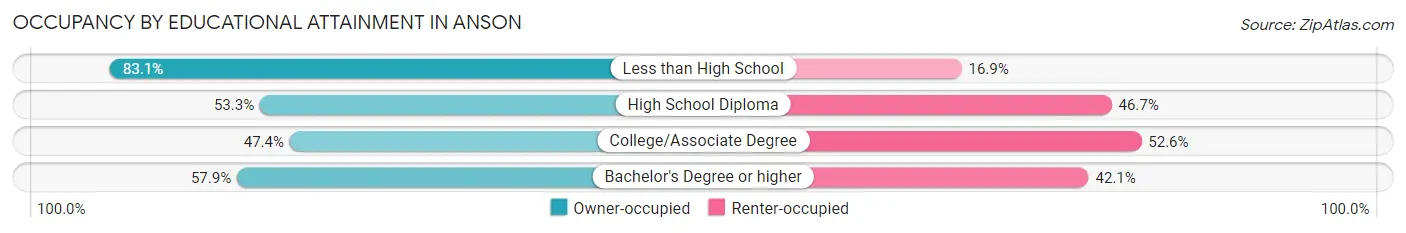
| Household Size | Owner-occupied | Renter-occupied |
| Less than High School | 54 (83.1%) | 11 (16.9%) |
| High School Diploma | 88 (53.3%) | 77 (46.7%) |
| College/Associate Degree | 46 (47.4%) | 51 (52.6%) |
| Bachelor's Degree or higher | 11 (57.9%) | 8 (42.1%) |
Occupancy by Age of Householder in Anson
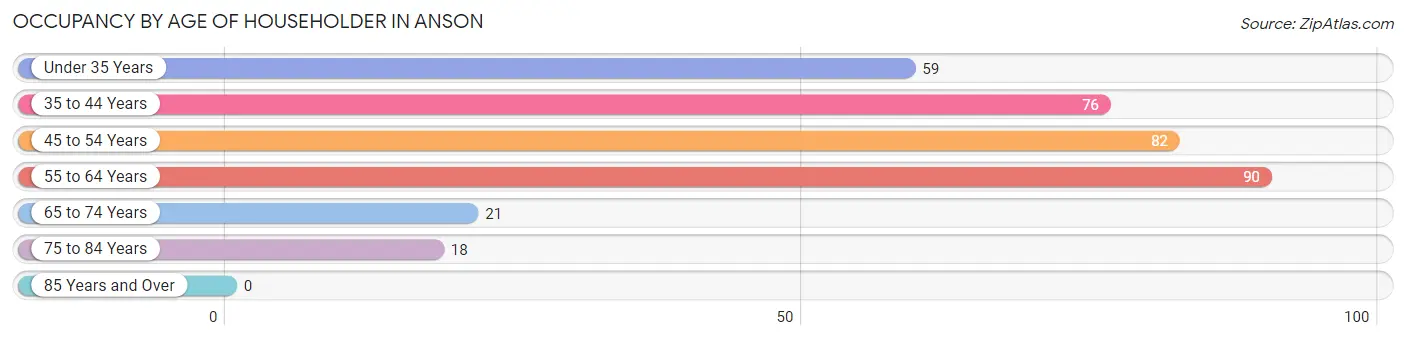
| Age Bracket | # Households | % Households |
| Under 35 Years | 59 | 17.1% |
| 35 to 44 Years | 76 | 22.0% |
| 45 to 54 Years | 82 | 23.7% |
| 55 to 64 Years | 90 | 26.0% |
| 65 to 74 Years | 21 | 6.1% |
| 75 to 84 Years | 18 | 5.2% |
| 85 Years and Over | 0 | 0.0% |
| Total | 346 | 100.0% |
Housing Finances in Anson
Median Income by Occupancy in Anson
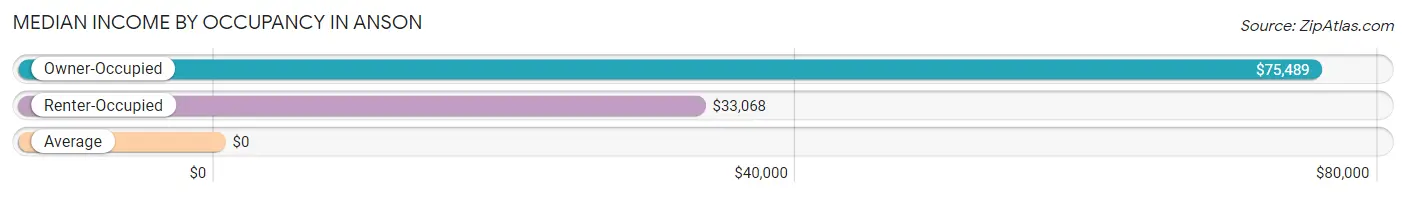
| Occupancy Type | # Households | Median Income |
| Owner-Occupied | 199 (57.5%) | $75,489 |
| Renter-Occupied | 147 (42.5%) | $33,068 |
| Average | 346 (100.0%) | $0 |
Occupancy by Householder Income Bracket in Anson
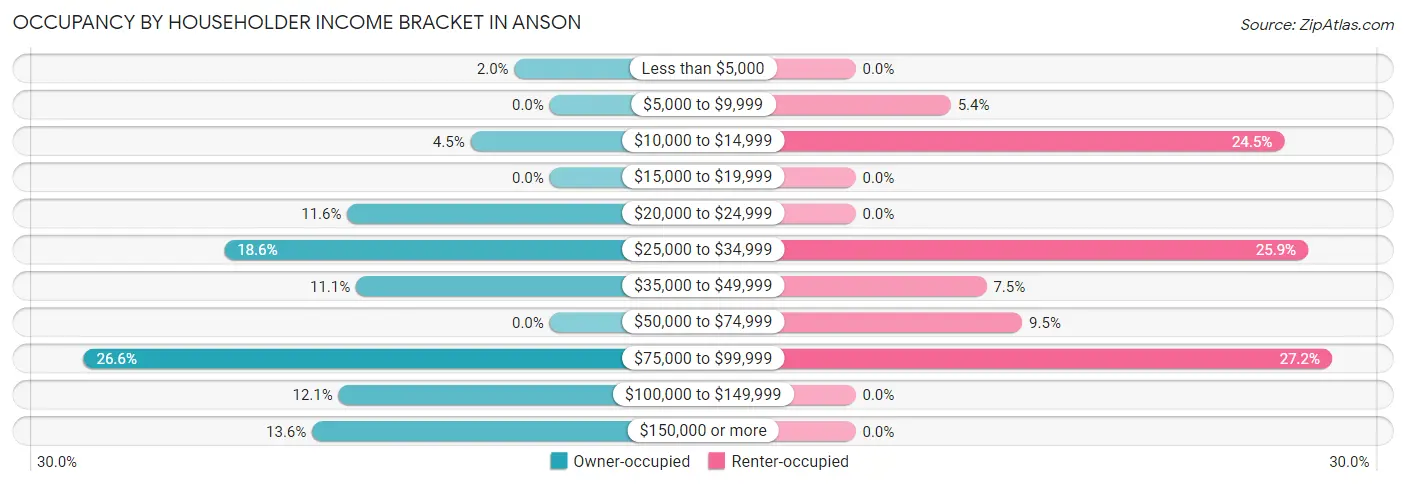
| Income Bracket | Owner-occupied | Renter-occupied |
| Less than $5,000 | 4 (2.0%) | 0 (0.0%) |
| $5,000 to $9,999 | 0 (0.0%) | 8 (5.4%) |
| $10,000 to $14,999 | 9 (4.5%) | 36 (24.5%) |
| $15,000 to $19,999 | 0 (0.0%) | 0 (0.0%) |
| $20,000 to $24,999 | 23 (11.6%) | 0 (0.0%) |
| $25,000 to $34,999 | 37 (18.6%) | 38 (25.9%) |
| $35,000 to $49,999 | 22 (11.1%) | 11 (7.5%) |
| $50,000 to $74,999 | 0 (0.0%) | 14 (9.5%) |
| $75,000 to $99,999 | 53 (26.6%) | 40 (27.2%) |
| $100,000 to $149,999 | 24 (12.1%) | 0 (0.0%) |
| $150,000 or more | 27 (13.6%) | 0 (0.0%) |
| Total | 199 (100.0%) | 147 (100.0%) |
Monthly Housing Cost Tiers in Anson
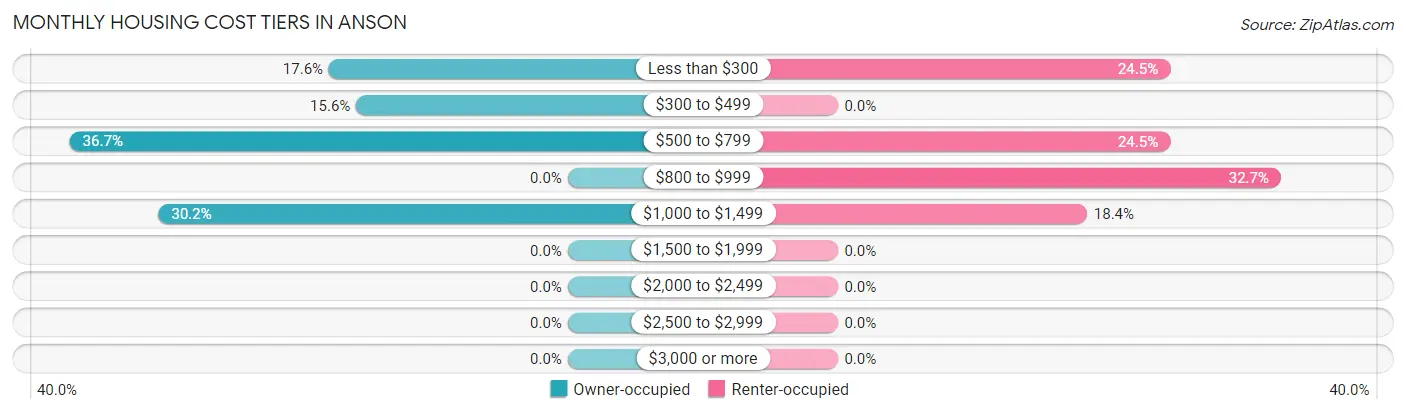
| Monthly Cost | Owner-occupied | Renter-occupied |
| Less than $300 | 35 (17.6%) | 36 (24.5%) |
| $300 to $499 | 31 (15.6%) | 0 (0.0%) |
| $500 to $799 | 73 (36.7%) | 36 (24.5%) |
| $800 to $999 | 0 (0.0%) | 48 (32.7%) |
| $1,000 to $1,499 | 60 (30.1%) | 27 (18.4%) |
| $1,500 to $1,999 | 0 (0.0%) | 0 (0.0%) |
| $2,000 to $2,499 | 0 (0.0%) | 0 (0.0%) |
| $2,500 to $2,999 | 0 (0.0%) | 0 (0.0%) |
| $3,000 or more | 0 (0.0%) | 0 (0.0%) |
| Total | 199 (100.0%) | 147 (100.0%) |
Physical Housing Characteristics in Anson
Housing Structures in Anson
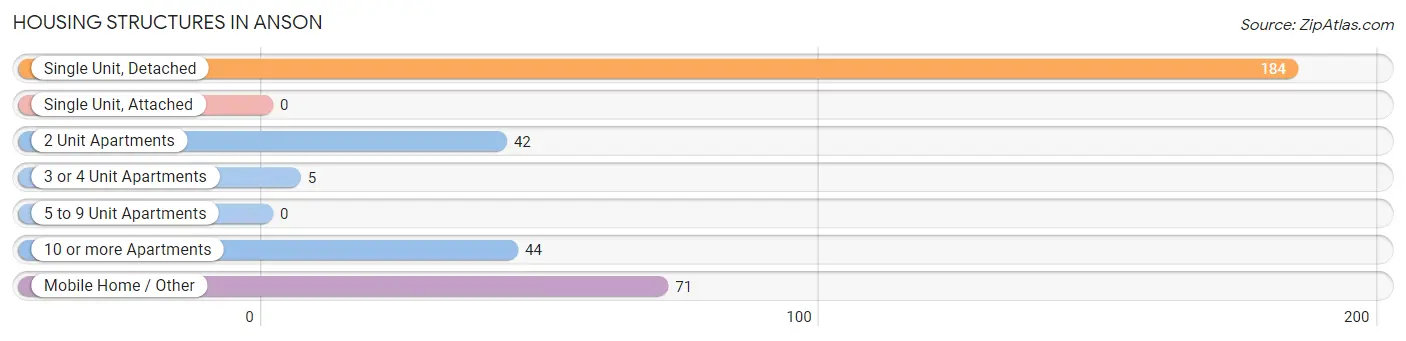
| Structure Type | # Housing Units | % Housing Units |
| Single Unit, Detached | 184 | 53.2% |
| Single Unit, Attached | 0 | 0.0% |
| 2 Unit Apartments | 42 | 12.1% |
| 3 or 4 Unit Apartments | 5 | 1.5% |
| 5 to 9 Unit Apartments | 0 | 0.0% |
| 10 or more Apartments | 44 | 12.7% |
| Mobile Home / Other | 71 | 20.5% |
| Total | 346 | 100.0% |
Housing Structures by Occupancy in Anson
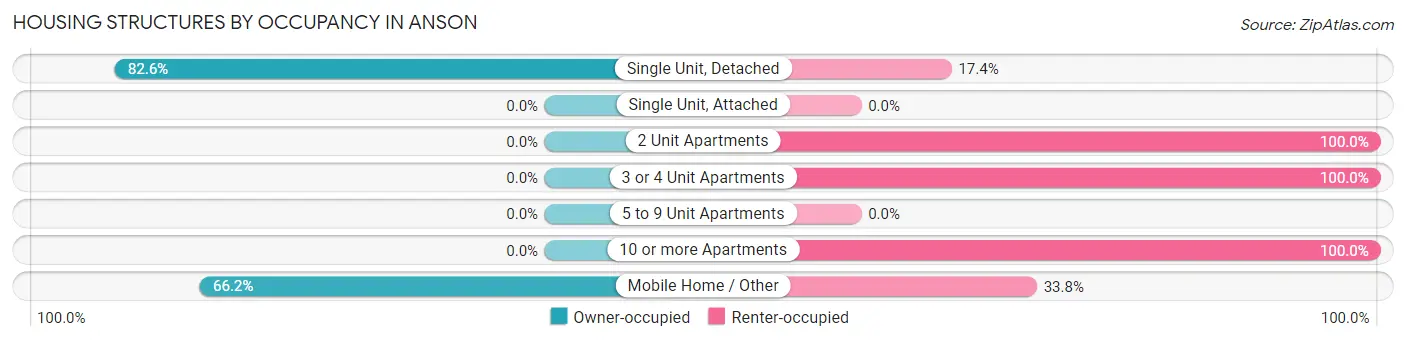
| Structure Type | Owner-occupied | Renter-occupied |
| Single Unit, Detached | 152 (82.6%) | 32 (17.4%) |
| Single Unit, Attached | 0 (0.0%) | 0 (0.0%) |
| 2 Unit Apartments | 0 (0.0%) | 42 (100.0%) |
| 3 or 4 Unit Apartments | 0 (0.0%) | 5 (100.0%) |
| 5 to 9 Unit Apartments | 0 (0.0%) | 0 (0.0%) |
| 10 or more Apartments | 0 (0.0%) | 44 (100.0%) |
| Mobile Home / Other | 47 (66.2%) | 24 (33.8%) |
| Total | 199 (57.5%) | 147 (42.5%) |
Housing Structures by Number of Rooms in Anson
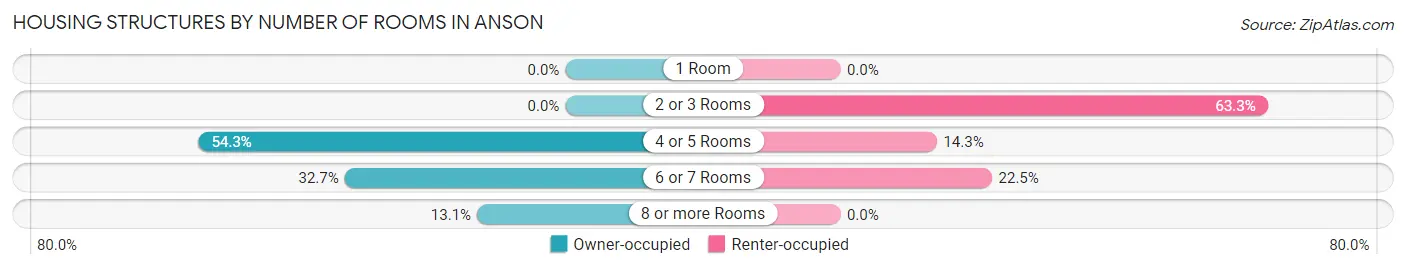
| Number of Rooms | Owner-occupied | Renter-occupied |
| 1 Room | 0 (0.0%) | 0 (0.0%) |
| 2 or 3 Rooms | 0 (0.0%) | 93 (63.3%) |
| 4 or 5 Rooms | 108 (54.3%) | 21 (14.3%) |
| 6 or 7 Rooms | 65 (32.7%) | 33 (22.5%) |
| 8 or more Rooms | 26 (13.1%) | 0 (0.0%) |
| Total | 199 (100.0%) | 147 (100.0%) |
Housing Structure by Heating Type in Anson
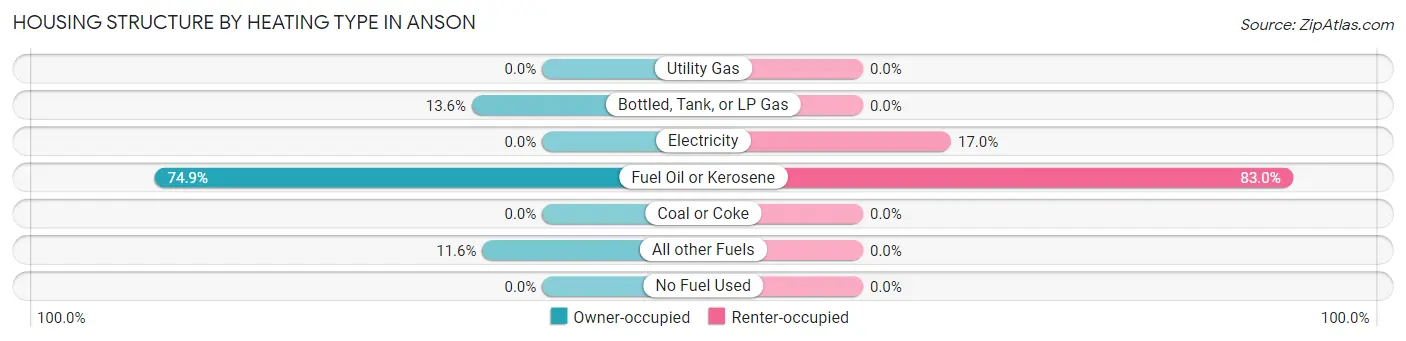
| Heating Type | Owner-occupied | Renter-occupied |
| Utility Gas | 0 (0.0%) | 0 (0.0%) |
| Bottled, Tank, or LP Gas | 27 (13.6%) | 0 (0.0%) |
| Electricity | 0 (0.0%) | 25 (17.0%) |
| Fuel Oil or Kerosene | 149 (74.9%) | 122 (83.0%) |
| Coal or Coke | 0 (0.0%) | 0 (0.0%) |
| All other Fuels | 23 (11.6%) | 0 (0.0%) |
| No Fuel Used | 0 (0.0%) | 0 (0.0%) |
| Total | 199 (100.0%) | 147 (100.0%) |
Household Vehicle Usage in Anson
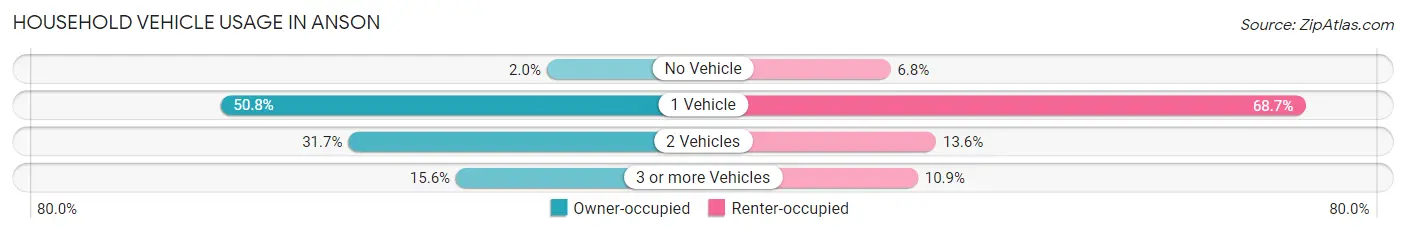
| Vehicles per Household | Owner-occupied | Renter-occupied |
| No Vehicle | 4 (2.0%) | 10 (6.8%) |
| 1 Vehicle | 101 (50.7%) | 101 (68.7%) |
| 2 Vehicles | 63 (31.7%) | 20 (13.6%) |
| 3 or more Vehicles | 31 (15.6%) | 16 (10.9%) |
| Total | 199 (100.0%) | 147 (100.0%) |
Real Estate & Mortgages in Anson
Real Estate and Mortgage Overview in Anson
| Characteristic | Without Mortgage | With Mortgage |
| Housing Units | 70 | 129 |
| Median Property Value | - | - |
| Median Household Income | $76,630 | $27 |
| Monthly Housing Costs | $350 | $0 |
| Real Estate Taxes | $988 | $0 |
Property Value by Mortgage Status in Anson
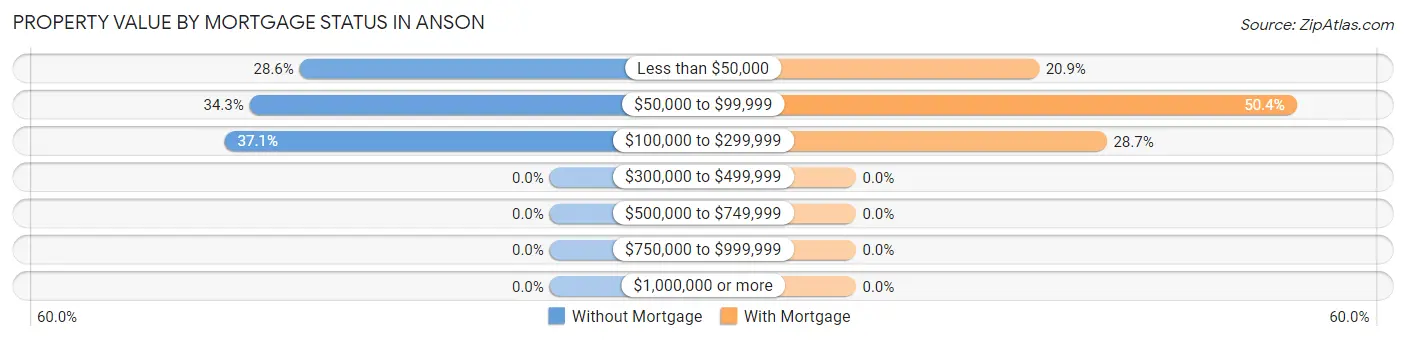
| Property Value | Without Mortgage | With Mortgage |
| Less than $50,000 | 20 (28.6%) | 27 (20.9%) |
| $50,000 to $99,999 | 24 (34.3%) | 65 (50.4%) |
| $100,000 to $299,999 | 26 (37.1%) | 37 (28.7%) |
| $300,000 to $499,999 | 0 (0.0%) | 0 (0.0%) |
| $500,000 to $749,999 | 0 (0.0%) | 0 (0.0%) |
| $750,000 to $999,999 | 0 (0.0%) | 0 (0.0%) |
| $1,000,000 or more | 0 (0.0%) | 0 (0.0%) |
| Total | 70 (100.0%) | 129 (100.0%) |
Household Income by Mortgage Status in Anson
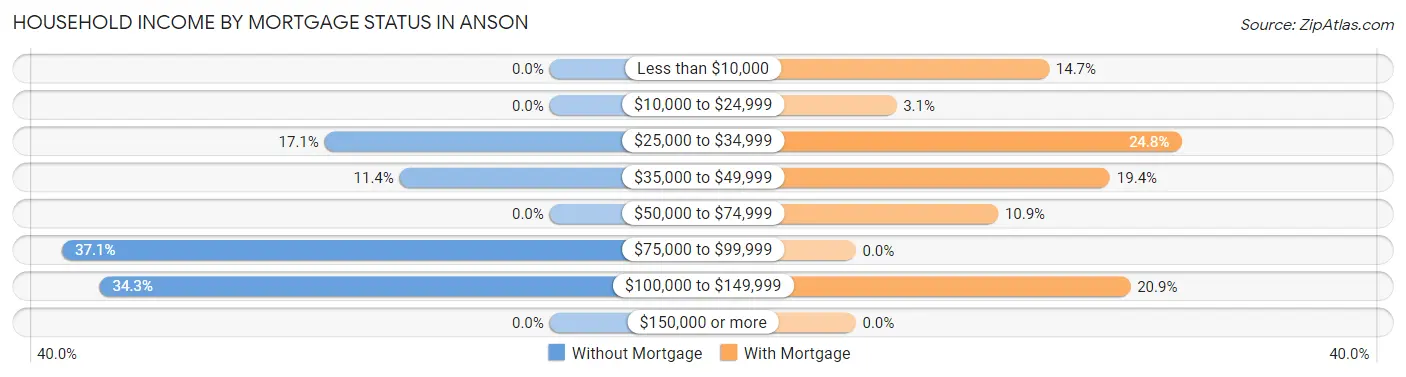
| Household Income | Without Mortgage | With Mortgage |
| Less than $10,000 | 0 (0.0%) | 19 (14.7%) |
| $10,000 to $24,999 | 0 (0.0%) | 4 (3.1%) |
| $25,000 to $34,999 | 12 (17.1%) | 32 (24.8%) |
| $35,000 to $49,999 | 8 (11.4%) | 25 (19.4%) |
| $50,000 to $74,999 | 0 (0.0%) | 14 (10.8%) |
| $75,000 to $99,999 | 26 (37.1%) | 0 (0.0%) |
| $100,000 to $149,999 | 24 (34.3%) | 27 (20.9%) |
| $150,000 or more | 0 (0.0%) | 0 (0.0%) |
| Total | 70 (100.0%) | 129 (100.0%) |
Property Value to Household Income Ratio in Anson
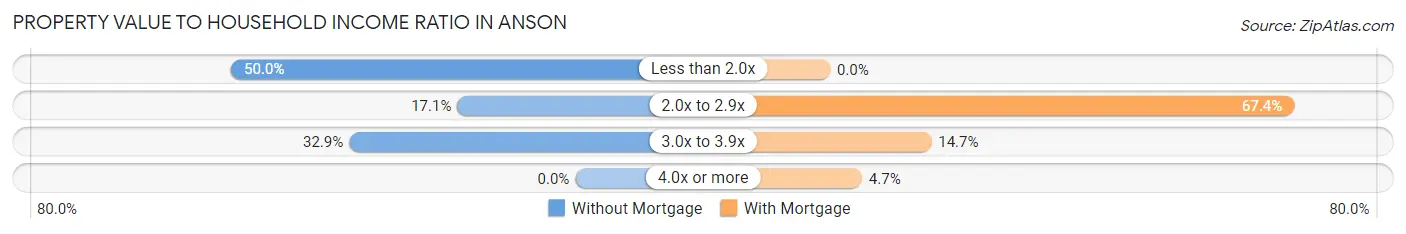
| Value-to-Income Ratio | Without Mortgage | With Mortgage |
| Less than 2.0x | 35 (50.0%) | 0 (0.0%) |
| 2.0x to 2.9x | 12 (17.1%) | 87 (67.4%) |
| 3.0x to 3.9x | 23 (32.9%) | 19 (14.7%) |
| 4.0x or more | 0 (0.0%) | 6 (4.6%) |
| Total | 70 (100.0%) | 129 (100.0%) |
Real Estate Taxes by Mortgage Status in Anson
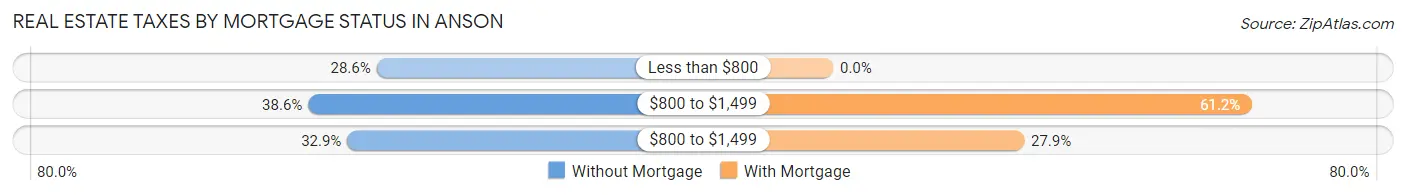
| Property Taxes | Without Mortgage | With Mortgage |
| Less than $800 | 20 (28.6%) | 0 (0.0%) |
| $800 to $1,499 | 27 (38.6%) | 79 (61.2%) |
| $800 to $1,499 | 23 (32.9%) | 36 (27.9%) |
| Total | 70 (100.0%) | 129 (100.0%) |
Health & Disability in Anson
Health Insurance Coverage by Age in Anson
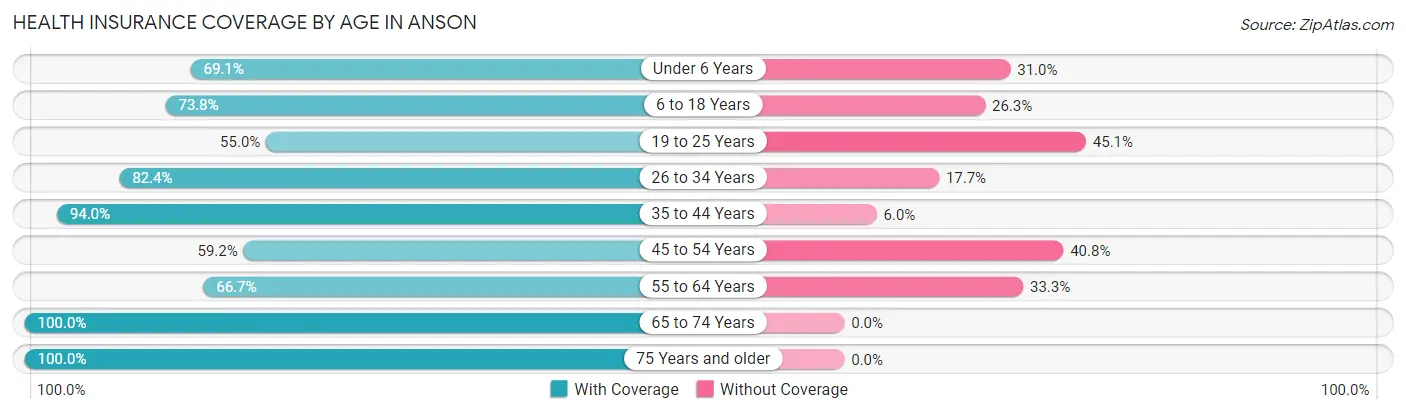
| Age Bracket | With Coverage | Without Coverage |
| Under 6 Years | 29 (69.1%) | 13 (30.9%) |
| 6 to 18 Years | 118 (73.8%) | 42 (26.3%) |
| 19 to 25 Years | 61 (54.9%) | 50 (45.1%) |
| 26 to 34 Years | 70 (82.4%) | 15 (17.6%) |
| 35 to 44 Years | 78 (94.0%) | 5 (6.0%) |
| 45 to 54 Years | 100 (59.2%) | 69 (40.8%) |
| 55 to 64 Years | 76 (66.7%) | 38 (33.3%) |
| 65 to 74 Years | 35 (100.0%) | 0 (0.0%) |
| 75 Years and older | 21 (100.0%) | 0 (0.0%) |
| Total | 588 (71.7%) | 232 (28.3%) |
Health Insurance Coverage by Citizenship Status in Anson
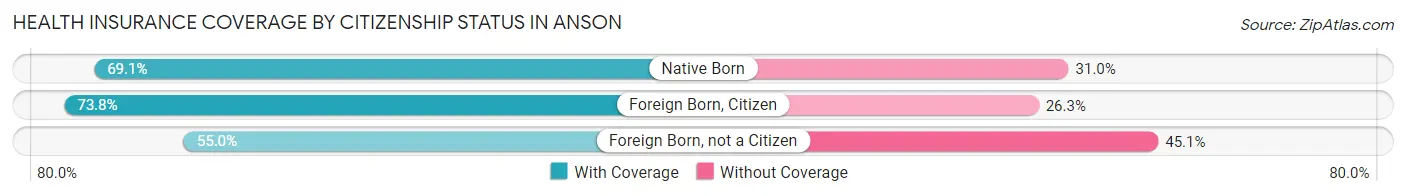
| Citizenship Status | With Coverage | Without Coverage |
| Native Born | 29 (69.1%) | 13 (30.9%) |
| Foreign Born, Citizen | 118 (73.8%) | 42 (26.3%) |
| Foreign Born, not a Citizen | 61 (54.9%) | 50 (45.1%) |
Health Insurance Coverage by Household Income in Anson
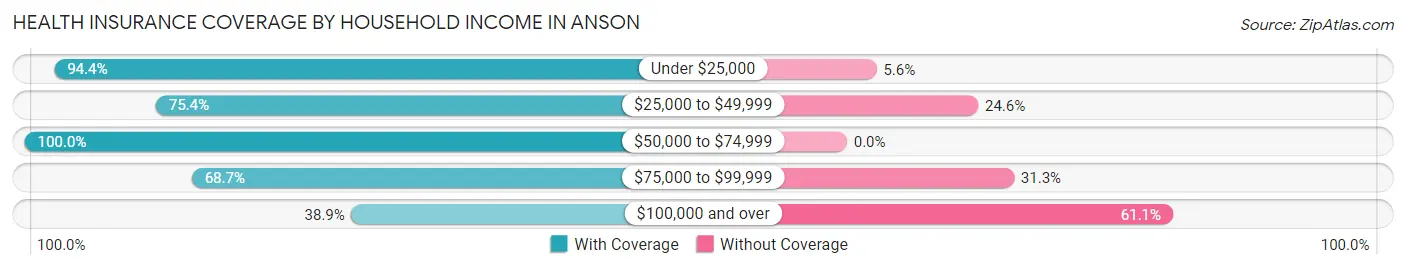
| Household Income | With Coverage | Without Coverage |
| Under $25,000 | 136 (94.4%) | 8 (5.6%) |
| $25,000 to $49,999 | 184 (75.4%) | 60 (24.6%) |
| $50,000 to $74,999 | 57 (100.0%) | 0 (0.0%) |
| $75,000 to $99,999 | 136 (68.7%) | 62 (31.3%) |
| $100,000 and over | 65 (38.9%) | 102 (61.1%) |
Public vs Private Health Insurance Coverage by Age in Anson
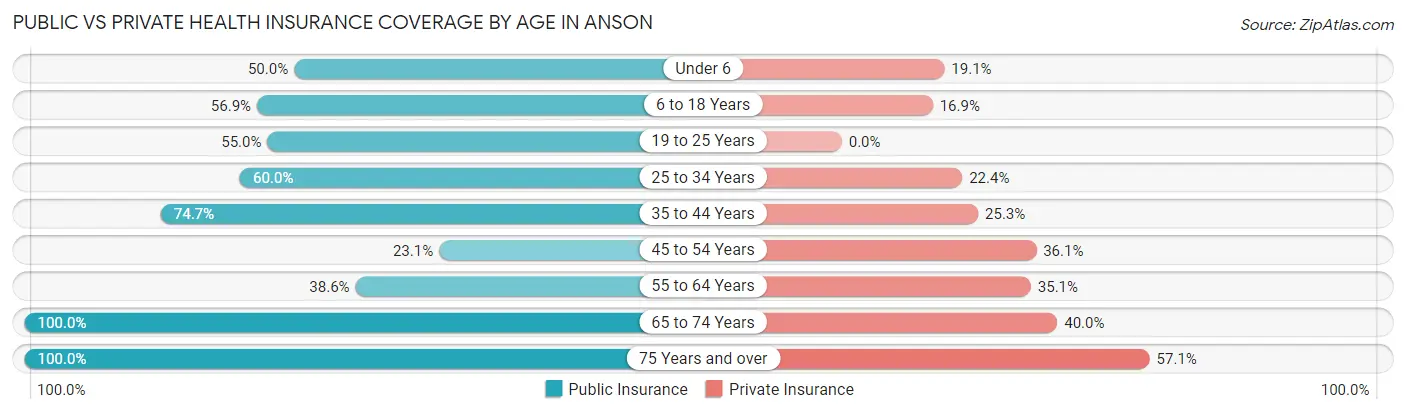
| Age Bracket | Public Insurance | Private Insurance |
| Under 6 | 21 (50.0%) | 8 (19.1%) |
| 6 to 18 Years | 91 (56.9%) | 27 (16.9%) |
| 19 to 25 Years | 61 (54.9%) | 0 (0.0%) |
| 25 to 34 Years | 51 (60.0%) | 19 (22.4%) |
| 35 to 44 Years | 62 (74.7%) | 21 (25.3%) |
| 45 to 54 Years | 39 (23.1%) | 61 (36.1%) |
| 55 to 64 Years | 44 (38.6%) | 40 (35.1%) |
| 65 to 74 Years | 35 (100.0%) | 14 (40.0%) |
| 75 Years and over | 21 (100.0%) | 12 (57.1%) |
| Total | 425 (51.8%) | 202 (24.6%) |
Disability Status by Sex by Age in Anson
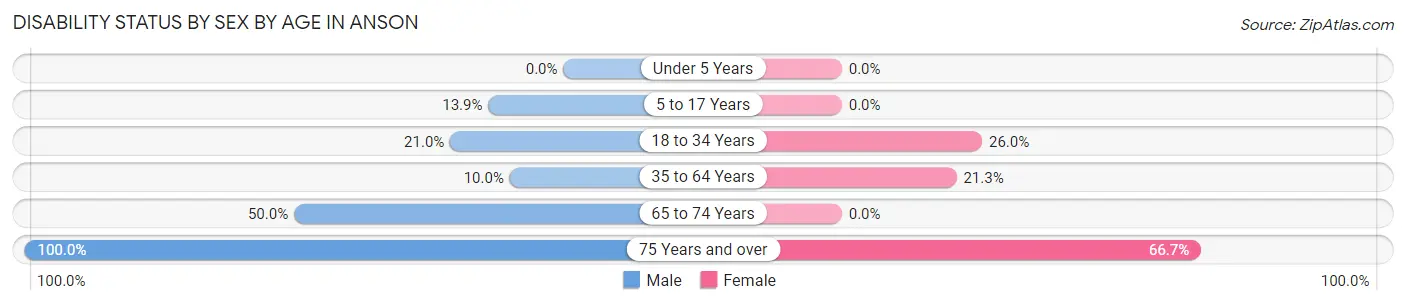
| Age Bracket | Male | Female |
| Under 5 Years | 0 (0.0%) | 0 (0.0%) |
| 5 to 17 Years | 17 (13.9%) | 0 (0.0%) |
| 18 to 34 Years | 25 (21.0%) | 25 (26.0%) |
| 35 to 64 Years | 21 (10.0%) | 33 (21.3%) |
| 65 to 74 Years | 14 (50.0%) | 0 (0.0%) |
| 75 Years and over | 12 (100.0%) | 6 (66.7%) |
Disability Class by Sex by Age in Anson
Disability Class: Hearing Difficulty

| Age Bracket | Male | Female |
| Under 5 Years | 0 (0.0%) | 0 (0.0%) |
| 5 to 17 Years | 0 (0.0%) | 0 (0.0%) |
| 18 to 34 Years | 0 (0.0%) | 0 (0.0%) |
| 35 to 64 Years | 2 (0.9%) | 0 (0.0%) |
| 65 to 74 Years | 0 (0.0%) | 0 (0.0%) |
| 75 Years and over | 0 (0.0%) | 0 (0.0%) |
Disability Class: Vision Difficulty
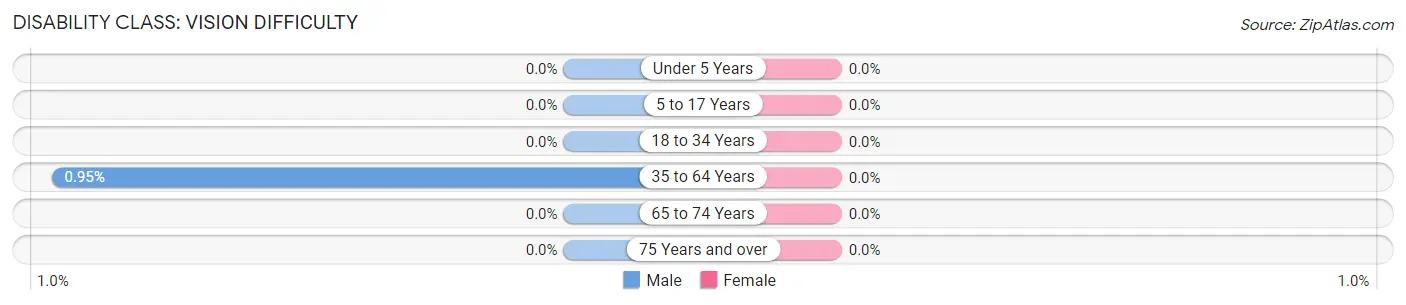
| Age Bracket | Male | Female |
| Under 5 Years | 0 (0.0%) | 0 (0.0%) |
| 5 to 17 Years | 0 (0.0%) | 0 (0.0%) |
| 18 to 34 Years | 0 (0.0%) | 0 (0.0%) |
| 35 to 64 Years | 2 (0.9%) | 0 (0.0%) |
| 65 to 74 Years | 0 (0.0%) | 0 (0.0%) |
| 75 Years and over | 0 (0.0%) | 0 (0.0%) |
Disability Class: Cognitive Difficulty
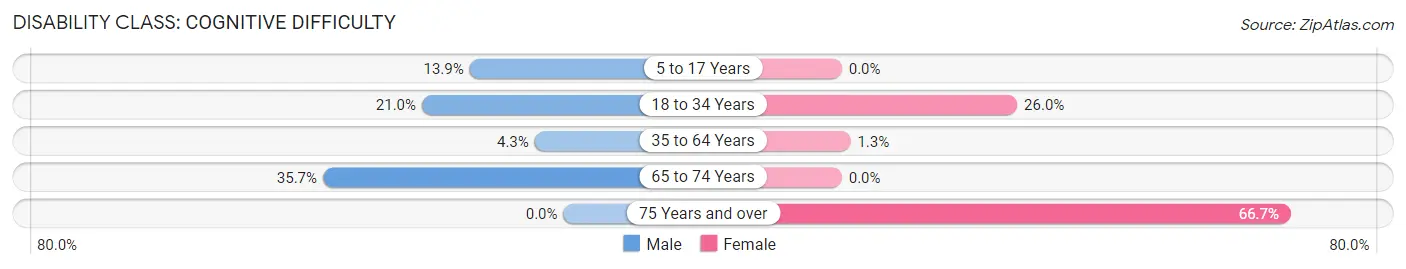
| Age Bracket | Male | Female |
| 5 to 17 Years | 17 (13.9%) | 0 (0.0%) |
| 18 to 34 Years | 25 (21.0%) | 25 (26.0%) |
| 35 to 64 Years | 9 (4.3%) | 2 (1.3%) |
| 65 to 74 Years | 10 (35.7%) | 0 (0.0%) |
| 75 Years and over | 0 (0.0%) | 6 (66.7%) |
Disability Class: Ambulatory Difficulty
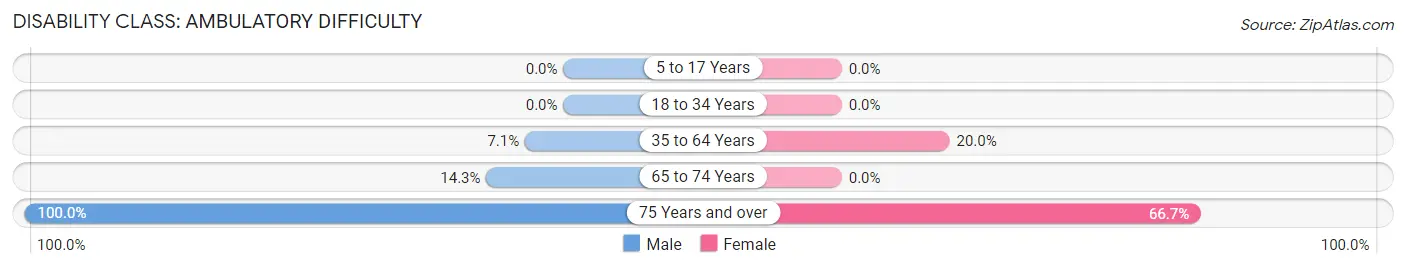
| Age Bracket | Male | Female |
| 5 to 17 Years | 0 (0.0%) | 0 (0.0%) |
| 18 to 34 Years | 0 (0.0%) | 0 (0.0%) |
| 35 to 64 Years | 15 (7.1%) | 31 (20.0%) |
| 65 to 74 Years | 4 (14.3%) | 0 (0.0%) |
| 75 Years and over | 12 (100.0%) | 6 (66.7%) |
Disability Class: Self-Care Difficulty
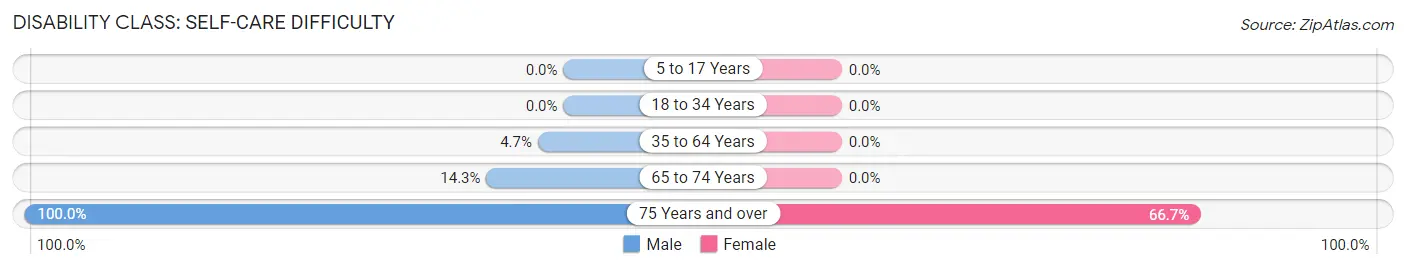
| Age Bracket | Male | Female |
| 5 to 17 Years | 0 (0.0%) | 0 (0.0%) |
| 18 to 34 Years | 0 (0.0%) | 0 (0.0%) |
| 35 to 64 Years | 10 (4.7%) | 0 (0.0%) |
| 65 to 74 Years | 4 (14.3%) | 0 (0.0%) |
| 75 Years and over | 12 (100.0%) | 6 (66.7%) |
Technology Access in Anson
Computing Device Access in Anson
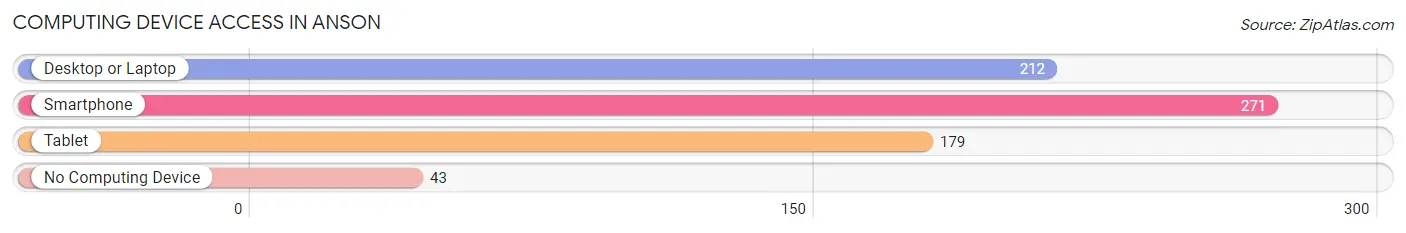
| Device Type | # Households | % Households |
| Desktop or Laptop | 212 | 61.3% |
| Smartphone | 271 | 78.3% |
| Tablet | 179 | 51.7% |
| No Computing Device | 43 | 12.4% |
| Total | 346 | 100.0% |
Internet Access in Anson
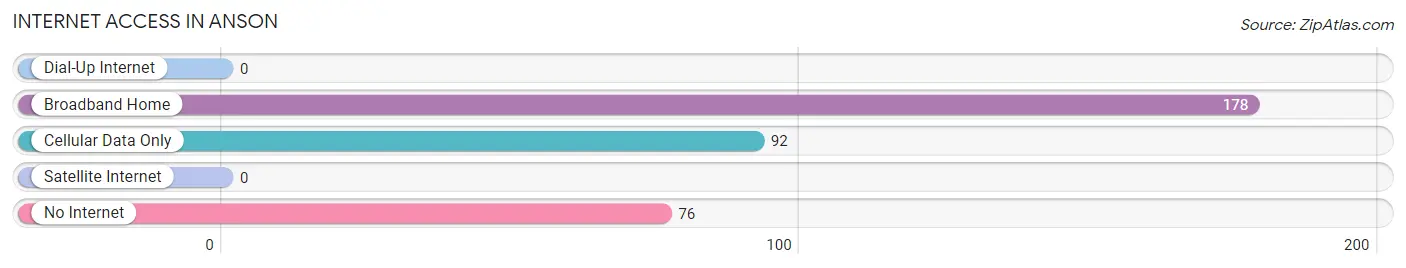
| Internet Type | # Households | % Households |
| Dial-Up Internet | 0 | 0.0% |
| Broadband Home | 178 | 51.4% |
| Cellular Data Only | 92 | 26.6% |
| Satellite Internet | 0 | 0.0% |
| No Internet | 76 | 22.0% |
| Total | 346 | 100.0% |
Anson Summary
Anson, Maine is a small town located in Somerset County, in the state of Maine. It is situated on the banks of the Kennebec River, and is bordered by the towns of Madison, Embden, and Solon. The town has a population of 1,717 people, according to the 2010 census.
History
Anson was first settled in 1774 by a group of settlers from Massachusetts. The town was named after Anson Jones, a Revolutionary War veteran. The town was incorporated in 1796, and the first town meeting was held in 1797.
In the early 19th century, Anson was a thriving agricultural community. The town was known for its production of potatoes, apples, and other crops. The town also had several sawmills, gristmills, and a tannery.
In the late 19th century, the town began to decline. The population decreased, and many of the businesses closed. The town was revitalized in the early 20th century, when the Kennebec and Moosehead Railroad was built through the town. This allowed for the transportation of goods and people, and helped to revive the economy.
Geography
Anson is located in the western part of Somerset County, in the state of Maine. It is situated on the banks of the Kennebec River, and is bordered by the towns of Madison, Embden, and Solon. The town has a total area of 36.2 square miles, of which 35.7 square miles is land and 0.5 square miles is water.
The town is located in a rural area, and is surrounded by forests and lakes. The highest point in the town is the summit of Bald Mountain, which has an elevation of 1,845 feet.
Economy
The economy of Anson is largely based on agriculture and tourism. The town is home to several farms, which produce potatoes, apples, and other crops. The town also has several sawmills, gristmills, and a tannery.
Tourism is also an important part of the economy. The town is home to several lakes, rivers, and forests, which attract visitors from all over the state. The town also has several restaurants, inns, and bed and breakfasts.
Demographics
According to the 2010 census, the population of Anson was 1,717 people. The racial makeup of the town was 97.3% White, 0.5% African American, 0.2% Native American, 0.3% Asian, 0.1% Pacific Islander, 0.2% from other races, and 1.4% from two or more races. Hispanic or Latino of any race were 0.7% of the population.
The median household income in Anson was $41,250, and the median family income was $48,750. The per capita income was $20,945. About 11.2% of the population was below the poverty line.
Common Questions
What is Per Capita Income in Anson?
Per Capita income in Anson is $28,708.
What is Income or Wage Gap in Anson?
Income or Wage Gap in Anson is 59.1%.
Women in Anson earn 40.9 cents for every dollar earned by a man.
What is Family Income Deficit in Anson?
Family Income Deficit in Anson is $5,665.
Families that are below poverty line in Anson earn $5,665 less on average than the poverty threshold level.
What is Inequality or Gini Index in Anson?
Inequality or Gini Index in Anson is 0.47.
What is the Total Population of Anson?
Total Population of Anson is 837.
What is the Total Male Population of Anson?
Total Male Population of Anson is 543.
What is the Total Female Population of Anson?
Total Female Population of Anson is 294.
What is the Ratio of Males per 100 Females in Anson?
There are 184.69 Males per 100 Females in Anson.
What is the Ratio of Females per 100 Males in Anson?
There are 54.14 Females per 100 Males in Anson.
What is the Median Population Age in Anson?
Median Population Age in Anson is 40.0 Years.
What is the Average Family Size in Anson
Average Family Size in Anson is 3.0 People.
What is the Average Household Size in Anson
Average Household Size in Anson is 2.4 People.
How Large is the Labor Force in Anson?
There are 369 People in the Labor Forcein in Anson.
What is the Percentage of People in the Labor Force in Anson?
54.4% of People are in the Labor Force in Anson.
What is the Unemployment Rate in Anson?
Unemployment Rate in Anson is 11.6%.