Steep Falls, ME Map & Demographics
Steep Falls Map
Steep Falls Overview
$24,981
PER CAPITA INCOME
$76,319
AVG FAMILY INCOME
$85,040
AVG HOUSEHOLD INCOME
40.9%
WAGE / INCOME GAP [ % ]
59.1¢/ $1
WAGE / INCOME GAP [ $ ]
0.32
INEQUALITY / GINI INDEX
2,087
TOTAL POPULATION
858
MALE POPULATION
1,229
FEMALE POPULATION
69.81
MALES / 100 FEMALES
143.24
FEMALES / 100 MALES
39.6
MEDIAN AGE
3.5
AVG FAMILY SIZE
3.3
AVG HOUSEHOLD SIZE
873
LABOR FORCE [ PEOPLE ]
55.1%
PERCENT IN LABOR FORCE
Steep Falls Zip Codes
Steep Falls Area Codes
Income in Steep Falls
Income Overview in Steep Falls
Per Capita Income in Steep Falls is $24,981, while median incomes of families and households are $76,319 and $85,040 respectively.
| Characteristic | Number | Measure |
| Per Capita Income | 2,087 | $24,981 |
| Median Family Income | 519 | $76,319 |
| Mean Family Income | 519 | $79,469 |
| Median Household Income | 624 | $85,040 |
| Mean Household Income | 624 | $79,302 |
| Income Deficit | 519 | $0 |
| Wage / Income Gap (%) | 2,087 | 40.86% |
| Wage / Income Gap ($) | 2,087 | 59.14¢ per $1 |
| Gini / Inequality Index | 2,087 | 0.32 |
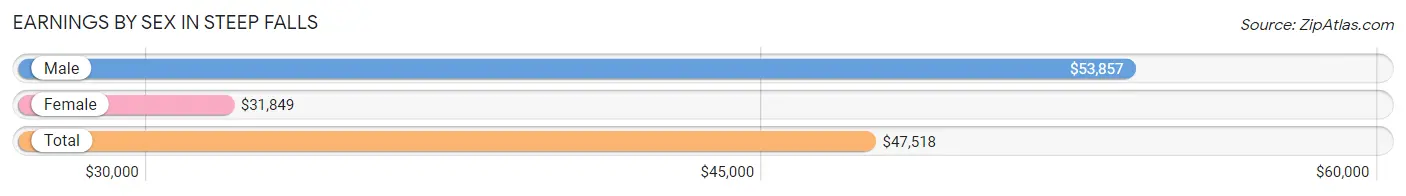
Earnings by Sex in Steep Falls
Average Earnings in Steep Falls are $47,518, $53,857 for men and $31,849 for women, a difference of 40.9%.
| Sex | Number | Average Earnings |
| Male | 460 (49.1%) | $53,857 |
| Female | 477 (50.9%) | $31,849 |
| Total | 937 (100.0%) | $47,518 |
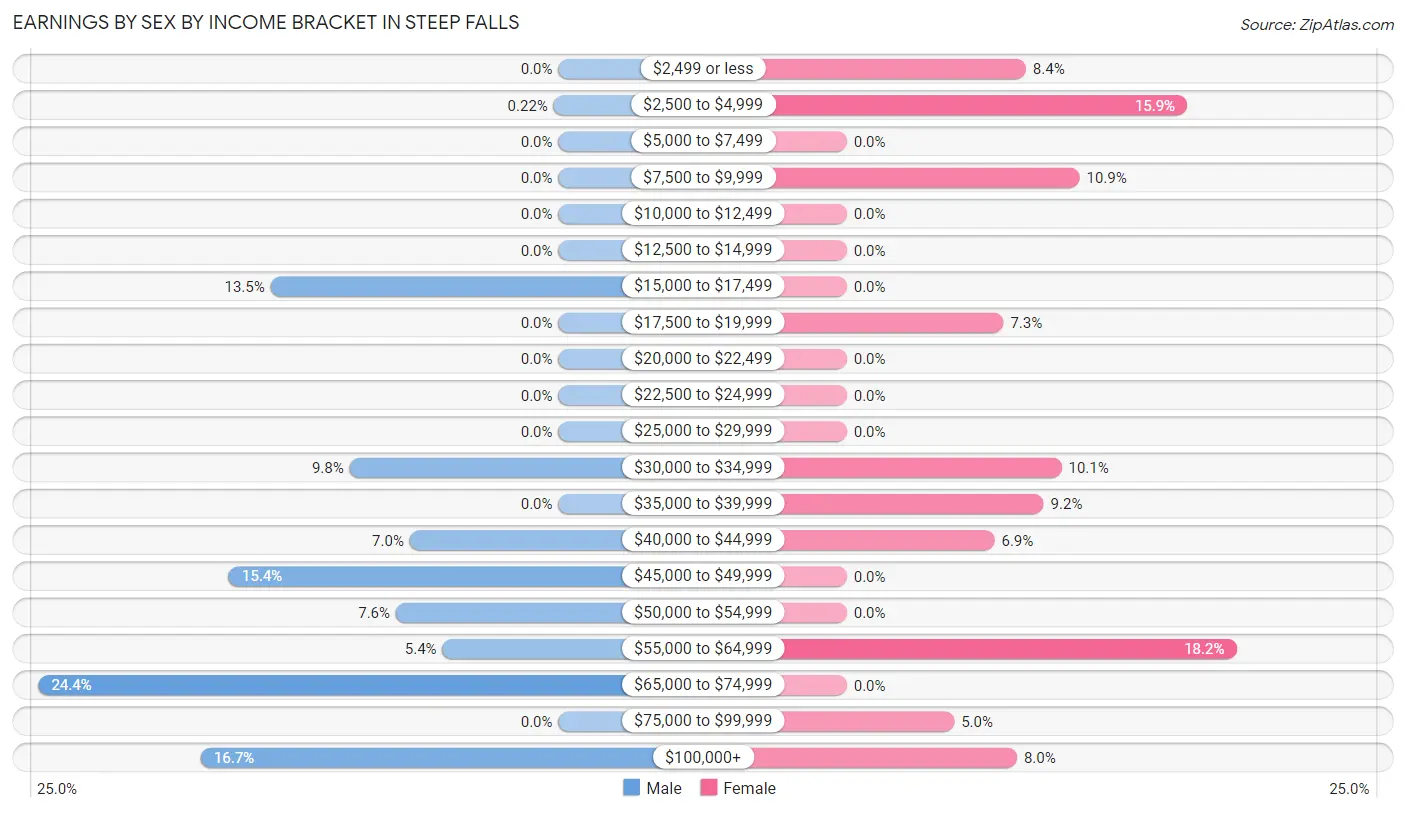
Earnings by Sex by Income Bracket in Steep Falls
The most common earnings brackets in Steep Falls are $65,000 to $74,999 for men (112 | 24.3%) and $55,000 to $64,999 for women (87 | 18.2%).
| Income | Male | Female |
| $2,499 or less | 0 (0.0%) | 40 (8.4%) |
| $2,500 to $4,999 | 1 (0.2%) | 76 (15.9%) |
| $5,000 to $7,499 | 0 (0.0%) | 0 (0.0%) |
| $7,500 to $9,999 | 0 (0.0%) | 52 (10.9%) |
| $10,000 to $12,499 | 0 (0.0%) | 0 (0.0%) |
| $12,500 to $14,999 | 0 (0.0%) | 0 (0.0%) |
| $15,000 to $17,499 | 62 (13.5%) | 0 (0.0%) |
| $17,500 to $19,999 | 0 (0.0%) | 35 (7.3%) |
| $20,000 to $22,499 | 0 (0.0%) | 0 (0.0%) |
| $22,500 to $24,999 | 0 (0.0%) | 0 (0.0%) |
| $25,000 to $29,999 | 0 (0.0%) | 0 (0.0%) |
| $30,000 to $34,999 | 45 (9.8%) | 48 (10.1%) |
| $35,000 to $39,999 | 0 (0.0%) | 44 (9.2%) |
| $40,000 to $44,999 | 32 (7.0%) | 33 (6.9%) |
| $45,000 to $49,999 | 71 (15.4%) | 0 (0.0%) |
| $50,000 to $54,999 | 35 (7.6%) | 0 (0.0%) |
| $55,000 to $64,999 | 25 (5.4%) | 87 (18.2%) |
| $65,000 to $74,999 | 112 (24.3%) | 0 (0.0%) |
| $75,000 to $99,999 | 0 (0.0%) | 24 (5.0%) |
| $100,000+ | 77 (16.7%) | 38 (8.0%) |
| Total | 460 (100.0%) | 477 (100.0%) |
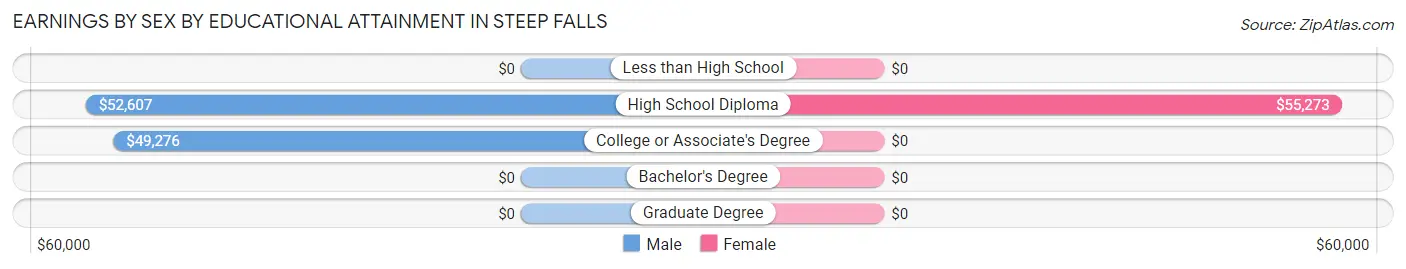
Earnings by Sex by Educational Attainment in Steep Falls
Average earnings in Steep Falls are $55,650 for men and $42,917 for women, a difference of 22.9%. Men with an educational attainment of high school diploma enjoy the highest average annual earnings of $52,607, while those with college or associate's degree education earn the least with $49,276. Women with an educational attainment of high school diploma earn the most with the average annual earnings of $55,273, while those with high school diploma education have the smallest earnings of $55,273.
| Educational Attainment | Male Income | Female Income |
| Less than High School | - | - |
| High School Diploma | $52,607 | $55,273 |
| College or Associate's Degree | $49,276 | $0 |
| Bachelor's Degree | - | - |
| Graduate Degree | - | - |
| Total | $55,650 | $42,917 |
Family Income in Steep Falls
Family Income Brackets in Steep Falls
According to the Steep Falls family income data, there are 217 families falling into the $100,000 to $149,999 income range, which is the most common income bracket and makes up 41.8% of all families.
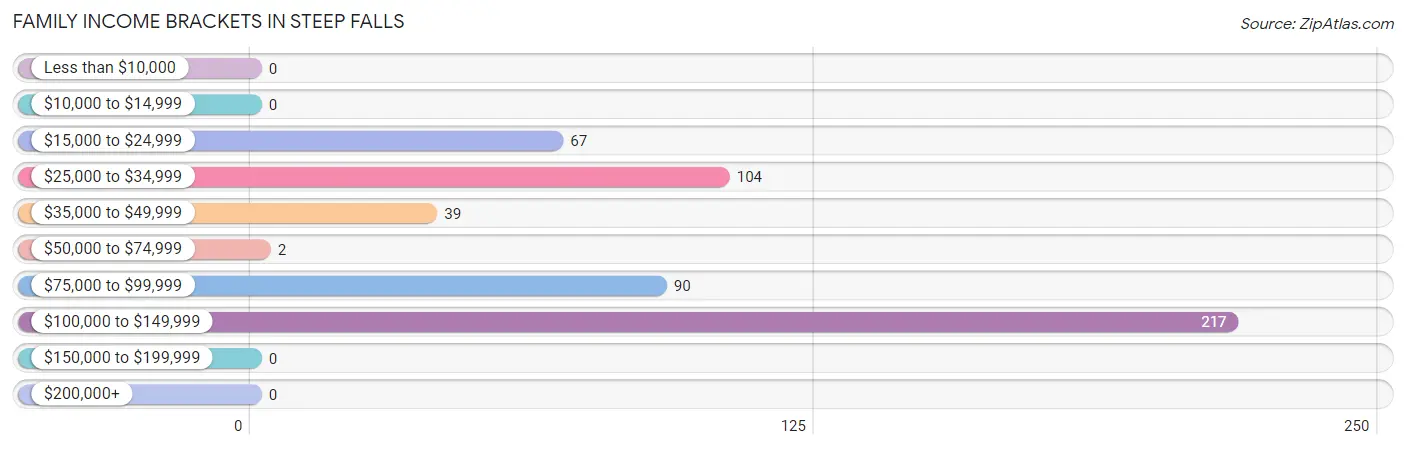
| Income Bracket | # Families | % Families |
| Less than $10,000 | 0 | 0.0% |
| $10,000 to $14,999 | 0 | 0.0% |
| $15,000 to $24,999 | 67 | 12.9% |
| $25,000 to $34,999 | 104 | 20.0% |
| $35,000 to $49,999 | 39 | 7.5% |
| $50,000 to $74,999 | 2 | 0.4% |
| $75,000 to $99,999 | 90 | 17.3% |
| $100,000 to $149,999 | 217 | 41.8% |
| $150,000 to $199,999 | 0 | 0.0% |
| $200,000+ | 0 | 0.0% |
Family Income by Famaliy Size in Steep Falls
2-person families (93 | 17.9%) account for the highest median family income in Steep Falls with $76,496 per family, while 2-person families (93 | 17.9%) have the highest median income of $38,248 per family member.
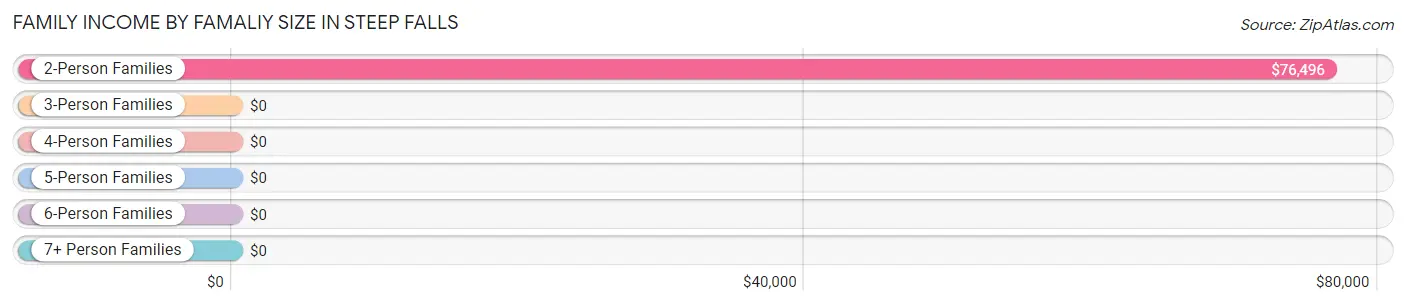
| Income Bracket | # Families | Median Income |
| 2-Person Families | 93 (17.9%) | $76,496 |
| 3-Person Families | 179 (34.5%) | $0 |
| 4-Person Families | 139 (26.8%) | $0 |
| 5-Person Families | 108 (20.8%) | $0 |
| 6-Person Families | 0 (0.0%) | $0 |
| 7+ Person Families | 0 (0.0%) | $0 |
| Total | 519 (100.0%) | $76,319 |
Family Income by Number of Earners in Steep Falls
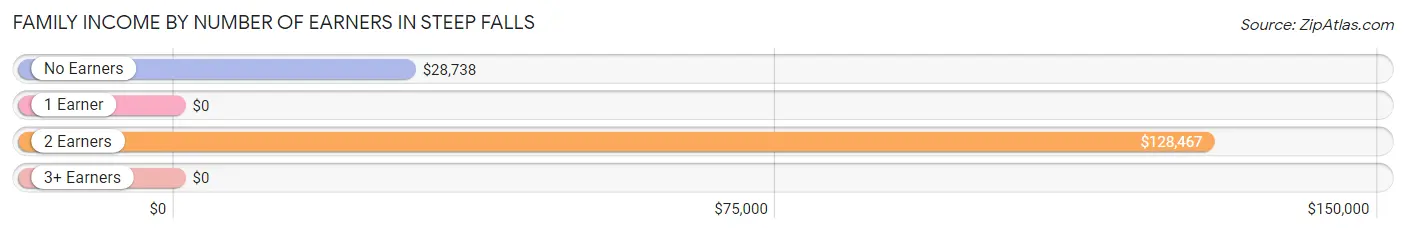
| Number of Earners | # Families | Median Income |
| No Earners | 117 (22.5%) | $28,738 |
| 1 Earner | 151 (29.1%) | $0 |
| 2 Earners | 216 (41.6%) | $128,467 |
| 3+ Earners | 35 (6.7%) | $0 |
| Total | 519 (100.0%) | $76,319 |
Household Income in Steep Falls
Household Income Brackets in Steep Falls
With 251 households falling in the category, the $100,000 to $149,999 income range is the most frequent in Steep Falls, accounting for 40.2% of all households.
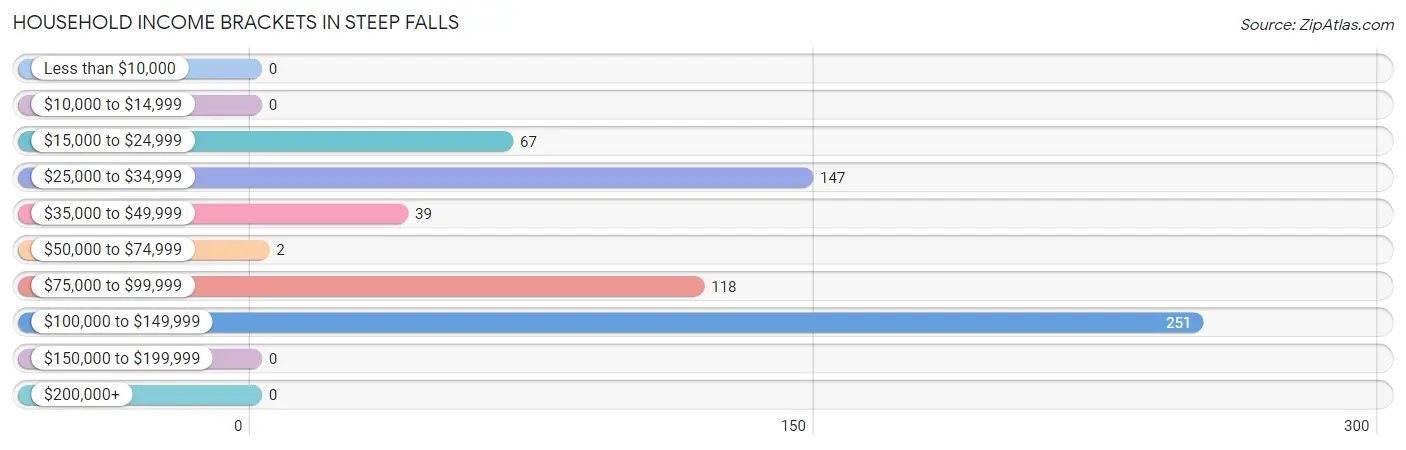
| Income Bracket | # Households | % Households |
| Less than $10,000 | 0 | 0.0% |
| $10,000 to $14,999 | 0 | 0.0% |
| $15,000 to $24,999 | 67 | 10.7% |
| $25,000 to $34,999 | 147 | 23.6% |
| $35,000 to $49,999 | 39 | 6.3% |
| $50,000 to $74,999 | 2 | 0.3% |
| $75,000 to $99,999 | 118 | 18.9% |
| $100,000 to $149,999 | 251 | 40.2% |
| $150,000 to $199,999 | 0 | 0.0% |
| $200,000+ | 0 | 0.0% |
Household Income by Householder Age in Steep Falls
The median household income in Steep Falls is $85,040, with the highest median household income of $124,779 found in the 45 to 64 years age bracket for the primary householder. A total of 302 households (48.4%) fall into this category.
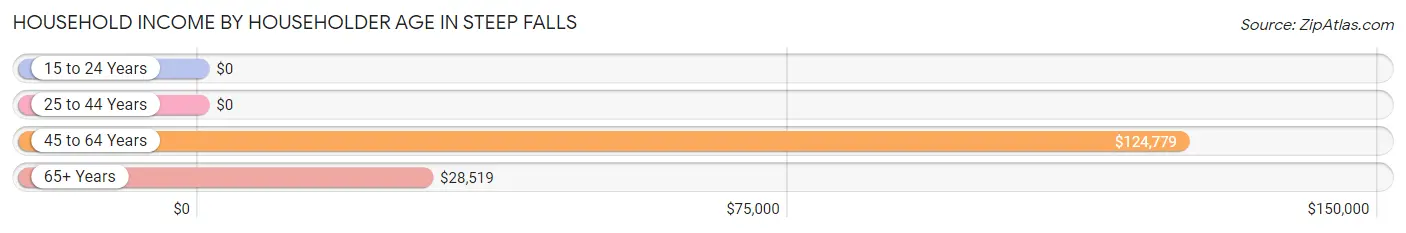
| Income Bracket | # Households | Median Income |
| 15 to 24 Years | 0 (0.0%) | $0 |
| 25 to 44 Years | 246 (39.4%) | $0 |
| 45 to 64 Years | 302 (48.4%) | $124,779 |
| 65+ Years | 76 (12.2%) | $28,519 |
| Total | 624 (100.0%) | $85,040 |
Poverty in Steep Falls
Income Below Poverty by Sex and Age in Steep Falls
With 7.5% poverty level for males and 18.9% for females among the residents of Steep Falls, 18 to 24 year old males and 15 year old females are the most vulnerable to poverty, with 30 males (40.0%) and 41 females (100.0%) in their respective age groups living below the poverty level.
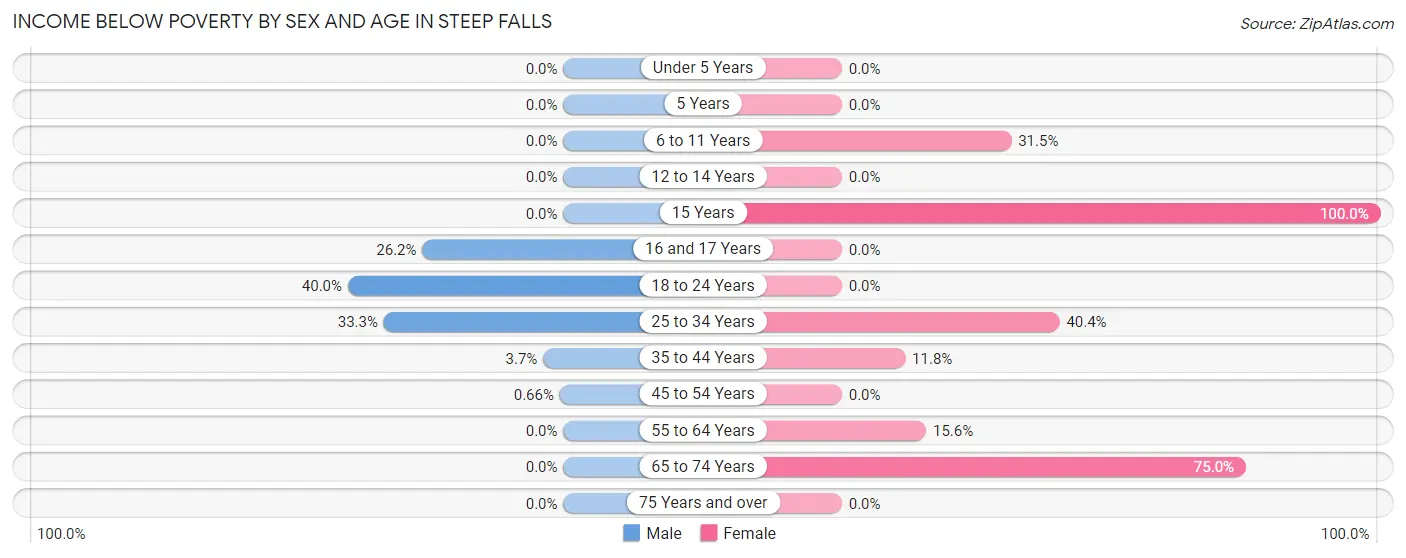
| Age Bracket | Male | Female |
| Under 5 Years | 0 (0.0%) | 0 (0.0%) |
| 5 Years | 0 (0.0%) | 0 (0.0%) |
| 6 to 11 Years | 0 (0.0%) | 78 (31.5%) |
| 12 to 14 Years | 0 (0.0%) | 0 (0.0%) |
| 15 Years | 0 (0.0%) | 41 (100.0%) |
| 16 and 17 Years | 28 (26.2%) | 0 (0.0%) |
| 18 to 24 Years | 30 (40.0%) | 0 (0.0%) |
| 25 to 34 Years | 1 (33.3%) | 40 (40.4%) |
| 35 to 44 Years | 4 (3.7%) | 24 (11.8%) |
| 45 to 54 Years | 1 (0.7%) | 0 (0.0%) |
| 55 to 64 Years | 0 (0.0%) | 28 (15.6%) |
| 65 to 74 Years | 0 (0.0%) | 21 (75.0%) |
| 75 Years and over | 0 (0.0%) | 0 (0.0%) |
| Total | 64 (7.5%) | 232 (18.9%) |
Income Above Poverty by Sex and Age in Steep Falls
According to the poverty statistics in Steep Falls, males aged 6 to 11 years and females aged 12 to 14 years are the age groups that are most secure financially, with 100.0% of males and 100.0% of females in these age groups living above the poverty line.
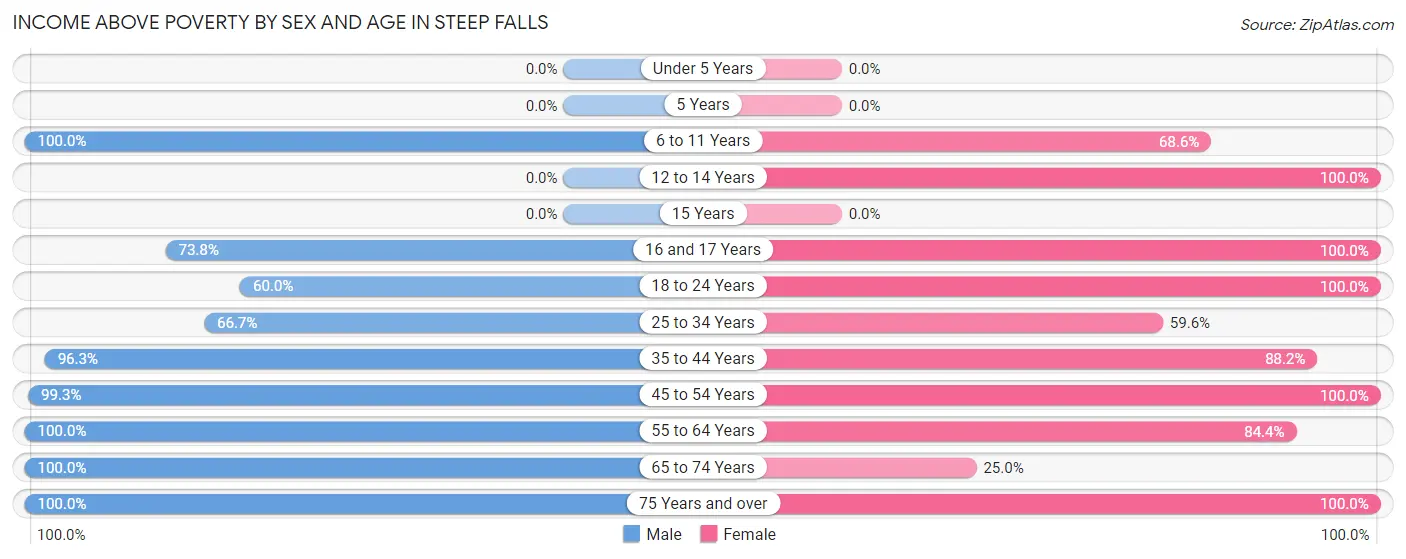
| Age Bracket | Male | Female |
| Under 5 Years | 0 (0.0%) | 0 (0.0%) |
| 5 Years | 0 (0.0%) | 0 (0.0%) |
| 6 to 11 Years | 142 (100.0%) | 170 (68.5%) |
| 12 to 14 Years | 0 (0.0%) | 71 (100.0%) |
| 15 Years | 0 (0.0%) | 0 (0.0%) |
| 16 and 17 Years | 79 (73.8%) | 76 (100.0%) |
| 18 to 24 Years | 45 (60.0%) | 48 (100.0%) |
| 25 to 34 Years | 2 (66.7%) | 59 (59.6%) |
| 35 to 44 Years | 103 (96.3%) | 180 (88.2%) |
| 45 to 54 Years | 150 (99.3%) | 219 (100.0%) |
| 55 to 64 Years | 161 (100.0%) | 151 (84.4%) |
| 65 to 74 Years | 111 (100.0%) | 7 (25.0%) |
| 75 Years and over | 1 (100.0%) | 16 (100.0%) |
| Total | 794 (92.5%) | 997 (81.1%) |
Income Below Poverty Among Married-Couple Families in Steep Falls
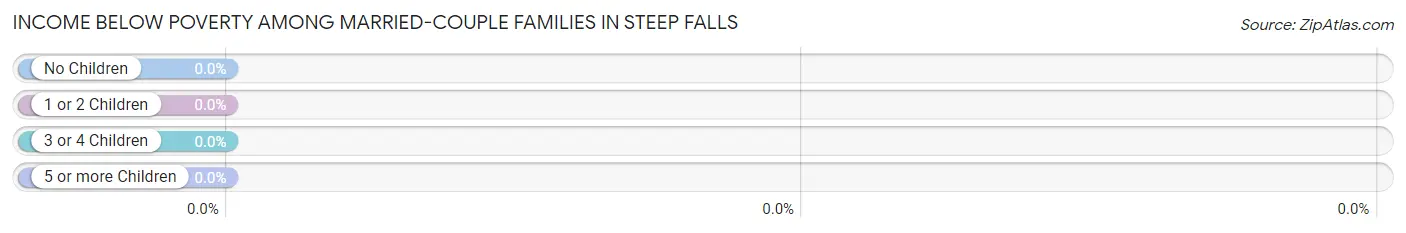
| Children | Above Poverty | Below Poverty |
| No Children | 130 (100.0%) | 0 (0.0%) |
| 1 or 2 Children | 79 (100.0%) | 0 (0.0%) |
| 3 or 4 Children | 108 (100.0%) | 0 (0.0%) |
| 5 or more Children | 0 (0.0%) | 0 (0.0%) |
| Total | 317 (100.0%) | 0 (0.0%) |
Income Below Poverty Among Single-Parent Households in Steep Falls
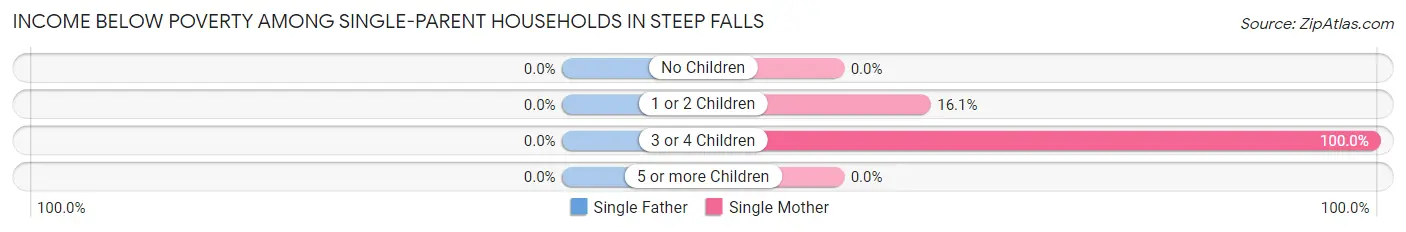
| Children | Single Father | Single Mother |
| No Children | 0 (0.0%) | 0 (0.0%) |
| 1 or 2 Children | 0 (0.0%) | 20 (16.1%) |
| 3 or 4 Children | 0 (0.0%) | 40 (100.0%) |
| 5 or more Children | 0 (0.0%) | 0 (0.0%) |
| Total | 0 (0.0%) | 60 (29.7%) |
Income Below Poverty Among Married-Couple vs Single-Parent Households in Steep Falls
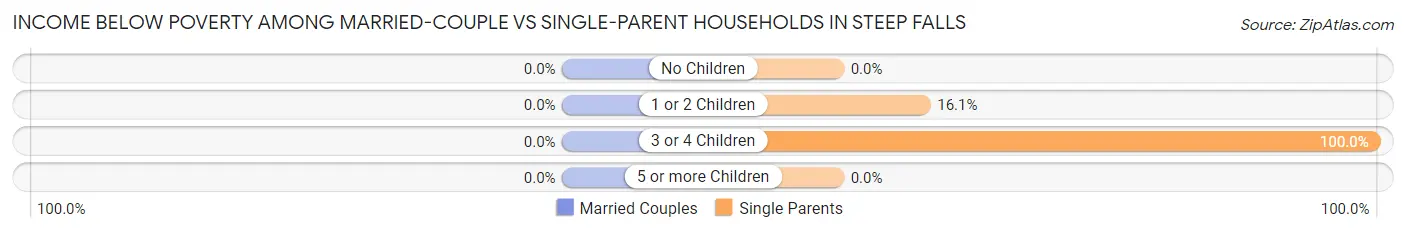
| Children | Married-Couple Families | Single-Parent Households |
| No Children | 0 (0.0%) | 0 (0.0%) |
| 1 or 2 Children | 0 (0.0%) | 20 (16.1%) |
| 3 or 4 Children | 0 (0.0%) | 40 (100.0%) |
| 5 or more Children | 0 (0.0%) | 0 (0.0%) |
| Total | 0 (0.0%) | 60 (29.7%) |
Race in Steep Falls
The most populous races in Steep Falls are , and White / Caucasian (2,087 | 100.0%).
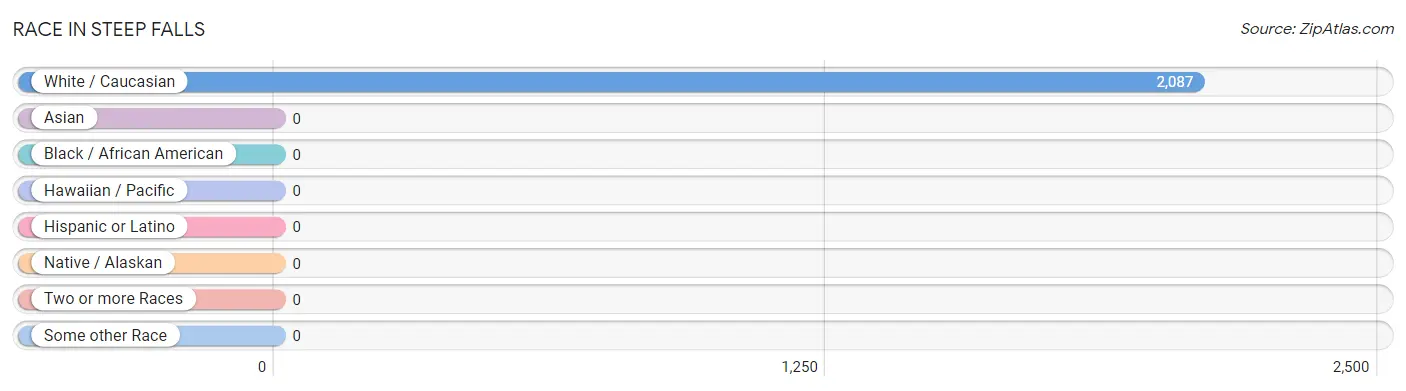
| Race | # Population | % Population |
| Asian | 0 | 0.0% |
| Black / African American | 0 | 0.0% |
| Hawaiian / Pacific | 0 | 0.0% |
| Hispanic or Latino | 0 | 0.0% |
| Native / Alaskan | 0 | 0.0% |
| White / Caucasian | 2,087 | 100.0% |
| Two or more Races | 0 | 0.0% |
| Some other Race | 0 | 0.0% |
| Total | 2,087 | 100.0% |
Ancestry in Steep Falls
The most populous ancestries reported in Steep Falls are Irish (709 | 34.0%), French Canadian (188 | 9.0%), American (165 | 7.9%), French (161 | 7.7%), and English (120 | 5.8%), together accounting for 64.4% of all Steep Falls residents.
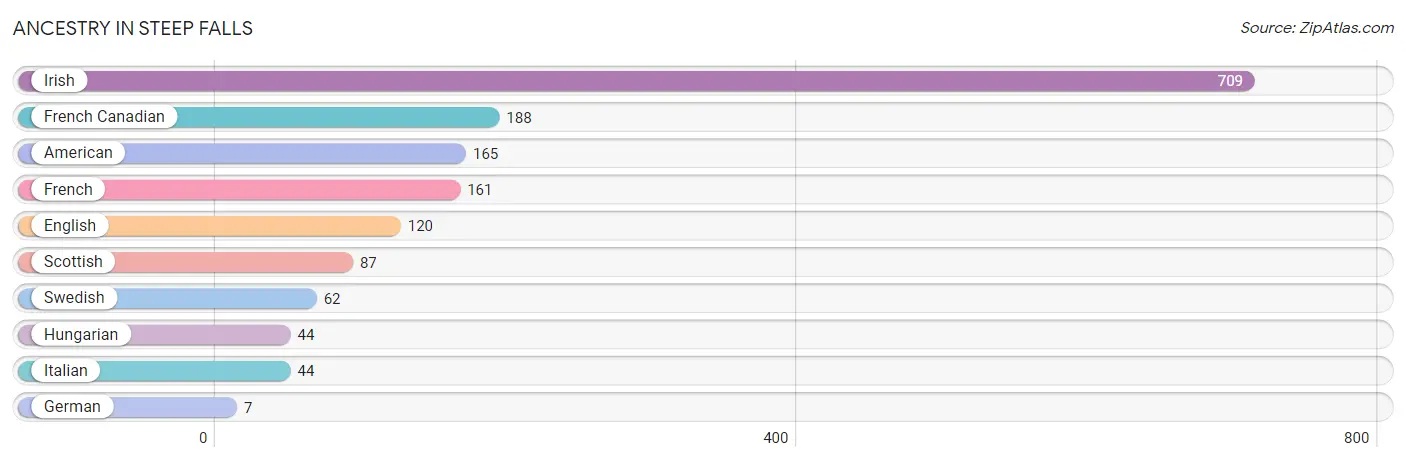
| Ancestry | # Population | % Population |
| American | 165 | 7.9% |
| English | 120 | 5.8% |
| French | 161 | 7.7% |
| French Canadian | 188 | 9.0% |
| German | 7 | 0.3% |
| Hungarian | 44 | 2.1% |
| Irish | 709 | 34.0% |
| Italian | 44 | 2.1% |
| Scottish | 87 | 4.2% |
| Swedish | 62 | 3.0% | View All 10 Rows |
Immigrants in Steep Falls

| Immigration Origin | # Population | % Population | View All 0 Rows |
Sex and Age in Steep Falls
Sex and Age in Steep Falls
The most populous age groups in Steep Falls are 5 to 9 Years (142 | 16.6%) for men and 10 to 14 Years (185 | 15.0%) for women.
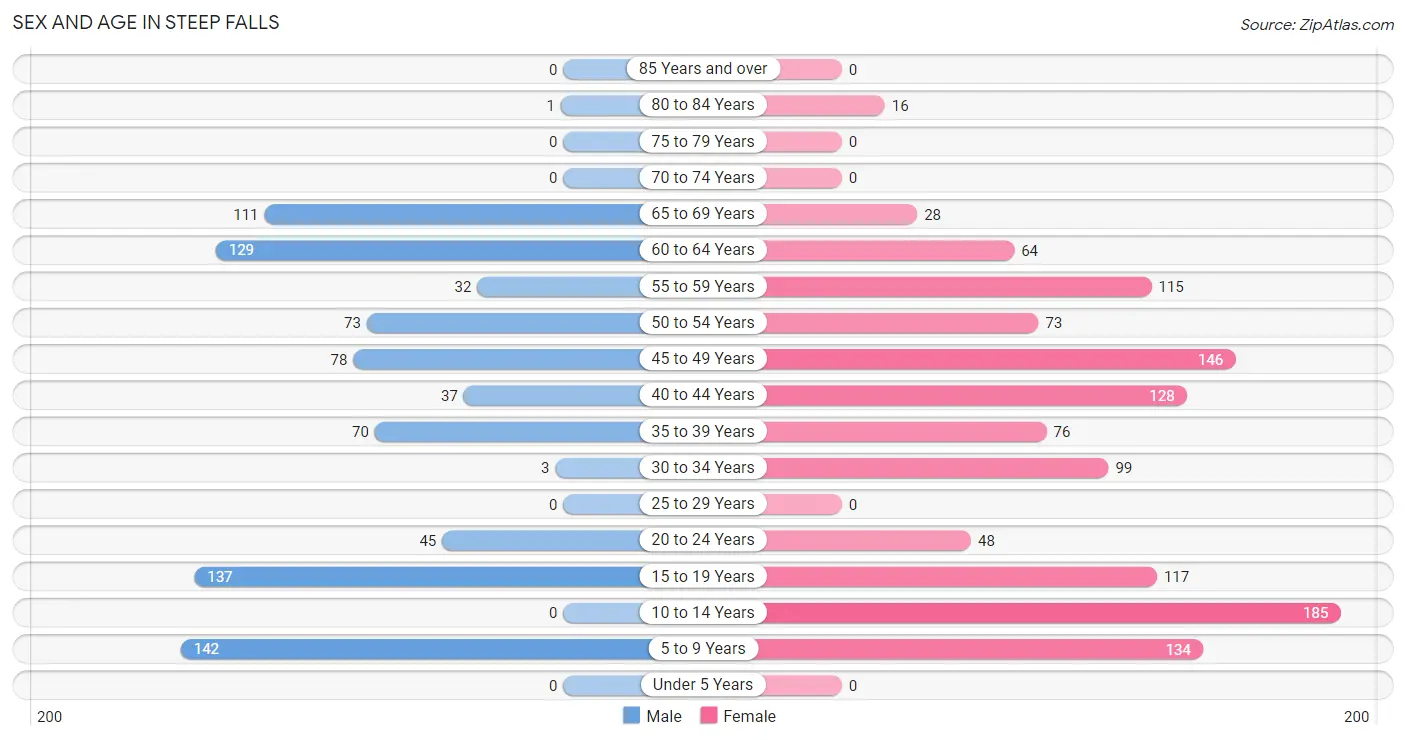
| Age Bracket | Male | Female |
| Under 5 Years | 0 (0.0%) | 0 (0.0%) |
| 5 to 9 Years | 142 (16.6%) | 134 (10.9%) |
| 10 to 14 Years | 0 (0.0%) | 185 (15.0%) |
| 15 to 19 Years | 137 (16.0%) | 117 (9.5%) |
| 20 to 24 Years | 45 (5.2%) | 48 (3.9%) |
| 25 to 29 Years | 0 (0.0%) | 0 (0.0%) |
| 30 to 34 Years | 3 (0.4%) | 99 (8.1%) |
| 35 to 39 Years | 70 (8.2%) | 76 (6.2%) |
| 40 to 44 Years | 37 (4.3%) | 128 (10.4%) |
| 45 to 49 Years | 78 (9.1%) | 146 (11.9%) |
| 50 to 54 Years | 73 (8.5%) | 73 (5.9%) |
| 55 to 59 Years | 32 (3.7%) | 115 (9.4%) |
| 60 to 64 Years | 129 (15.0%) | 64 (5.2%) |
| 65 to 69 Years | 111 (12.9%) | 28 (2.3%) |
| 70 to 74 Years | 0 (0.0%) | 0 (0.0%) |
| 75 to 79 Years | 0 (0.0%) | 0 (0.0%) |
| 80 to 84 Years | 1 (0.1%) | 16 (1.3%) |
| 85 Years and over | 0 (0.0%) | 0 (0.0%) |
| Total | 858 (100.0%) | 1,229 (100.0%) |
Families and Households in Steep Falls
Median Family Size in Steep Falls
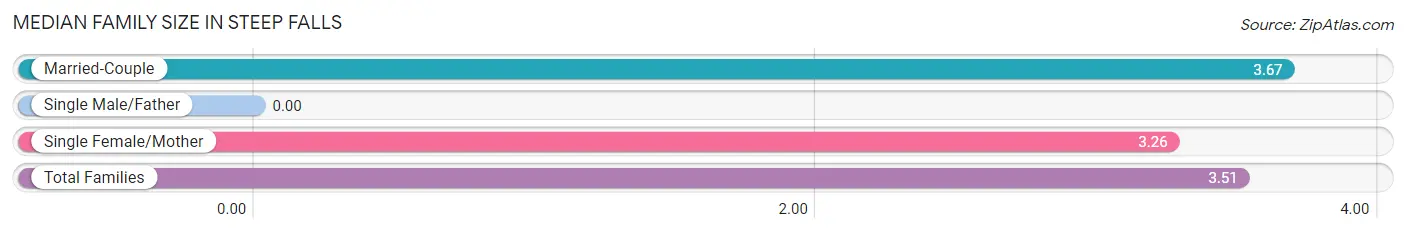
| Family Type | # Families | Family Size |
| Married-Couple | 317 (61.1%) | 3.67 |
| Single Male/Father | 0 (0.0%) | - |
| Single Female/Mother | 202 (38.9%) | 3.26 |
| Total Families | 519 (100.0%) | 3.51 |
Median Household Size in Steep Falls
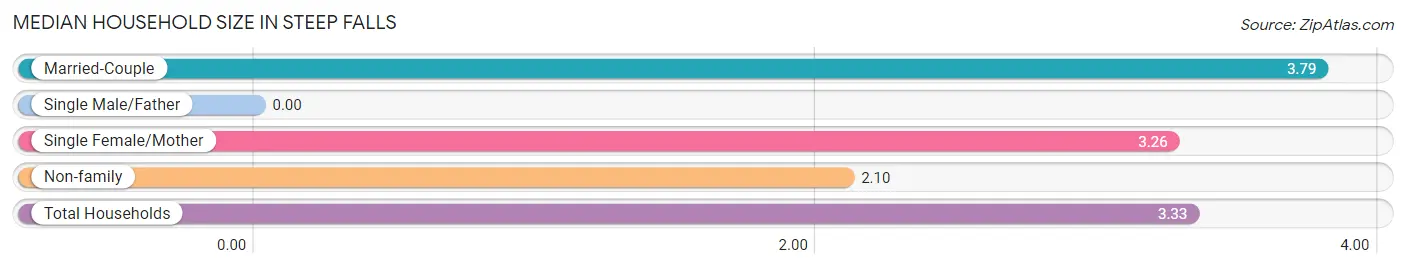
| Household Type | # Households | Household Size |
| Married-Couple | 317 (50.8%) | 3.79 |
| Single Male/Father | 0 (0.0%) | - |
| Single Female/Mother | 202 (32.4%) | 3.26 |
| Non-family | 105 (16.8%) | 2.10 |
| Total Households | 624 (100.0%) | 3.33 |
Household Size by Marriage Status in Steep Falls
Out of a total of 624 households in Steep Falls, 519 (83.2%) are family households, while 105 (16.8%) are nonfamily households. The most numerous type of family households are 3-person households, comprising 179, and the most common type of nonfamily households are 2-person households, comprising 89.
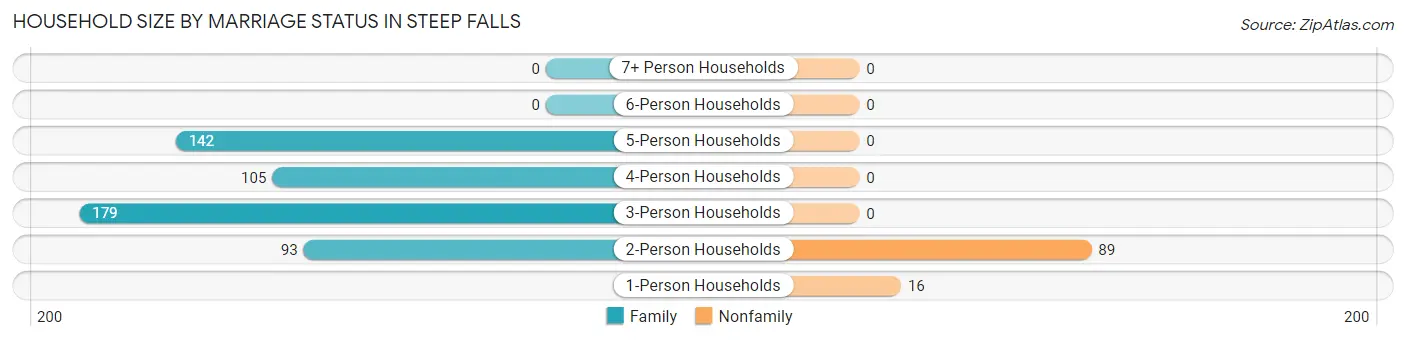
| Household Size | Family Households | Nonfamily Households |
| 1-Person Households | - | 16 (2.6%) |
| 2-Person Households | 93 (14.9%) | 89 (14.3%) |
| 3-Person Households | 179 (28.7%) | 0 (0.0%) |
| 4-Person Households | 105 (16.8%) | 0 (0.0%) |
| 5-Person Households | 142 (22.8%) | 0 (0.0%) |
| 6-Person Households | 0 (0.0%) | 0 (0.0%) |
| 7+ Person Households | 0 (0.0%) | 0 (0.0%) |
| Total | 519 (83.2%) | 105 (16.8%) |
Female Fertility in Steep Falls
Fertility by Age in Steep Falls
| Age Bracket | Women with Births | Births / 1,000 Women |
| 15 to 19 years | 0 (0.0%) | 0.0 |
| 20 to 34 years | 0 (0.0%) | 0.0 |
| 35 to 50 years | 0 (0.0%) | 0.0 |
| Total | 0 (0.0%) | 0.0 |
Fertility by Age by Marriage Status in Steep Falls
| Age Bracket | Married | Unmarried |
| 15 to 19 years | 0 (0.0%) | 0 (0.0%) |
| 20 to 34 years | 0 (0.0%) | 0 (0.0%) |
| 35 to 50 years | 0 (0.0%) | 0 (0.0%) |
| Total | 0 (0.0%) | 0 (0.0%) |
Fertility by Education in Steep Falls
| Educational Attainment | Women with Births | Births / 1,000 Women |
| Less than High School | 0 (0.0%) | 0.0 |
| High School Diploma | 0 (0.0%) | 0.0 |
| College or Associate's Degree | 0 (0.0%) | 0.0 |
| Bachelor's Degree | 0 (0.0%) | 0.0 |
| Graduate Degree | 0 (0.0%) | 0.0 |
| Total | 0 (0.0%) | 0.0 |
Fertility by Education by Marriage Status in Steep Falls
| Educational Attainment | Married | Unmarried |
| Less than High School | 0 (0.0%) | 0 (0.0%) |
| High School Diploma | 0 (0.0%) | 0 (0.0%) |
| College or Associate's Degree | 0 (0.0%) | 0 (0.0%) |
| Bachelor's Degree | 0 (0.0%) | 0 (0.0%) |
| Graduate Degree | 0 (0.0%) | 0 (0.0%) |
| Total | 0 (0.0%) | 0 (0.0%) |
Employment Characteristics in Steep Falls
Employment by Class of Employer in Steep Falls
Among the 873 employed individuals in Steep Falls, private company employees (562 | 64.4%), not-for-profit organizations (105 | 12.0%), and local government employees (70 | 8.0%) make up the most common classes of employment.
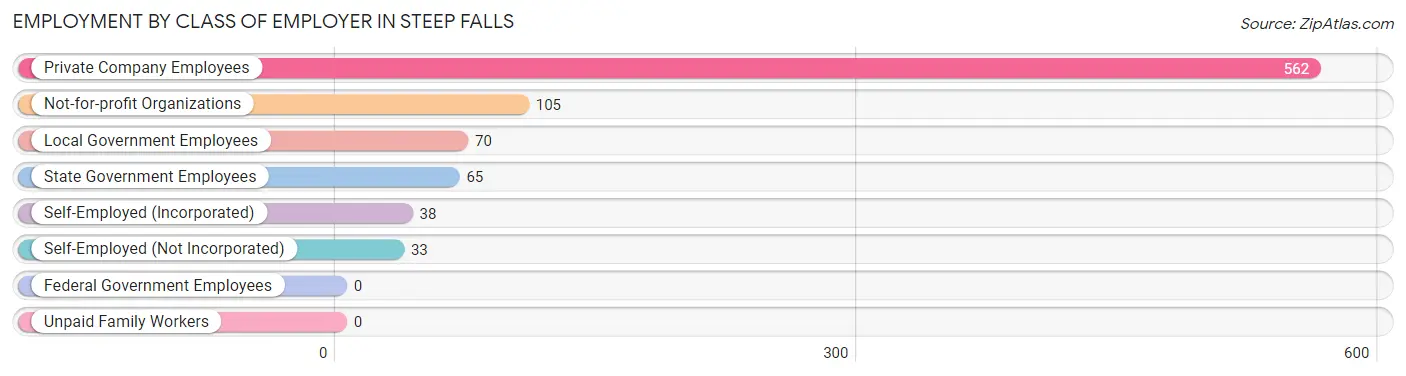
| Employer Class | # Employees | % Employees |
| Private Company Employees | 562 | 64.4% |
| Self-Employed (Incorporated) | 38 | 4.3% |
| Self-Employed (Not Incorporated) | 33 | 3.8% |
| Not-for-profit Organizations | 105 | 12.0% |
| Local Government Employees | 70 | 8.0% |
| State Government Employees | 65 | 7.4% |
| Federal Government Employees | 0 | 0.0% |
| Unpaid Family Workers | 0 | 0.0% |
| Total | 873 | 100.0% |
Employment Status by Age in Steep Falls
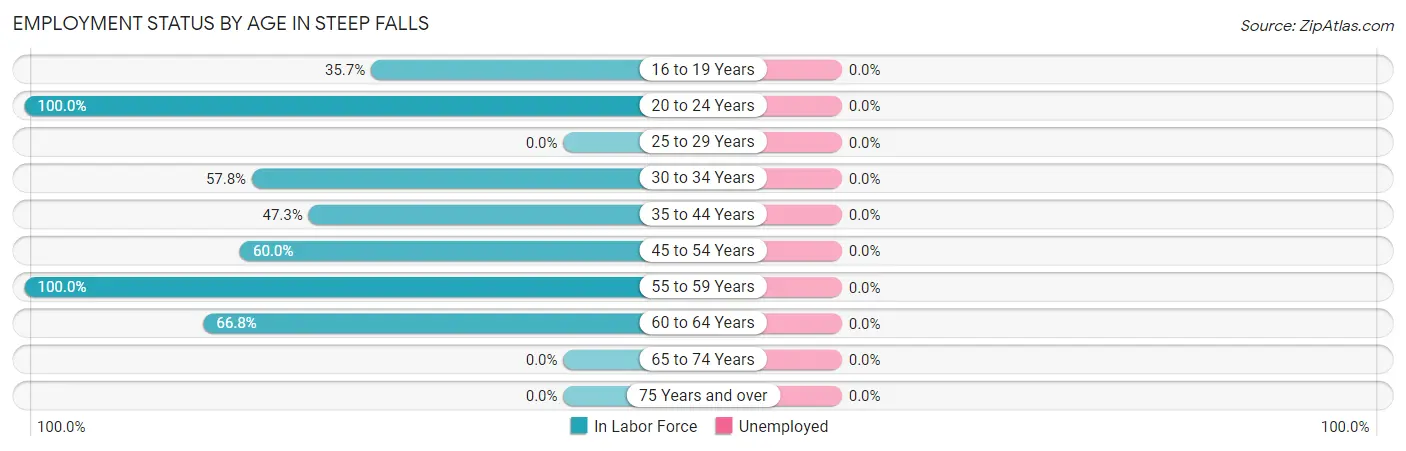
| Age Bracket | In Labor Force | Unemployed |
| 16 to 19 Years | 76 (35.7%) | 0 (0.0%) |
| 20 to 24 Years | 93 (100.0%) | 0 (0.0%) |
| 25 to 29 Years | 0 (0.0%) | 0 (0.0%) |
| 30 to 34 Years | 59 (57.8%) | 0 (0.0%) |
| 35 to 44 Years | 147 (47.3%) | 0 (0.0%) |
| 45 to 54 Years | 222 (60.0%) | 0 (0.0%) |
| 55 to 59 Years | 147 (100.0%) | 0 (0.0%) |
| 60 to 64 Years | 129 (66.8%) | 0 (0.0%) |
| 65 to 74 Years | 0 (0.0%) | 0 (0.0%) |
| 75 Years and over | 0 (0.0%) | 0 (0.0%) |
| Total | 873 (55.1%) | 0 (0.0%) |
Employment Status by Educational Attainment in Steep Falls
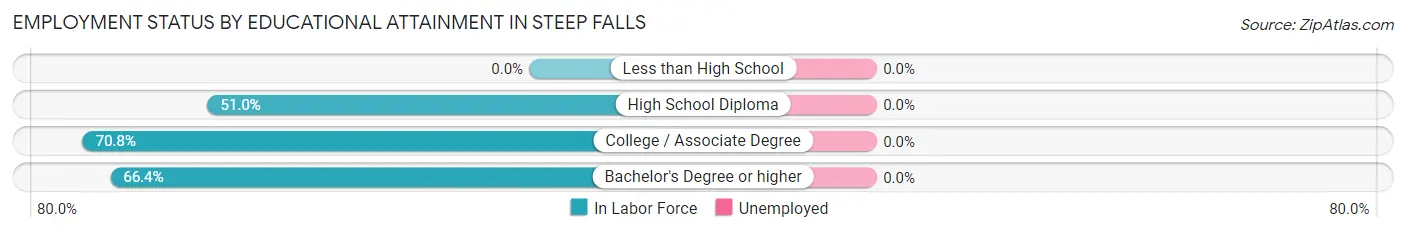
| Educational Attainment | In Labor Force | Unemployed |
| Less than High School | 0 (0.0%) | 0 (0.0%) |
| High School Diploma | 202 (51.0%) | 0 (0.0%) |
| College / Associate Degree | 362 (70.8%) | 0 (0.0%) |
| Bachelor's Degree or higher | 140 (66.4%) | 0 (0.0%) |
| Total | 704 (62.7%) | 0 (0.0%) |
Employment Occupations by Sex in Steep Falls
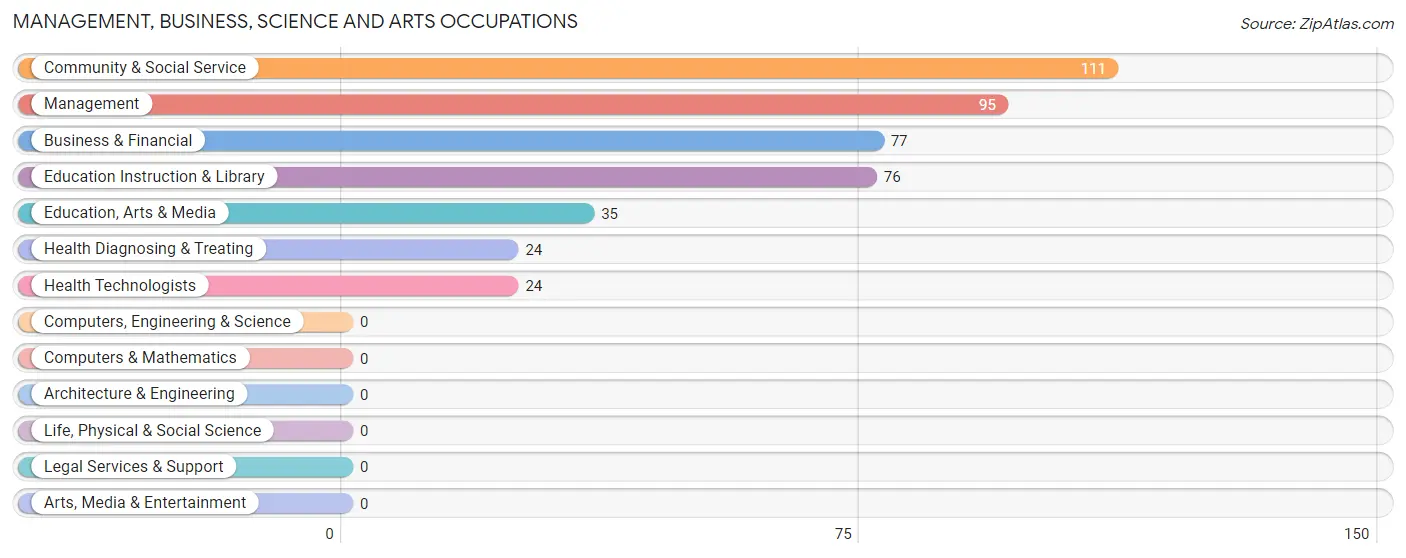
Management, Business, Science and Arts Occupations
The most common Management, Business, Science and Arts occupations in Steep Falls are Community & Social Service (111 | 12.7%), Management (95 | 10.9%), Business & Financial (77 | 8.8%), Education Instruction & Library (76 | 8.7%), and Education, Arts & Media (35 | 4.0%).
Management, Business, Science and Arts Occupations by Sex
Within the Management, Business, Science and Arts occupations in Steep Falls, the most male-oriented occupations are Management (100.0%), and Business & Financial (100.0%), while the most female-oriented occupations are Community & Social Service (100.0%), Education, Arts & Media (100.0%), and Education Instruction & Library (100.0%).
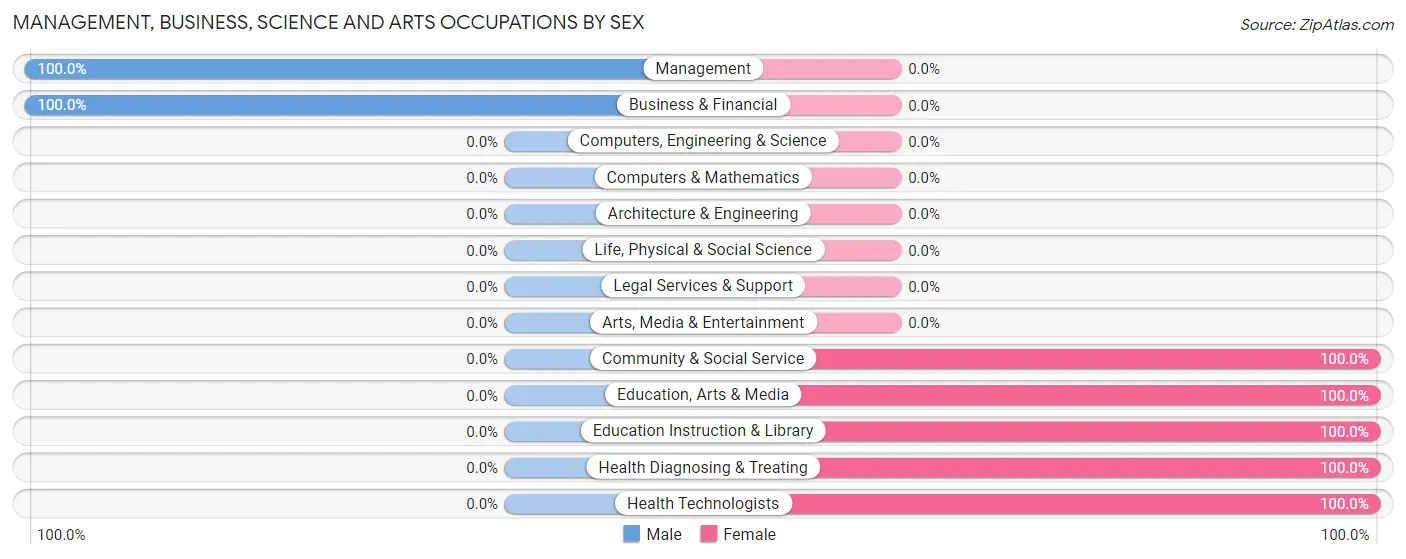
| Occupation | Male | Female |
| Management | 95 (100.0%) | 0 (0.0%) |
| Business & Financial | 77 (100.0%) | 0 (0.0%) |
| Computers, Engineering & Science | 0 (0.0%) | 0 (0.0%) |
| Computers & Mathematics | 0 (0.0%) | 0 (0.0%) |
| Architecture & Engineering | 0 (0.0%) | 0 (0.0%) |
| Life, Physical & Social Science | 0 (0.0%) | 0 (0.0%) |
| Community & Social Service | 0 (0.0%) | 111 (100.0%) |
| Education, Arts & Media | 0 (0.0%) | 35 (100.0%) |
| Legal Services & Support | 0 (0.0%) | 0 (0.0%) |
| Education Instruction & Library | 0 (0.0%) | 76 (100.0%) |
| Arts, Media & Entertainment | 0 (0.0%) | 0 (0.0%) |
| Health Diagnosing & Treating | 0 (0.0%) | 24 (100.0%) |
| Health Technologists | 0 (0.0%) | 24 (100.0%) |
| Total (Category) | 172 (56.0%) | 135 (44.0%) |
| Total (Overall) | 460 (52.7%) | 413 (47.3%) |
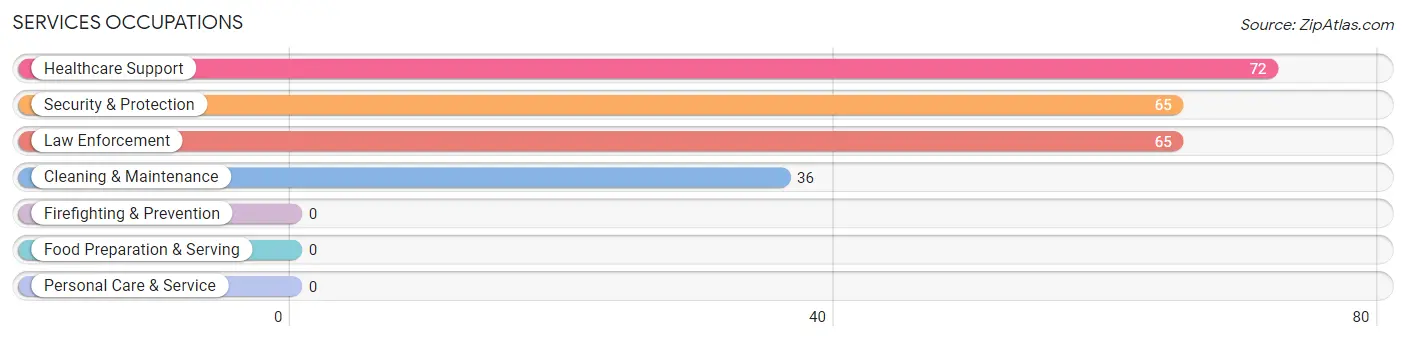
Services Occupations
The most common Services occupations in Steep Falls are Healthcare Support (72 | 8.3%), Security & Protection (65 | 7.4%), Law Enforcement (65 | 7.4%), and Cleaning & Maintenance (36 | 4.1%).
Services Occupations by Sex
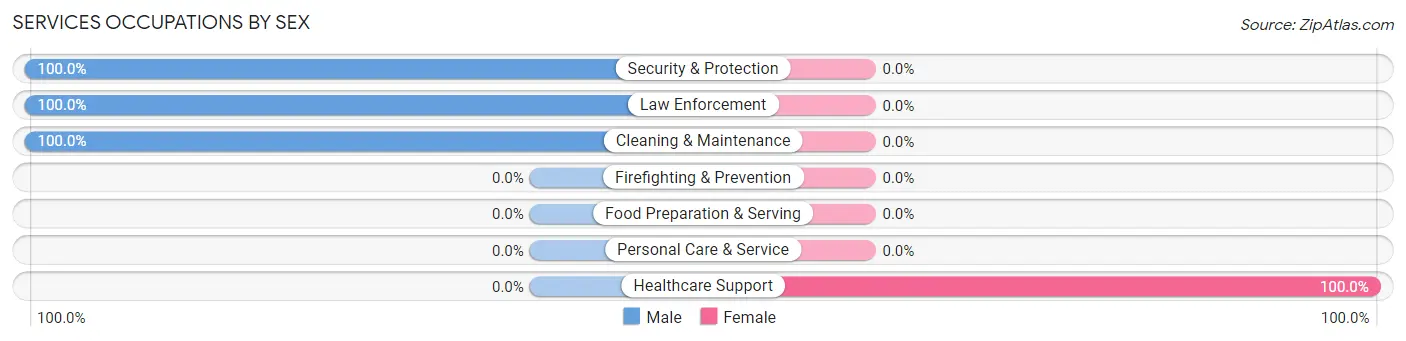
| Occupation | Male | Female |
| Healthcare Support | 0 (0.0%) | 72 (100.0%) |
| Security & Protection | 65 (100.0%) | 0 (0.0%) |
| Firefighting & Prevention | 0 (0.0%) | 0 (0.0%) |
| Law Enforcement | 65 (100.0%) | 0 (0.0%) |
| Food Preparation & Serving | 0 (0.0%) | 0 (0.0%) |
| Cleaning & Maintenance | 36 (100.0%) | 0 (0.0%) |
| Personal Care & Service | 0 (0.0%) | 0 (0.0%) |
| Total (Category) | 101 (58.4%) | 72 (41.6%) |
| Total (Overall) | 460 (52.7%) | 413 (47.3%) |
Sales and Office Occupations
The most common Sales and Office occupations in Steep Falls are , and Office & Administration (164 | 18.8%).
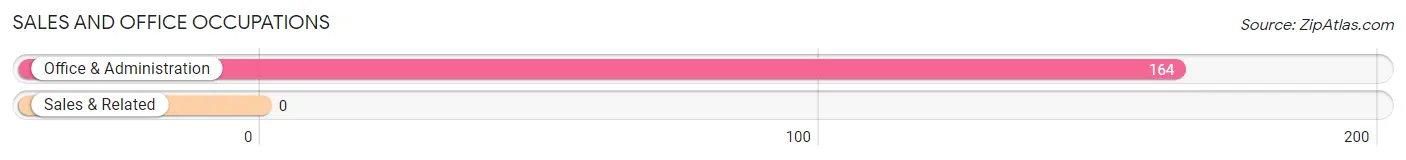
Sales and Office Occupations by Sex
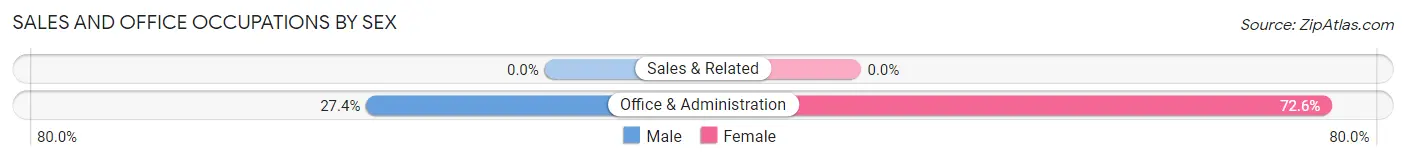
| Occupation | Male | Female |
| Sales & Related | 0 (0.0%) | 0 (0.0%) |
| Office & Administration | 45 (27.4%) | 119 (72.6%) |
| Total (Category) | 45 (27.4%) | 119 (72.6%) |
| Total (Overall) | 460 (52.7%) | 413 (47.3%) |
Natural Resources, Construction and Maintenance Occupations
The most common Natural Resources, Construction and Maintenance occupations in Steep Falls are , and Construction & Extraction (35 | 4.0%).
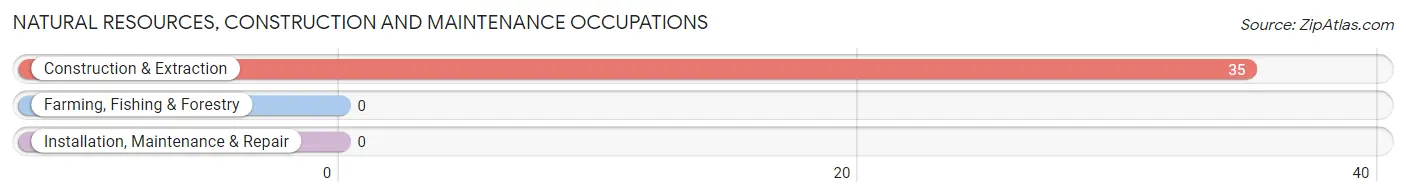
Natural Resources, Construction and Maintenance Occupations by Sex
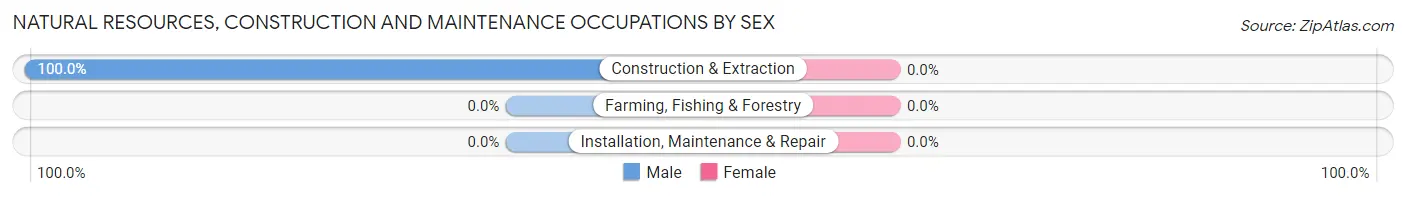
| Occupation | Male | Female |
| Farming, Fishing & Forestry | 0 (0.0%) | 0 (0.0%) |
| Construction & Extraction | 35 (100.0%) | 0 (0.0%) |
| Installation, Maintenance & Repair | 0 (0.0%) | 0 (0.0%) |
| Total (Category) | 35 (100.0%) | 0 (0.0%) |
| Total (Overall) | 460 (52.7%) | 413 (47.3%) |
Production, Transportation and Moving Occupations
The most common Production, Transportation and Moving occupations in Steep Falls are Transportation (107 | 12.3%), and Production (87 | 10.0%).
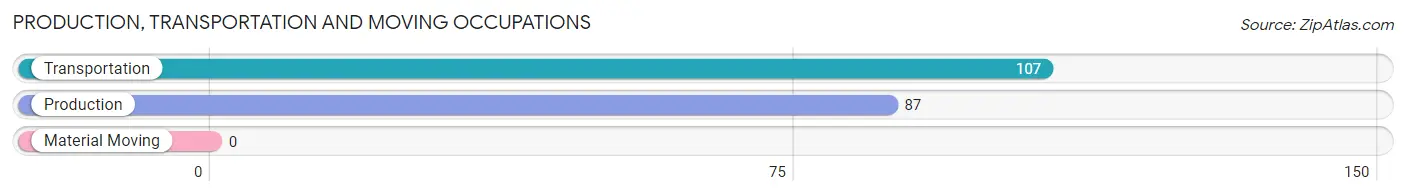
Production, Transportation and Moving Occupations by Sex
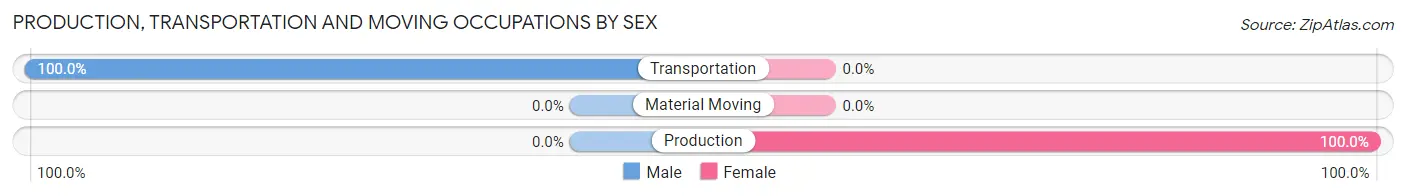
| Occupation | Male | Female |
| Production | 0 (0.0%) | 87 (100.0%) |
| Transportation | 107 (100.0%) | 0 (0.0%) |
| Material Moving | 0 (0.0%) | 0 (0.0%) |
| Total (Category) | 107 (55.1%) | 87 (44.9%) |
| Total (Overall) | 460 (52.7%) | 413 (47.3%) |
Employment Industries by Sex in Steep Falls
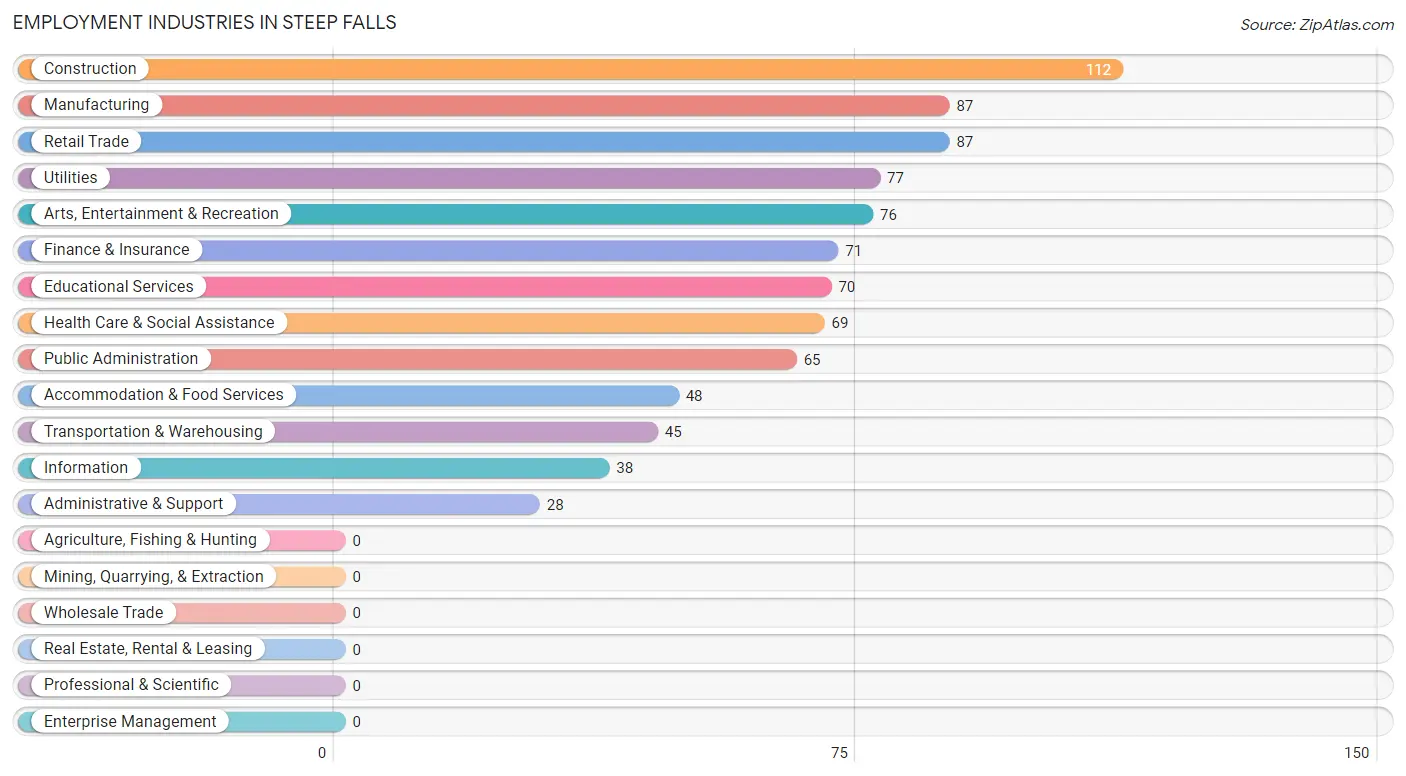
Employment Industries in Steep Falls
The major employment industries in Steep Falls include Construction (112 | 12.8%), Manufacturing (87 | 10.0%), Retail Trade (87 | 10.0%), Utilities (77 | 8.8%), and Arts, Entertainment & Recreation (76 | 8.7%).
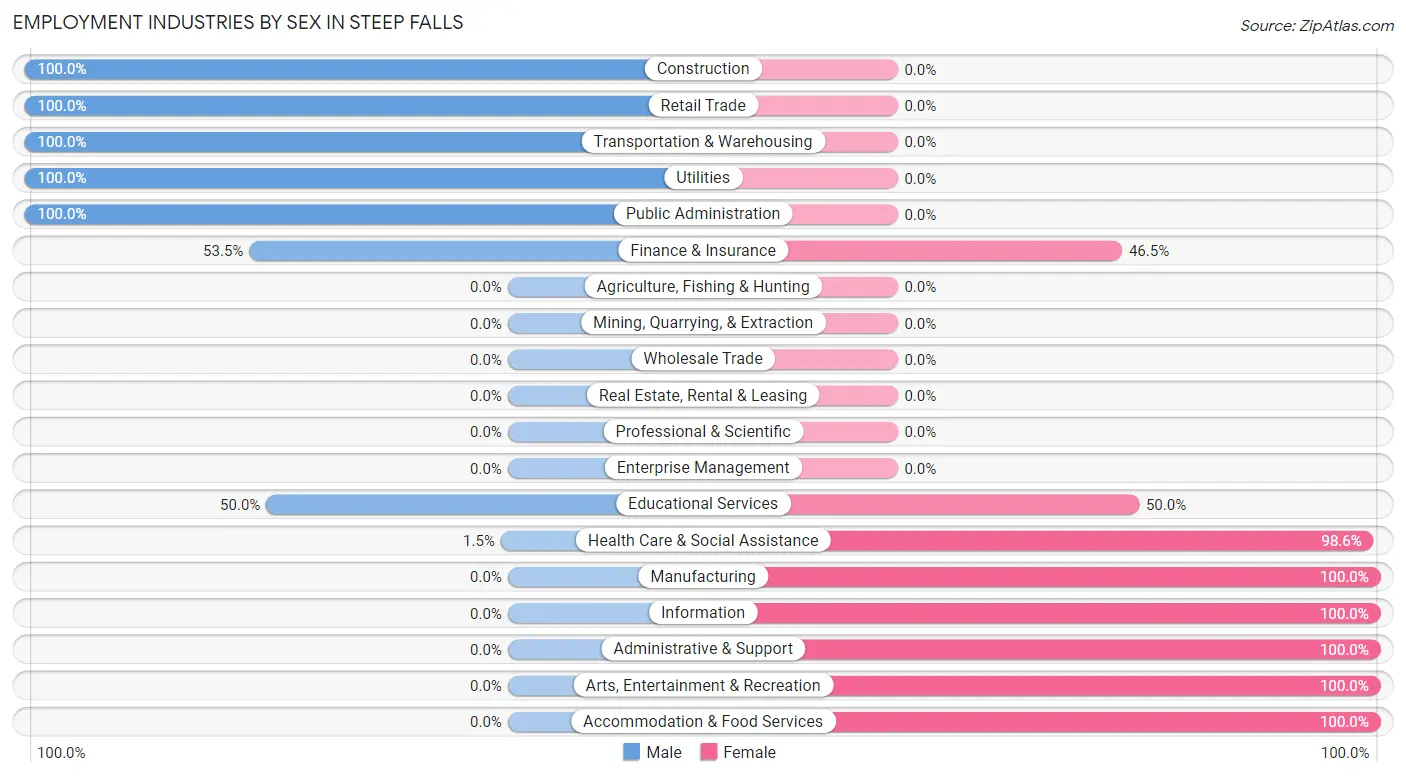
Employment Industries by Sex in Steep Falls
The Steep Falls industries that see more men than women are Construction (100.0%), Retail Trade (100.0%), and Transportation & Warehousing (100.0%), whereas the industries that tend to have a higher number of women are Manufacturing (100.0%), Information (100.0%), and Administrative & Support (100.0%).
| Industry | Male | Female |
| Agriculture, Fishing & Hunting | 0 (0.0%) | 0 (0.0%) |
| Mining, Quarrying, & Extraction | 0 (0.0%) | 0 (0.0%) |
| Construction | 112 (100.0%) | 0 (0.0%) |
| Manufacturing | 0 (0.0%) | 87 (100.0%) |
| Wholesale Trade | 0 (0.0%) | 0 (0.0%) |
| Retail Trade | 87 (100.0%) | 0 (0.0%) |
| Transportation & Warehousing | 45 (100.0%) | 0 (0.0%) |
| Utilities | 77 (100.0%) | 0 (0.0%) |
| Information | 0 (0.0%) | 38 (100.0%) |
| Finance & Insurance | 38 (53.5%) | 33 (46.5%) |
| Real Estate, Rental & Leasing | 0 (0.0%) | 0 (0.0%) |
| Professional & Scientific | 0 (0.0%) | 0 (0.0%) |
| Enterprise Management | 0 (0.0%) | 0 (0.0%) |
| Administrative & Support | 0 (0.0%) | 28 (100.0%) |
| Educational Services | 35 (50.0%) | 35 (50.0%) |
| Health Care & Social Assistance | 1 (1.5%) | 68 (98.6%) |
| Arts, Entertainment & Recreation | 0 (0.0%) | 76 (100.0%) |
| Accommodation & Food Services | 0 (0.0%) | 48 (100.0%) |
| Public Administration | 65 (100.0%) | 0 (0.0%) |
| Total | 460 (52.7%) | 413 (47.3%) |
Education in Steep Falls
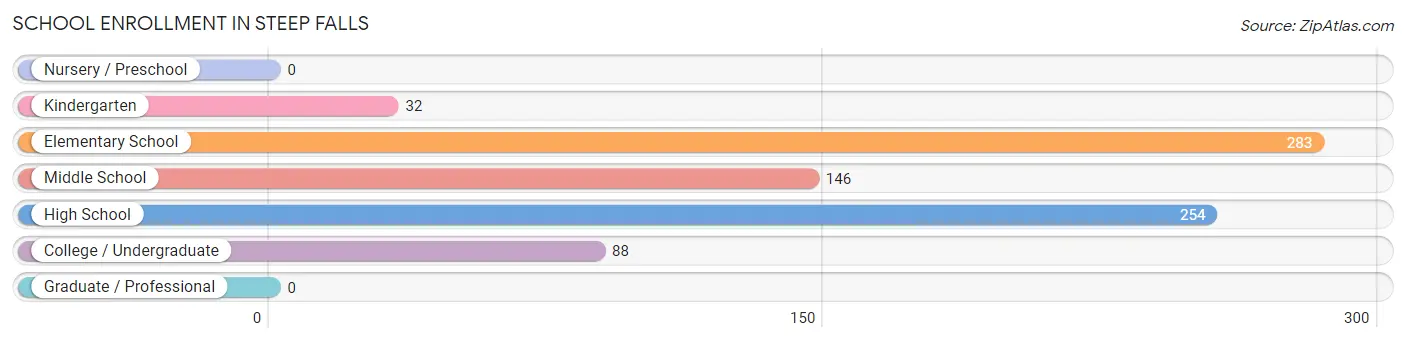
School Enrollment in Steep Falls
The most common levels of schooling among the 803 students in Steep Falls are elementary school (283 | 35.2%), high school (254 | 31.6%), and middle school (146 | 18.2%).
| School Level | # Students | % Students |
| Nursery / Preschool | 0 | 0.0% |
| Kindergarten | 32 | 4.0% |
| Elementary School | 283 | 35.2% |
| Middle School | 146 | 18.2% |
| High School | 254 | 31.6% |
| College / Undergraduate | 88 | 11.0% |
| Graduate / Professional | 0 | 0.0% |
| Total | 803 | 100.0% |
School Enrollment by Age by Funding Source in Steep Falls
Out of a total of 803 students who are enrolled in schools in Steep Falls, 158 (19.7%) attend a private institution, while the remaining 645 (80.3%) are enrolled in public schools. The age group of 35 years and over has the highest likelihood of being enrolled in private schools, with 64 (100.0% in the age bracket) enrolled. Conversely, the age group of 15 to 17 year olds has the lowest likelihood of being enrolled in a private school, with 224 (100.0% in the age bracket) attending a public institution.
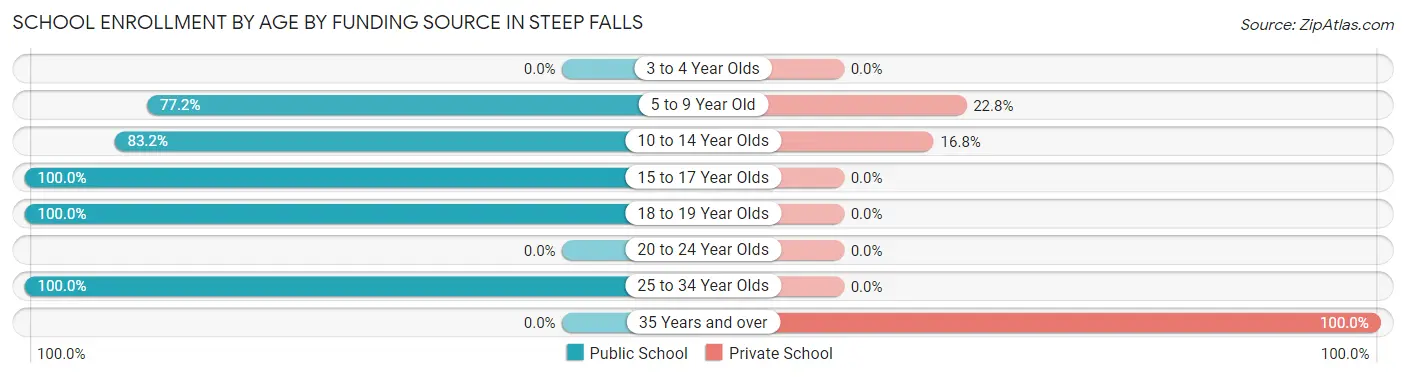
| Age Bracket | Public School | Private School |
| 3 to 4 Year Olds | 0 (0.0%) | 0 (0.0%) |
| 5 to 9 Year Old | 213 (77.2%) | 63 (22.8%) |
| 10 to 14 Year Olds | 154 (83.2%) | 31 (16.8%) |
| 15 to 17 Year Olds | 224 (100.0%) | 0 (0.0%) |
| 18 to 19 Year Olds | 30 (100.0%) | 0 (0.0%) |
| 20 to 24 Year Olds | 0 (0.0%) | 0 (0.0%) |
| 25 to 34 Year Olds | 24 (100.0%) | 0 (0.0%) |
| 35 Years and over | 0 (0.0%) | 64 (100.0%) |
| Total | 645 (80.3%) | 158 (19.7%) |
Educational Attainment by Field of Study in Steep Falls
Literature & languages (116 | 55.0%), business (57 | 27.0%), and education (38 | 18.0%) are the most common fields of study among 211 individuals in Steep Falls who have obtained a bachelor's degree or higher.
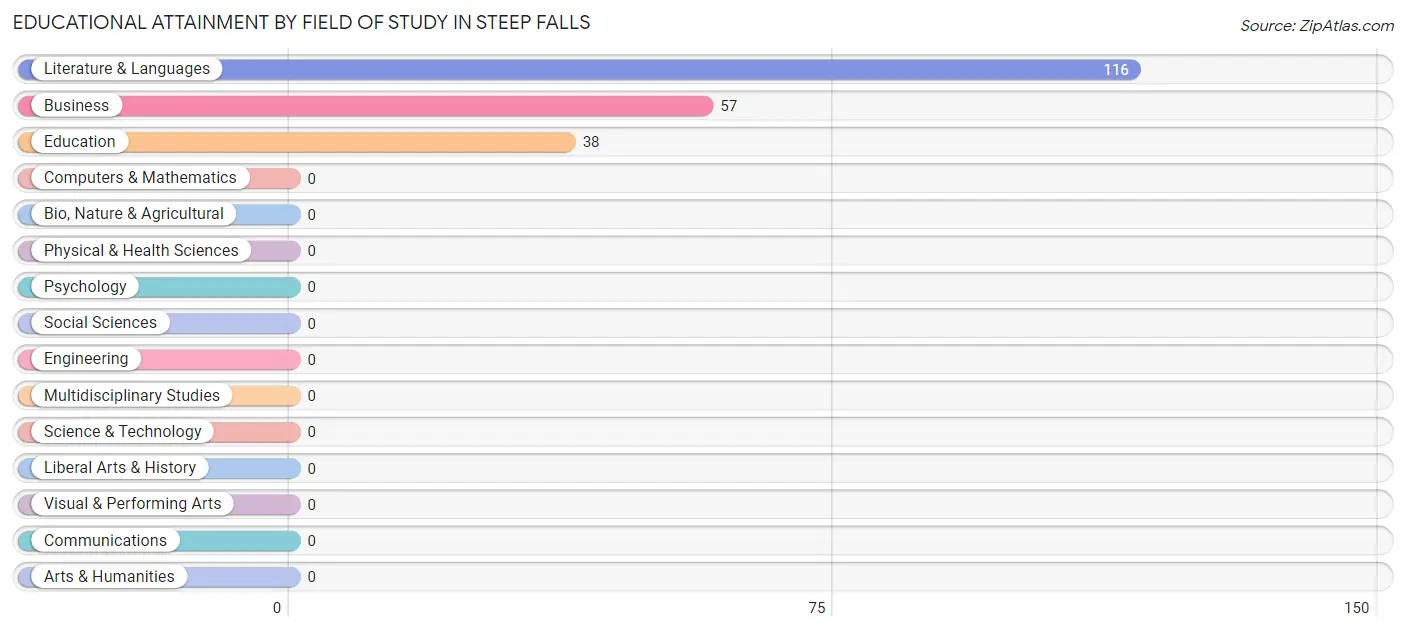
| Field of Study | # Graduates | % Graduates |
| Computers & Mathematics | 0 | 0.0% |
| Bio, Nature & Agricultural | 0 | 0.0% |
| Physical & Health Sciences | 0 | 0.0% |
| Psychology | 0 | 0.0% |
| Social Sciences | 0 | 0.0% |
| Engineering | 0 | 0.0% |
| Multidisciplinary Studies | 0 | 0.0% |
| Science & Technology | 0 | 0.0% |
| Business | 57 | 27.0% |
| Education | 38 | 18.0% |
| Literature & Languages | 116 | 55.0% |
| Liberal Arts & History | 0 | 0.0% |
| Visual & Performing Arts | 0 | 0.0% |
| Communications | 0 | 0.0% |
| Arts & Humanities | 0 | 0.0% |
| Total | 211 | 100.0% |
Transportation & Commute in Steep Falls
Vehicle Availability by Sex in Steep Falls
The most prevalent vehicle ownership categories in Steep Falls are males with 2 vehicles (230, accounting for 50.1%) and females with 2 vehicles (155, making up 55.7%).
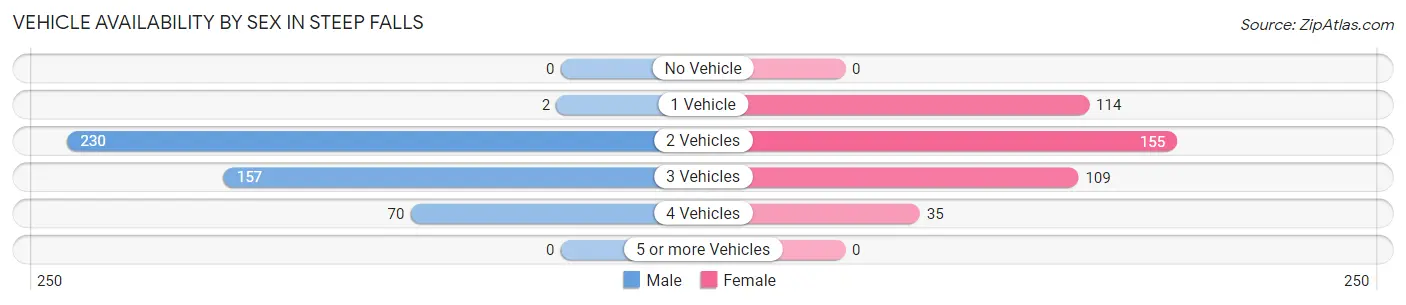
| Vehicles Available | Male | Female |
| No Vehicle | 0 (0.0%) | 0 (0.0%) |
| 1 Vehicle | 2 (0.4%) | 114 (27.6%) |
| 2 Vehicles | 230 (50.1%) | 155 (37.5%) |
| 3 Vehicles | 157 (34.2%) | 109 (26.4%) |
| 4 Vehicles | 70 (15.2%) | 35 (8.5%) |
| 5 or more Vehicles | 0 (0.0%) | 0 (0.0%) |
| Total | 459 (100.0%) | 413 (100.0%) |
Commute Time in Steep Falls
The most frequently occuring commute durations in Steep Falls are 30 to 34 minutes (143 commuters, 18.0%), 45 to 59 minutes (109 commuters, 13.7%), and 40 to 44 minutes (100 commuters, 12.6%).
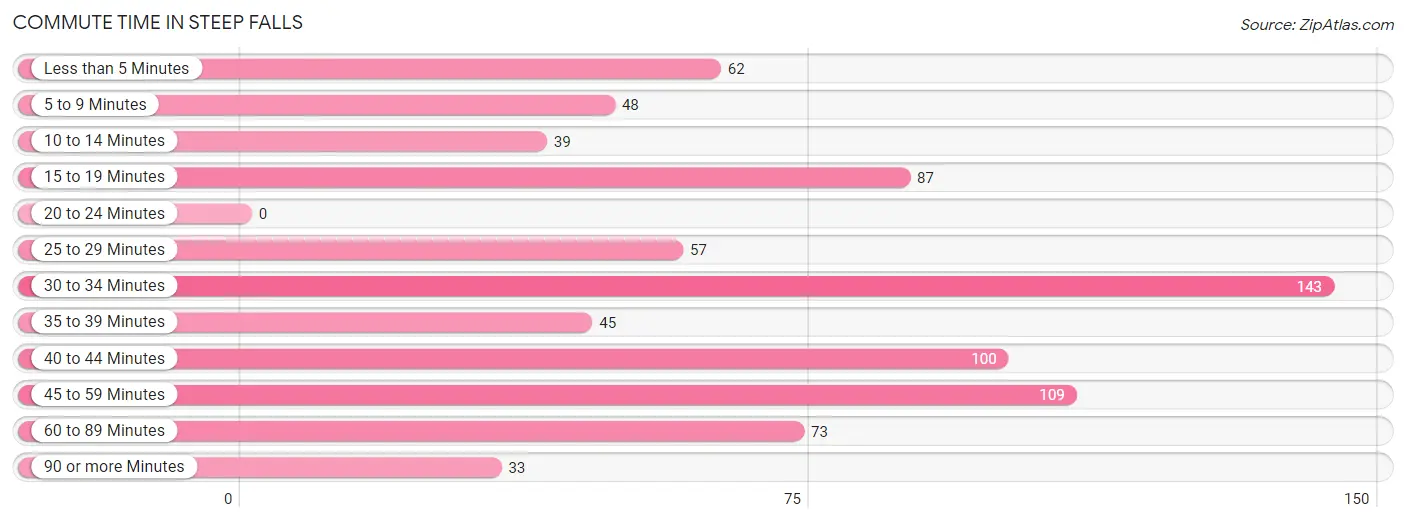
| Commute Time | # Commuters | % Commuters |
| Less than 5 Minutes | 62 | 7.8% |
| 5 to 9 Minutes | 48 | 6.0% |
| 10 to 14 Minutes | 39 | 4.9% |
| 15 to 19 Minutes | 87 | 10.9% |
| 20 to 24 Minutes | 0 | 0.0% |
| 25 to 29 Minutes | 57 | 7.2% |
| 30 to 34 Minutes | 143 | 18.0% |
| 35 to 39 Minutes | 45 | 5.7% |
| 40 to 44 Minutes | 100 | 12.6% |
| 45 to 59 Minutes | 109 | 13.7% |
| 60 to 89 Minutes | 73 | 9.2% |
| 90 or more Minutes | 33 | 4.2% |
Commute Time by Sex in Steep Falls
The most common commute times in Steep Falls are 30 to 34 minutes (82 commuters, 21.4%) for males and 40 to 44 minutes (100 commuters, 24.2%) for females.
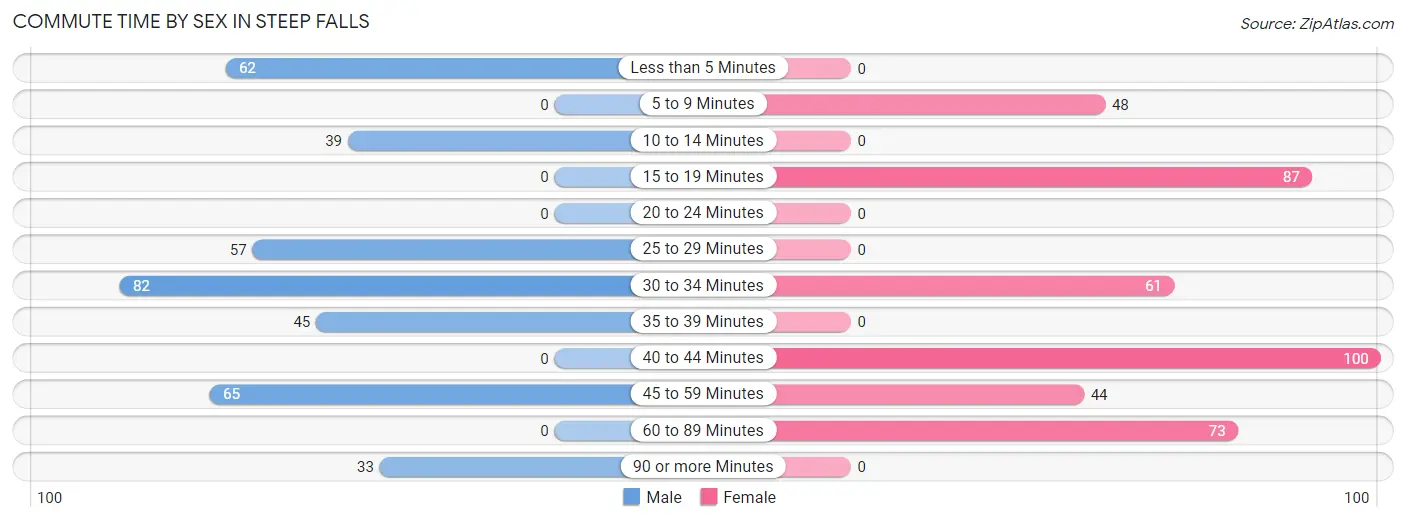
| Commute Time | Male | Female |
| Less than 5 Minutes | 62 (16.2%) | 0 (0.0%) |
| 5 to 9 Minutes | 0 (0.0%) | 48 (11.6%) |
| 10 to 14 Minutes | 39 (10.2%) | 0 (0.0%) |
| 15 to 19 Minutes | 0 (0.0%) | 87 (21.1%) |
| 20 to 24 Minutes | 0 (0.0%) | 0 (0.0%) |
| 25 to 29 Minutes | 57 (14.9%) | 0 (0.0%) |
| 30 to 34 Minutes | 82 (21.4%) | 61 (14.8%) |
| 35 to 39 Minutes | 45 (11.7%) | 0 (0.0%) |
| 40 to 44 Minutes | 0 (0.0%) | 100 (24.2%) |
| 45 to 59 Minutes | 65 (17.0%) | 44 (10.6%) |
| 60 to 89 Minutes | 0 (0.0%) | 73 (17.7%) |
| 90 or more Minutes | 33 (8.6%) | 0 (0.0%) |
Time of Departure to Work by Sex in Steep Falls
The most frequent times of departure to work in Steep Falls are 6:30 AM to 6:59 AM (162, 42.3%) for males and 6:30 AM to 6:59 AM (111, 26.9%) for females.
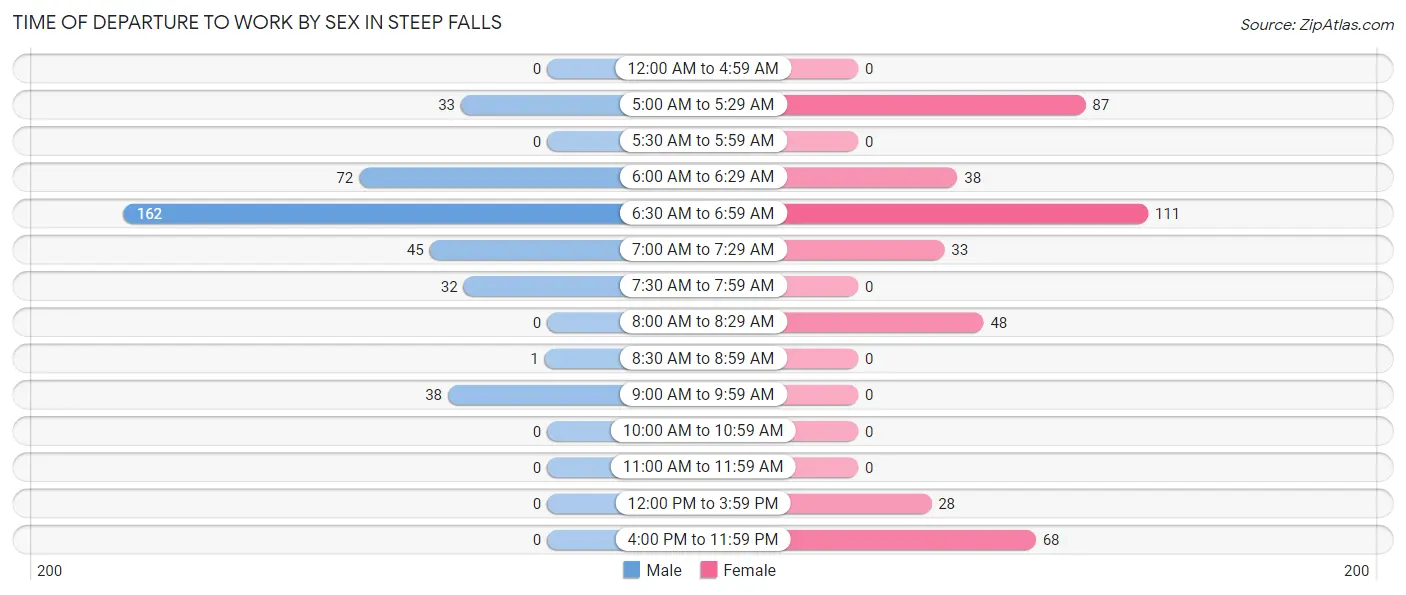
| Time of Departure | Male | Female |
| 12:00 AM to 4:59 AM | 0 (0.0%) | 0 (0.0%) |
| 5:00 AM to 5:29 AM | 33 (8.6%) | 87 (21.1%) |
| 5:30 AM to 5:59 AM | 0 (0.0%) | 0 (0.0%) |
| 6:00 AM to 6:29 AM | 72 (18.8%) | 38 (9.2%) |
| 6:30 AM to 6:59 AM | 162 (42.3%) | 111 (26.9%) |
| 7:00 AM to 7:29 AM | 45 (11.7%) | 33 (8.0%) |
| 7:30 AM to 7:59 AM | 32 (8.4%) | 0 (0.0%) |
| 8:00 AM to 8:29 AM | 0 (0.0%) | 48 (11.6%) |
| 8:30 AM to 8:59 AM | 1 (0.3%) | 0 (0.0%) |
| 9:00 AM to 9:59 AM | 38 (9.9%) | 0 (0.0%) |
| 10:00 AM to 10:59 AM | 0 (0.0%) | 0 (0.0%) |
| 11:00 AM to 11:59 AM | 0 (0.0%) | 0 (0.0%) |
| 12:00 PM to 3:59 PM | 0 (0.0%) | 28 (6.8%) |
| 4:00 PM to 11:59 PM | 0 (0.0%) | 68 (16.5%) |
| Total | 383 (100.0%) | 413 (100.0%) |
Housing Occupancy in Steep Falls
Occupancy by Ownership in Steep Falls
Of the total 624 dwellings in Steep Falls, owner-occupied units account for 523 (83.8%), while renter-occupied units make up 101 (16.2%).
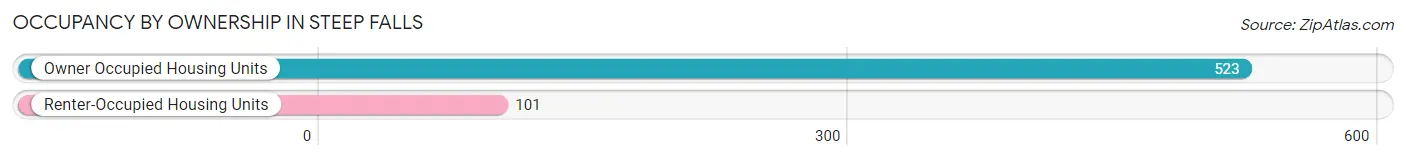
| Occupancy | # Housing Units | % Housing Units |
| Owner Occupied Housing Units | 523 | 83.8% |
| Renter-Occupied Housing Units | 101 | 16.2% |
| Total Occupied Housing Units | 624 | 100.0% |
Occupancy by Household Size in Steep Falls
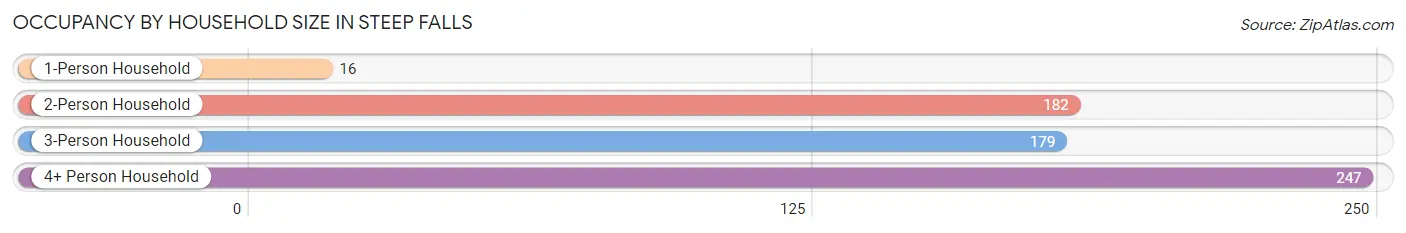
| Household Size | # Housing Units | % Housing Units |
| 1-Person Household | 16 | 2.6% |
| 2-Person Household | 182 | 29.2% |
| 3-Person Household | 179 | 28.7% |
| 4+ Person Household | 247 | 39.6% |
| Total Housing Units | 624 | 100.0% |
Occupancy by Ownership by Household Size in Steep Falls
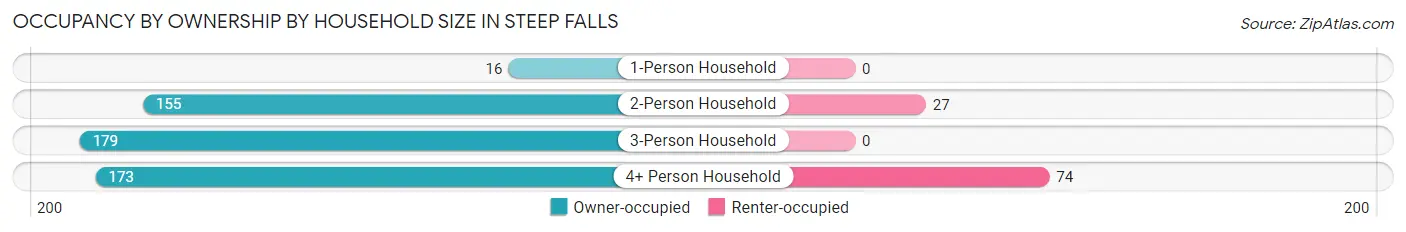
| Household Size | Owner-occupied | Renter-occupied |
| 1-Person Household | 16 (100.0%) | 0 (0.0%) |
| 2-Person Household | 155 (85.2%) | 27 (14.8%) |
| 3-Person Household | 179 (100.0%) | 0 (0.0%) |
| 4+ Person Household | 173 (70.0%) | 74 (30.0%) |
| Total Housing Units | 523 (83.8%) | 101 (16.2%) |
Occupancy by Educational Attainment in Steep Falls
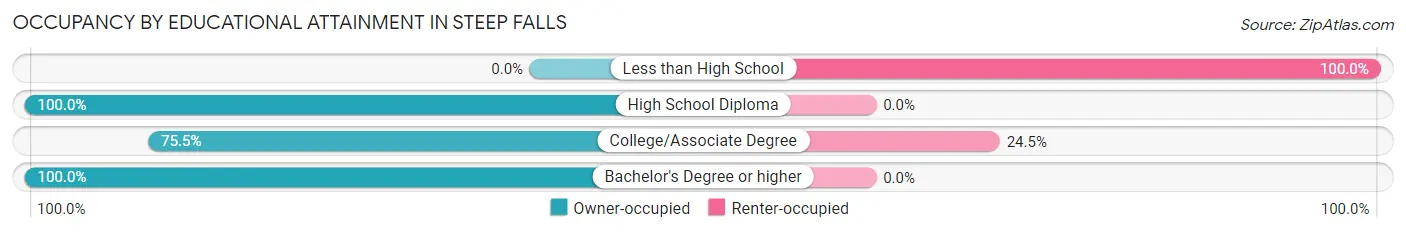
| Household Size | Owner-occupied | Renter-occupied |
| Less than High School | 0 (0.0%) | 27 (100.0%) |
| High School Diploma | 257 (100.0%) | 0 (0.0%) |
| College/Associate Degree | 228 (75.5%) | 74 (24.5%) |
| Bachelor's Degree or higher | 38 (100.0%) | 0 (0.0%) |
Occupancy by Age of Householder in Steep Falls
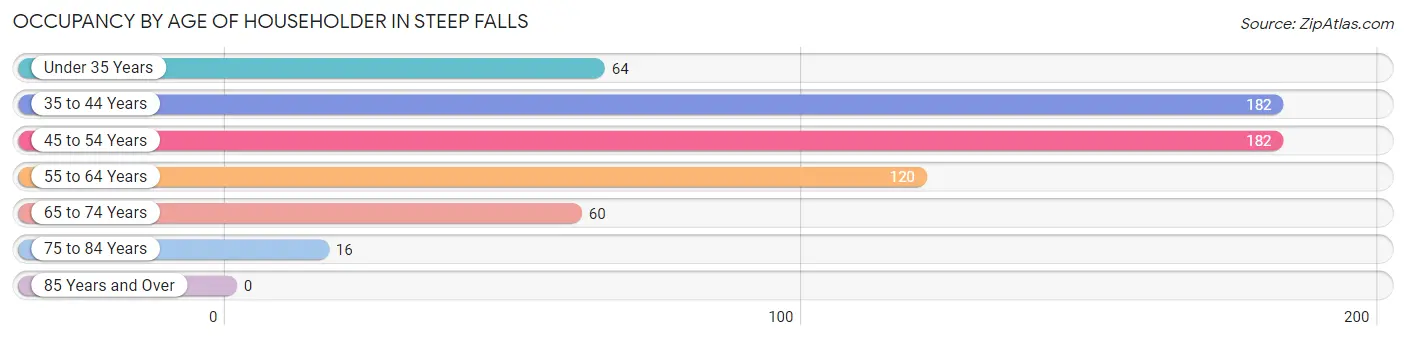
| Age Bracket | # Households | % Households |
| Under 35 Years | 64 | 10.3% |
| 35 to 44 Years | 182 | 29.2% |
| 45 to 54 Years | 182 | 29.2% |
| 55 to 64 Years | 120 | 19.2% |
| 65 to 74 Years | 60 | 9.6% |
| 75 to 84 Years | 16 | 2.6% |
| 85 Years and Over | 0 | 0.0% |
| Total | 624 | 100.0% |
Housing Finances in Steep Falls
Median Income by Occupancy in Steep Falls
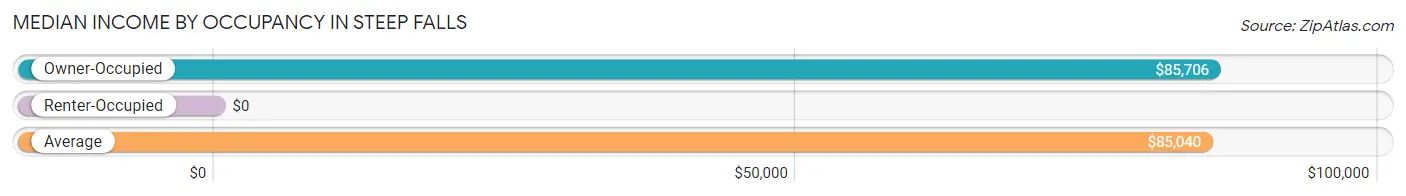
| Occupancy Type | # Households | Median Income |
| Owner-Occupied | 523 (83.8%) | $85,706 |
| Renter-Occupied | 101 (16.2%) | $0 |
| Average | 624 (100.0%) | $85,040 |
Occupancy by Householder Income Bracket in Steep Falls
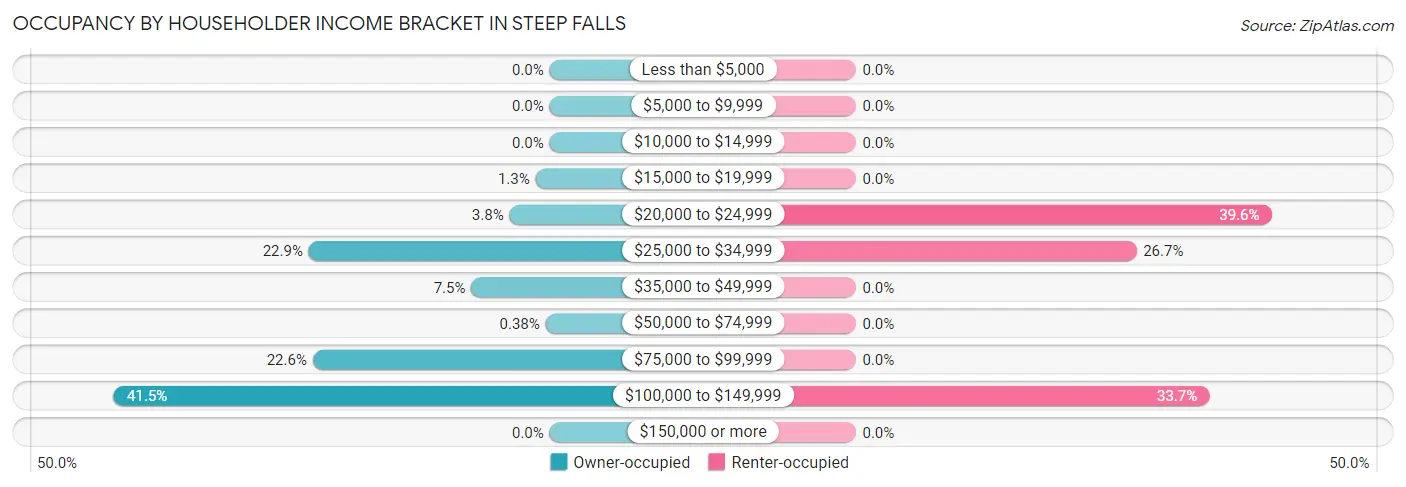
| Income Bracket | Owner-occupied | Renter-occupied |
| Less than $5,000 | 0 (0.0%) | 0 (0.0%) |
| $5,000 to $9,999 | 0 (0.0%) | 0 (0.0%) |
| $10,000 to $14,999 | 0 (0.0%) | 0 (0.0%) |
| $15,000 to $19,999 | 7 (1.3%) | 0 (0.0%) |
| $20,000 to $24,999 | 20 (3.8%) | 40 (39.6%) |
| $25,000 to $34,999 | 120 (22.9%) | 27 (26.7%) |
| $35,000 to $49,999 | 39 (7.5%) | 0 (0.0%) |
| $50,000 to $74,999 | 2 (0.4%) | 0 (0.0%) |
| $75,000 to $99,999 | 118 (22.6%) | 0 (0.0%) |
| $100,000 to $149,999 | 217 (41.5%) | 34 (33.7%) |
| $150,000 or more | 0 (0.0%) | 0 (0.0%) |
| Total | 523 (100.0%) | 101 (100.0%) |
Monthly Housing Cost Tiers in Steep Falls
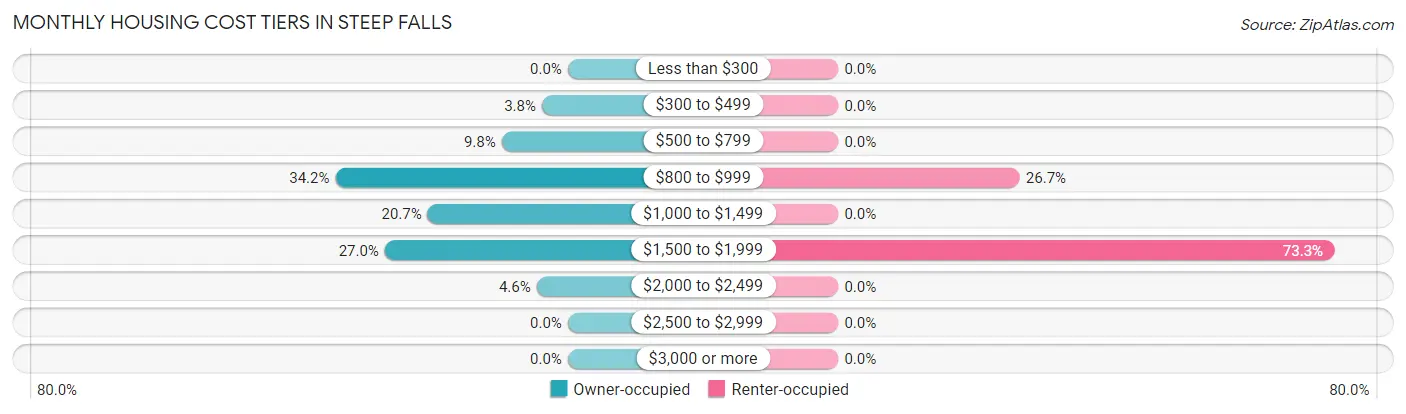
| Monthly Cost | Owner-occupied | Renter-occupied |
| Less than $300 | 0 (0.0%) | 0 (0.0%) |
| $300 to $499 | 20 (3.8%) | 0 (0.0%) |
| $500 to $799 | 51 (9.8%) | 0 (0.0%) |
| $800 to $999 | 179 (34.2%) | 27 (26.7%) |
| $1,000 to $1,499 | 108 (20.6%) | 0 (0.0%) |
| $1,500 to $1,999 | 141 (27.0%) | 74 (73.3%) |
| $2,000 to $2,499 | 24 (4.6%) | 0 (0.0%) |
| $2,500 to $2,999 | 0 (0.0%) | 0 (0.0%) |
| $3,000 or more | 0 (0.0%) | 0 (0.0%) |
| Total | 523 (100.0%) | 101 (100.0%) |
Physical Housing Characteristics in Steep Falls
Housing Structures in Steep Falls
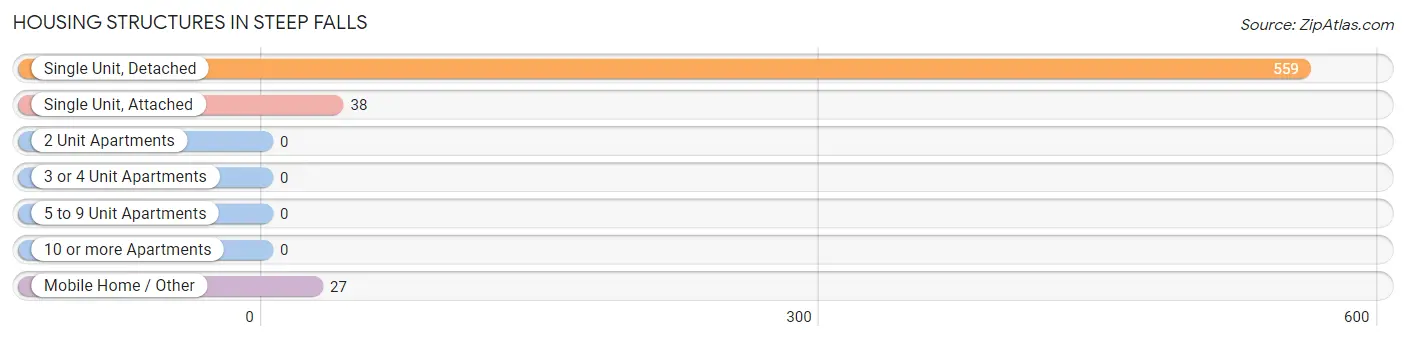
| Structure Type | # Housing Units | % Housing Units |
| Single Unit, Detached | 559 | 89.6% |
| Single Unit, Attached | 38 | 6.1% |
| 2 Unit Apartments | 0 | 0.0% |
| 3 or 4 Unit Apartments | 0 | 0.0% |
| 5 to 9 Unit Apartments | 0 | 0.0% |
| 10 or more Apartments | 0 | 0.0% |
| Mobile Home / Other | 27 | 4.3% |
| Total | 624 | 100.0% |
Housing Structures by Occupancy in Steep Falls
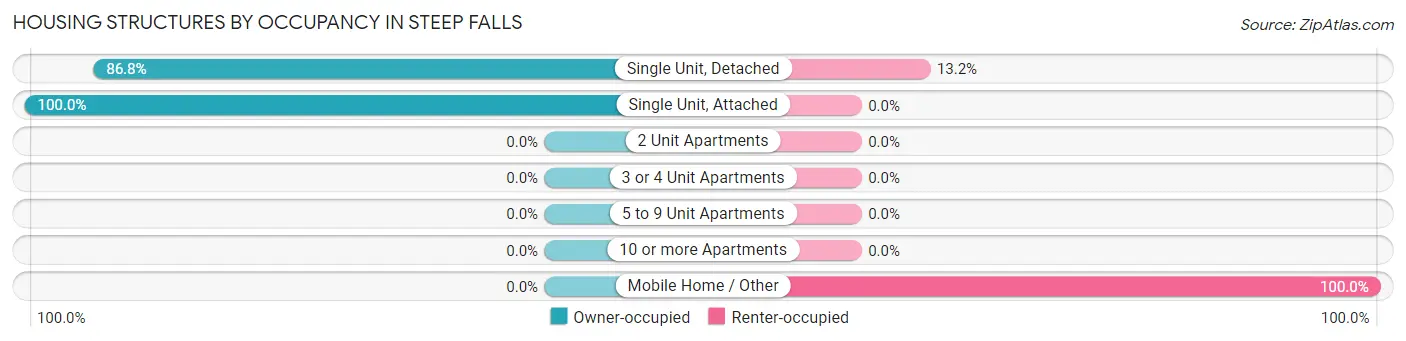
| Structure Type | Owner-occupied | Renter-occupied |
| Single Unit, Detached | 485 (86.8%) | 74 (13.2%) |
| Single Unit, Attached | 38 (100.0%) | 0 (0.0%) |
| 2 Unit Apartments | 0 (0.0%) | 0 (0.0%) |
| 3 or 4 Unit Apartments | 0 (0.0%) | 0 (0.0%) |
| 5 to 9 Unit Apartments | 0 (0.0%) | 0 (0.0%) |
| 10 or more Apartments | 0 (0.0%) | 0 (0.0%) |
| Mobile Home / Other | 0 (0.0%) | 27 (100.0%) |
| Total | 523 (83.8%) | 101 (16.2%) |
Housing Structures by Number of Rooms in Steep Falls
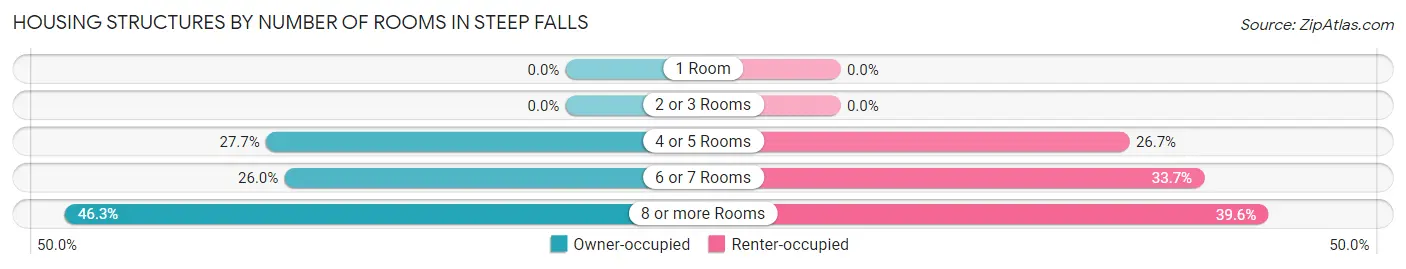
| Number of Rooms | Owner-occupied | Renter-occupied |
| 1 Room | 0 (0.0%) | 0 (0.0%) |
| 2 or 3 Rooms | 0 (0.0%) | 0 (0.0%) |
| 4 or 5 Rooms | 145 (27.7%) | 27 (26.7%) |
| 6 or 7 Rooms | 136 (26.0%) | 34 (33.7%) |
| 8 or more Rooms | 242 (46.3%) | 40 (39.6%) |
| Total | 523 (100.0%) | 101 (100.0%) |
Housing Structure by Heating Type in Steep Falls
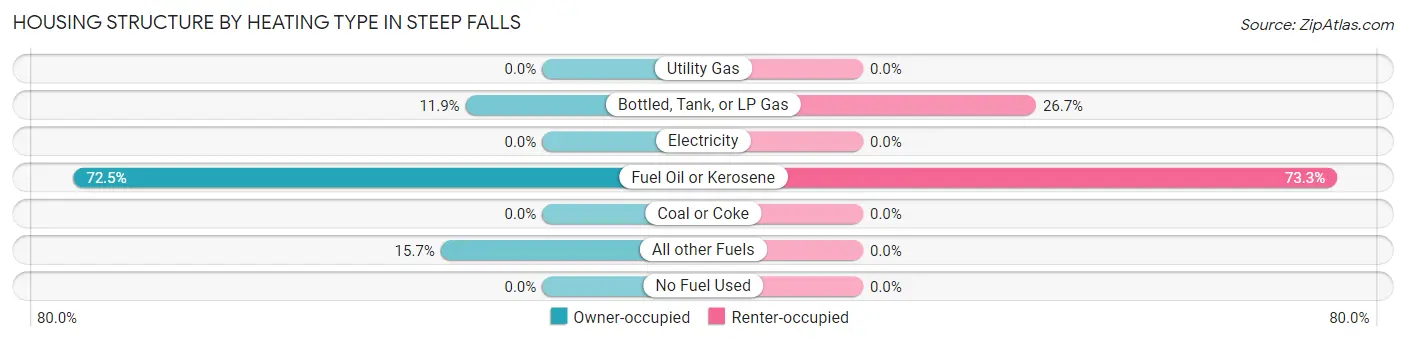
| Heating Type | Owner-occupied | Renter-occupied |
| Utility Gas | 0 (0.0%) | 0 (0.0%) |
| Bottled, Tank, or LP Gas | 62 (11.8%) | 27 (26.7%) |
| Electricity | 0 (0.0%) | 0 (0.0%) |
| Fuel Oil or Kerosene | 379 (72.5%) | 74 (73.3%) |
| Coal or Coke | 0 (0.0%) | 0 (0.0%) |
| All other Fuels | 82 (15.7%) | 0 (0.0%) |
| No Fuel Used | 0 (0.0%) | 0 (0.0%) |
| Total | 523 (100.0%) | 101 (100.0%) |
Household Vehicle Usage in Steep Falls
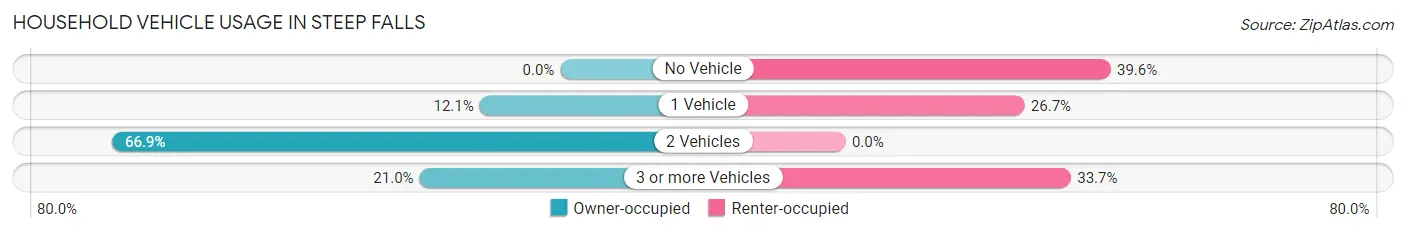
| Vehicles per Household | Owner-occupied | Renter-occupied |
| No Vehicle | 0 (0.0%) | 40 (39.6%) |
| 1 Vehicle | 63 (12.0%) | 27 (26.7%) |
| 2 Vehicles | 350 (66.9%) | 0 (0.0%) |
| 3 or more Vehicles | 110 (21.0%) | 34 (33.7%) |
| Total | 523 (100.0%) | 101 (100.0%) |
Real Estate & Mortgages in Steep Falls
Real Estate and Mortgage Overview in Steep Falls
| Characteristic | Without Mortgage | With Mortgage |
| Housing Units | 146 | 377 |
| Median Property Value | $262,000 | $223,900 |
| Median Household Income | $128,733 | $0 |
| Monthly Housing Costs | $803 | $0 |
| Real Estate Taxes | $3,336 | $0 |
Property Value by Mortgage Status in Steep Falls
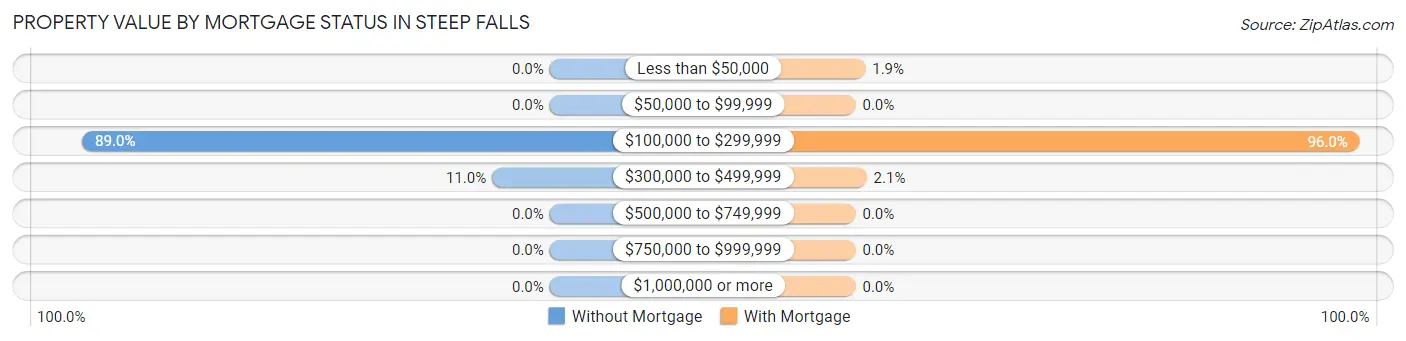
| Property Value | Without Mortgage | With Mortgage |
| Less than $50,000 | 0 (0.0%) | 7 (1.9%) |
| $50,000 to $99,999 | 0 (0.0%) | 0 (0.0%) |
| $100,000 to $299,999 | 130 (89.0%) | 362 (96.0%) |
| $300,000 to $499,999 | 16 (11.0%) | 8 (2.1%) |
| $500,000 to $749,999 | 0 (0.0%) | 0 (0.0%) |
| $750,000 to $999,999 | 0 (0.0%) | 0 (0.0%) |
| $1,000,000 or more | 0 (0.0%) | 0 (0.0%) |
| Total | 146 (100.0%) | 377 (100.0%) |
Household Income by Mortgage Status in Steep Falls
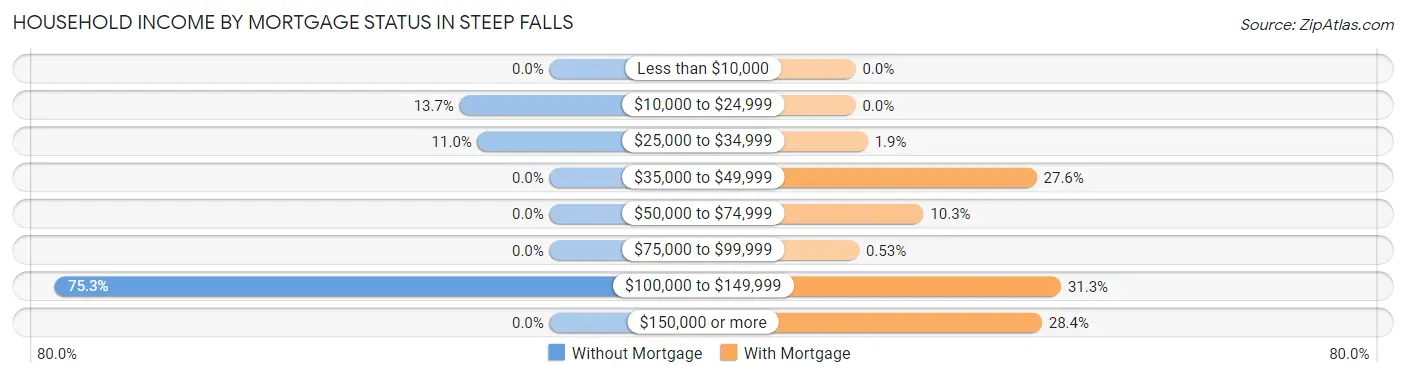
| Household Income | Without Mortgage | With Mortgage |
| Less than $10,000 | 0 (0.0%) | 0 (0.0%) |
| $10,000 to $24,999 | 20 (13.7%) | 0 (0.0%) |
| $25,000 to $34,999 | 16 (11.0%) | 7 (1.9%) |
| $35,000 to $49,999 | 0 (0.0%) | 104 (27.6%) |
| $50,000 to $74,999 | 0 (0.0%) | 39 (10.3%) |
| $75,000 to $99,999 | 0 (0.0%) | 2 (0.5%) |
| $100,000 to $149,999 | 110 (75.3%) | 118 (31.3%) |
| $150,000 or more | 0 (0.0%) | 107 (28.4%) |
| Total | 146 (100.0%) | 377 (100.0%) |
Property Value to Household Income Ratio in Steep Falls
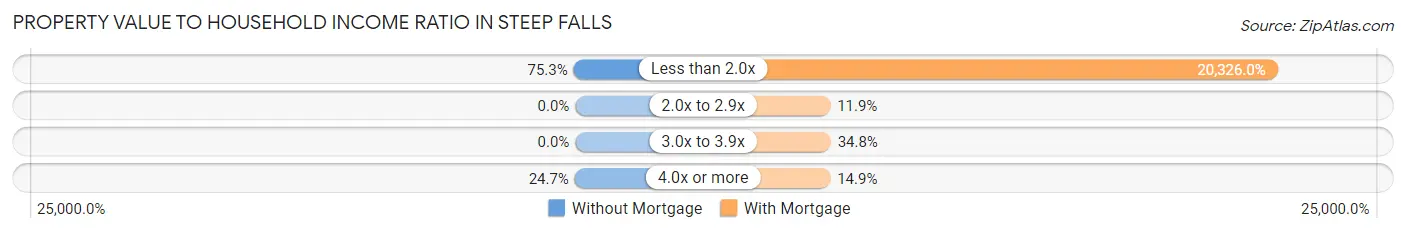
| Value-to-Income Ratio | Without Mortgage | With Mortgage |
| Less than 2.0x | 110 (75.3%) | 76,629 (20,326.0%) |
| 2.0x to 2.9x | 0 (0.0%) | 45 (11.9%) |
| 3.0x to 3.9x | 0 (0.0%) | 131 (34.7%) |
| 4.0x or more | 36 (24.7%) | 56 (14.8%) |
| Total | 146 (100.0%) | 377 (100.0%) |
Real Estate Taxes by Mortgage Status in Steep Falls
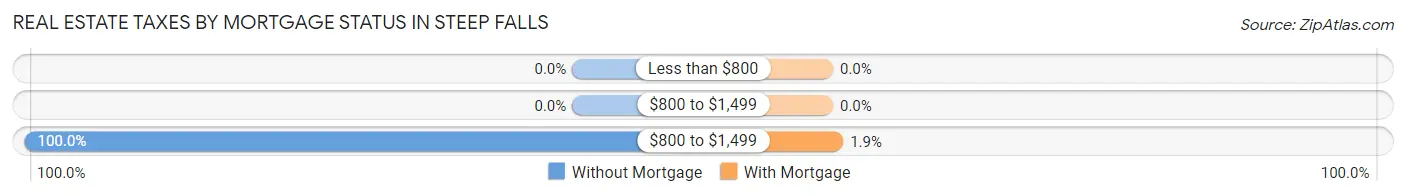
| Property Taxes | Without Mortgage | With Mortgage |
| Less than $800 | 0 (0.0%) | 0 (0.0%) |
| $800 to $1,499 | 0 (0.0%) | 0 (0.0%) |
| $800 to $1,499 | 146 (100.0%) | 7 (1.9%) |
| Total | 146 (100.0%) | 377 (100.0%) |
Health & Disability in Steep Falls
Health Insurance Coverage by Age in Steep Falls
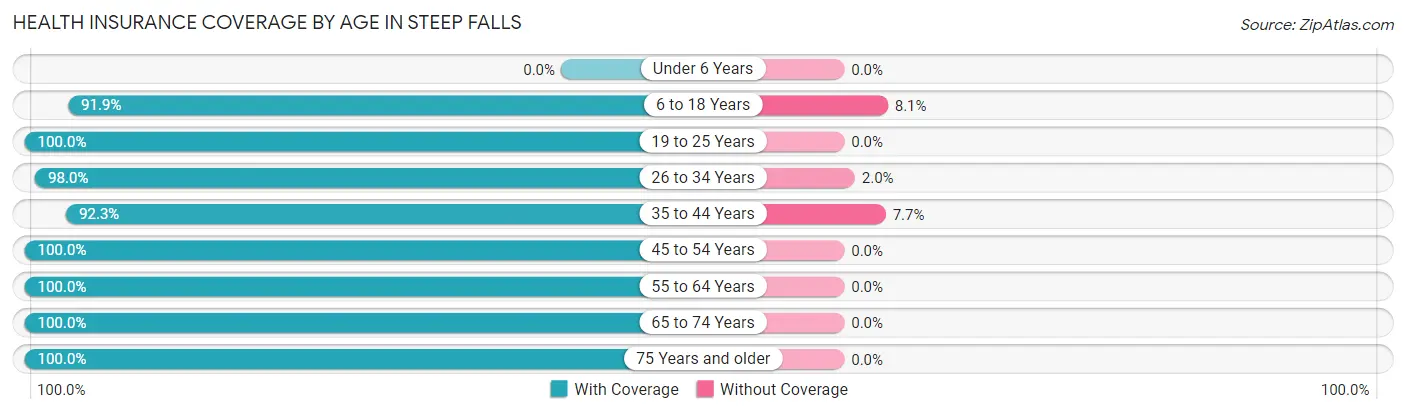
| Age Bracket | With Coverage | Without Coverage |
| Under 6 Years | 0 (0.0%) | 0 (0.0%) |
| 6 to 18 Years | 657 (91.9%) | 58 (8.1%) |
| 19 to 25 Years | 93 (100.0%) | 0 (0.0%) |
| 26 to 34 Years | 100 (98.0%) | 2 (2.0%) |
| 35 to 44 Years | 287 (92.3%) | 24 (7.7%) |
| 45 to 54 Years | 370 (100.0%) | 0 (0.0%) |
| 55 to 64 Years | 340 (100.0%) | 0 (0.0%) |
| 65 to 74 Years | 139 (100.0%) | 0 (0.0%) |
| 75 Years and older | 17 (100.0%) | 0 (0.0%) |
| Total | 2,003 (96.0%) | 84 (4.0%) |
Health Insurance Coverage by Citizenship Status in Steep Falls
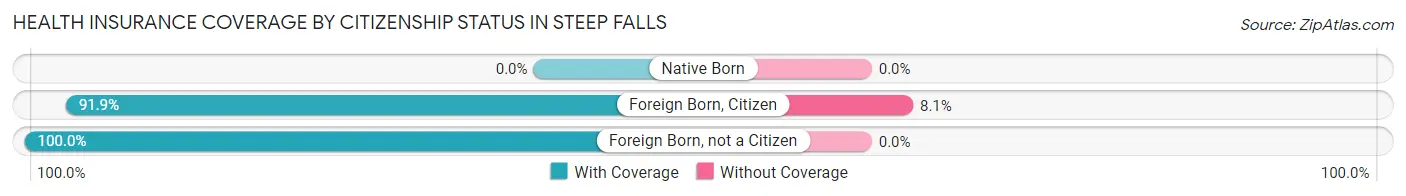
| Citizenship Status | With Coverage | Without Coverage |
| Native Born | 0 (0.0%) | 0 (0.0%) |
| Foreign Born, Citizen | 657 (91.9%) | 58 (8.1%) |
| Foreign Born, not a Citizen | 93 (100.0%) | 0 (0.0%) |
Health Insurance Coverage by Household Income in Steep Falls
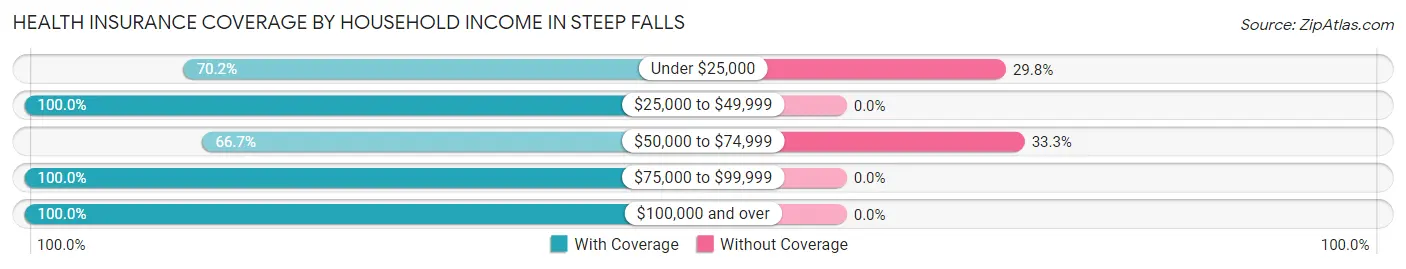
| Household Income | With Coverage | Without Coverage |
| Under $25,000 | 193 (70.2%) | 82 (29.8%) |
| $25,000 to $49,999 | 515 (100.0%) | 0 (0.0%) |
| $50,000 to $74,999 | 4 (66.7%) | 2 (33.3%) |
| $75,000 to $99,999 | 270 (100.0%) | 0 (0.0%) |
| $100,000 and over | 1,013 (100.0%) | 0 (0.0%) |
Public vs Private Health Insurance Coverage by Age in Steep Falls
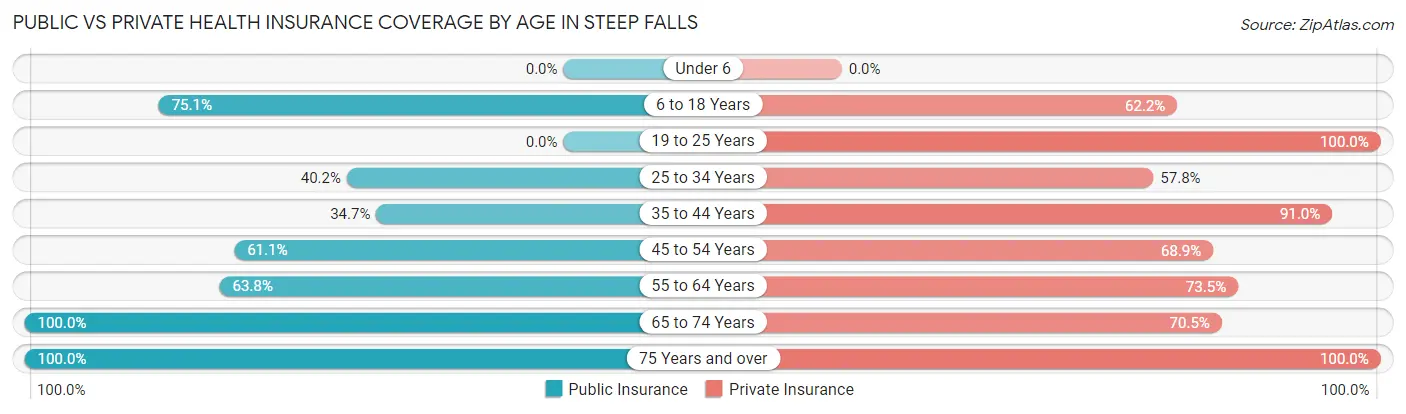
| Age Bracket | Public Insurance | Private Insurance |
| Under 6 | 0 (0.0%) | 0 (0.0%) |
| 6 to 18 Years | 537 (75.1%) | 445 (62.2%) |
| 19 to 25 Years | 0 (0.0%) | 93 (100.0%) |
| 25 to 34 Years | 41 (40.2%) | 59 (57.8%) |
| 35 to 44 Years | 108 (34.7%) | 283 (91.0%) |
| 45 to 54 Years | 226 (61.1%) | 255 (68.9%) |
| 55 to 64 Years | 217 (63.8%) | 250 (73.5%) |
| 65 to 74 Years | 139 (100.0%) | 98 (70.5%) |
| 75 Years and over | 17 (100.0%) | 17 (100.0%) |
| Total | 1,285 (61.6%) | 1,500 (71.9%) |
Disability Status by Sex by Age in Steep Falls
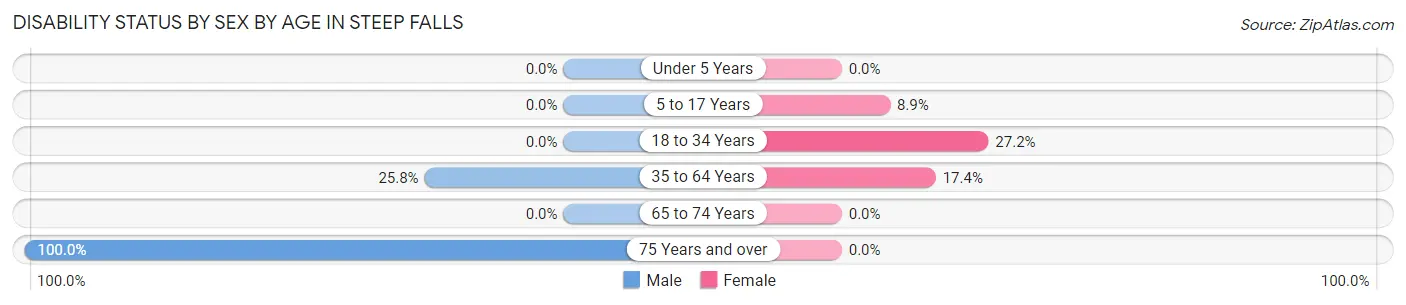
| Age Bracket | Male | Female |
| Under 5 Years | 0 (0.0%) | 0 (0.0%) |
| 5 to 17 Years | 0 (0.0%) | 39 (8.9%) |
| 18 to 34 Years | 0 (0.0%) | 40 (27.2%) |
| 35 to 64 Years | 108 (25.8%) | 105 (17.4%) |
| 65 to 74 Years | 0 (0.0%) | 0 (0.0%) |
| 75 Years and over | 1 (100.0%) | 0 (0.0%) |
Disability Class by Sex by Age in Steep Falls
Disability Class: Hearing Difficulty
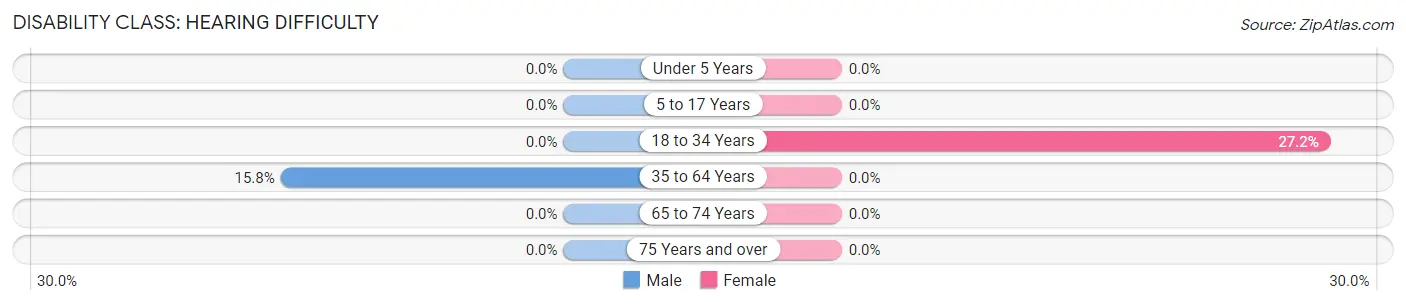
| Age Bracket | Male | Female |
| Under 5 Years | 0 (0.0%) | 0 (0.0%) |
| 5 to 17 Years | 0 (0.0%) | 0 (0.0%) |
| 18 to 34 Years | 0 (0.0%) | 40 (27.2%) |
| 35 to 64 Years | 66 (15.8%) | 0 (0.0%) |
| 65 to 74 Years | 0 (0.0%) | 0 (0.0%) |
| 75 Years and over | 0 (0.0%) | 0 (0.0%) |
Disability Class: Vision Difficulty
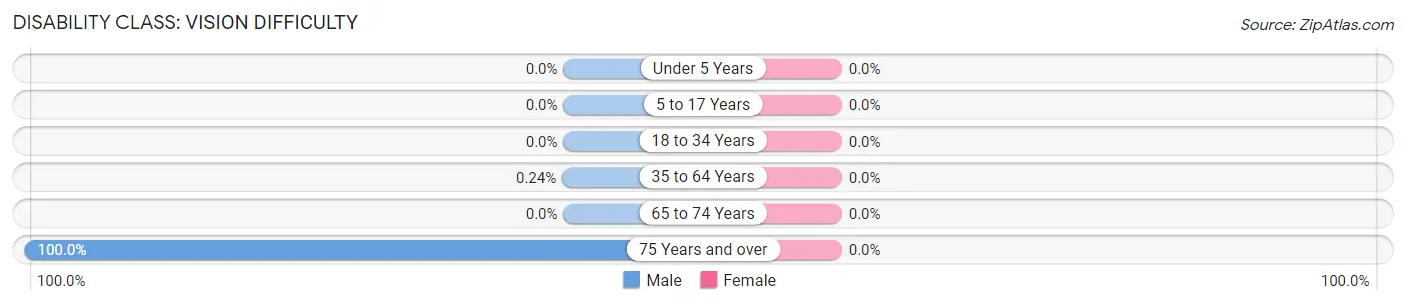
| Age Bracket | Male | Female |
| Under 5 Years | 0 (0.0%) | 0 (0.0%) |
| 5 to 17 Years | 0 (0.0%) | 0 (0.0%) |
| 18 to 34 Years | 0 (0.0%) | 0 (0.0%) |
| 35 to 64 Years | 1 (0.2%) | 0 (0.0%) |
| 65 to 74 Years | 0 (0.0%) | 0 (0.0%) |
| 75 Years and over | 1 (100.0%) | 0 (0.0%) |
Disability Class: Cognitive Difficulty
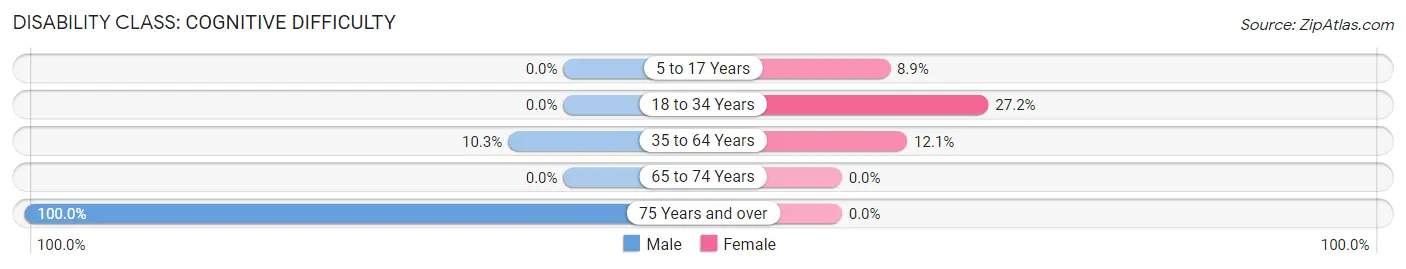
| Age Bracket | Male | Female |
| 5 to 17 Years | 0 (0.0%) | 39 (8.9%) |
| 18 to 34 Years | 0 (0.0%) | 40 (27.2%) |
| 35 to 64 Years | 43 (10.3%) | 73 (12.1%) |
| 65 to 74 Years | 0 (0.0%) | 0 (0.0%) |
| 75 Years and over | 1 (100.0%) | 0 (0.0%) |
Disability Class: Ambulatory Difficulty
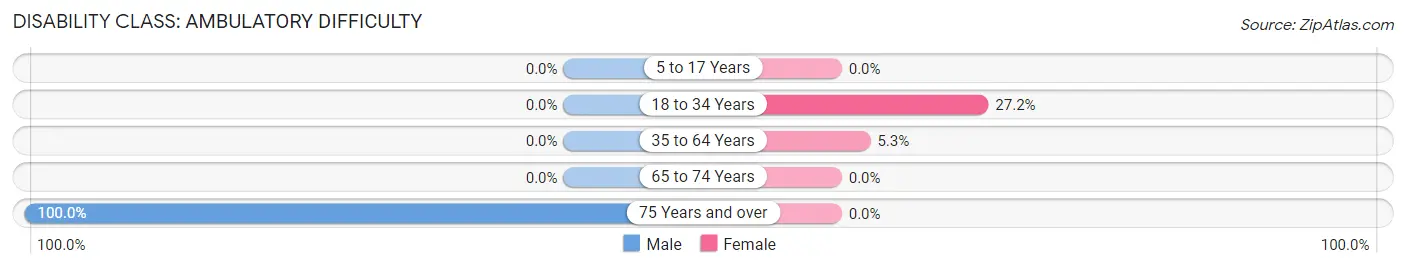
| Age Bracket | Male | Female |
| 5 to 17 Years | 0 (0.0%) | 0 (0.0%) |
| 18 to 34 Years | 0 (0.0%) | 40 (27.2%) |
| 35 to 64 Years | 0 (0.0%) | 32 (5.3%) |
| 65 to 74 Years | 0 (0.0%) | 0 (0.0%) |
| 75 Years and over | 1 (100.0%) | 0 (0.0%) |
Disability Class: Self-Care Difficulty
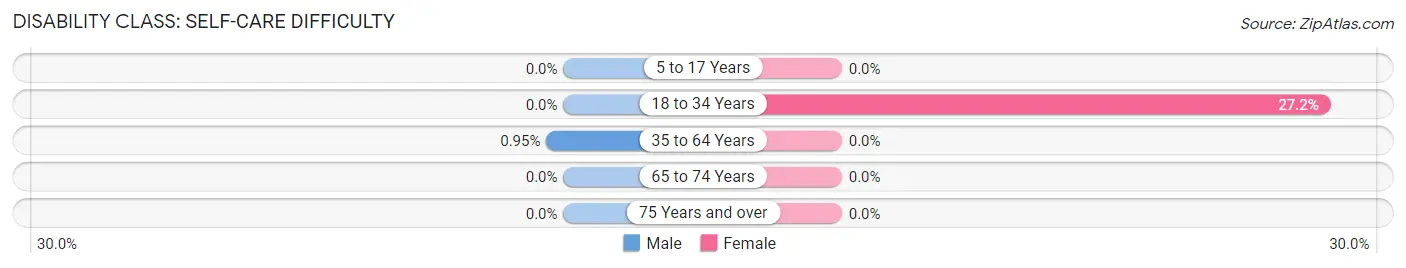
| Age Bracket | Male | Female |
| 5 to 17 Years | 0 (0.0%) | 0 (0.0%) |
| 18 to 34 Years | 0 (0.0%) | 40 (27.2%) |
| 35 to 64 Years | 4 (0.9%) | 0 (0.0%) |
| 65 to 74 Years | 0 (0.0%) | 0 (0.0%) |
| 75 Years and over | 0 (0.0%) | 0 (0.0%) |
Technology Access in Steep Falls
Computing Device Access in Steep Falls
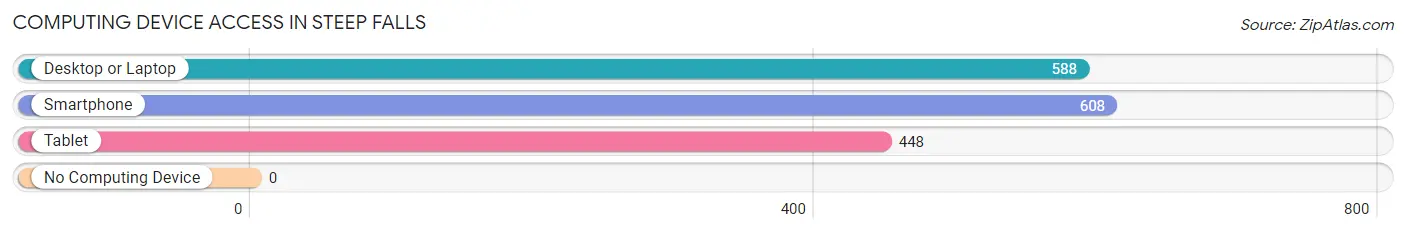
| Device Type | # Households | % Households |
| Desktop or Laptop | 588 | 94.2% |
| Smartphone | 608 | 97.4% |
| Tablet | 448 | 71.8% |
| No Computing Device | 0 | 0.0% |
| Total | 624 | 100.0% |
Internet Access in Steep Falls
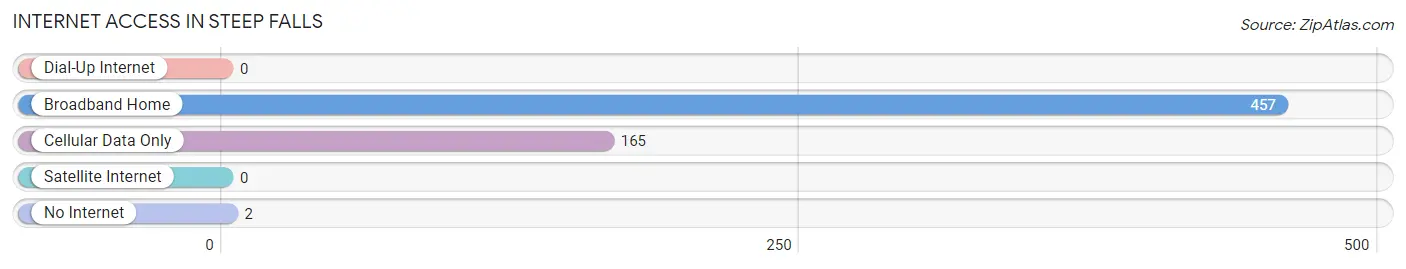
| Internet Type | # Households | % Households |
| Dial-Up Internet | 0 | 0.0% |
| Broadband Home | 457 | 73.2% |
| Cellular Data Only | 165 | 26.4% |
| Satellite Internet | 0 | 0.0% |
| No Internet | 2 | 0.3% |
| Total | 624 | 100.0% |
Steep Falls Summary
Steep Falls is a small town located in the state of Maine, in the United States. It is situated in the southern part of the state, in the county of Cumberland. The town has a population of approximately 1,500 people, and is located about 25 miles northwest of Portland.
History
The area that is now Steep Falls was first settled in the late 1700s by a group of settlers from Massachusetts. The town was originally known as “Falls Village”, and was incorporated in 1820. The name was changed to Steep Falls in 1845, in reference to the steep falls of the Saco River, which runs through the town.
The town was primarily an agricultural community for much of its history, with the main crops being potatoes, corn, and hay. In the late 1800s, the town began to develop a small manufacturing industry, with several small mills being built along the Saco River. These mills produced a variety of products, including lumber, paper, and textiles.
Geography
Steep Falls is located in the southern part of Maine, in the county of Cumberland. The town is situated on the Saco River, and is surrounded by several small lakes and ponds. The town is located about 25 miles northwest of Portland, and is about an hour’s drive from the Atlantic Ocean.
The town has a total area of 8.3 square miles, of which 8.2 square miles is land and 0.1 square miles is water. The town is located in a hilly region, with several steep hills and valleys. The highest point in the town is located at an elevation of 890 feet.
Economy
The economy of Steep Falls is primarily based on agriculture and tourism. The town is home to several small farms, which produce a variety of crops, including potatoes, corn, and hay. The town also has several small businesses, including restaurants, shops, and a few small manufacturing companies.
The town is also a popular tourist destination, with several attractions, including the Saco River, several small lakes and ponds, and several hiking trails. The town also has several small bed and breakfasts, as well as a few small hotels.
Demographics
As of the 2010 census, the population of Steep Falls was 1,500 people. The racial makeup of the town was 97.3% White, 0.7% African American, 0.3% Native American, 0.3% Asian, and 1.3% from other races. The median household income in the town was $45,000, and the median family income was $50,000.
The town has a relatively low crime rate, with only a few minor incidents reported each year. The town is served by the Cumberland County Sheriff’s Office, and the town has its own volunteer fire department. The town also has its own public school system, with two elementary schools and one high school.
Common Questions
What is Per Capita Income in Steep Falls?
Per Capita income in Steep Falls is $24,981.
What is the Median Family Income in Steep Falls?
Median Family Income in Steep Falls is $76,319.
What is the Median Household income in Steep Falls?
Median Household Income in Steep Falls is $85,040.
What is Income or Wage Gap in Steep Falls?
Income or Wage Gap in Steep Falls is 40.9%.
Women in Steep Falls earn 59.1 cents for every dollar earned by a man.
What is Inequality or Gini Index in Steep Falls?
Inequality or Gini Index in Steep Falls is 0.32.
What is the Total Population of Steep Falls?
Total Population of Steep Falls is 2,087.
What is the Total Male Population of Steep Falls?
Total Male Population of Steep Falls is 858.
What is the Total Female Population of Steep Falls?
Total Female Population of Steep Falls is 1,229.
What is the Ratio of Males per 100 Females in Steep Falls?
There are 69.81 Males per 100 Females in Steep Falls.
What is the Ratio of Females per 100 Males in Steep Falls?
There are 143.24 Females per 100 Males in Steep Falls.
What is the Median Population Age in Steep Falls?
Median Population Age in Steep Falls is 39.6 Years.
What is the Average Family Size in Steep Falls
Average Family Size in Steep Falls is 3.5 People.
What is the Average Household Size in Steep Falls
Average Household Size in Steep Falls is 3.3 People.
How Large is the Labor Force in Steep Falls?
There are 873 People in the Labor Forcein in Steep Falls.
What is the Percentage of People in the Labor Force in Steep Falls?
55.1% of People are in the Labor Force in Steep Falls.