Lone Elm, KS Map & Demographics
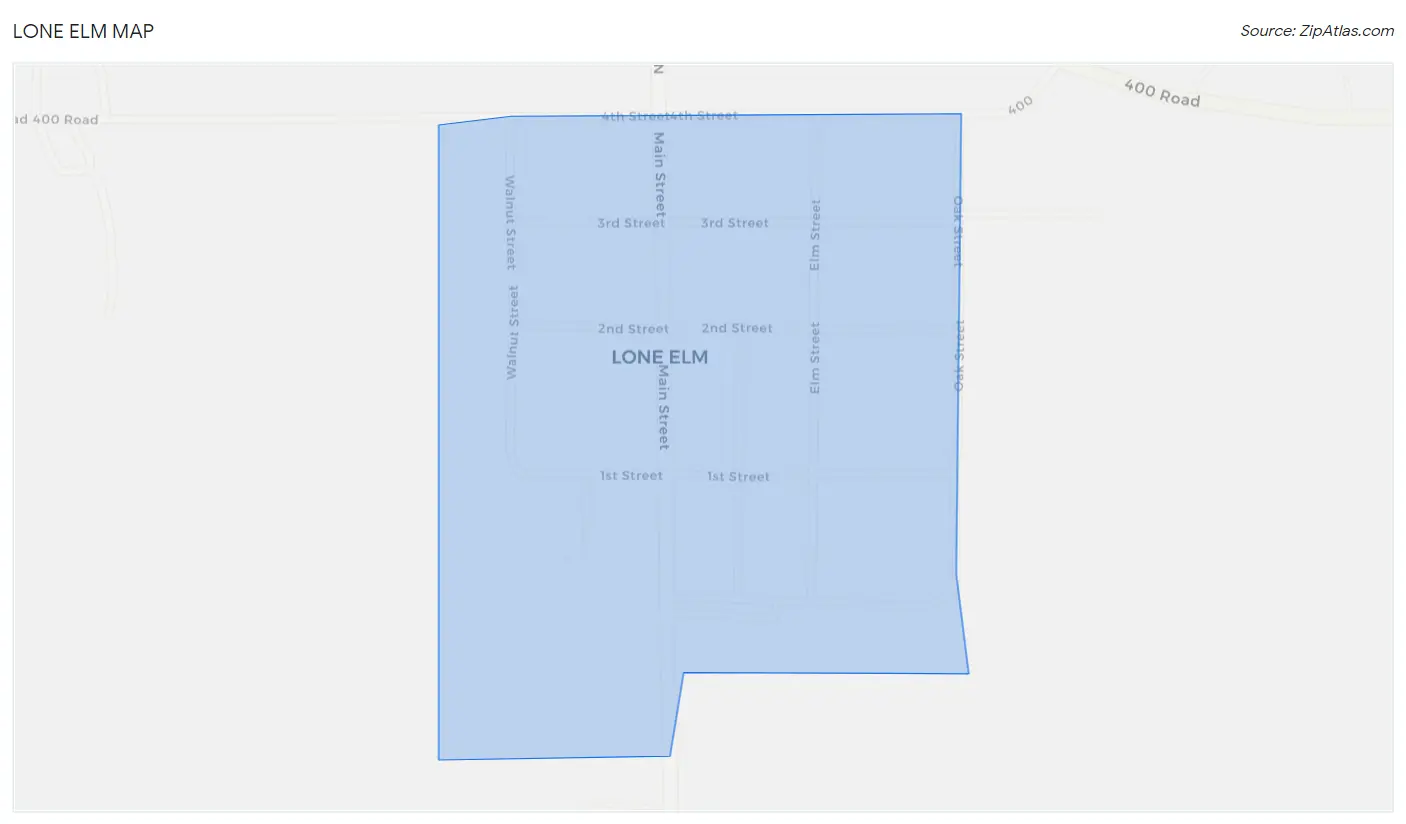
Lone Elm Map
Lone Elm Overview
$30,486
PER CAPITA INCOME
$54,097
AVG FAMILY INCOME
$53,958
AVG HOUSEHOLD INCOME
88.2%
WAGE / INCOME GAP [ % ]
11.8¢/ $1
WAGE / INCOME GAP [ $ ]
0.21
INEQUALITY / GINI INDEX
35
TOTAL POPULATION
23
MALE POPULATION
12
FEMALE POPULATION
191.67
MALES / 100 FEMALES
52.17
FEMALES / 100 MALES
80.0
MEDIAN AGE
1.4
AVG FAMILY SIZE
1.4
AVG HOUSEHOLD SIZE
26
LABOR FORCE [ PEOPLE ]
89.7%
PERCENT IN LABOR FORCE
69.2%
UNEMPLOYMENT RATE
Income in Lone Elm
Income Overview in Lone Elm
Per Capita Income in Lone Elm is $30,486, while median incomes of families and households are $54,097 and $53,958 respectively.
| Characteristic | Number | Measure |
| Per Capita Income | 35 | $30,486 |
| Median Family Income | 23 | $54,097 |
| Mean Family Income | 23 | $69,830 |
| Median Household Income | 25 | $53,958 |
| Mean Household Income | 25 | $66,148 |
| Income Deficit | 23 | $0 |
| Wage / Income Gap (%) | 35 | 88.22% |
| Wage / Income Gap ($) | 35 | 11.78¢ per $1 |
| Gini / Inequality Index | 35 | 0.21 |
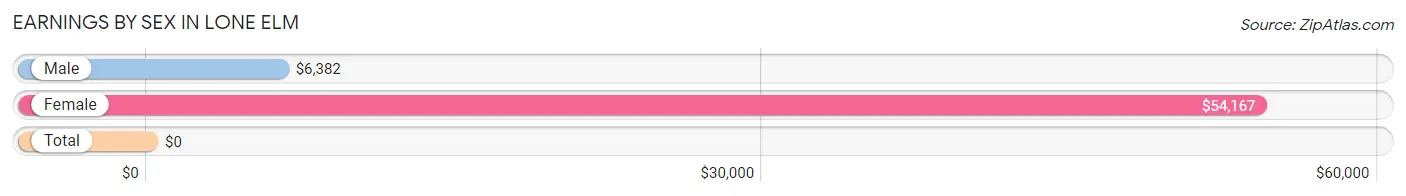
Earnings by Sex in Lone Elm
| Sex | Number | Average Earnings |
| Male | 21 (77.8%) | $6,382 |
| Female | 6 (22.2%) | $54,167 |
| Total | 27 (100.0%) | $0 |
Earnings by Sex by Income Bracket in Lone Elm
The most common earnings brackets in Lone Elm are $5,000 to $7,499 for men (19 | 90.5%) and $50,000 to $54,999 for women (3 | 50.0%).
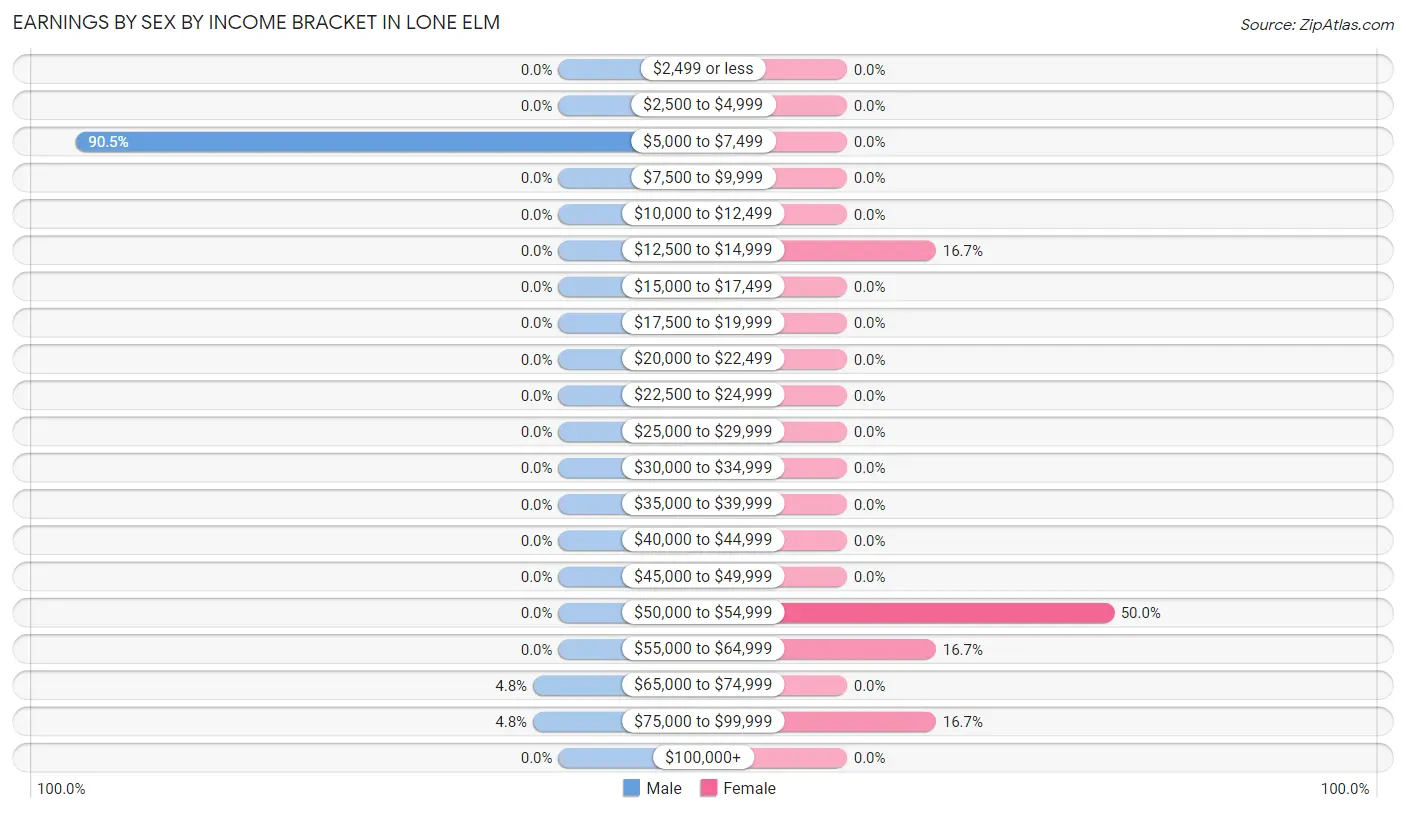
| Income | Male | Female |
| $2,499 or less | 0 (0.0%) | 0 (0.0%) |
| $2,500 to $4,999 | 0 (0.0%) | 0 (0.0%) |
| $5,000 to $7,499 | 19 (90.5%) | 0 (0.0%) |
| $7,500 to $9,999 | 0 (0.0%) | 0 (0.0%) |
| $10,000 to $12,499 | 0 (0.0%) | 0 (0.0%) |
| $12,500 to $14,999 | 0 (0.0%) | 1 (16.7%) |
| $15,000 to $17,499 | 0 (0.0%) | 0 (0.0%) |
| $17,500 to $19,999 | 0 (0.0%) | 0 (0.0%) |
| $20,000 to $22,499 | 0 (0.0%) | 0 (0.0%) |
| $22,500 to $24,999 | 0 (0.0%) | 0 (0.0%) |
| $25,000 to $29,999 | 0 (0.0%) | 0 (0.0%) |
| $30,000 to $34,999 | 0 (0.0%) | 0 (0.0%) |
| $35,000 to $39,999 | 0 (0.0%) | 0 (0.0%) |
| $40,000 to $44,999 | 0 (0.0%) | 0 (0.0%) |
| $45,000 to $49,999 | 0 (0.0%) | 0 (0.0%) |
| $50,000 to $54,999 | 0 (0.0%) | 3 (50.0%) |
| $55,000 to $64,999 | 0 (0.0%) | 1 (16.7%) |
| $65,000 to $74,999 | 1 (4.8%) | 0 (0.0%) |
| $75,000 to $99,999 | 1 (4.8%) | 1 (16.7%) |
| $100,000+ | 0 (0.0%) | 0 (0.0%) |
| Total | 21 (100.0%) | 6 (100.0%) |
Earnings by Sex by Educational Attainment in Lone Elm
| Educational Attainment | Male Income | Female Income |
| Less than High School | - | - |
| High School Diploma | - | - |
| College or Associate's Degree | - | - |
| Bachelor's Degree | - | - |
| Graduate Degree | - | - |
| Total | $6,382 | $54,167 |
Family Income in Lone Elm
Family Income Brackets in Lone Elm
According to the Lone Elm family income data, there are 18 families falling into the $50,000 to $74,999 income range, which is the most common income bracket and makes up 78.3% of all families.
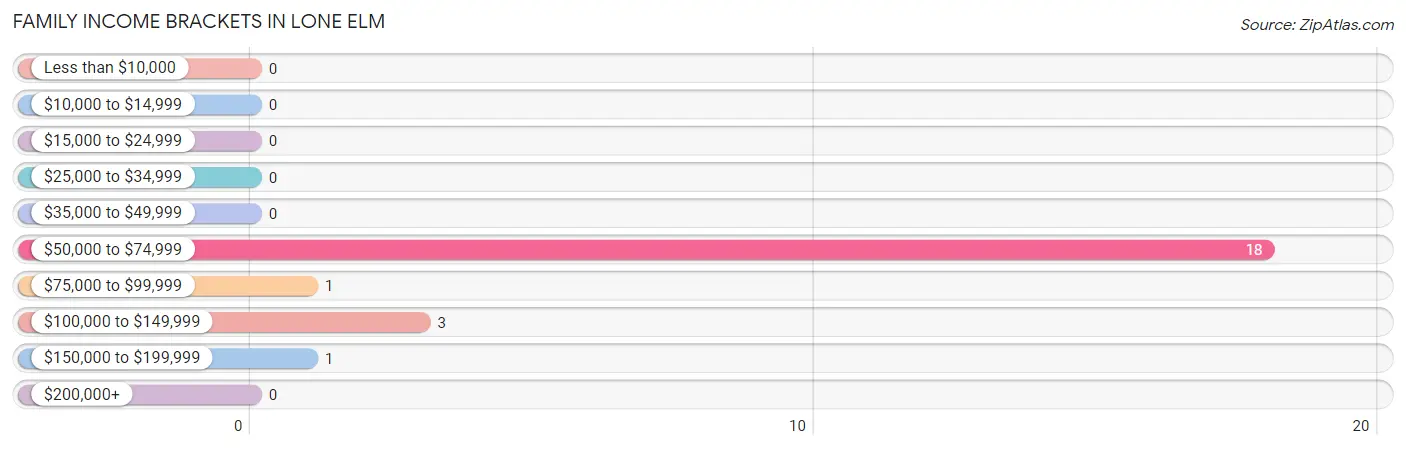
| Income Bracket | # Families | % Families |
| Less than $10,000 | 0 | 0.0% |
| $10,000 to $14,999 | 0 | 0.0% |
| $15,000 to $24,999 | 0 | 0.0% |
| $25,000 to $34,999 | 0 | 0.0% |
| $35,000 to $49,999 | 0 | 0.0% |
| $50,000 to $74,999 | 18 | 78.3% |
| $75,000 to $99,999 | 1 | 4.3% |
| $100,000 to $149,999 | 3 | 13.0% |
| $150,000 to $199,999 | 1 | 4.3% |
| $200,000+ | 0 | 0.0% |
Family Income by Famaliy Size in Lone Elm
2-person families (20 | 87.0%) account for the highest median family income in Lone Elm with $53,889 per family, while 2-person families (20 | 87.0%) have the highest median income of $26,944 per family member.
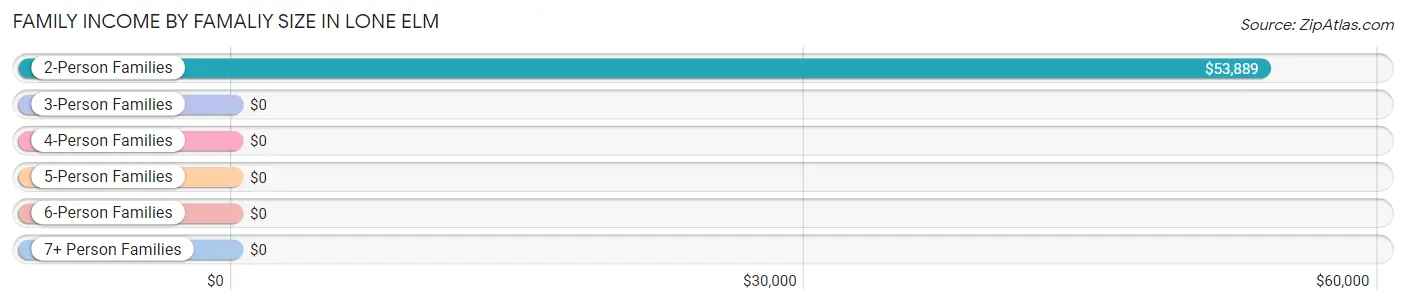
| Income Bracket | # Families | Median Income |
| 2-Person Families | 20 (87.0%) | $53,889 |
| 3-Person Families | 0 (0.0%) | $0 |
| 4-Person Families | 3 (13.0%) | $0 |
| 5-Person Families | 0 (0.0%) | $0 |
| 6-Person Families | 0 (0.0%) | $0 |
| 7+ Person Families | 0 (0.0%) | $0 |
| Total | 23 (100.0%) | $54,097 |
Family Income by Number of Earners in Lone Elm
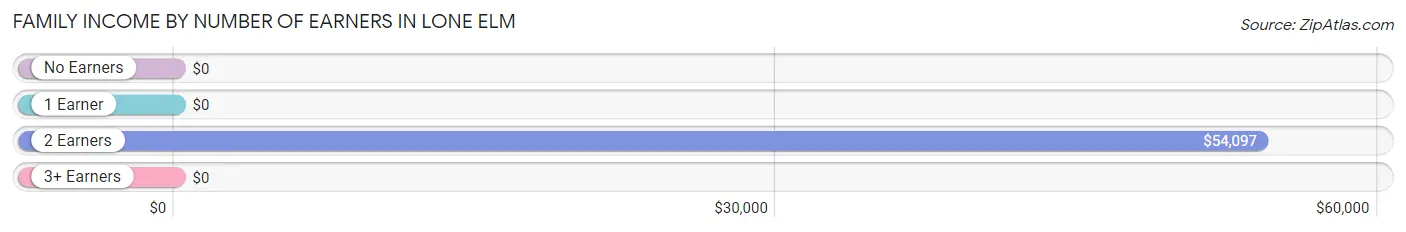
| Number of Earners | # Families | Median Income |
| No Earners | 0 (0.0%) | $0 |
| 1 Earner | 0 (0.0%) | $0 |
| 2 Earners | 23 (100.0%) | $54,097 |
| 3+ Earners | 0 (0.0%) | $0 |
| Total | 23 (100.0%) | $54,097 |
Household Income in Lone Elm
Household Income Brackets in Lone Elm
With 18 households falling in the category, the $50,000 to $74,999 income range is the most frequent in Lone Elm, accounting for 72.0% of all households.
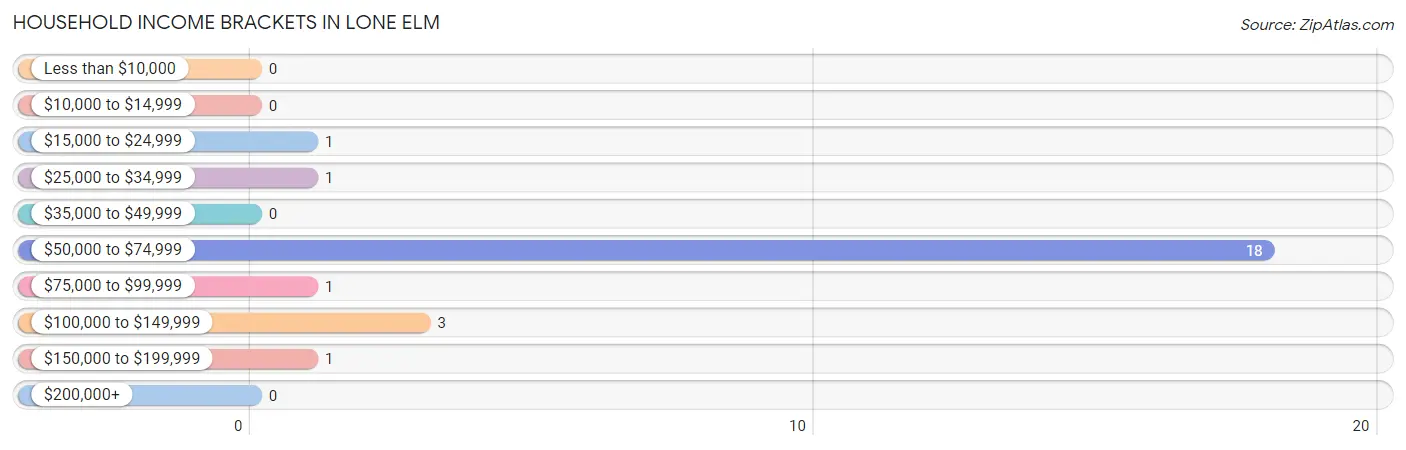
| Income Bracket | # Households | % Households |
| Less than $10,000 | 0 | 0.0% |
| $10,000 to $14,999 | 0 | 0.0% |
| $15,000 to $24,999 | 1 | 4.0% |
| $25,000 to $34,999 | 1 | 4.0% |
| $35,000 to $49,999 | 0 | 0.0% |
| $50,000 to $74,999 | 18 | 72.0% |
| $75,000 to $99,999 | 1 | 4.0% |
| $100,000 to $149,999 | 3 | 12.0% |
| $150,000 to $199,999 | 1 | 4.0% |
| $200,000+ | 0 | 0.0% |
Household Income by Householder Age in Lone Elm
The median household income in Lone Elm is $53,958, with the highest median household income of $53,611 found in the 65+ years age bracket for the primary householder. A total of 20 households (80.0%) fall into this category.
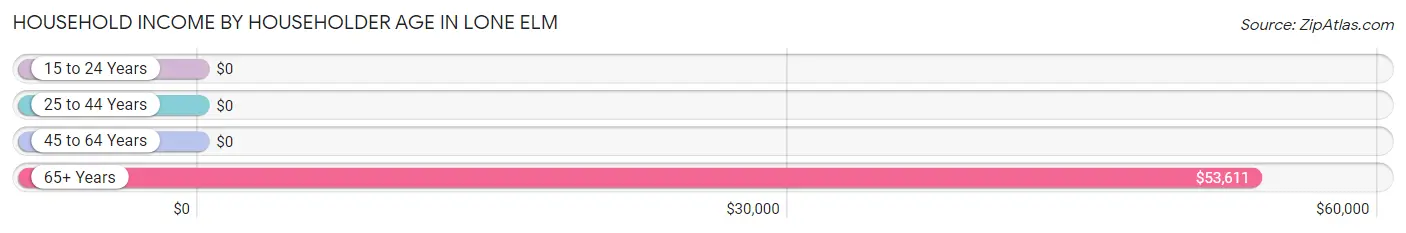
| Income Bracket | # Households | Median Income |
| 15 to 24 Years | 0 (0.0%) | $0 |
| 25 to 44 Years | 3 (12.0%) | $0 |
| 45 to 64 Years | 2 (8.0%) | $0 |
| 65+ Years | 20 (80.0%) | $53,611 |
| Total | 25 (100.0%) | $53,958 |
Poverty in Lone Elm
Income Below Poverty by Sex and Age in Lone Elm
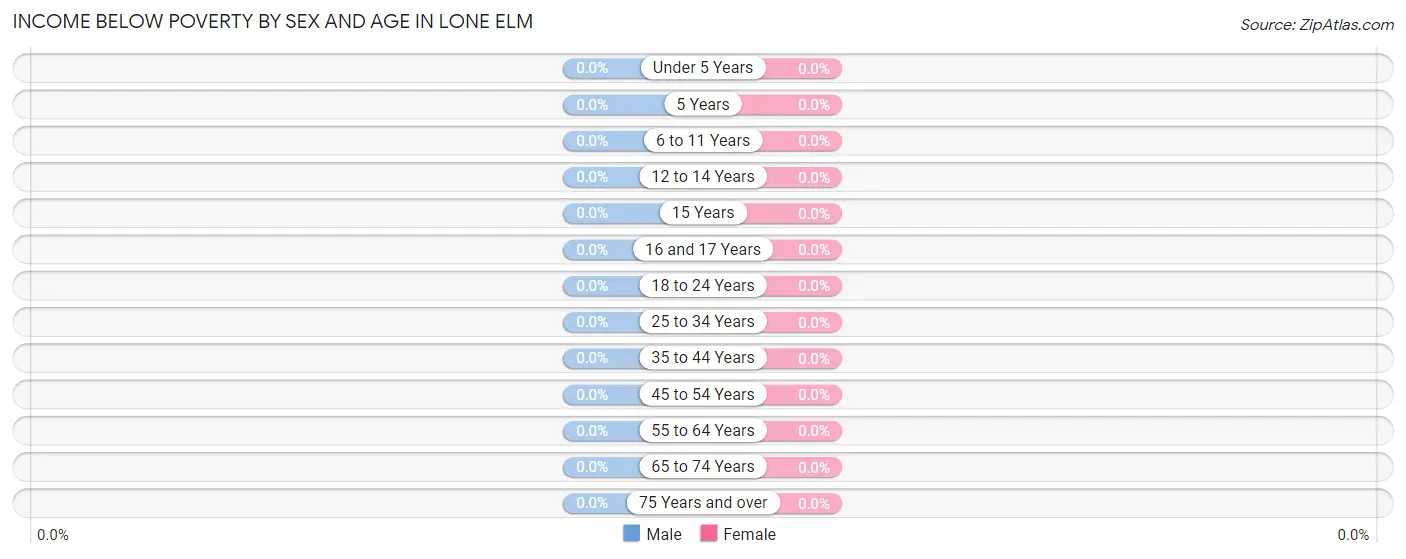
| Age Bracket | Male | Female |
| Under 5 Years | 0 (0.0%) | 0 (0.0%) |
| 5 Years | 0 (0.0%) | 0 (0.0%) |
| 6 to 11 Years | 0 (0.0%) | 0 (0.0%) |
| 12 to 14 Years | 0 (0.0%) | 0 (0.0%) |
| 15 Years | 0 (0.0%) | 0 (0.0%) |
| 16 and 17 Years | 0 (0.0%) | 0 (0.0%) |
| 18 to 24 Years | 0 (0.0%) | 0 (0.0%) |
| 25 to 34 Years | 0 (0.0%) | 0 (0.0%) |
| 35 to 44 Years | 0 (0.0%) | 0 (0.0%) |
| 45 to 54 Years | 0 (0.0%) | 0 (0.0%) |
| 55 to 64 Years | 0 (0.0%) | 0 (0.0%) |
| 65 to 74 Years | 0 (0.0%) | 0 (0.0%) |
| 75 Years and over | 0 (0.0%) | 0 (0.0%) |
| Total | 0 (0.0%) | 0 (0.0%) |
Income Above Poverty by Sex and Age in Lone Elm
According to the poverty statistics in Lone Elm, males aged under 5 years and females aged under 5 years are the age groups that are most secure financially, with 100.0% of males and 100.0% of females in these age groups living above the poverty line.
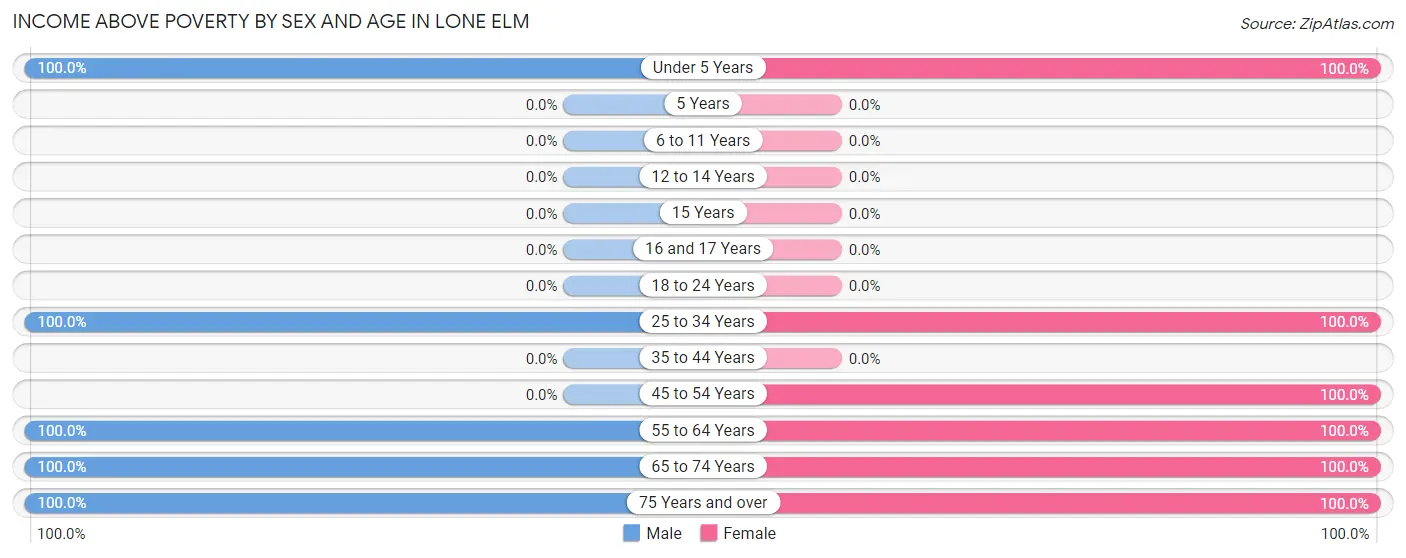
| Age Bracket | Male | Female |
| Under 5 Years | 2 (100.0%) | 4 (100.0%) |
| 5 Years | 0 (0.0%) | 0 (0.0%) |
| 6 to 11 Years | 0 (0.0%) | 0 (0.0%) |
| 12 to 14 Years | 0 (0.0%) | 0 (0.0%) |
| 15 Years | 0 (0.0%) | 0 (0.0%) |
| 16 and 17 Years | 0 (0.0%) | 0 (0.0%) |
| 18 to 24 Years | 0 (0.0%) | 0 (0.0%) |
| 25 to 34 Years | 1 (100.0%) | 3 (100.0%) |
| 35 to 44 Years | 0 (0.0%) | 0 (0.0%) |
| 45 to 54 Years | 0 (0.0%) | 1 (100.0%) |
| 55 to 64 Years | 1 (100.0%) | 1 (100.0%) |
| 65 to 74 Years | 1 (100.0%) | 2 (100.0%) |
| 75 Years and over | 18 (100.0%) | 1 (100.0%) |
| Total | 23 (100.0%) | 12 (100.0%) |
Income Below Poverty Among Married-Couple Families in Lone Elm
| Children | Above Poverty | Below Poverty |
| No Children | 20 (100.0%) | 0 (0.0%) |
| 1 or 2 Children | 3 (100.0%) | 0 (0.0%) |
| 3 or 4 Children | 0 (0.0%) | 0 (0.0%) |
| 5 or more Children | 0 (0.0%) | 0 (0.0%) |
| Total | 23 (100.0%) | 0 (0.0%) |
Income Below Poverty Among Single-Parent Households in Lone Elm
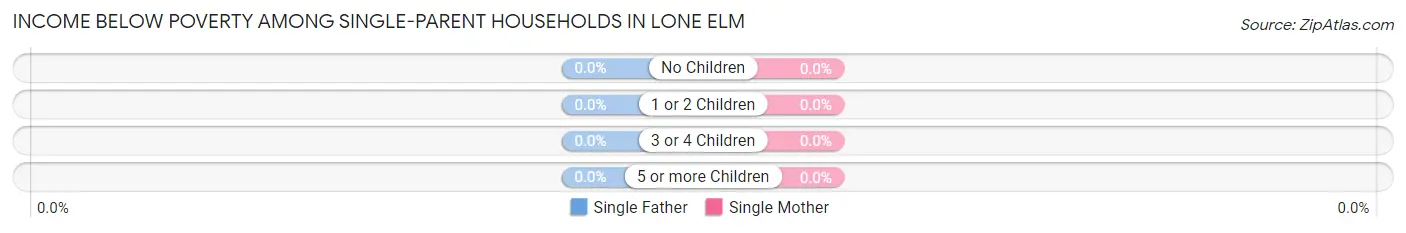
| Children | Single Father | Single Mother |
| No Children | 0 (0.0%) | 0 (0.0%) |
| 1 or 2 Children | 0 (0.0%) | 0 (0.0%) |
| 3 or 4 Children | 0 (0.0%) | 0 (0.0%) |
| 5 or more Children | 0 (0.0%) | 0 (0.0%) |
| Total | 0 (0.0%) | 0 (0.0%) |
Income Below Poverty Among Married-Couple vs Single-Parent Households in Lone Elm
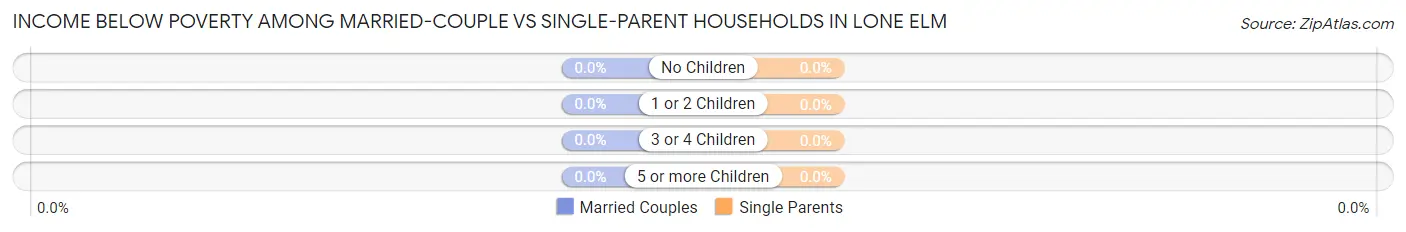
| Children | Married-Couple Families | Single-Parent Households |
| No Children | 0 (0.0%) | 0 (0.0%) |
| 1 or 2 Children | 0 (0.0%) | 0 (0.0%) |
| 3 or 4 Children | 0 (0.0%) | 0 (0.0%) |
| 5 or more Children | 0 (0.0%) | 0 (0.0%) |
| Total | 0 (0.0%) | 0 (0.0%) |
Race in Lone Elm
The most populous races in Lone Elm are White / Caucasian (34 | 97.1%), and Two or more Races (1 | 2.9%).
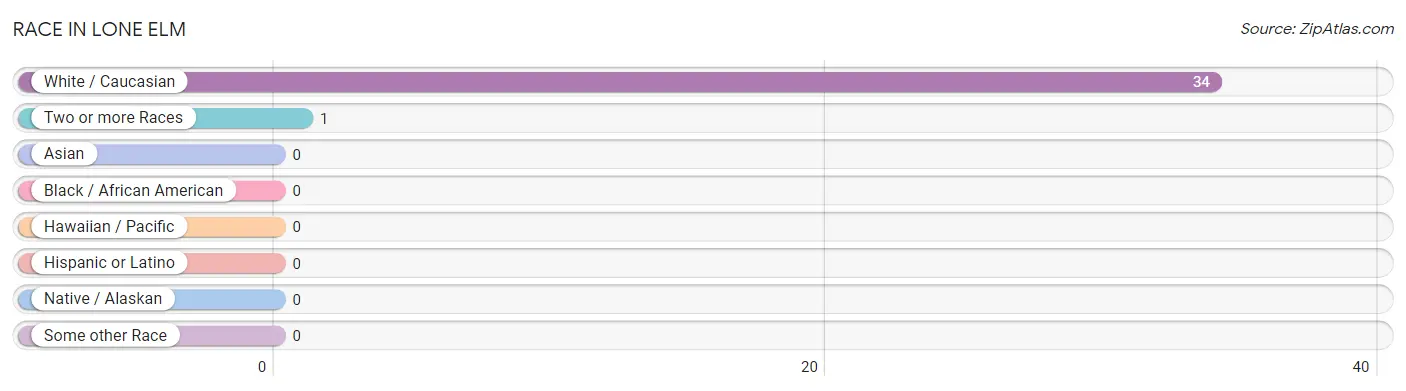
| Race | # Population | % Population |
| Asian | 0 | 0.0% |
| Black / African American | 0 | 0.0% |
| Hawaiian / Pacific | 0 | 0.0% |
| Hispanic or Latino | 0 | 0.0% |
| Native / Alaskan | 0 | 0.0% |
| White / Caucasian | 34 | 97.1% |
| Two or more Races | 1 | 2.9% |
| Some other Race | 0 | 0.0% |
| Total | 35 | 100.0% |
Ancestry in Lone Elm
The most populous ancestries reported in Lone Elm are English (12 | 34.3%), German (5 | 14.3%), Cherokee (1 | 2.9%), Dutch (1 | 2.9%), and Irish (1 | 2.9%), together accounting for 57.2% of all Lone Elm residents.
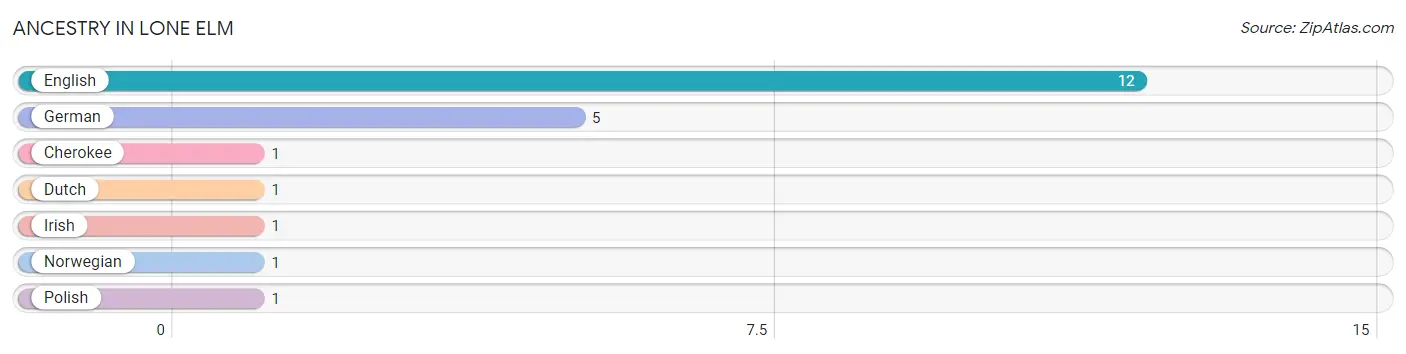
| Ancestry | # Population | % Population |
| Cherokee | 1 | 2.9% |
| Dutch | 1 | 2.9% |
| English | 12 | 34.3% |
| German | 5 | 14.3% |
| Irish | 1 | 2.9% |
| Norwegian | 1 | 2.9% |
| Polish | 1 | 2.9% | View All 7 Rows |
Immigrants in Lone Elm

| Immigration Origin | # Population | % Population | View All 0 Rows |
Sex and Age in Lone Elm
Sex and Age in Lone Elm
The most populous age groups in Lone Elm are 80 to 84 Years (18 | 78.3%) for men and Under 5 Years (4 | 33.3%) for women.
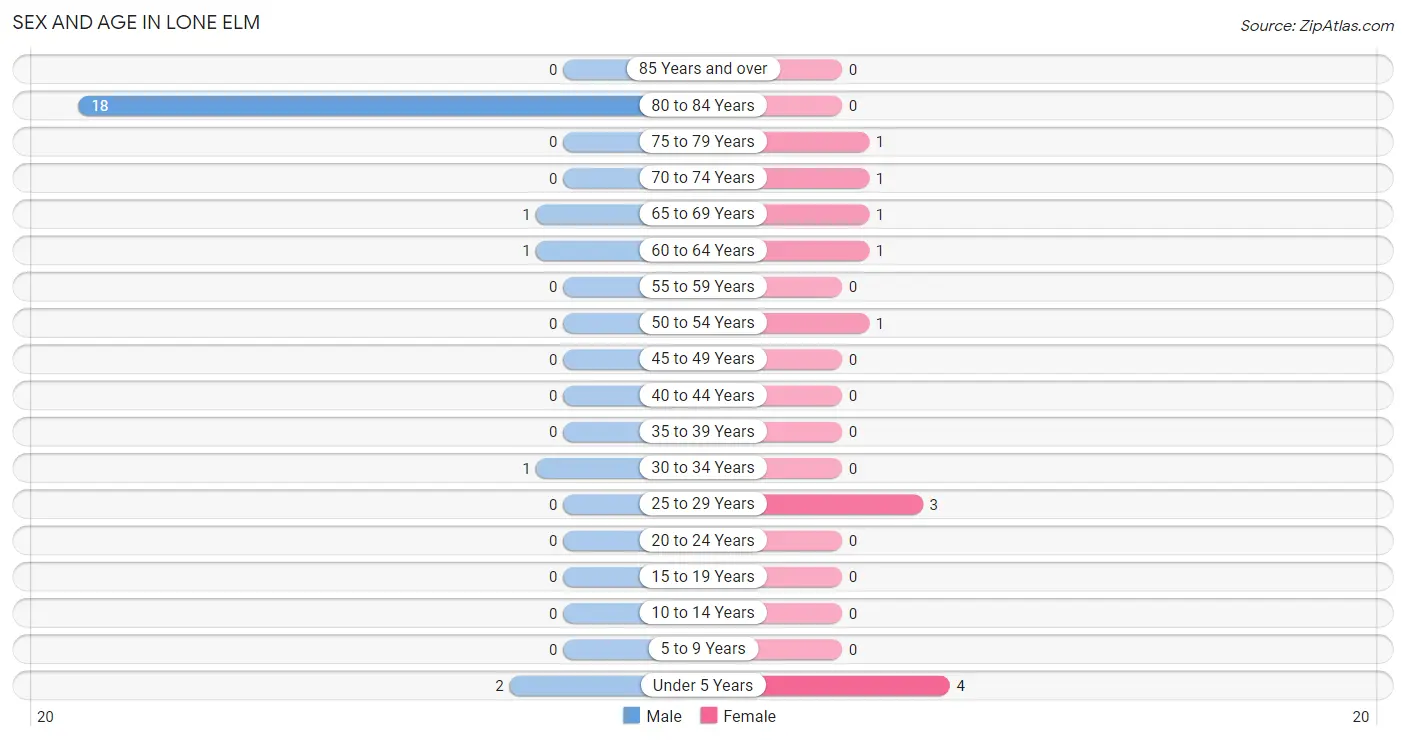
| Age Bracket | Male | Female |
| Under 5 Years | 2 (8.7%) | 4 (33.3%) |
| 5 to 9 Years | 0 (0.0%) | 0 (0.0%) |
| 10 to 14 Years | 0 (0.0%) | 0 (0.0%) |
| 15 to 19 Years | 0 (0.0%) | 0 (0.0%) |
| 20 to 24 Years | 0 (0.0%) | 0 (0.0%) |
| 25 to 29 Years | 0 (0.0%) | 3 (25.0%) |
| 30 to 34 Years | 1 (4.3%) | 0 (0.0%) |
| 35 to 39 Years | 0 (0.0%) | 0 (0.0%) |
| 40 to 44 Years | 0 (0.0%) | 0 (0.0%) |
| 45 to 49 Years | 0 (0.0%) | 0 (0.0%) |
| 50 to 54 Years | 0 (0.0%) | 1 (8.3%) |
| 55 to 59 Years | 0 (0.0%) | 0 (0.0%) |
| 60 to 64 Years | 1 (4.3%) | 1 (8.3%) |
| 65 to 69 Years | 1 (4.3%) | 1 (8.3%) |
| 70 to 74 Years | 0 (0.0%) | 1 (8.3%) |
| 75 to 79 Years | 0 (0.0%) | 1 (8.3%) |
| 80 to 84 Years | 18 (78.3%) | 0 (0.0%) |
| 85 Years and over | 0 (0.0%) | 0 (0.0%) |
| Total | 23 (100.0%) | 12 (100.0%) |
Families and Households in Lone Elm
Median Family Size in Lone Elm
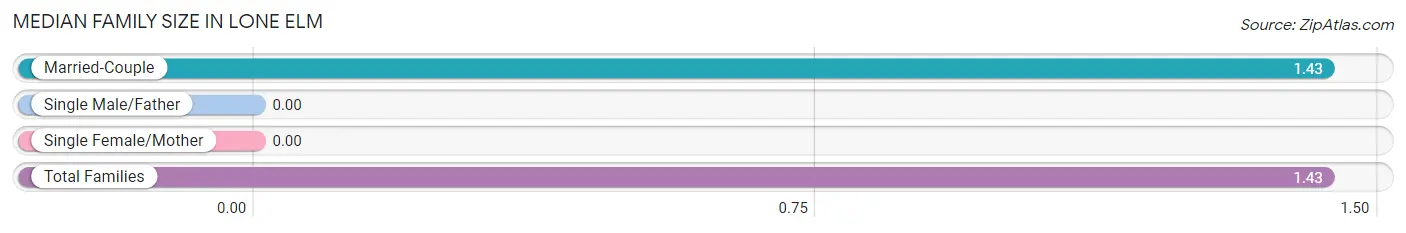
| Family Type | # Families | Family Size |
| Married-Couple | 23 (100.0%) | 1.43 |
| Single Male/Father | 0 (0.0%) | - |
| Single Female/Mother | 0 (0.0%) | - |
| Total Families | 23 (100.0%) | 1.43 |
Median Household Size in Lone Elm
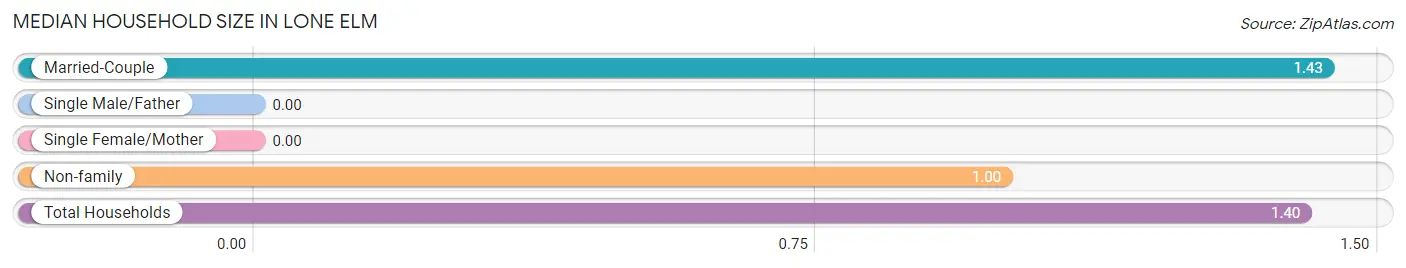
| Household Type | # Households | Household Size |
| Married-Couple | 23 (92.0%) | 1.43 |
| Single Male/Father | 0 (0.0%) | - |
| Single Female/Mother | 0 (0.0%) | - |
| Non-family | 2 (8.0%) | 1.00 |
| Total Households | 25 (100.0%) | 1.40 |
Household Size by Marriage Status in Lone Elm
Out of a total of 25 households in Lone Elm, 23 (92.0%) are family households, while 2 (8.0%) are nonfamily households. The most numerous type of family households are 2-person households, comprising 20, and the most common type of nonfamily households are 1-person households, comprising 2.
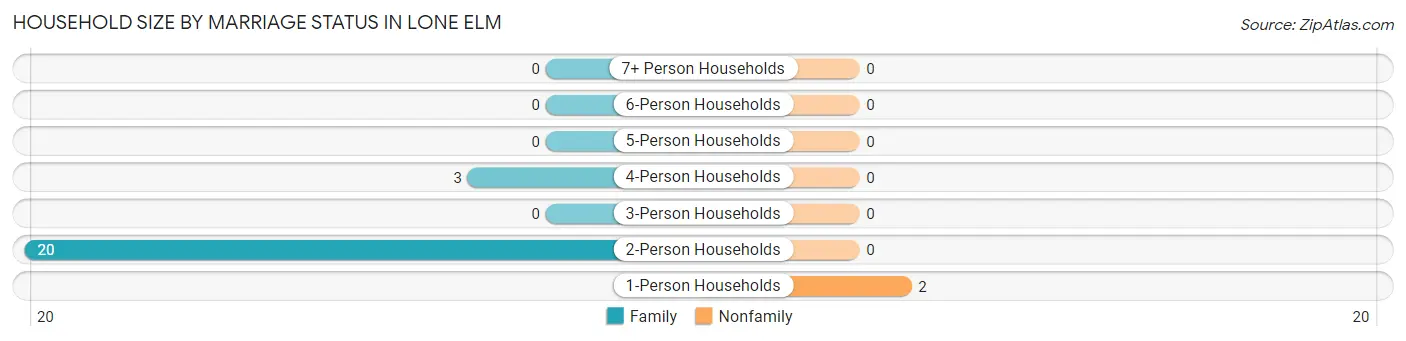
| Household Size | Family Households | Nonfamily Households |
| 1-Person Households | - | 2 (8.0%) |
| 2-Person Households | 20 (80.0%) | 0 (0.0%) |
| 3-Person Households | 0 (0.0%) | 0 (0.0%) |
| 4-Person Households | 3 (12.0%) | 0 (0.0%) |
| 5-Person Households | 0 (0.0%) | 0 (0.0%) |
| 6-Person Households | 0 (0.0%) | 0 (0.0%) |
| 7+ Person Households | 0 (0.0%) | 0 (0.0%) |
| Total | 23 (92.0%) | 2 (8.0%) |
Female Fertility in Lone Elm
Fertility by Age in Lone Elm
Average fertility rate in Lone Elm is 1,000.0 births per 1,000 women. Women in the age bracket of 20 to 34 years have the highest fertility rate with 1,000.0 births per 1,000 women. Women in the age bracket of 20 to 34 years acount for 100.0% of all women with births.
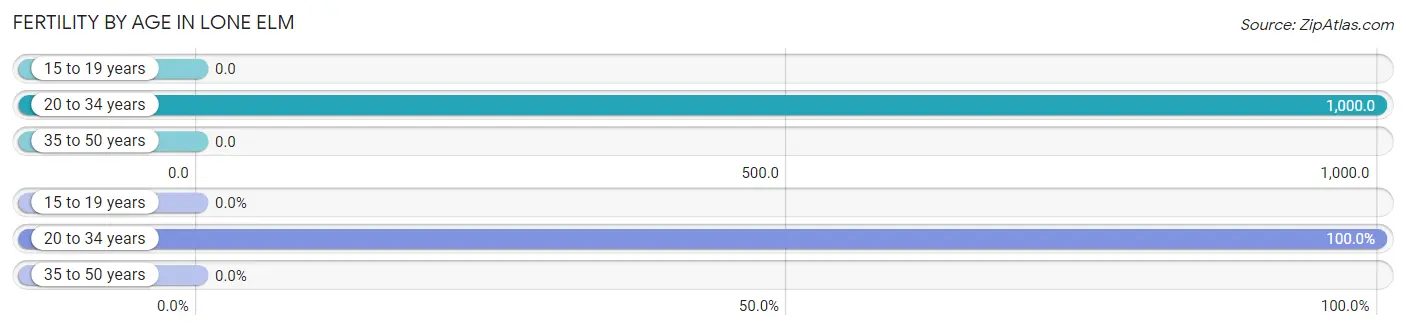
| Age Bracket | Women with Births | Births / 1,000 Women |
| 15 to 19 years | 0 (0.0%) | 0.0 |
| 20 to 34 years | 3 (100.0%) | 1,000.0 |
| 35 to 50 years | 0 (0.0%) | 0.0 |
| Total | 3 (100.0%) | 1,000.0 |
Fertility by Age by Marriage Status in Lone Elm
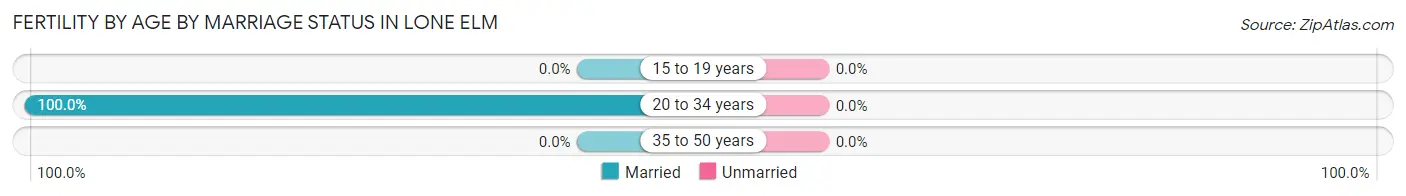
| Age Bracket | Married | Unmarried |
| 15 to 19 years | 0 (0.0%) | 0 (0.0%) |
| 20 to 34 years | 3 (100.0%) | 0 (0.0%) |
| 35 to 50 years | 0 (0.0%) | 0 (0.0%) |
| Total | 3 (100.0%) | 0 (0.0%) |
Fertility by Education in Lone Elm
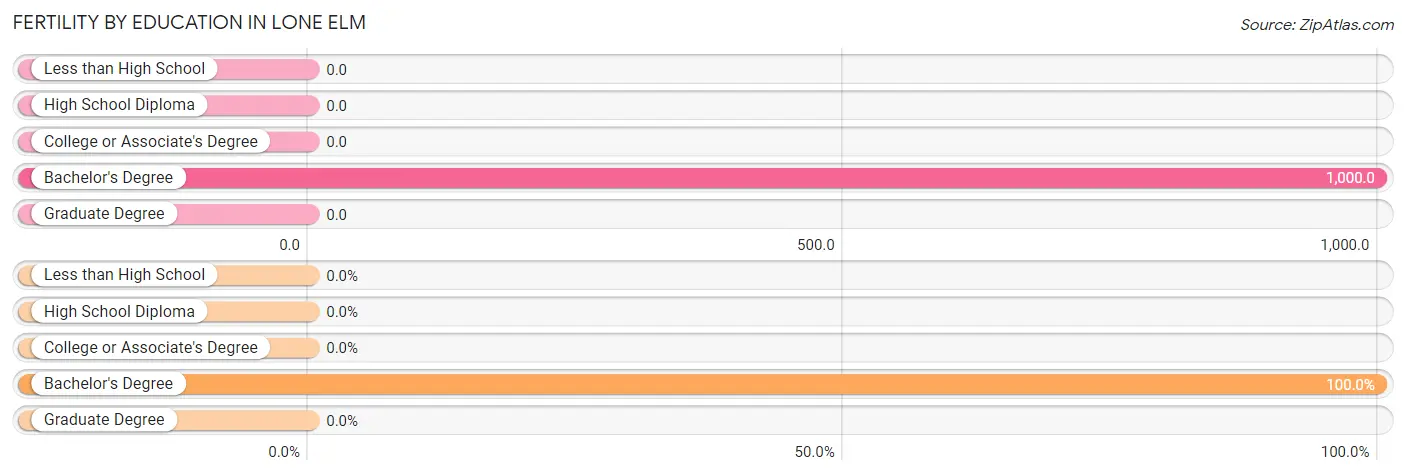
| Educational Attainment | Women with Births | Births / 1,000 Women |
| Less than High School | 0 (0.0%) | 0.0 |
| High School Diploma | 0 (0.0%) | 0.0 |
| College or Associate's Degree | 0 (0.0%) | 0.0 |
| Bachelor's Degree | 3 (100.0%) | 1,000.0 |
| Graduate Degree | 0 (0.0%) | 0.0 |
| Total | 3 (100.0%) | 1,000.0 |
Fertility by Education by Marriage Status in Lone Elm
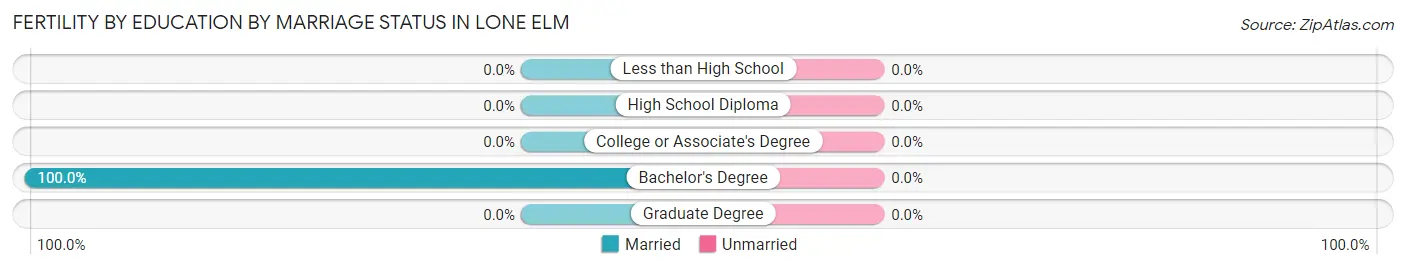
| Educational Attainment | Married | Unmarried |
| Less than High School | 0 (0.0%) | 0 (0.0%) |
| High School Diploma | 0 (0.0%) | 0 (0.0%) |
| College or Associate's Degree | 0 (0.0%) | 0 (0.0%) |
| Bachelor's Degree | 3 (100.0%) | 0 (0.0%) |
| Graduate Degree | 0 (0.0%) | 0 (0.0%) |
| Total | 3 (100.0%) | 0 (0.0%) |
Employment Characteristics in Lone Elm
Employment by Class of Employer in Lone Elm
Among the 5 employed individuals in Lone Elm, private company employees (2 | 40.0%), self-employed (not incorporated) (2 | 40.0%), and state government employees (1 | 20.0%) make up the most common classes of employment.
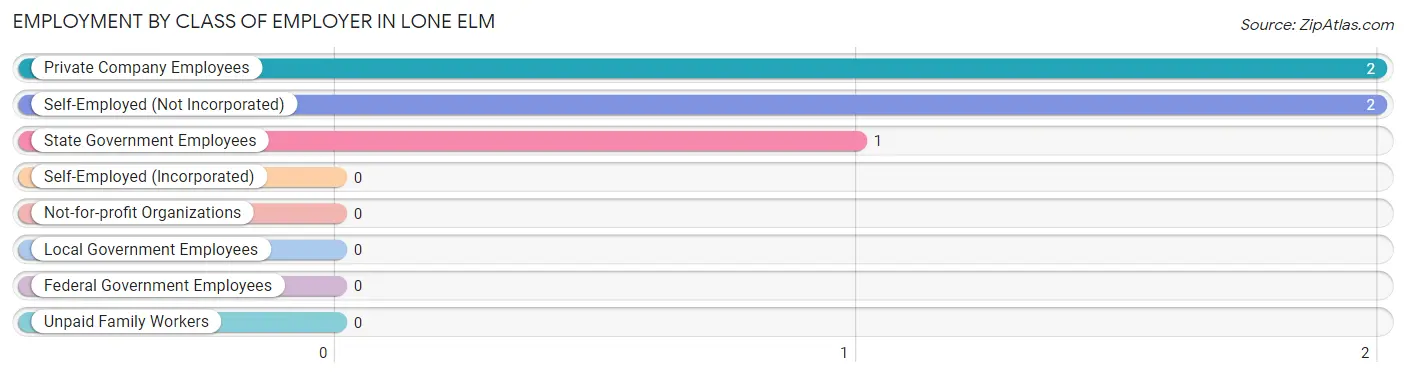
| Employer Class | # Employees | % Employees |
| Private Company Employees | 2 | 40.0% |
| Self-Employed (Incorporated) | 0 | 0.0% |
| Self-Employed (Not Incorporated) | 2 | 40.0% |
| Not-for-profit Organizations | 0 | 0.0% |
| Local Government Employees | 0 | 0.0% |
| State Government Employees | 1 | 20.0% |
| Federal Government Employees | 0 | 0.0% |
| Unpaid Family Workers | 0 | 0.0% |
| Total | 5 | 100.0% |
Employment Status by Age in Lone Elm
According to the labor force statistics for Lone Elm, out of the total population over 16 years of age (29), 89.7% or 26 individuals are in the labor force, with 69.2% or 18 of them unemployed. The age group with the highest labor force participation rate is 25 to 29 years, with 100.0% or 3 individuals in the labor force. Within the labor force, the 75 years and over age range has the highest percentage of unemployed individuals, with 100.0% or 18 of them being unemployed.
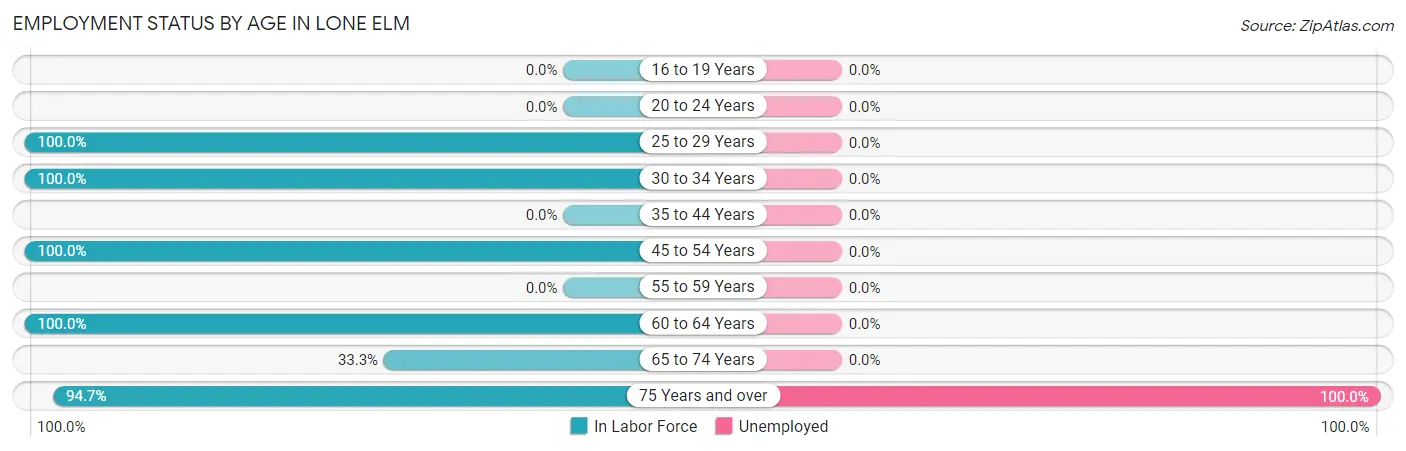
| Age Bracket | In Labor Force | Unemployed |
| 16 to 19 Years | 0 (0.0%) | 0 (0.0%) |
| 20 to 24 Years | 0 (0.0%) | 0 (0.0%) |
| 25 to 29 Years | 3 (100.0%) | 0 (0.0%) |
| 30 to 34 Years | 1 (100.0%) | 0 (0.0%) |
| 35 to 44 Years | 0 (0.0%) | 0 (0.0%) |
| 45 to 54 Years | 1 (100.0%) | 0 (0.0%) |
| 55 to 59 Years | 0 (0.0%) | 0 (0.0%) |
| 60 to 64 Years | 2 (100.0%) | 0 (0.0%) |
| 65 to 74 Years | 1 (33.3%) | 0 (0.0%) |
| 75 Years and over | 18 (94.7%) | 18 (100.0%) |
| Total | 26 (89.7%) | 18 (69.2%) |
Employment Status by Educational Attainment in Lone Elm
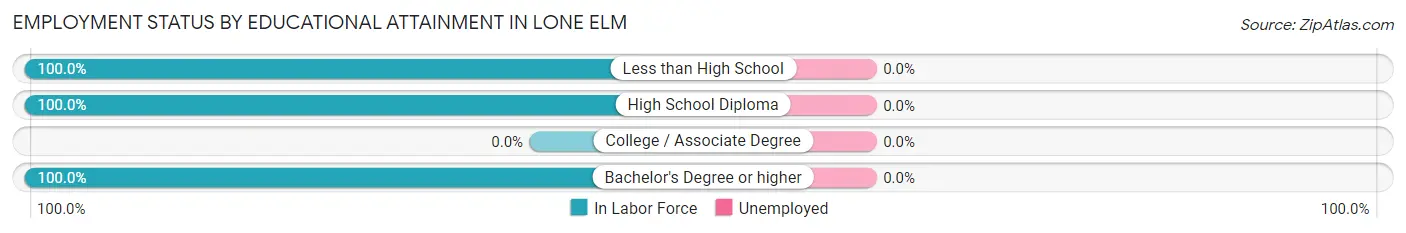
| Educational Attainment | In Labor Force | Unemployed |
| Less than High School | 1 (100.0%) | 0 (0.0%) |
| High School Diploma | 2 (100.0%) | 0 (0.0%) |
| College / Associate Degree | 0 (0.0%) | 0 (0.0%) |
| Bachelor's Degree or higher | 4 (100.0%) | 0 (0.0%) |
| Total | 7 (100.0%) | 0 (0.0%) |
Employment Occupations by Sex in Lone Elm
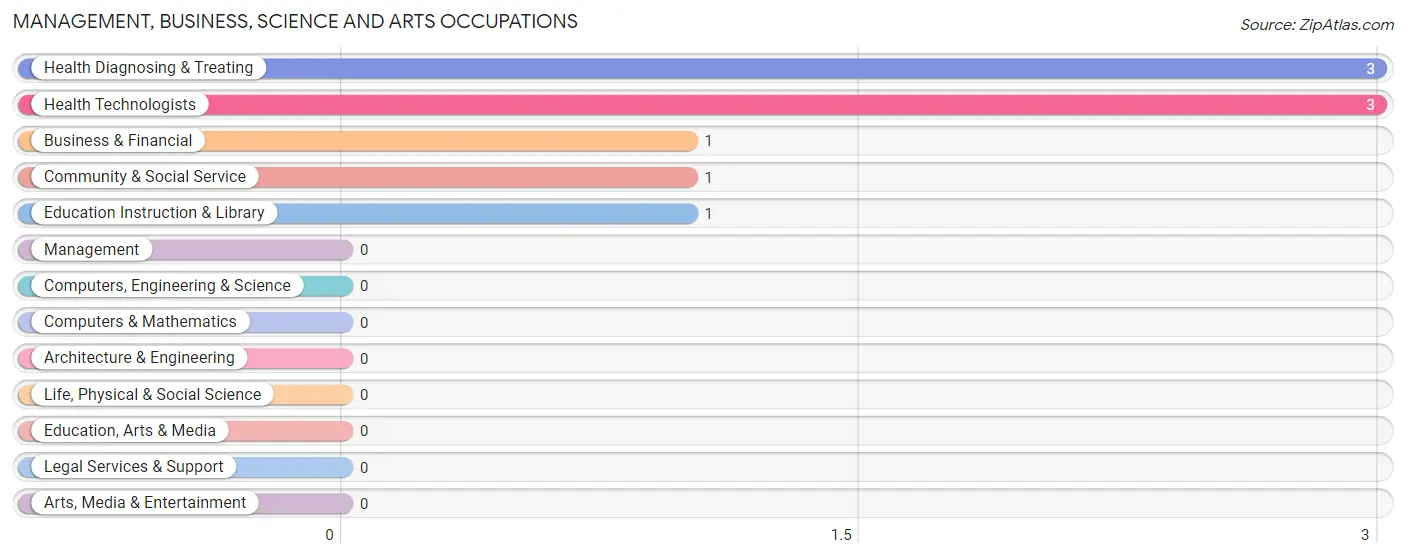
Management, Business, Science and Arts Occupations
The most common Management, Business, Science and Arts occupations in Lone Elm are Health Diagnosing & Treating (3 | 37.5%), Health Technologists (3 | 37.5%), Business & Financial (1 | 12.5%), Community & Social Service (1 | 12.5%), and Education Instruction & Library (1 | 12.5%).
Management, Business, Science and Arts Occupations by Sex
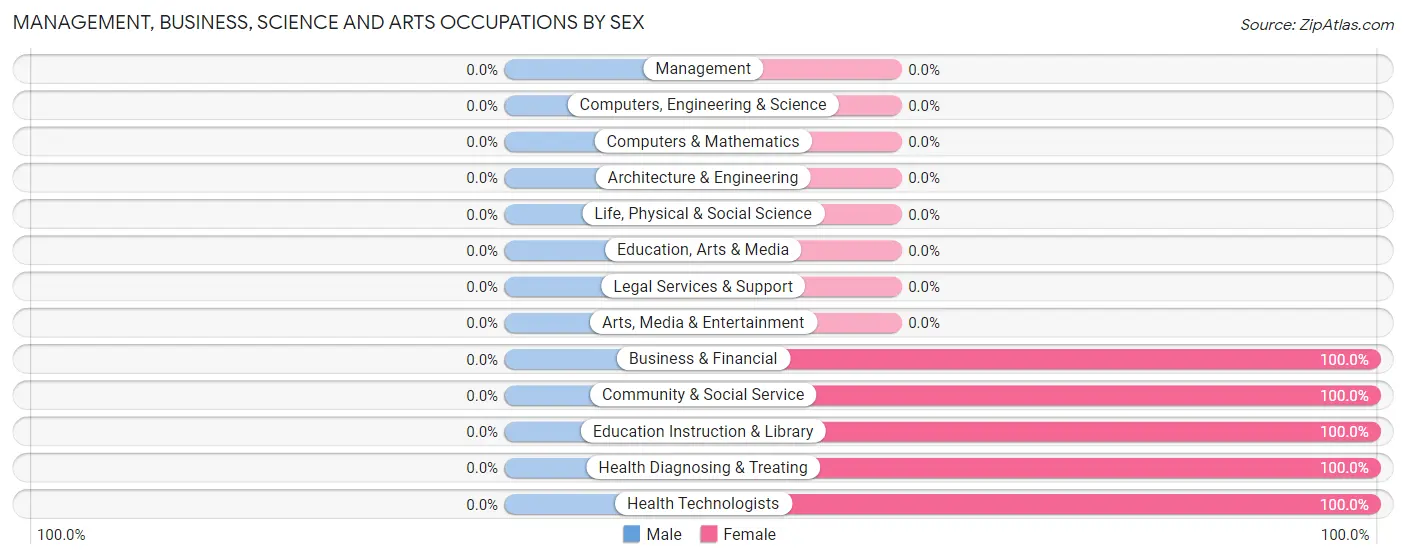
| Occupation | Male | Female |
| Management | 0 (0.0%) | 0 (0.0%) |
| Business & Financial | 0 (0.0%) | 1 (100.0%) |
| Computers, Engineering & Science | 0 (0.0%) | 0 (0.0%) |
| Computers & Mathematics | 0 (0.0%) | 0 (0.0%) |
| Architecture & Engineering | 0 (0.0%) | 0 (0.0%) |
| Life, Physical & Social Science | 0 (0.0%) | 0 (0.0%) |
| Community & Social Service | 0 (0.0%) | 1 (100.0%) |
| Education, Arts & Media | 0 (0.0%) | 0 (0.0%) |
| Legal Services & Support | 0 (0.0%) | 0 (0.0%) |
| Education Instruction & Library | 0 (0.0%) | 1 (100.0%) |
| Arts, Media & Entertainment | 0 (0.0%) | 0 (0.0%) |
| Health Diagnosing & Treating | 0 (0.0%) | 3 (100.0%) |
| Health Technologists | 0 (0.0%) | 3 (100.0%) |
| Total (Category) | 0 (0.0%) | 5 (100.0%) |
| Total (Overall) | 2 (25.0%) | 6 (75.0%) |
Services Occupations
Services Occupations by Sex
| Occupation | Male | Female |
| Healthcare Support | 0 (0.0%) | 0 (0.0%) |
| Security & Protection | 0 (0.0%) | 0 (0.0%) |
| Firefighting & Prevention | 0 (0.0%) | 0 (0.0%) |
| Law Enforcement | 0 (0.0%) | 0 (0.0%) |
| Food Preparation & Serving | 0 (0.0%) | 0 (0.0%) |
| Cleaning & Maintenance | 0 (0.0%) | 0 (0.0%) |
| Personal Care & Service | 0 (0.0%) | 0 (0.0%) |
| Total (Category) | 0 (0.0%) | 0 (0.0%) |
| Total (Overall) | 2 (25.0%) | 6 (75.0%) |
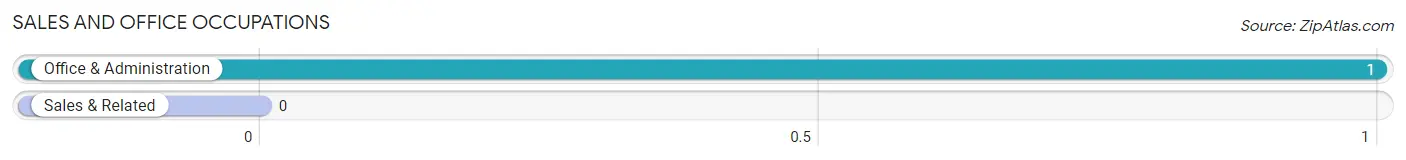
Sales and Office Occupations
The most common Sales and Office occupations in Lone Elm are , and Office & Administration (1 | 12.5%).
Sales and Office Occupations by Sex
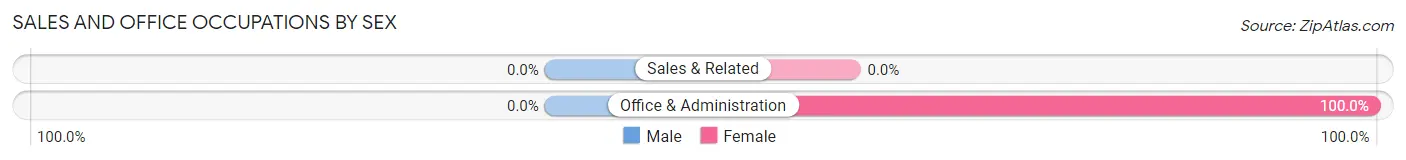
| Occupation | Male | Female |
| Sales & Related | 0 (0.0%) | 0 (0.0%) |
| Office & Administration | 0 (0.0%) | 1 (100.0%) |
| Total (Category) | 0 (0.0%) | 1 (100.0%) |
| Total (Overall) | 2 (25.0%) | 6 (75.0%) |
Natural Resources, Construction and Maintenance Occupations
The most common Natural Resources, Construction and Maintenance occupations in Lone Elm are , and Construction & Extraction (1 | 12.5%).
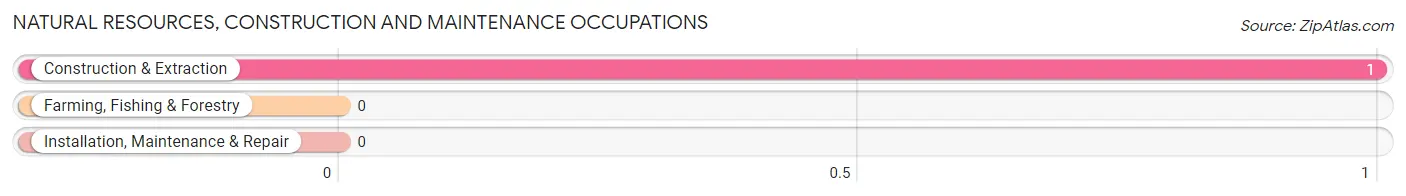
Natural Resources, Construction and Maintenance Occupations by Sex
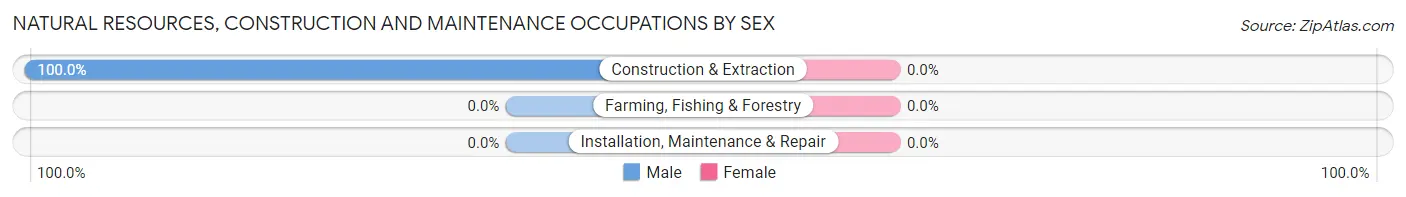
| Occupation | Male | Female |
| Farming, Fishing & Forestry | 0 (0.0%) | 0 (0.0%) |
| Construction & Extraction | 1 (100.0%) | 0 (0.0%) |
| Installation, Maintenance & Repair | 0 (0.0%) | 0 (0.0%) |
| Total (Category) | 1 (100.0%) | 0 (0.0%) |
| Total (Overall) | 2 (25.0%) | 6 (75.0%) |
Production, Transportation and Moving Occupations
The most common Production, Transportation and Moving occupations in Lone Elm are , and Material Moving (1 | 12.5%).
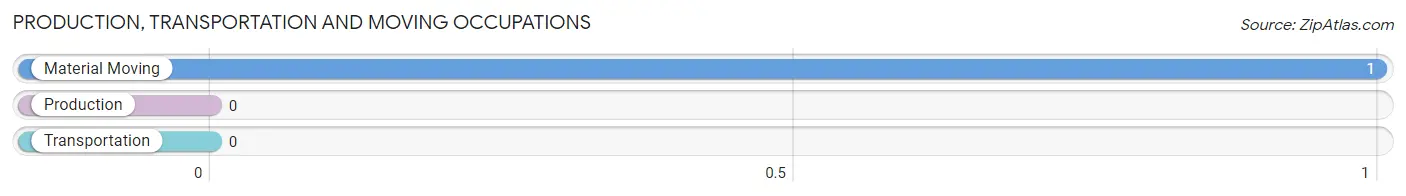
Production, Transportation and Moving Occupations by Sex
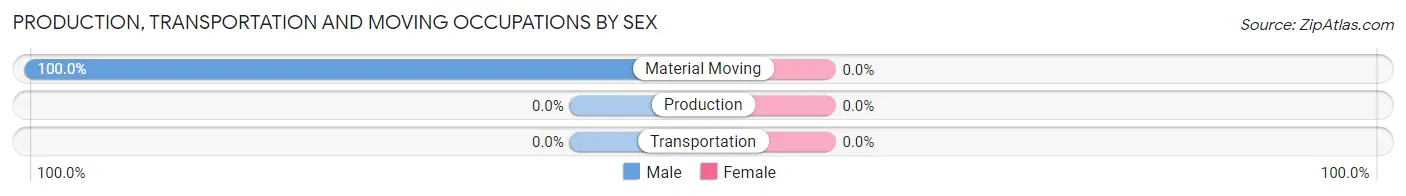
| Occupation | Male | Female |
| Production | 0 (0.0%) | 0 (0.0%) |
| Transportation | 0 (0.0%) | 0 (0.0%) |
| Material Moving | 1 (100.0%) | 0 (0.0%) |
| Total (Category) | 1 (100.0%) | 0 (0.0%) |
| Total (Overall) | 2 (25.0%) | 6 (75.0%) |
Employment Industries by Sex in Lone Elm
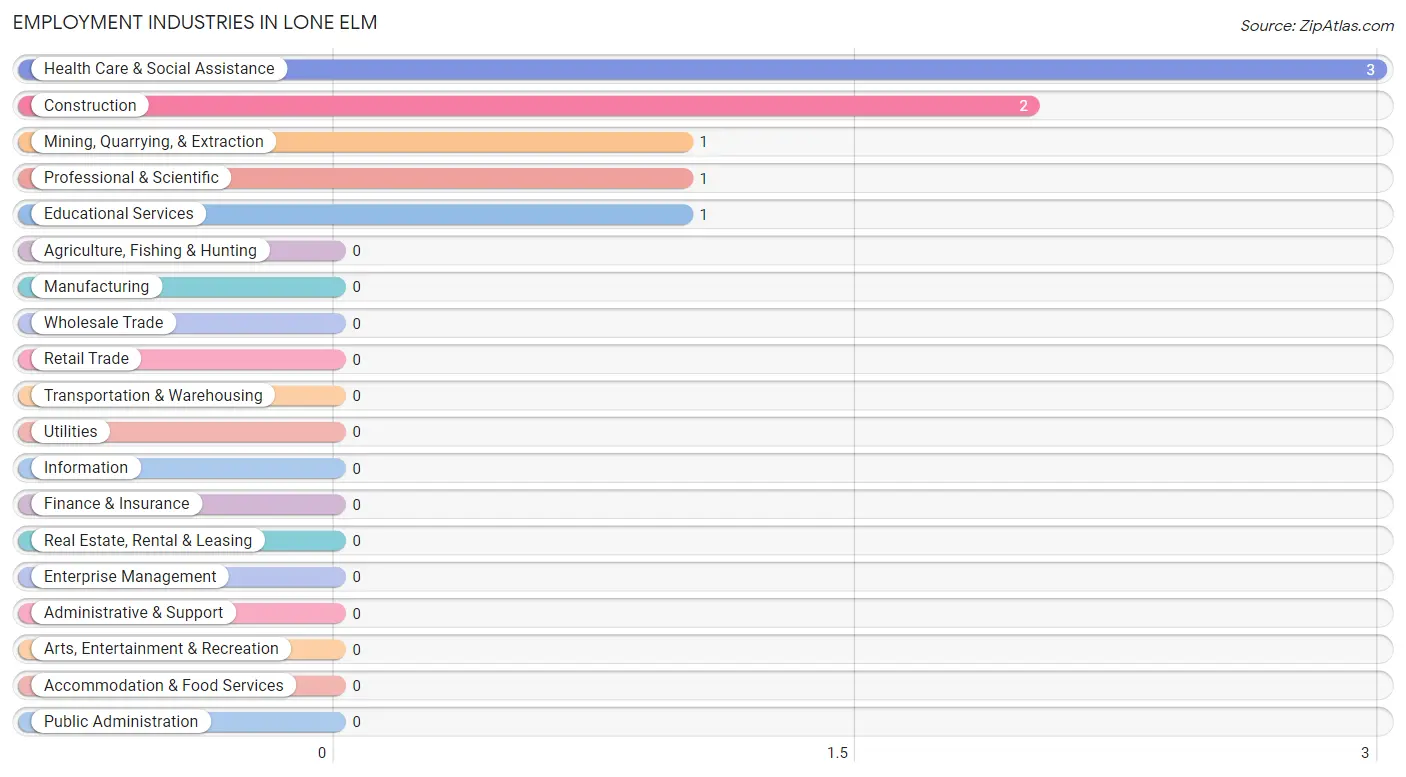
Employment Industries in Lone Elm
The major employment industries in Lone Elm include Health Care & Social Assistance (3 | 37.5%), Construction (2 | 25.0%), Mining, Quarrying, & Extraction (1 | 12.5%), Professional & Scientific (1 | 12.5%), and Educational Services (1 | 12.5%).
Employment Industries by Sex in Lone Elm
The Lone Elm industries that see more men than women are Mining, Quarrying, & Extraction (100.0%), and Construction (50.0%), whereas the industries that tend to have a higher number of women are Professional & Scientific (100.0%), Educational Services (100.0%), and Health Care & Social Assistance (100.0%).
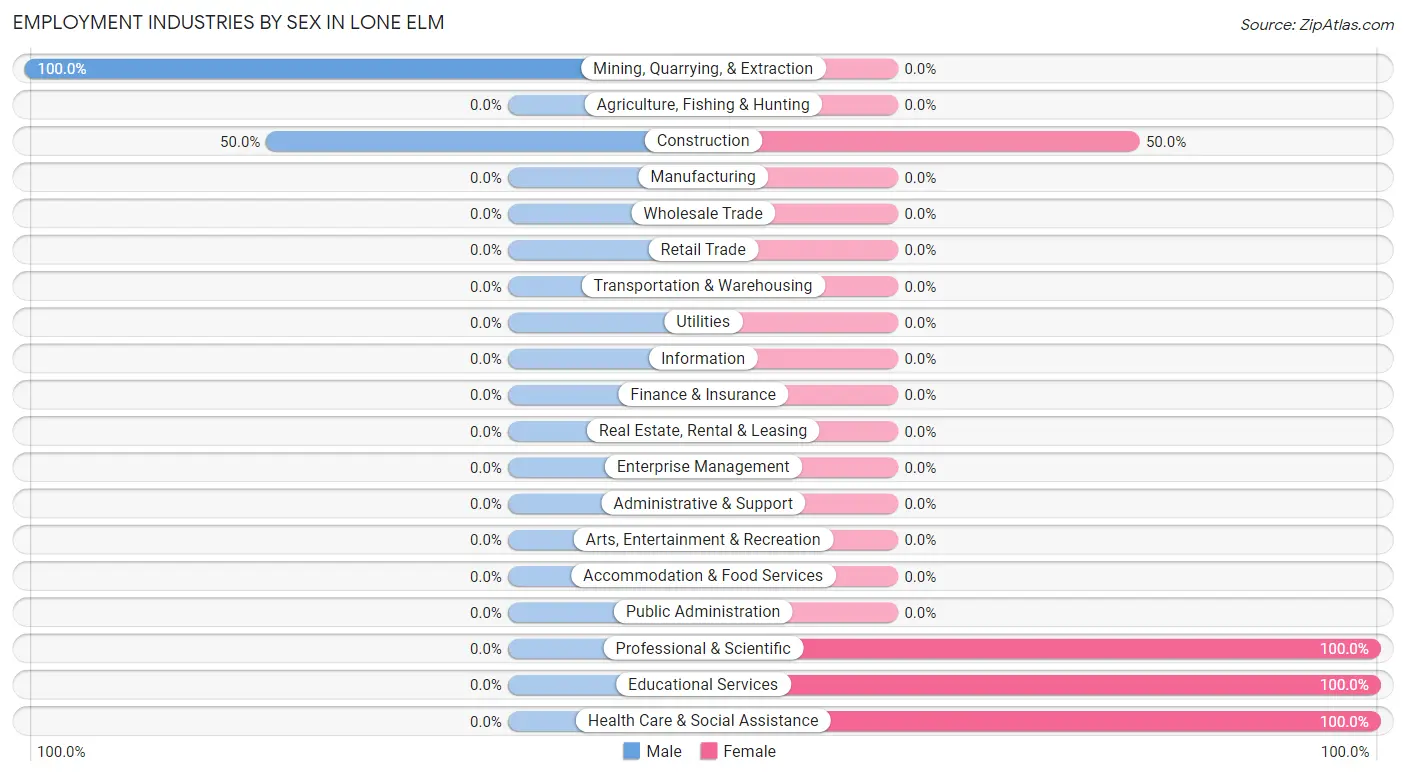
| Industry | Male | Female |
| Agriculture, Fishing & Hunting | 0 (0.0%) | 0 (0.0%) |
| Mining, Quarrying, & Extraction | 1 (100.0%) | 0 (0.0%) |
| Construction | 1 (50.0%) | 1 (50.0%) |
| Manufacturing | 0 (0.0%) | 0 (0.0%) |
| Wholesale Trade | 0 (0.0%) | 0 (0.0%) |
| Retail Trade | 0 (0.0%) | 0 (0.0%) |
| Transportation & Warehousing | 0 (0.0%) | 0 (0.0%) |
| Utilities | 0 (0.0%) | 0 (0.0%) |
| Information | 0 (0.0%) | 0 (0.0%) |
| Finance & Insurance | 0 (0.0%) | 0 (0.0%) |
| Real Estate, Rental & Leasing | 0 (0.0%) | 0 (0.0%) |
| Professional & Scientific | 0 (0.0%) | 1 (100.0%) |
| Enterprise Management | 0 (0.0%) | 0 (0.0%) |
| Administrative & Support | 0 (0.0%) | 0 (0.0%) |
| Educational Services | 0 (0.0%) | 1 (100.0%) |
| Health Care & Social Assistance | 0 (0.0%) | 3 (100.0%) |
| Arts, Entertainment & Recreation | 0 (0.0%) | 0 (0.0%) |
| Accommodation & Food Services | 0 (0.0%) | 0 (0.0%) |
| Public Administration | 0 (0.0%) | 0 (0.0%) |
| Total | 2 (25.0%) | 6 (75.0%) |
Education in Lone Elm
School Enrollment in Lone Elm
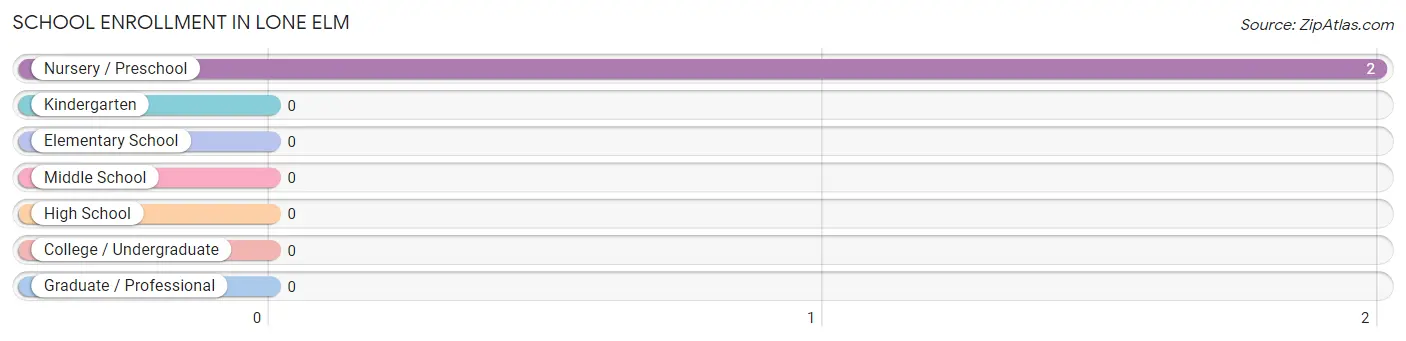
| School Level | # Students | % Students |
| Nursery / Preschool | 2 | 100.0% |
| Kindergarten | 0 | 0.0% |
| Elementary School | 0 | 0.0% |
| Middle School | 0 | 0.0% |
| High School | 0 | 0.0% |
| College / Undergraduate | 0 | 0.0% |
| Graduate / Professional | 0 | 0.0% |
| Total | 2 | 100.0% |
School Enrollment by Age by Funding Source in Lone Elm
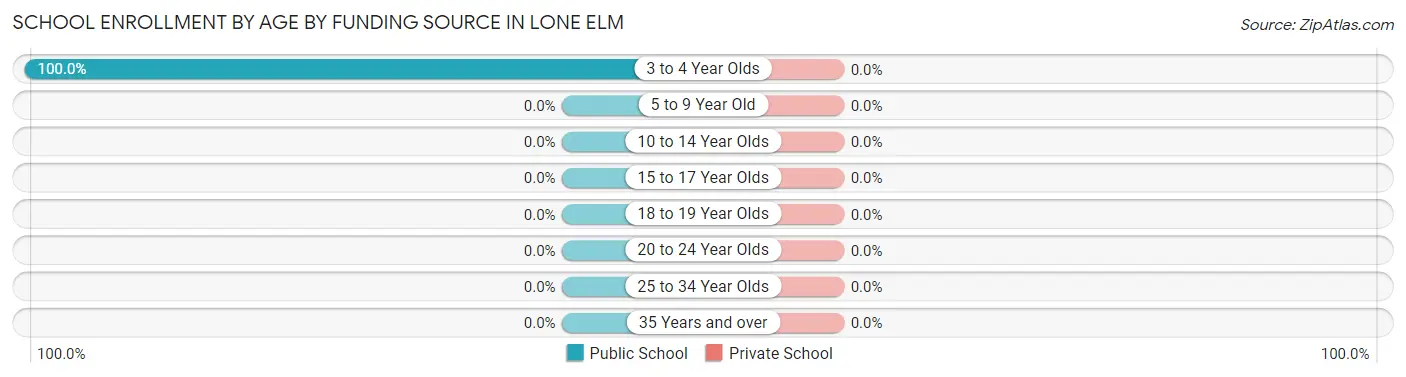
| Age Bracket | Public School | Private School |
| 3 to 4 Year Olds | 2 (100.0%) | 0 (0.0%) |
| 5 to 9 Year Old | 0 (0.0%) | 0 (0.0%) |
| 10 to 14 Year Olds | 0 (0.0%) | 0 (0.0%) |
| 15 to 17 Year Olds | 0 (0.0%) | 0 (0.0%) |
| 18 to 19 Year Olds | 0 (0.0%) | 0 (0.0%) |
| 20 to 24 Year Olds | 0 (0.0%) | 0 (0.0%) |
| 25 to 34 Year Olds | 0 (0.0%) | 0 (0.0%) |
| 35 Years and over | 0 (0.0%) | 0 (0.0%) |
| Total | 2 (100.0%) | 0 (0.0%) |
Educational Attainment by Field of Study in Lone Elm
Science & technology (3 | 50.0%), bio, nature & agricultural (1 | 16.7%), physical & health sciences (1 | 16.7%), and business (1 | 16.7%) are the most common fields of study among 6 individuals in Lone Elm who have obtained a bachelor's degree or higher.
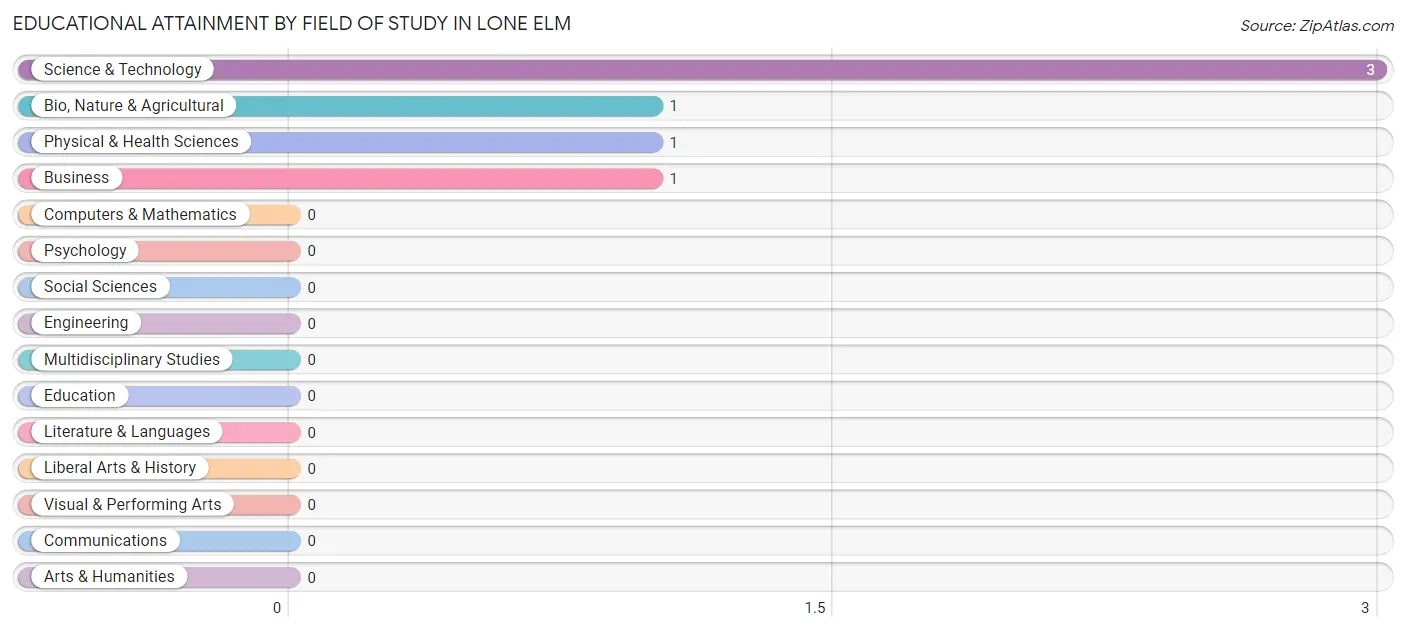
| Field of Study | # Graduates | % Graduates |
| Computers & Mathematics | 0 | 0.0% |
| Bio, Nature & Agricultural | 1 | 16.7% |
| Physical & Health Sciences | 1 | 16.7% |
| Psychology | 0 | 0.0% |
| Social Sciences | 0 | 0.0% |
| Engineering | 0 | 0.0% |
| Multidisciplinary Studies | 0 | 0.0% |
| Science & Technology | 3 | 50.0% |
| Business | 1 | 16.7% |
| Education | 0 | 0.0% |
| Literature & Languages | 0 | 0.0% |
| Liberal Arts & History | 0 | 0.0% |
| Visual & Performing Arts | 0 | 0.0% |
| Communications | 0 | 0.0% |
| Arts & Humanities | 0 | 0.0% |
| Total | 6 | 100.0% |
Transportation & Commute in Lone Elm
Vehicle Availability by Sex in Lone Elm
The most prevalent vehicle ownership categories in Lone Elm are males with 2 vehicles (1, accounting for 50.0%) and females with 2 vehicles (0, making up 33.3%).
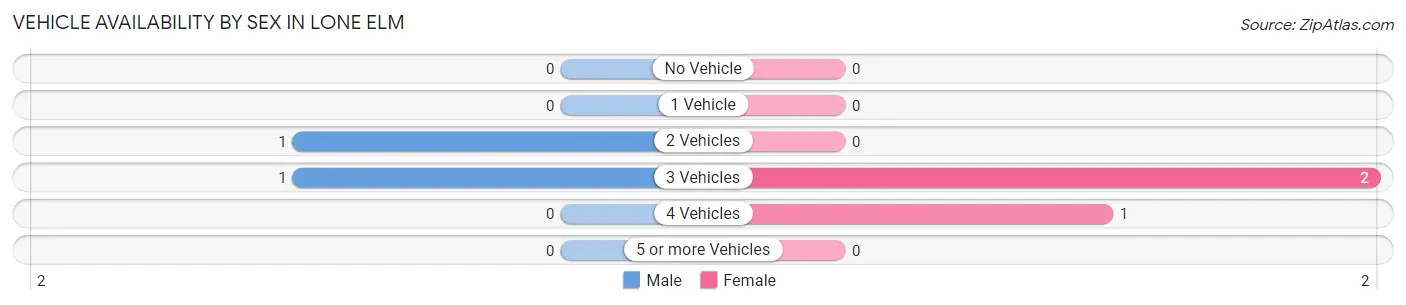
| Vehicles Available | Male | Female |
| No Vehicle | 0 (0.0%) | 0 (0.0%) |
| 1 Vehicle | 0 (0.0%) | 0 (0.0%) |
| 2 Vehicles | 1 (50.0%) | 0 (0.0%) |
| 3 Vehicles | 1 (50.0%) | 2 (66.7%) |
| 4 Vehicles | 0 (0.0%) | 1 (33.3%) |
| 5 or more Vehicles | 0 (0.0%) | 0 (0.0%) |
| Total | 2 (100.0%) | 3 (100.0%) |
Commute Time in Lone Elm
The most frequently occuring commute durations in Lone Elm are 20 to 24 minutes (1 commuters, 25.0%), 30 to 34 minutes (1 commuters, 25.0%), and 40 to 44 minutes (1 commuters, 25.0%).
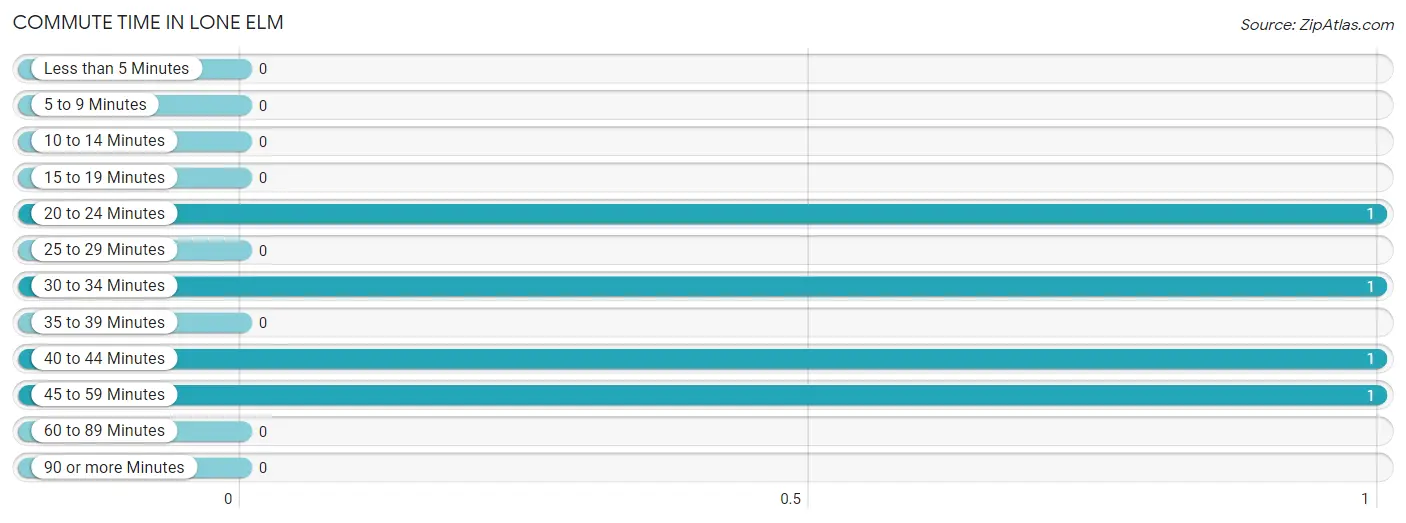
| Commute Time | # Commuters | % Commuters |
| Less than 5 Minutes | 0 | 0.0% |
| 5 to 9 Minutes | 0 | 0.0% |
| 10 to 14 Minutes | 0 | 0.0% |
| 15 to 19 Minutes | 0 | 0.0% |
| 20 to 24 Minutes | 1 | 25.0% |
| 25 to 29 Minutes | 0 | 0.0% |
| 30 to 34 Minutes | 1 | 25.0% |
| 35 to 39 Minutes | 0 | 0.0% |
| 40 to 44 Minutes | 1 | 25.0% |
| 45 to 59 Minutes | 1 | 25.0% |
| 60 to 89 Minutes | 0 | 0.0% |
| 90 or more Minutes | 0 | 0.0% |
Commute Time by Sex in Lone Elm
The most common commute times in Lone Elm are 40 to 44 minutes (1 commuters, 50.0%) for males and 20 to 24 minutes (1 commuters, 50.0%) for females.
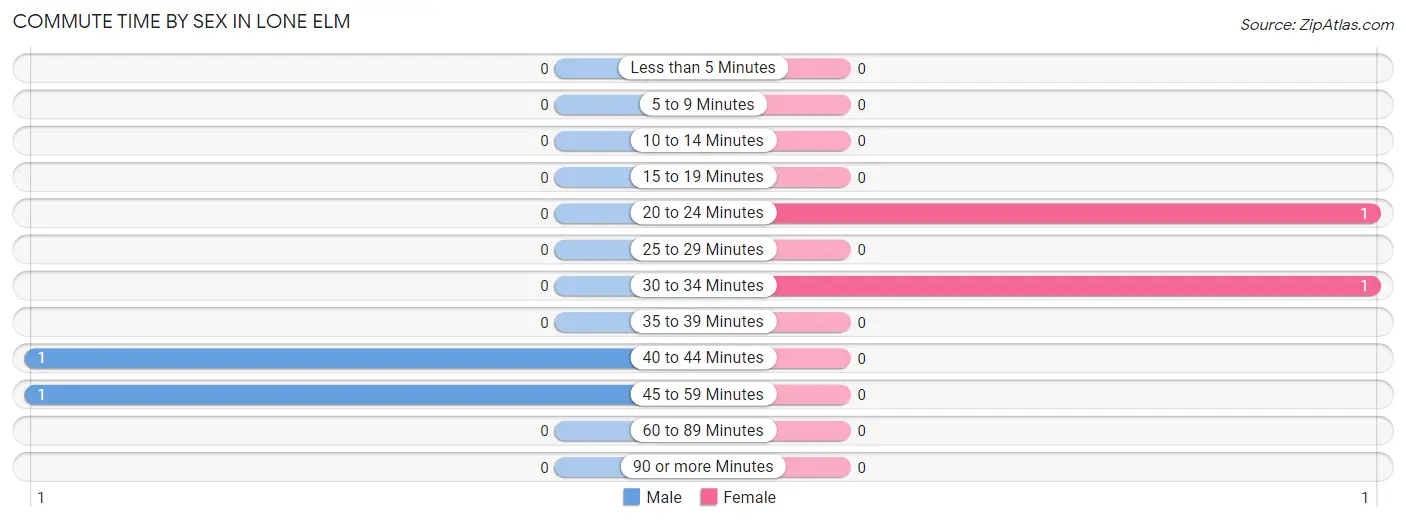
| Commute Time | Male | Female |
| Less than 5 Minutes | 0 (0.0%) | 0 (0.0%) |
| 5 to 9 Minutes | 0 (0.0%) | 0 (0.0%) |
| 10 to 14 Minutes | 0 (0.0%) | 0 (0.0%) |
| 15 to 19 Minutes | 0 (0.0%) | 0 (0.0%) |
| 20 to 24 Minutes | 0 (0.0%) | 1 (50.0%) |
| 25 to 29 Minutes | 0 (0.0%) | 0 (0.0%) |
| 30 to 34 Minutes | 0 (0.0%) | 1 (50.0%) |
| 35 to 39 Minutes | 0 (0.0%) | 0 (0.0%) |
| 40 to 44 Minutes | 1 (50.0%) | 0 (0.0%) |
| 45 to 59 Minutes | 1 (50.0%) | 0 (0.0%) |
| 60 to 89 Minutes | 0 (0.0%) | 0 (0.0%) |
| 90 or more Minutes | 0 (0.0%) | 0 (0.0%) |
Time of Departure to Work by Sex in Lone Elm
The most frequent times of departure to work in Lone Elm are 12:00 AM to 4:59 AM (1, 50.0%) for males and 7:00 AM to 7:29 AM (1, 50.0%) for females.
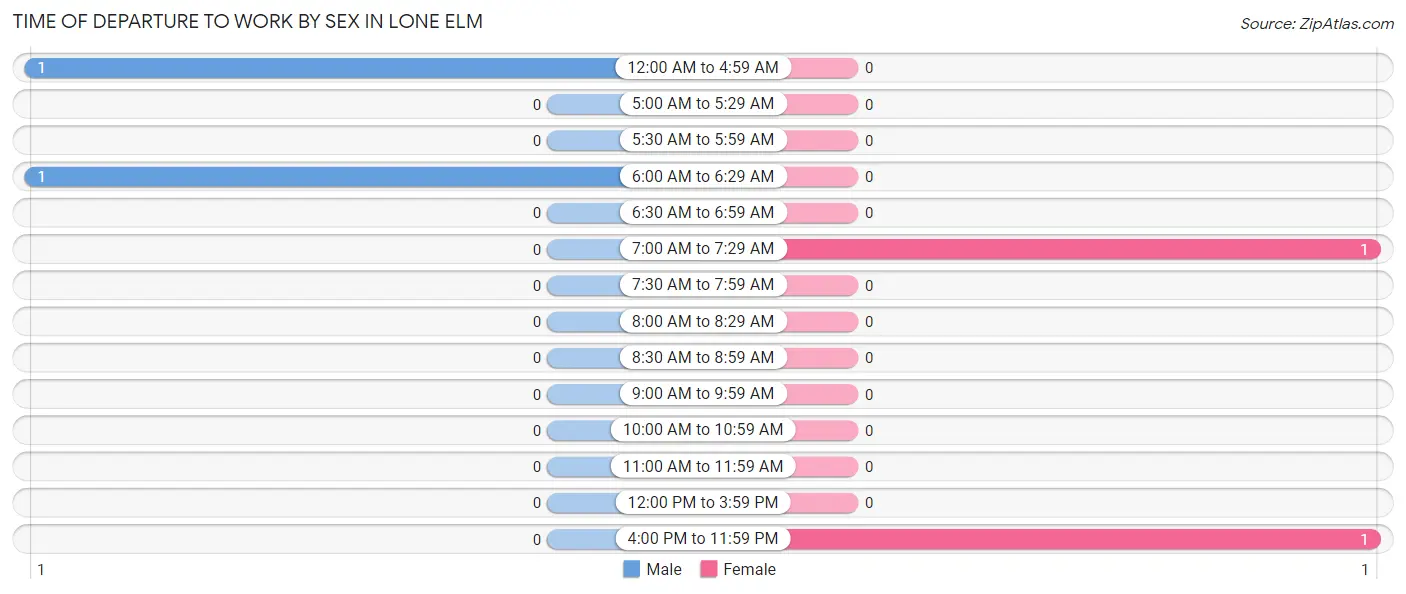
| Time of Departure | Male | Female |
| 12:00 AM to 4:59 AM | 1 (50.0%) | 0 (0.0%) |
| 5:00 AM to 5:29 AM | 0 (0.0%) | 0 (0.0%) |
| 5:30 AM to 5:59 AM | 0 (0.0%) | 0 (0.0%) |
| 6:00 AM to 6:29 AM | 1 (50.0%) | 0 (0.0%) |
| 6:30 AM to 6:59 AM | 0 (0.0%) | 0 (0.0%) |
| 7:00 AM to 7:29 AM | 0 (0.0%) | 1 (50.0%) |
| 7:30 AM to 7:59 AM | 0 (0.0%) | 0 (0.0%) |
| 8:00 AM to 8:29 AM | 0 (0.0%) | 0 (0.0%) |
| 8:30 AM to 8:59 AM | 0 (0.0%) | 0 (0.0%) |
| 9:00 AM to 9:59 AM | 0 (0.0%) | 0 (0.0%) |
| 10:00 AM to 10:59 AM | 0 (0.0%) | 0 (0.0%) |
| 11:00 AM to 11:59 AM | 0 (0.0%) | 0 (0.0%) |
| 12:00 PM to 3:59 PM | 0 (0.0%) | 0 (0.0%) |
| 4:00 PM to 11:59 PM | 0 (0.0%) | 1 (50.0%) |
| Total | 2 (100.0%) | 2 (100.0%) |
Housing Occupancy in Lone Elm
Occupancy by Ownership in Lone Elm
Of the total 25 dwellings in Lone Elm, owner-occupied units account for 25 (100.0%), while renter-occupied units make up 0 (0.0%).
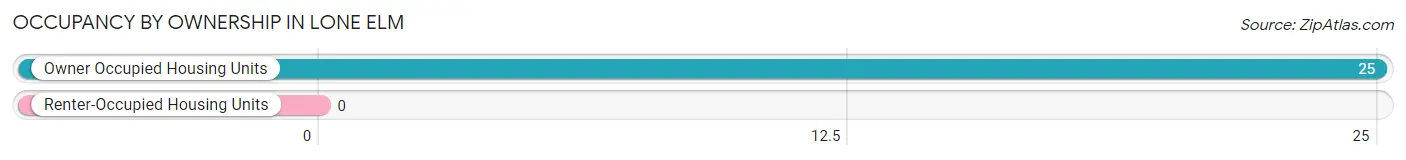
| Occupancy | # Housing Units | % Housing Units |
| Owner Occupied Housing Units | 25 | 100.0% |
| Renter-Occupied Housing Units | 0 | 0.0% |
| Total Occupied Housing Units | 25 | 100.0% |
Occupancy by Household Size in Lone Elm
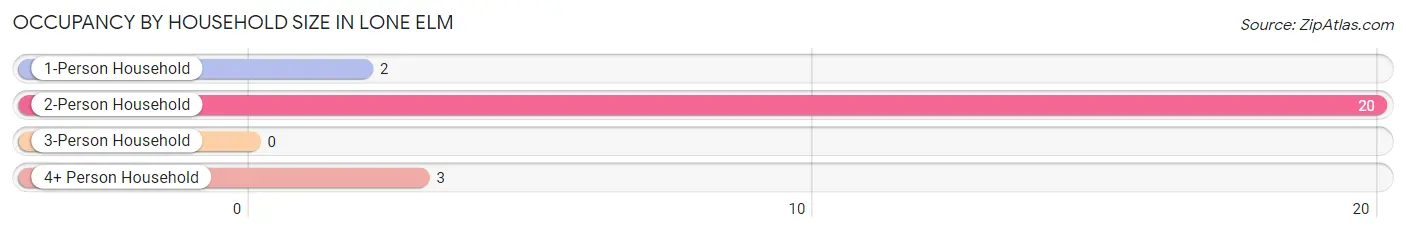
| Household Size | # Housing Units | % Housing Units |
| 1-Person Household | 2 | 8.0% |
| 2-Person Household | 20 | 80.0% |
| 3-Person Household | 0 | 0.0% |
| 4+ Person Household | 3 | 12.0% |
| Total Housing Units | 25 | 100.0% |
Occupancy by Ownership by Household Size in Lone Elm
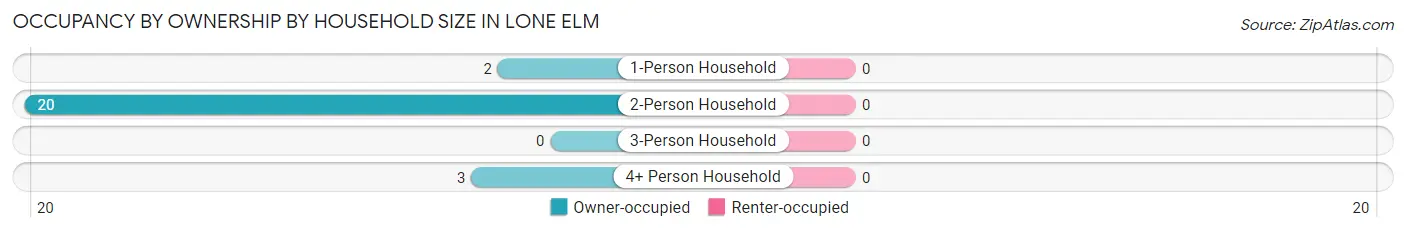
| Household Size | Owner-occupied | Renter-occupied |
| 1-Person Household | 2 (100.0%) | 0 (0.0%) |
| 2-Person Household | 20 (100.0%) | 0 (0.0%) |
| 3-Person Household | 0 (0.0%) | 0 (0.0%) |
| 4+ Person Household | 3 (100.0%) | 0 (0.0%) |
| Total Housing Units | 25 (100.0%) | 0 (0.0%) |
Occupancy by Educational Attainment in Lone Elm
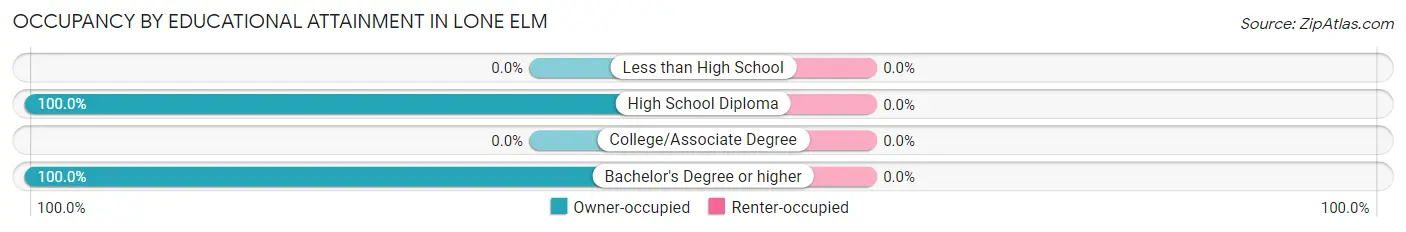
| Household Size | Owner-occupied | Renter-occupied |
| Less than High School | 0 (0.0%) | 0 (0.0%) |
| High School Diploma | 20 (100.0%) | 0 (0.0%) |
| College/Associate Degree | 0 (0.0%) | 0 (0.0%) |
| Bachelor's Degree or higher | 5 (100.0%) | 0 (0.0%) |
Occupancy by Age of Householder in Lone Elm
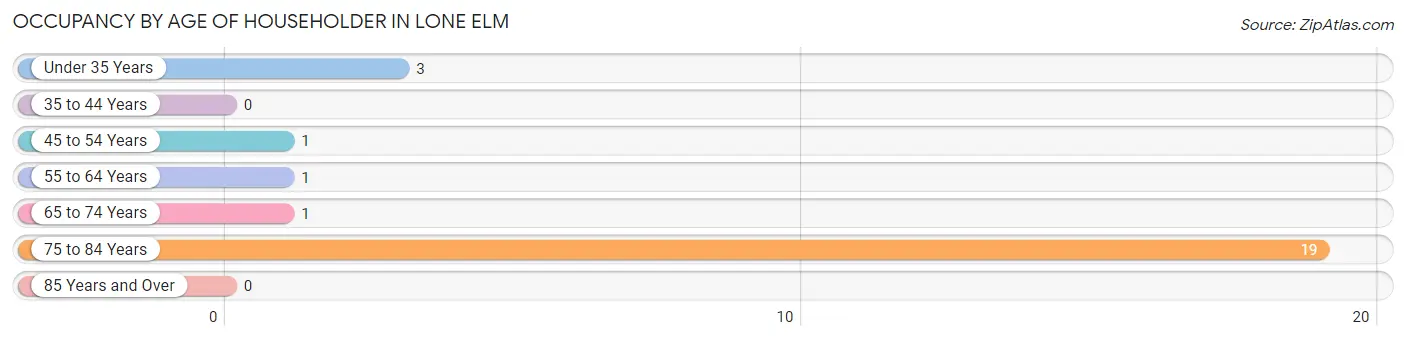
| Age Bracket | # Households | % Households |
| Under 35 Years | 3 | 12.0% |
| 35 to 44 Years | 0 | 0.0% |
| 45 to 54 Years | 1 | 4.0% |
| 55 to 64 Years | 1 | 4.0% |
| 65 to 74 Years | 1 | 4.0% |
| 75 to 84 Years | 19 | 76.0% |
| 85 Years and Over | 0 | 0.0% |
| Total | 25 | 100.0% |
Housing Finances in Lone Elm
Median Income by Occupancy in Lone Elm
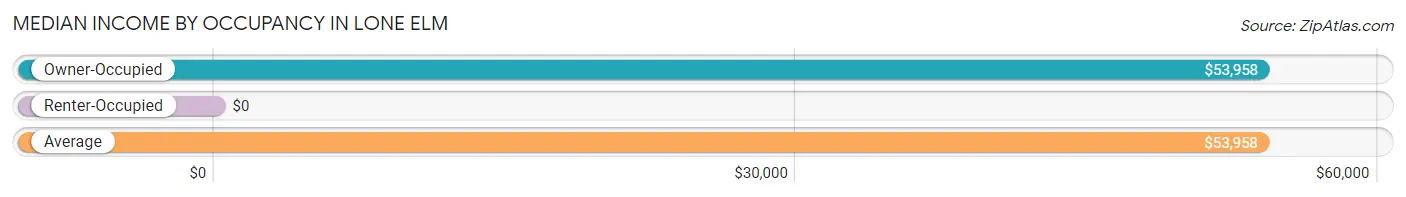
| Occupancy Type | # Households | Median Income |
| Owner-Occupied | 25 (100.0%) | $53,958 |
| Renter-Occupied | 0 (0.0%) | $0 |
| Average | 25 (100.0%) | $53,958 |
Occupancy by Householder Income Bracket in Lone Elm
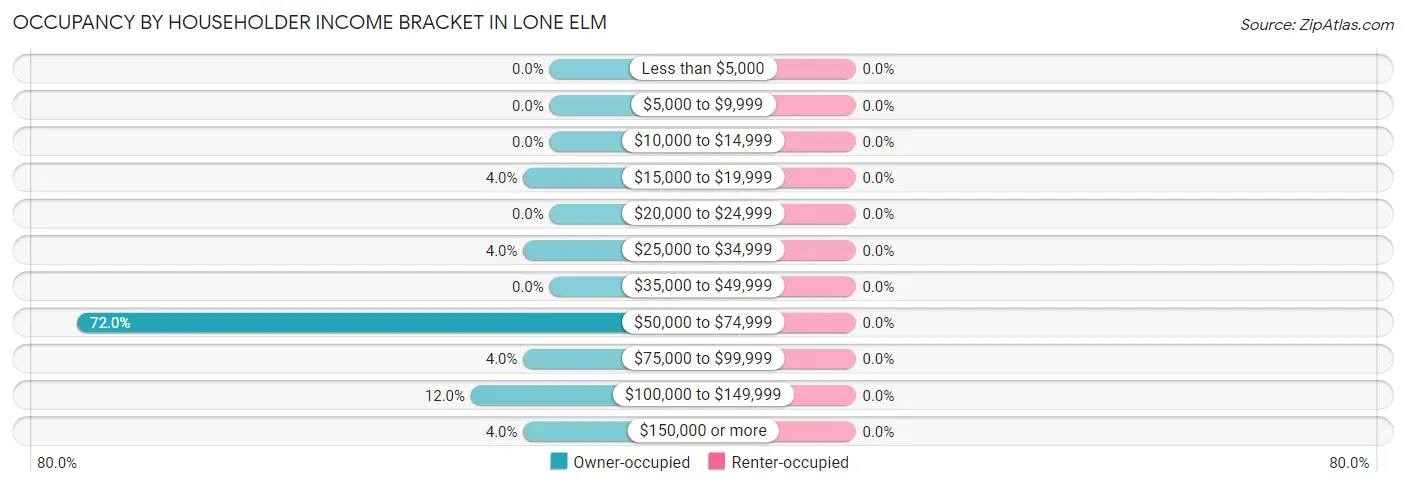
| Income Bracket | Owner-occupied | Renter-occupied |
| Less than $5,000 | 0 (0.0%) | 0 (0.0%) |
| $5,000 to $9,999 | 0 (0.0%) | 0 (0.0%) |
| $10,000 to $14,999 | 0 (0.0%) | 0 (0.0%) |
| $15,000 to $19,999 | 1 (4.0%) | 0 (0.0%) |
| $20,000 to $24,999 | 0 (0.0%) | 0 (0.0%) |
| $25,000 to $34,999 | 1 (4.0%) | 0 (0.0%) |
| $35,000 to $49,999 | 0 (0.0%) | 0 (0.0%) |
| $50,000 to $74,999 | 18 (72.0%) | 0 (0.0%) |
| $75,000 to $99,999 | 1 (4.0%) | 0 (0.0%) |
| $100,000 to $149,999 | 3 (12.0%) | 0 (0.0%) |
| $150,000 or more | 1 (4.0%) | 0 (0.0%) |
| Total | 25 (100.0%) | 0 (0.0%) |
Monthly Housing Cost Tiers in Lone Elm
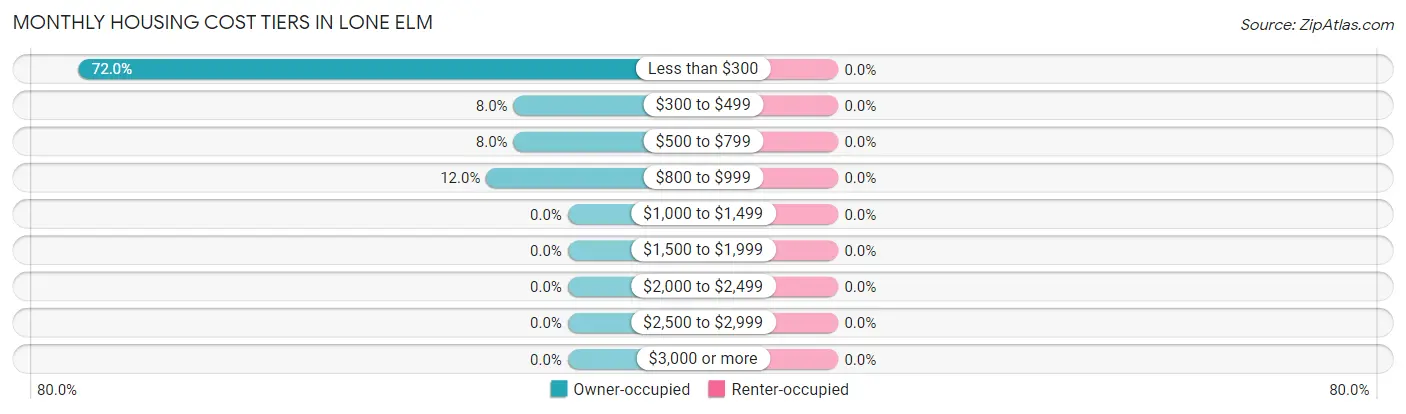
| Monthly Cost | Owner-occupied | Renter-occupied |
| Less than $300 | 18 (72.0%) | 0 (0.0%) |
| $300 to $499 | 2 (8.0%) | 0 (0.0%) |
| $500 to $799 | 2 (8.0%) | 0 (0.0%) |
| $800 to $999 | 3 (12.0%) | 0 (0.0%) |
| $1,000 to $1,499 | 0 (0.0%) | 0 (0.0%) |
| $1,500 to $1,999 | 0 (0.0%) | 0 (0.0%) |
| $2,000 to $2,499 | 0 (0.0%) | 0 (0.0%) |
| $2,500 to $2,999 | 0 (0.0%) | 0 (0.0%) |
| $3,000 or more | 0 (0.0%) | 0 (0.0%) |
| Total | 25 (100.0%) | 0 (0.0%) |
Physical Housing Characteristics in Lone Elm
Housing Structures in Lone Elm
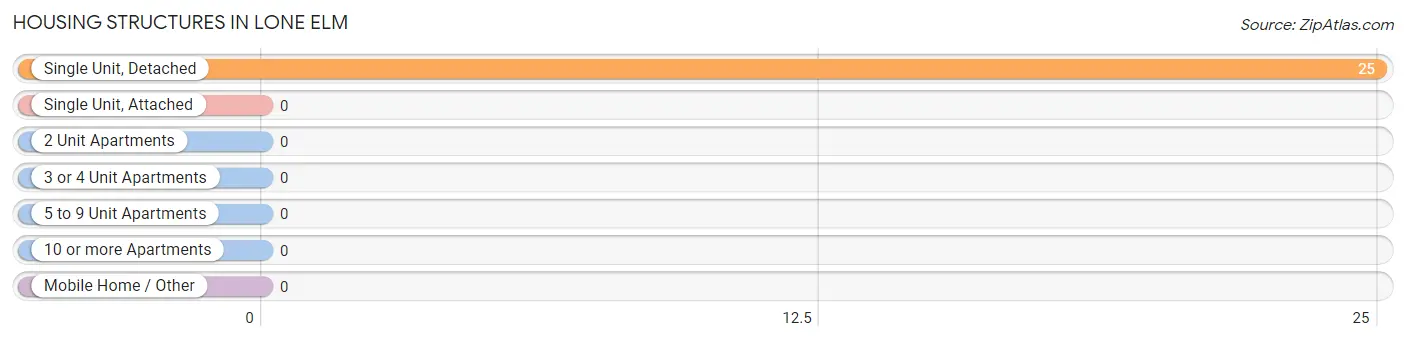
| Structure Type | # Housing Units | % Housing Units |
| Single Unit, Detached | 25 | 100.0% |
| Single Unit, Attached | 0 | 0.0% |
| 2 Unit Apartments | 0 | 0.0% |
| 3 or 4 Unit Apartments | 0 | 0.0% |
| 5 to 9 Unit Apartments | 0 | 0.0% |
| 10 or more Apartments | 0 | 0.0% |
| Mobile Home / Other | 0 | 0.0% |
| Total | 25 | 100.0% |
Housing Structures by Occupancy in Lone Elm
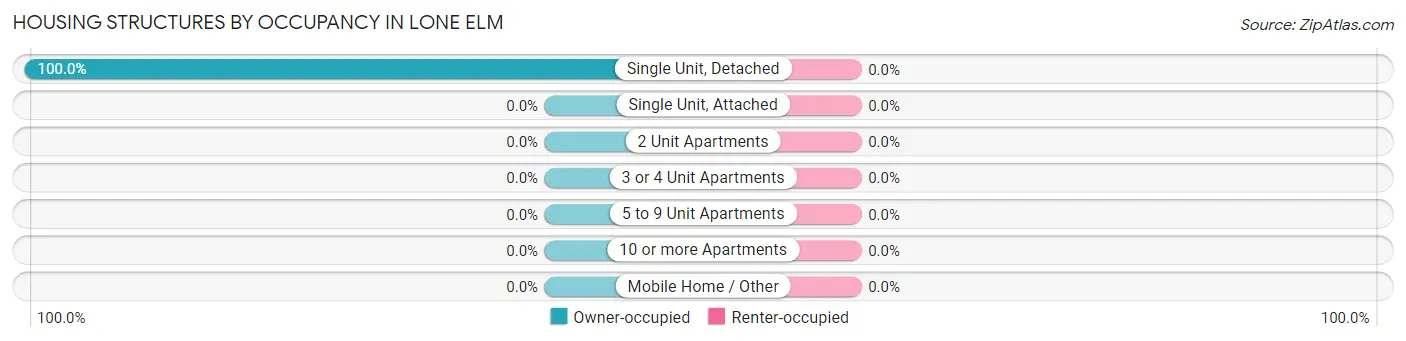
| Structure Type | Owner-occupied | Renter-occupied |
| Single Unit, Detached | 25 (100.0%) | 0 (0.0%) |
| Single Unit, Attached | 0 (0.0%) | 0 (0.0%) |
| 2 Unit Apartments | 0 (0.0%) | 0 (0.0%) |
| 3 or 4 Unit Apartments | 0 (0.0%) | 0 (0.0%) |
| 5 to 9 Unit Apartments | 0 (0.0%) | 0 (0.0%) |
| 10 or more Apartments | 0 (0.0%) | 0 (0.0%) |
| Mobile Home / Other | 0 (0.0%) | 0 (0.0%) |
| Total | 25 (100.0%) | 0 (0.0%) |
Housing Structures by Number of Rooms in Lone Elm
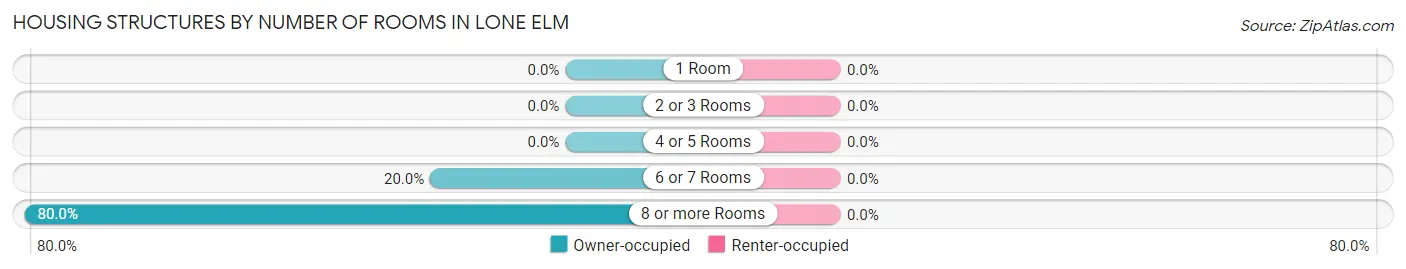
| Number of Rooms | Owner-occupied | Renter-occupied |
| 1 Room | 0 (0.0%) | 0 (0.0%) |
| 2 or 3 Rooms | 0 (0.0%) | 0 (0.0%) |
| 4 or 5 Rooms | 0 (0.0%) | 0 (0.0%) |
| 6 or 7 Rooms | 5 (20.0%) | 0 (0.0%) |
| 8 or more Rooms | 20 (80.0%) | 0 (0.0%) |
| Total | 25 (100.0%) | 0 (0.0%) |
Housing Structure by Heating Type in Lone Elm
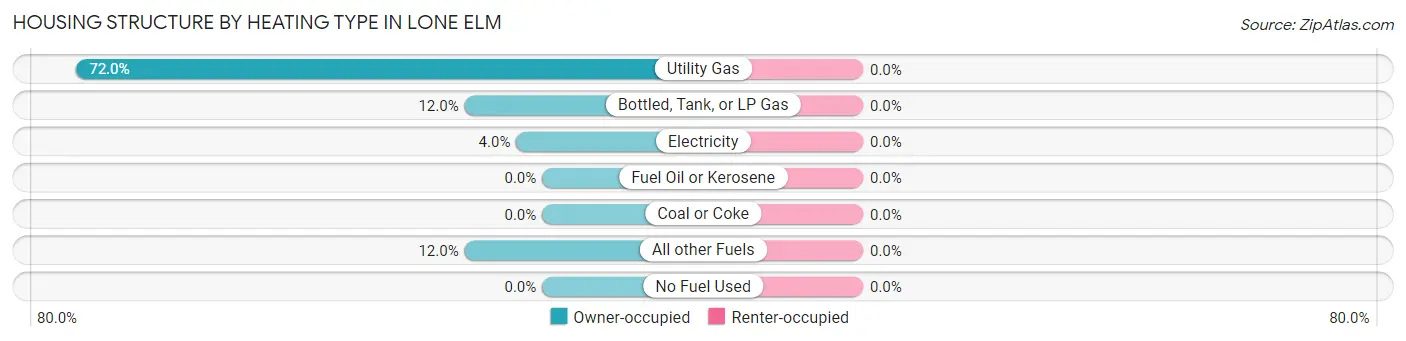
| Heating Type | Owner-occupied | Renter-occupied |
| Utility Gas | 18 (72.0%) | 0 (0.0%) |
| Bottled, Tank, or LP Gas | 3 (12.0%) | 0 (0.0%) |
| Electricity | 1 (4.0%) | 0 (0.0%) |
| Fuel Oil or Kerosene | 0 (0.0%) | 0 (0.0%) |
| Coal or Coke | 0 (0.0%) | 0 (0.0%) |
| All other Fuels | 3 (12.0%) | 0 (0.0%) |
| No Fuel Used | 0 (0.0%) | 0 (0.0%) |
| Total | 25 (100.0%) | 0 (0.0%) |
Household Vehicle Usage in Lone Elm
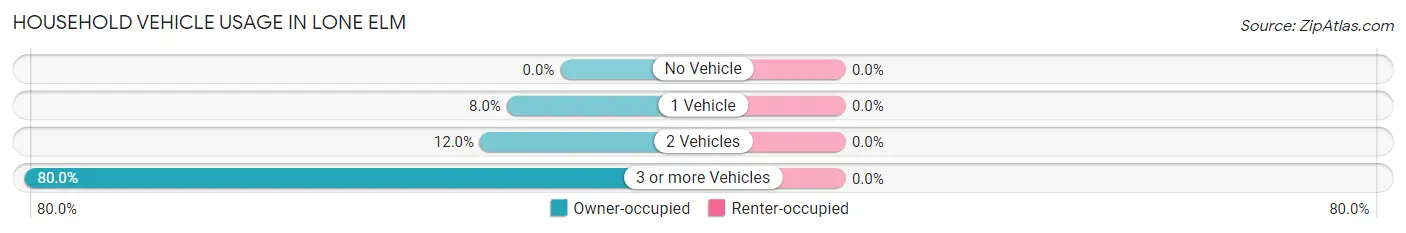
| Vehicles per Household | Owner-occupied | Renter-occupied |
| No Vehicle | 0 (0.0%) | 0 (0.0%) |
| 1 Vehicle | 2 (8.0%) | 0 (0.0%) |
| 2 Vehicles | 3 (12.0%) | 0 (0.0%) |
| 3 or more Vehicles | 20 (80.0%) | 0 (0.0%) |
| Total | 25 (100.0%) | 0 (0.0%) |
Real Estate & Mortgages in Lone Elm
Real Estate and Mortgage Overview in Lone Elm
| Characteristic | Without Mortgage | With Mortgage |
| Housing Units | 22 | 3 |
| Median Property Value | $28,100 | $0 |
| Median Household Income | $53,750 | $0 |
| Monthly Housing Costs | $131 | $0 |
| Real Estate Taxes | $199 | $0 |
Property Value by Mortgage Status in Lone Elm
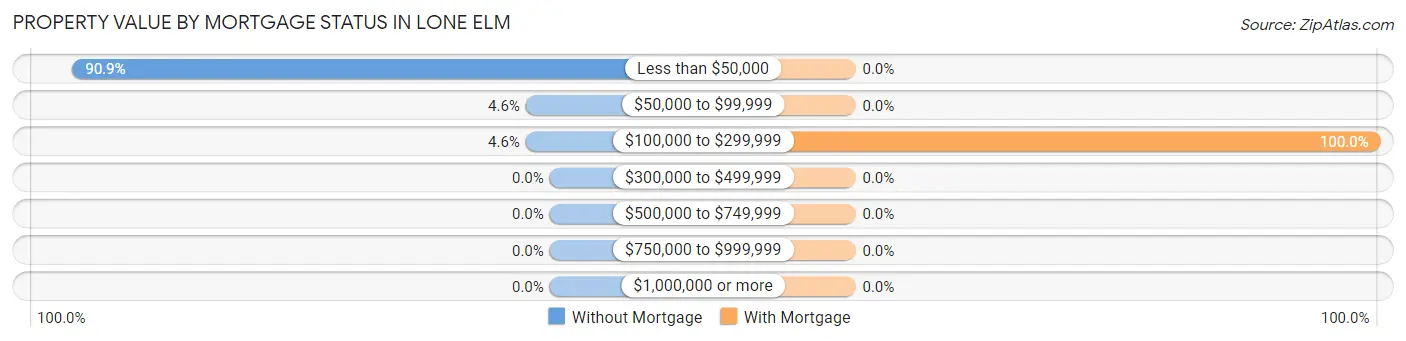
| Property Value | Without Mortgage | With Mortgage |
| Less than $50,000 | 20 (90.9%) | 0 (0.0%) |
| $50,000 to $99,999 | 1 (4.5%) | 0 (0.0%) |
| $100,000 to $299,999 | 1 (4.5%) | 3 (100.0%) |
| $300,000 to $499,999 | 0 (0.0%) | 0 (0.0%) |
| $500,000 to $749,999 | 0 (0.0%) | 0 (0.0%) |
| $750,000 to $999,999 | 0 (0.0%) | 0 (0.0%) |
| $1,000,000 or more | 0 (0.0%) | 0 (0.0%) |
| Total | 22 (100.0%) | 3 (100.0%) |
Household Income by Mortgage Status in Lone Elm
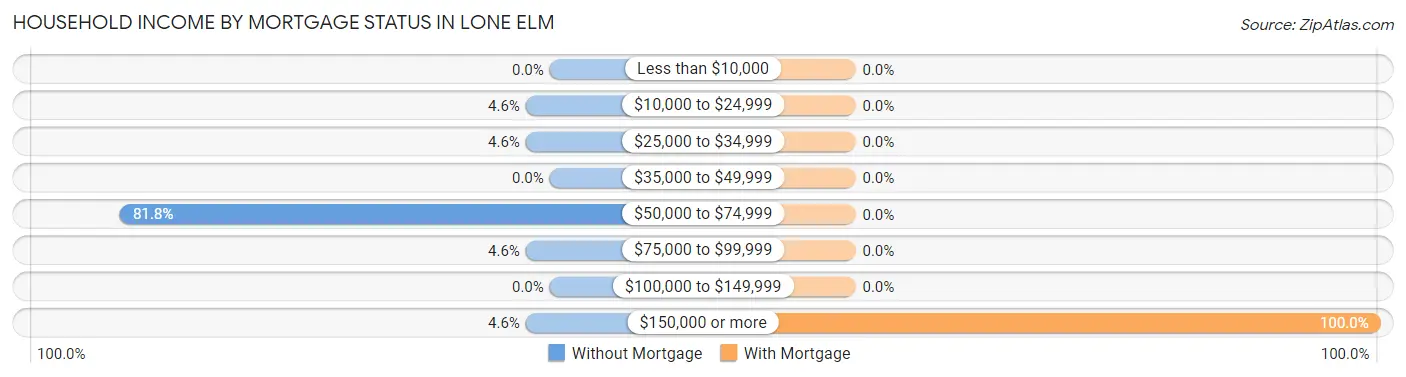
| Household Income | Without Mortgage | With Mortgage |
| Less than $10,000 | 0 (0.0%) | 0 (0.0%) |
| $10,000 to $24,999 | 1 (4.5%) | 0 (0.0%) |
| $25,000 to $34,999 | 1 (4.5%) | 0 (0.0%) |
| $35,000 to $49,999 | 0 (0.0%) | 0 (0.0%) |
| $50,000 to $74,999 | 18 (81.8%) | 0 (0.0%) |
| $75,000 to $99,999 | 1 (4.5%) | 0 (0.0%) |
| $100,000 to $149,999 | 0 (0.0%) | 0 (0.0%) |
| $150,000 or more | 1 (4.5%) | 3 (100.0%) |
| Total | 22 (100.0%) | 3 (100.0%) |
Property Value to Household Income Ratio in Lone Elm
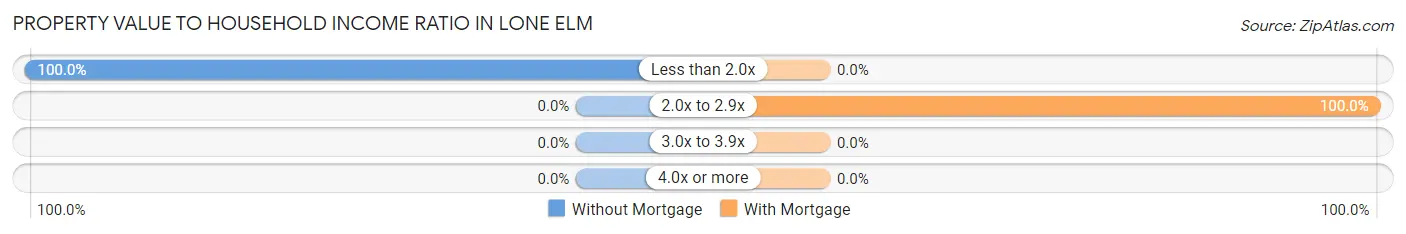
| Value-to-Income Ratio | Without Mortgage | With Mortgage |
| Less than 2.0x | 22 (100.0%) | 0 (0.0%) |
| 2.0x to 2.9x | 0 (0.0%) | 3 (100.0%) |
| 3.0x to 3.9x | 0 (0.0%) | 0 (0.0%) |
| 4.0x or more | 0 (0.0%) | 0 (0.0%) |
| Total | 22 (100.0%) | 3 (100.0%) |
Real Estate Taxes by Mortgage Status in Lone Elm
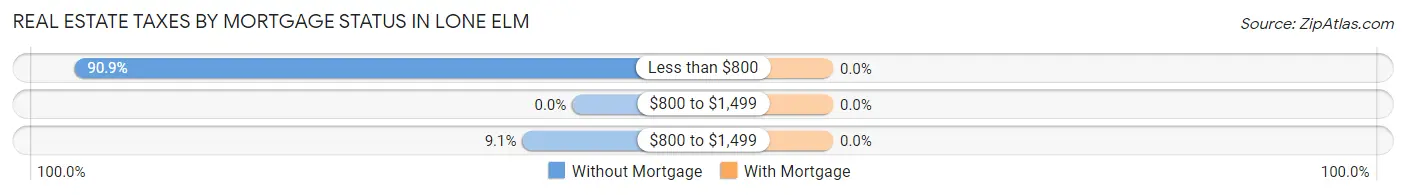
| Property Taxes | Without Mortgage | With Mortgage |
| Less than $800 | 20 (90.9%) | 0 (0.0%) |
| $800 to $1,499 | 0 (0.0%) | 0 (0.0%) |
| $800 to $1,499 | 2 (9.1%) | 0 (0.0%) |
| Total | 22 (100.0%) | 3 (100.0%) |
Health & Disability in Lone Elm
Health Insurance Coverage by Age in Lone Elm
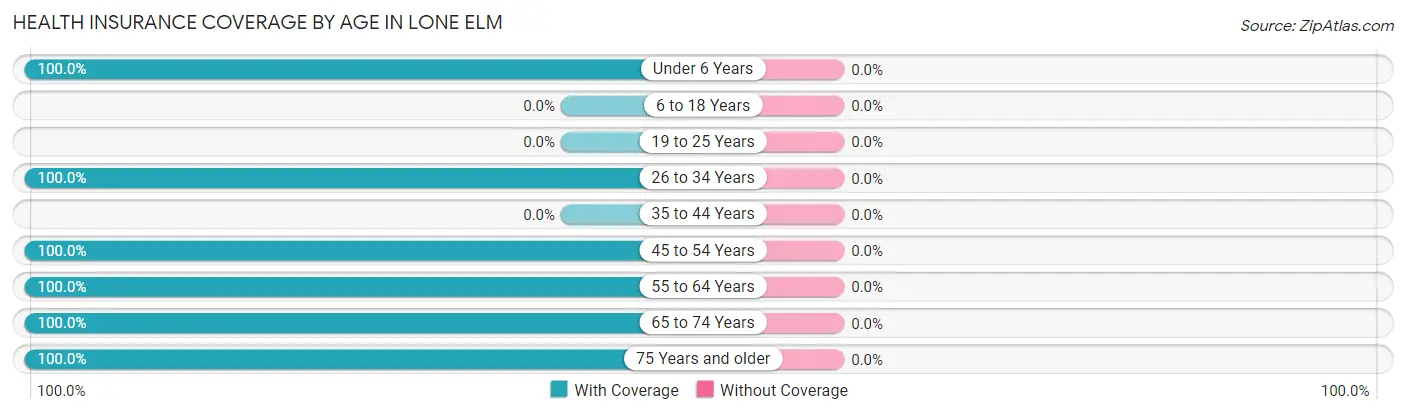
| Age Bracket | With Coverage | Without Coverage |
| Under 6 Years | 6 (100.0%) | 0 (0.0%) |
| 6 to 18 Years | 0 (0.0%) | 0 (0.0%) |
| 19 to 25 Years | 0 (0.0%) | 0 (0.0%) |
| 26 to 34 Years | 4 (100.0%) | 0 (0.0%) |
| 35 to 44 Years | 0 (0.0%) | 0 (0.0%) |
| 45 to 54 Years | 1 (100.0%) | 0 (0.0%) |
| 55 to 64 Years | 2 (100.0%) | 0 (0.0%) |
| 65 to 74 Years | 3 (100.0%) | 0 (0.0%) |
| 75 Years and older | 19 (100.0%) | 0 (0.0%) |
| Total | 35 (100.0%) | 0 (0.0%) |
Health Insurance Coverage by Citizenship Status in Lone Elm
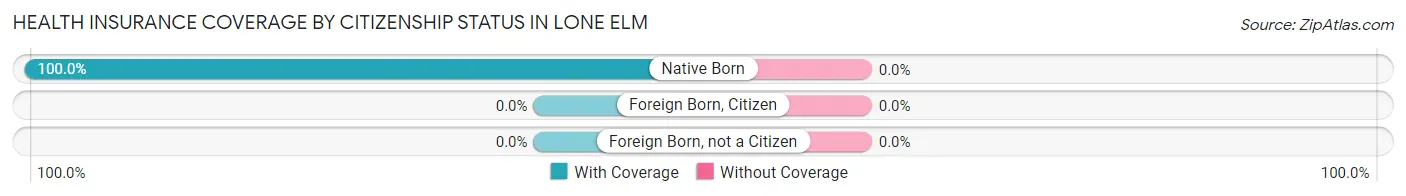
| Citizenship Status | With Coverage | Without Coverage |
| Native Born | 6 (100.0%) | 0 (0.0%) |
| Foreign Born, Citizen | 0 (0.0%) | 0 (0.0%) |
| Foreign Born, not a Citizen | 0 (0.0%) | 0 (0.0%) |
Health Insurance Coverage by Household Income in Lone Elm
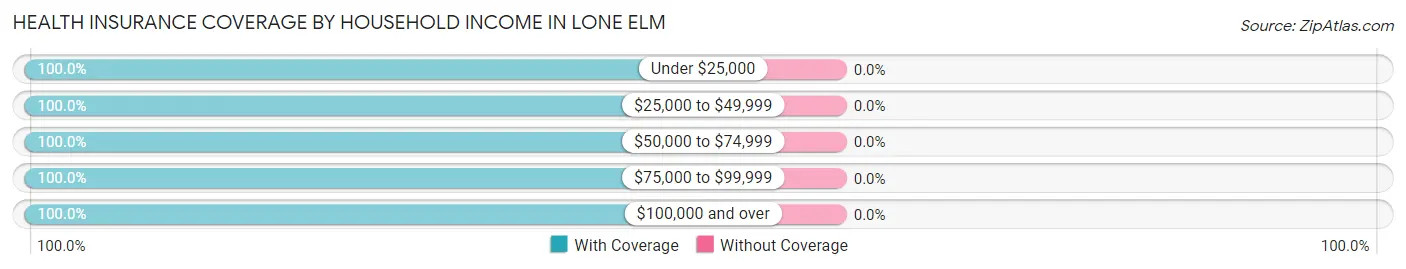
| Household Income | With Coverage | Without Coverage |
| Under $25,000 | 1 (100.0%) | 0 (0.0%) |
| $25,000 to $49,999 | 1 (100.0%) | 0 (0.0%) |
| $50,000 to $74,999 | 19 (100.0%) | 0 (0.0%) |
| $75,000 to $99,999 | 2 (100.0%) | 0 (0.0%) |
| $100,000 and over | 12 (100.0%) | 0 (0.0%) |
Public vs Private Health Insurance Coverage by Age in Lone Elm
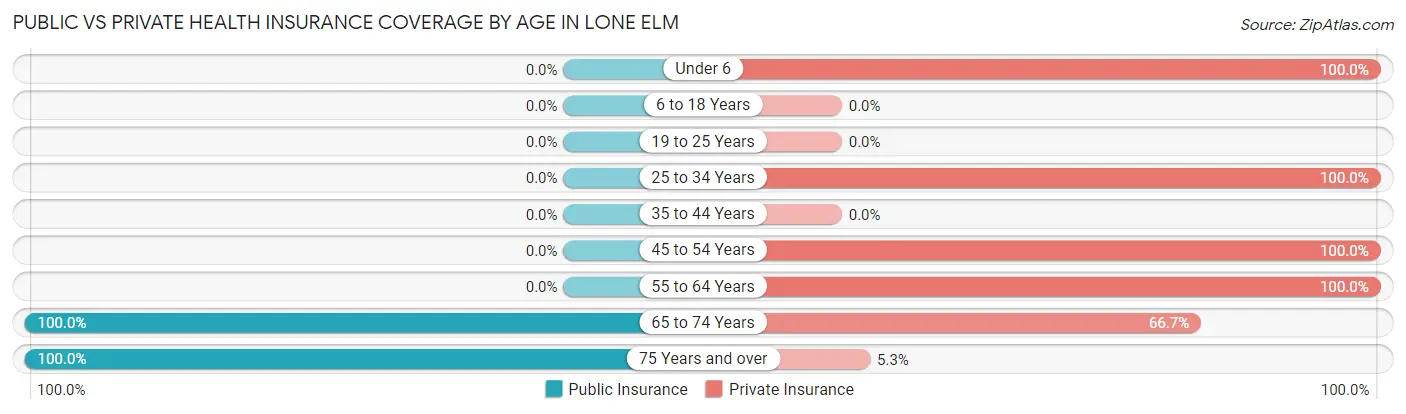
| Age Bracket | Public Insurance | Private Insurance |
| Under 6 | 0 (0.0%) | 6 (100.0%) |
| 6 to 18 Years | 0 (0.0%) | 0 (0.0%) |
| 19 to 25 Years | 0 (0.0%) | 0 (0.0%) |
| 25 to 34 Years | 0 (0.0%) | 4 (100.0%) |
| 35 to 44 Years | 0 (0.0%) | 0 (0.0%) |
| 45 to 54 Years | 0 (0.0%) | 1 (100.0%) |
| 55 to 64 Years | 0 (0.0%) | 2 (100.0%) |
| 65 to 74 Years | 3 (100.0%) | 2 (66.7%) |
| 75 Years and over | 19 (100.0%) | 1 (5.3%) |
| Total | 22 (62.9%) | 16 (45.7%) |
Disability Status by Sex by Age in Lone Elm
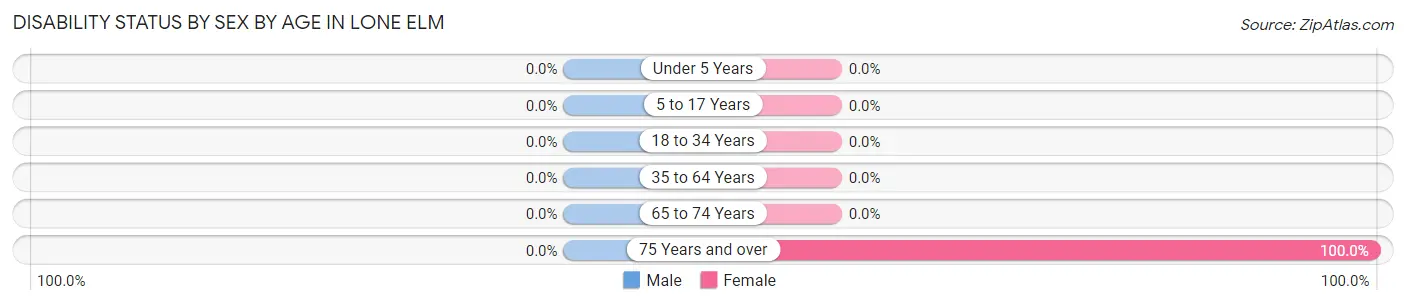
| Age Bracket | Male | Female |
| Under 5 Years | 0 (0.0%) | 0 (0.0%) |
| 5 to 17 Years | 0 (0.0%) | 0 (0.0%) |
| 18 to 34 Years | 0 (0.0%) | 0 (0.0%) |
| 35 to 64 Years | 0 (0.0%) | 0 (0.0%) |
| 65 to 74 Years | 0 (0.0%) | 0 (0.0%) |
| 75 Years and over | 0 (0.0%) | 1 (100.0%) |
Disability Class by Sex by Age in Lone Elm
Disability Class: Hearing Difficulty
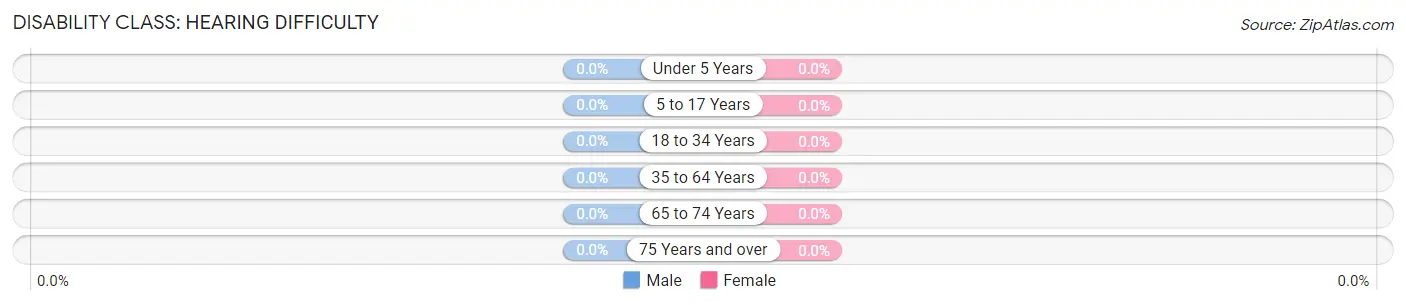
| Age Bracket | Male | Female |
| Under 5 Years | 0 (0.0%) | 0 (0.0%) |
| 5 to 17 Years | 0 (0.0%) | 0 (0.0%) |
| 18 to 34 Years | 0 (0.0%) | 0 (0.0%) |
| 35 to 64 Years | 0 (0.0%) | 0 (0.0%) |
| 65 to 74 Years | 0 (0.0%) | 0 (0.0%) |
| 75 Years and over | 0 (0.0%) | 0 (0.0%) |
Disability Class: Vision Difficulty
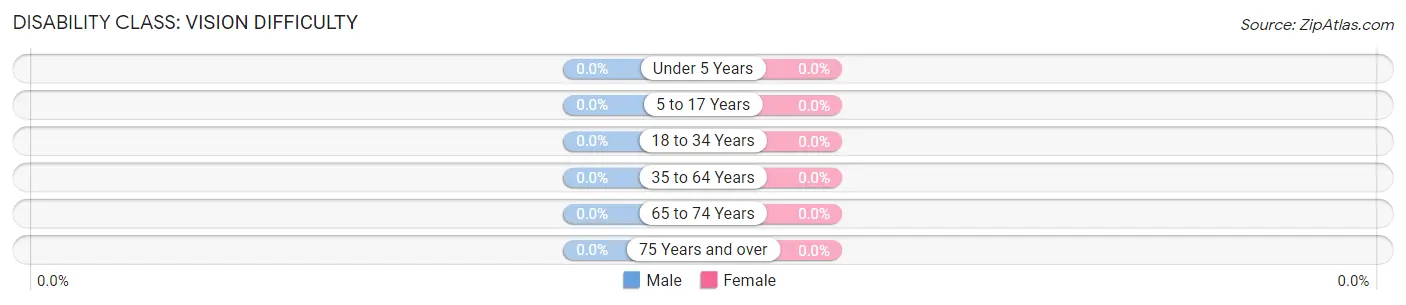
| Age Bracket | Male | Female |
| Under 5 Years | 0 (0.0%) | 0 (0.0%) |
| 5 to 17 Years | 0 (0.0%) | 0 (0.0%) |
| 18 to 34 Years | 0 (0.0%) | 0 (0.0%) |
| 35 to 64 Years | 0 (0.0%) | 0 (0.0%) |
| 65 to 74 Years | 0 (0.0%) | 0 (0.0%) |
| 75 Years and over | 0 (0.0%) | 0 (0.0%) |
Disability Class: Cognitive Difficulty
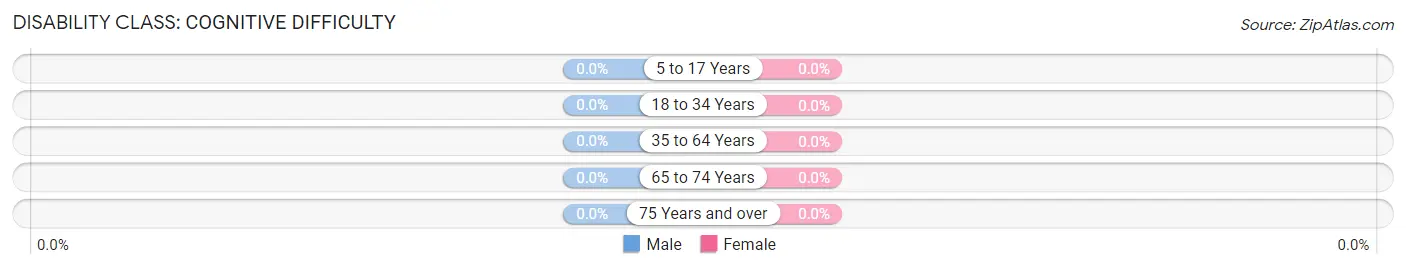
| Age Bracket | Male | Female |
| 5 to 17 Years | 0 (0.0%) | 0 (0.0%) |
| 18 to 34 Years | 0 (0.0%) | 0 (0.0%) |
| 35 to 64 Years | 0 (0.0%) | 0 (0.0%) |
| 65 to 74 Years | 0 (0.0%) | 0 (0.0%) |
| 75 Years and over | 0 (0.0%) | 0 (0.0%) |
Disability Class: Ambulatory Difficulty
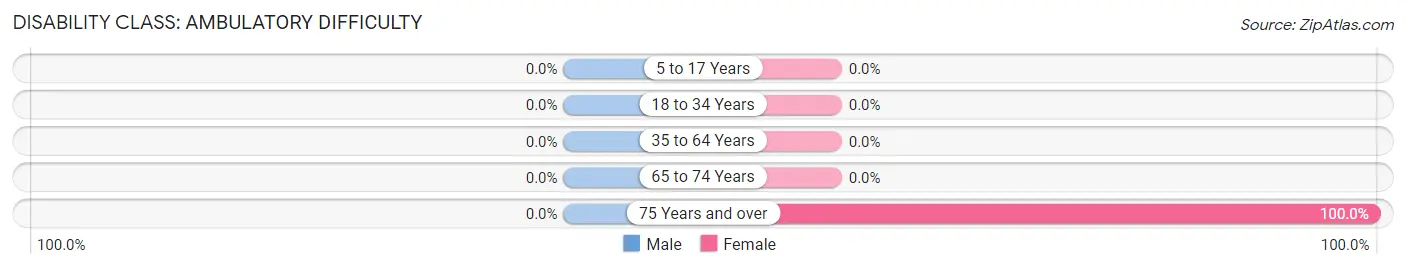
| Age Bracket | Male | Female |
| 5 to 17 Years | 0 (0.0%) | 0 (0.0%) |
| 18 to 34 Years | 0 (0.0%) | 0 (0.0%) |
| 35 to 64 Years | 0 (0.0%) | 0 (0.0%) |
| 65 to 74 Years | 0 (0.0%) | 0 (0.0%) |
| 75 Years and over | 0 (0.0%) | 1 (100.0%) |
Disability Class: Self-Care Difficulty
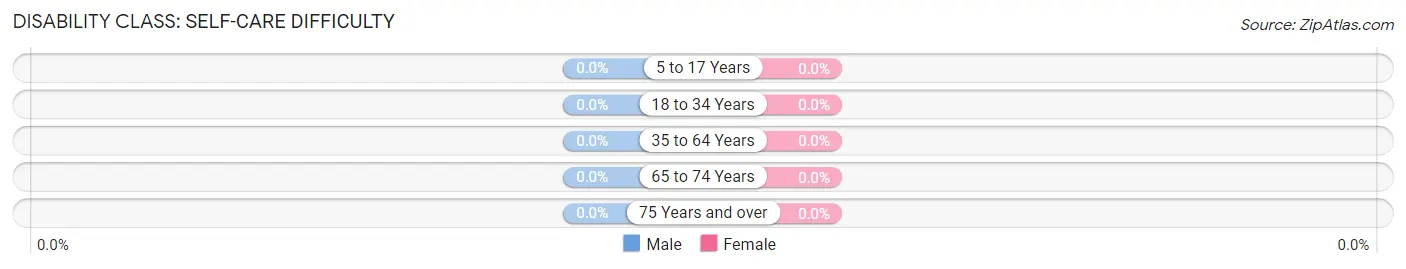
| Age Bracket | Male | Female |
| 5 to 17 Years | 0 (0.0%) | 0 (0.0%) |
| 18 to 34 Years | 0 (0.0%) | 0 (0.0%) |
| 35 to 64 Years | 0 (0.0%) | 0 (0.0%) |
| 65 to 74 Years | 0 (0.0%) | 0 (0.0%) |
| 75 Years and over | 0 (0.0%) | 0 (0.0%) |
Technology Access in Lone Elm
Computing Device Access in Lone Elm
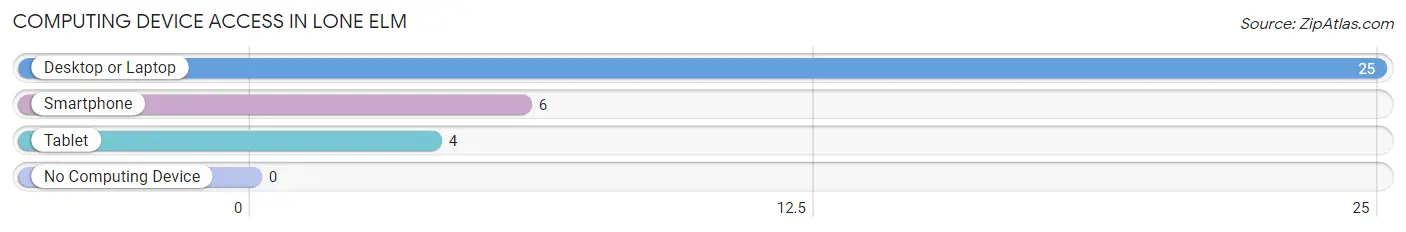
| Device Type | # Households | % Households |
| Desktop or Laptop | 25 | 100.0% |
| Smartphone | 6 | 24.0% |
| Tablet | 4 | 16.0% |
| No Computing Device | 0 | 0.0% |
| Total | 25 | 100.0% |
Internet Access in Lone Elm
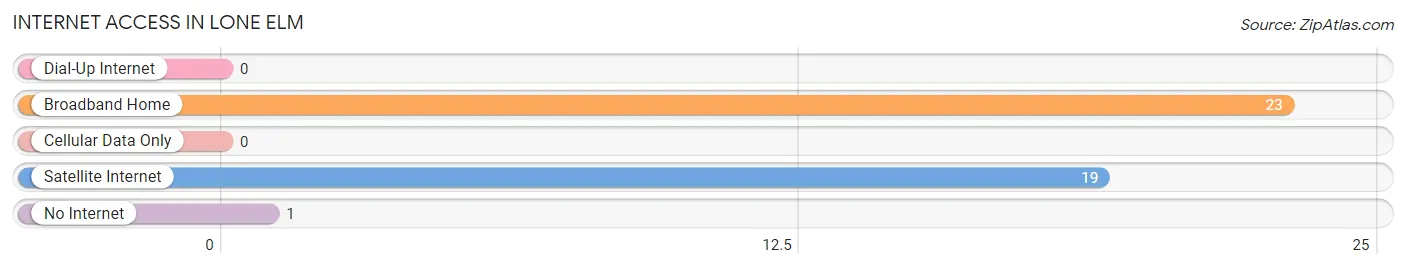
| Internet Type | # Households | % Households |
| Dial-Up Internet | 0 | 0.0% |
| Broadband Home | 23 | 92.0% |
| Cellular Data Only | 0 | 0.0% |
| Satellite Internet | 19 | 76.0% |
| No Internet | 1 | 4.0% |
| Total | 25 | 100.0% |
Lone Elm Summary
Lone Elm, Kansas is a small unincorporated community located in Johnson County, Kansas. The community is located approximately 10 miles south of Olathe, Kansas and is part of the Kansas City metropolitan area. The population of Lone Elm was estimated to be around 200 people in 2020.
History
Lone Elm was founded in 1857 by a group of settlers from Ohio. The settlers named the community after a large elm tree that stood alone in the area. The tree was used as a landmark for travelers and settlers. The community was originally a farming community and the main crops grown were corn, wheat, and hay.
In the late 1800s, the community began to grow and several businesses were established. These included a general store, a blacksmith shop, a post office, and a school. The school was built in 1887 and was the first school in the area.
In the early 1900s, the community began to decline as many of the settlers moved away. The post office closed in 1915 and the school closed in the 1930s. The population of Lone Elm decreased to around 50 people by the 1950s.
Geography
Lone Elm is located in Johnson County, Kansas. The community is situated in the rolling hills of the Osage Plains. The area is mostly rural and is home to several small farms. The nearest major city is Olathe, which is located approximately 10 miles to the north.
The climate in Lone Elm is typical of the Midwest. Summers are hot and humid, while winters are cold and snowy. The average annual temperature is around 50 degrees Fahrenheit.
Economy
The economy of Lone Elm is largely based on agriculture. The area is home to several small farms that grow corn, wheat, and hay. The community also has a few small businesses, including a general store and a gas station.
Demographics
The population of Lone Elm was estimated to be around 200 people in 2020. The racial makeup of the community is predominantly white, with a small percentage of African Americans and Hispanics. The median household income is around $50,000. The median age is around 40 years old.
Common Questions
What is Per Capita Income in Lone Elm?
Per Capita income in Lone Elm is $30,486.
What is the Median Family Income in Lone Elm?
Median Family Income in Lone Elm is $54,097.
What is the Median Household income in Lone Elm?
Median Household Income in Lone Elm is $53,958.
What is Income or Wage Gap in Lone Elm?
Income or Wage Gap in Lone Elm is 88.2%.
Women in Lone Elm earn 11.8 cents for every dollar earned by a man.
What is Inequality or Gini Index in Lone Elm?
Inequality or Gini Index in Lone Elm is 0.21.
What is the Total Population of Lone Elm?
Total Population of Lone Elm is 35.
What is the Total Male Population of Lone Elm?
Total Male Population of Lone Elm is 23.
What is the Total Female Population of Lone Elm?
Total Female Population of Lone Elm is 12.
What is the Ratio of Males per 100 Females in Lone Elm?
There are 191.67 Males per 100 Females in Lone Elm.
What is the Ratio of Females per 100 Males in Lone Elm?
There are 52.17 Females per 100 Males in Lone Elm.
What is the Median Population Age in Lone Elm?
Median Population Age in Lone Elm is 80.0 Years.
What is the Average Family Size in Lone Elm
Average Family Size in Lone Elm is 1.4 People.
What is the Average Household Size in Lone Elm
Average Household Size in Lone Elm is 1.4 People.
How Large is the Labor Force in Lone Elm?
There are 26 People in the Labor Forcein in Lone Elm.
What is the Percentage of People in the Labor Force in Lone Elm?
89.7% of People are in the Labor Force in Lone Elm.
What is the Unemployment Rate in Lone Elm?
Unemployment Rate in Lone Elm is 69.2%.