Zip Codes with the Highest Percentage of Population Employed in Health Diagnosing & Treating in Wichita, KS
RELATED REPORTS & OPTIONS
Health Diagnosing & Treating
Wichita
Compare Zip Codes
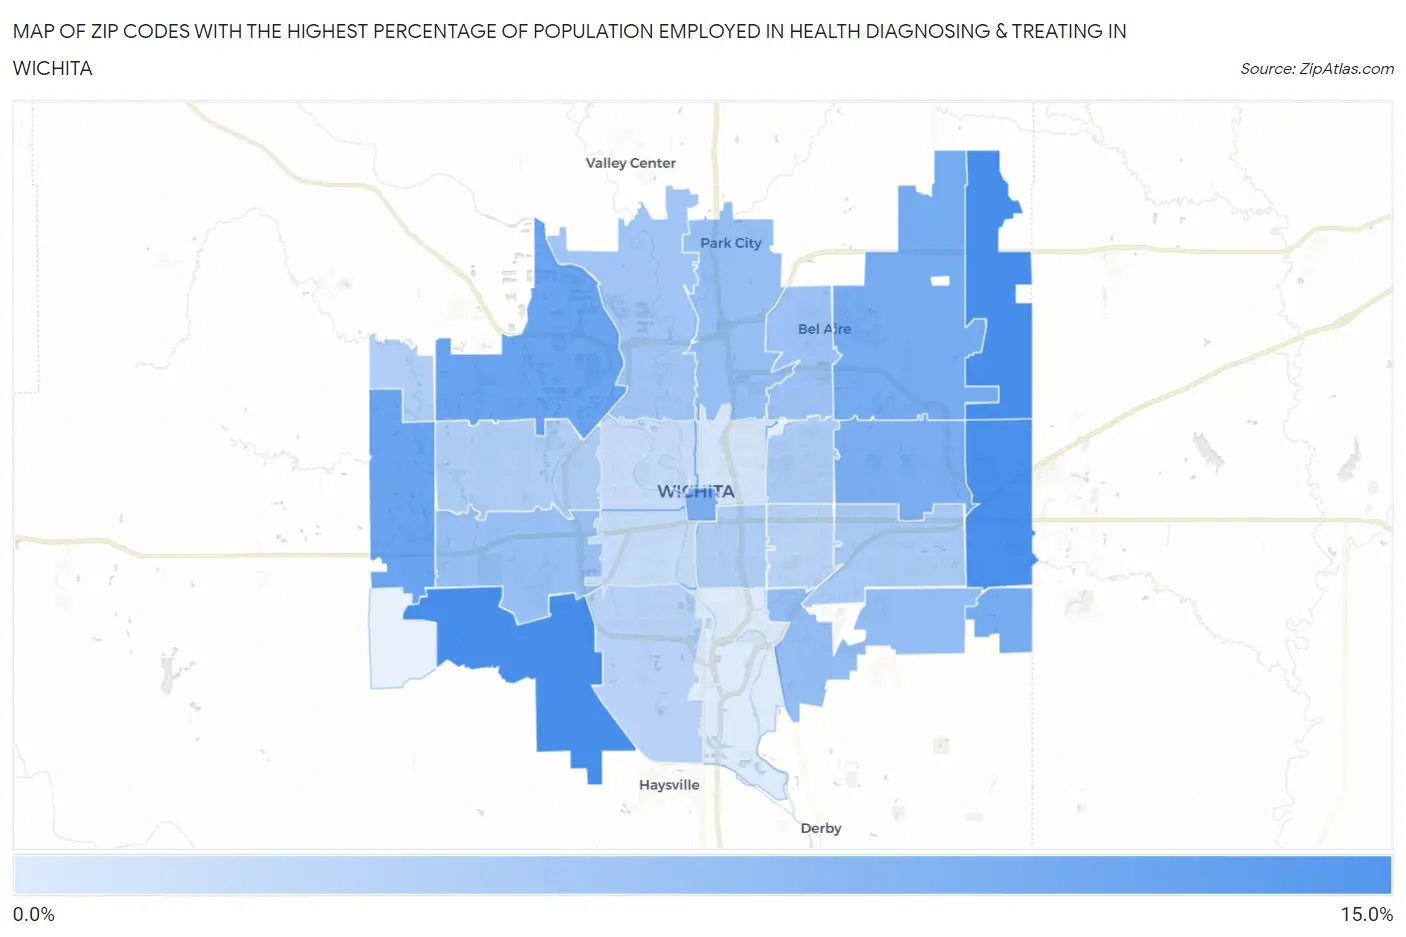
Map of Zip Codes with the Highest Percentage of Population Employed in Health Diagnosing & Treating in Wichita
2.2%
12.7%
Zip Codes with the Highest Percentage of Population Employed in Health Diagnosing & Treating in Wichita, KS
| Zip Code | % Employed | vs State | vs National | |
| 1. | 67228 | 12.7% | 6.6%(+6.14)#43 | 6.2%(+6.49)#1,851 |
| 2. | 67215 | 12.7% | 6.6%(+6.13)#44 | 6.2%(+6.48)#1,857 |
| 3. | 67230 | 12.5% | 6.6%(+5.94)#47 | 6.2%(+6.29)#1,936 |
| 4. | 67205 | 10.3% | 6.6%(+3.69)#85 | 6.2%(+4.04)#3,554 |
| 5. | 67235 | 10.2% | 6.6%(+3.57)#89 | 6.2%(+3.93)#3,671 |
| 6. | 67226 | 9.4% | 6.6%(+2.78)#115 | 6.2%(+3.13)#4,719 |
| 7. | 67232 | 9.3% | 6.6%(+2.74)#117 | 6.2%(+3.09)#4,801 |
| 8. | 67202 | 9.2% | 6.6%(+2.64)#123 | 6.2%(+3.00)#4,962 |
| 9. | 67206 | 9.1% | 6.6%(+2.46)#128 | 6.2%(+2.81)#5,273 |
| 10. | 67210 | 7.2% | 6.6%(+0.649)#212 | 6.2%(+1.000)#9,584 |
| 11. | 67219 | 7.1% | 6.6%(+0.536)#216 | 6.2%(+0.886)#9,937 |
| 12. | 67209 | 6.9% | 6.6%(+0.288)#229 | 6.2%(+0.639)#10,737 |
| 13. | 67220 | 6.5% | 6.6%(-0.056)#253 | 6.2%(+0.295)#11,886 |
| 14. | 67204 | 6.3% | 6.6%(-0.304)#268 | 6.2%(+0.046)#12,787 |
| 15. | 67207 | 5.9% | 6.6%(-0.735)#302 | 6.2%(-0.384)#14,380 |
| 16. | 67208 | 5.7% | 6.6%(-0.896)#314 | 6.2%(-0.545)#14,995 |
| 17. | 67211 | 5.3% | 6.6%(-1.25)#340 | 6.2%(-0.896)#16,368 |
| 18. | 67212 | 5.3% | 6.6%(-1.30)#341 | 6.2%(-0.944)#16,554 |
| 19. | 67223 | 5.2% | 6.6%(-1.44)#354 | 6.2%(-1.09)#17,088 |
| 20. | 67217 | 4.6% | 6.6%(-1.97)#390 | 6.2%(-1.62)#19,145 |
| 21. | 67218 | 4.6% | 6.6%(-1.99)#393 | 6.2%(-1.64)#19,218 |
| 22. | 67213 | 3.7% | 6.6%(-2.86)#444 | 6.2%(-2.51)#22,184 |
| 23. | 67203 | 3.6% | 6.6%(-3.03)#462 | 6.2%(-2.68)#22,717 |
| 24. | 67214 | 2.8% | 6.6%(-3.79)#515 | 6.2%(-3.43)#24,794 |
| 25. | 67216 | 2.2% | 6.6%(-4.42)#541 | 6.2%(-4.07)#26,171 |
1
Common Questions
What are the Top 10 Zip Codes with the Highest Percentage of Population Employed in Health Diagnosing & Treating in Wichita, KS?
Top 10 Zip Codes with the Highest Percentage of Population Employed in Health Diagnosing & Treating in Wichita, KS are:
What zip code has the Highest Percentage of Population Employed in Health Diagnosing & Treating in Wichita, KS?
67228 has the Highest Percentage of Population Employed in Health Diagnosing & Treating in Wichita, KS with 12.7%.
What is the Percentage of Population Employed in Health Diagnosing & Treating in Wichita, KS?
Percentage of Population Employed in Health Diagnosing & Treating in Wichita is 6.2%.
What is the Percentage of Population Employed in Health Diagnosing & Treating in Kansas?
Percentage of Population Employed in Health Diagnosing & Treating in Kansas is 6.6%.
What is the Percentage of Population Employed in Health Diagnosing & Treating in the United States?
Percentage of Population Employed in Health Diagnosing & Treating in the United States is 6.2%.