Olmitz, KS Map & Demographics
Olmitz Map
Olmitz Overview
$31,856
PER CAPITA INCOME
$88,036
AVG FAMILY INCOME
$44,583
AVG HOUSEHOLD INCOME
0.32
INEQUALITY / GINI INDEX
90
TOTAL POPULATION
54
MALE POPULATION
36
FEMALE POPULATION
150.00
MALES / 100 FEMALES
66.67
FEMALES / 100 MALES
57.6
MEDIAN AGE
2.9
AVG FAMILY SIZE
1.9
AVG HOUSEHOLD SIZE
48
LABOR FORCE [ PEOPLE ]
55.8%
PERCENT IN LABOR FORCE
Olmitz Zip Codes
Olmitz Area Codes
Income in Olmitz
Income Overview in Olmitz
Per Capita Income in Olmitz is $31,856, while median incomes of families and households are $88,036 and $44,583 respectively.
| Characteristic | Number | Measure |
| Per Capita Income | 90 | $31,856 |
| Median Family Income | 19 | $88,036 |
| Mean Family Income | 19 | $88,463 |
| Median Household Income | 48 | $44,583 |
| Mean Household Income | 48 | $54,065 |
| Income Deficit | 19 | $0 |
| Wage / Income Gap (%) | 90 | 0.00% |
| Wage / Income Gap ($) | 90 | 100.00¢ per $1 |
| Gini / Inequality Index | 90 | 0.32 |
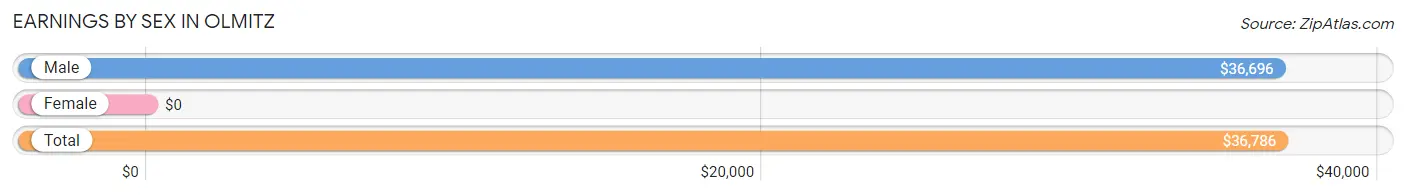
Earnings by Sex in Olmitz
| Sex | Number | Average Earnings |
| Male | 31 (64.6%) | $36,696 |
| Female | 17 (35.4%) | $0 |
| Total | 48 (100.0%) | $36,786 |
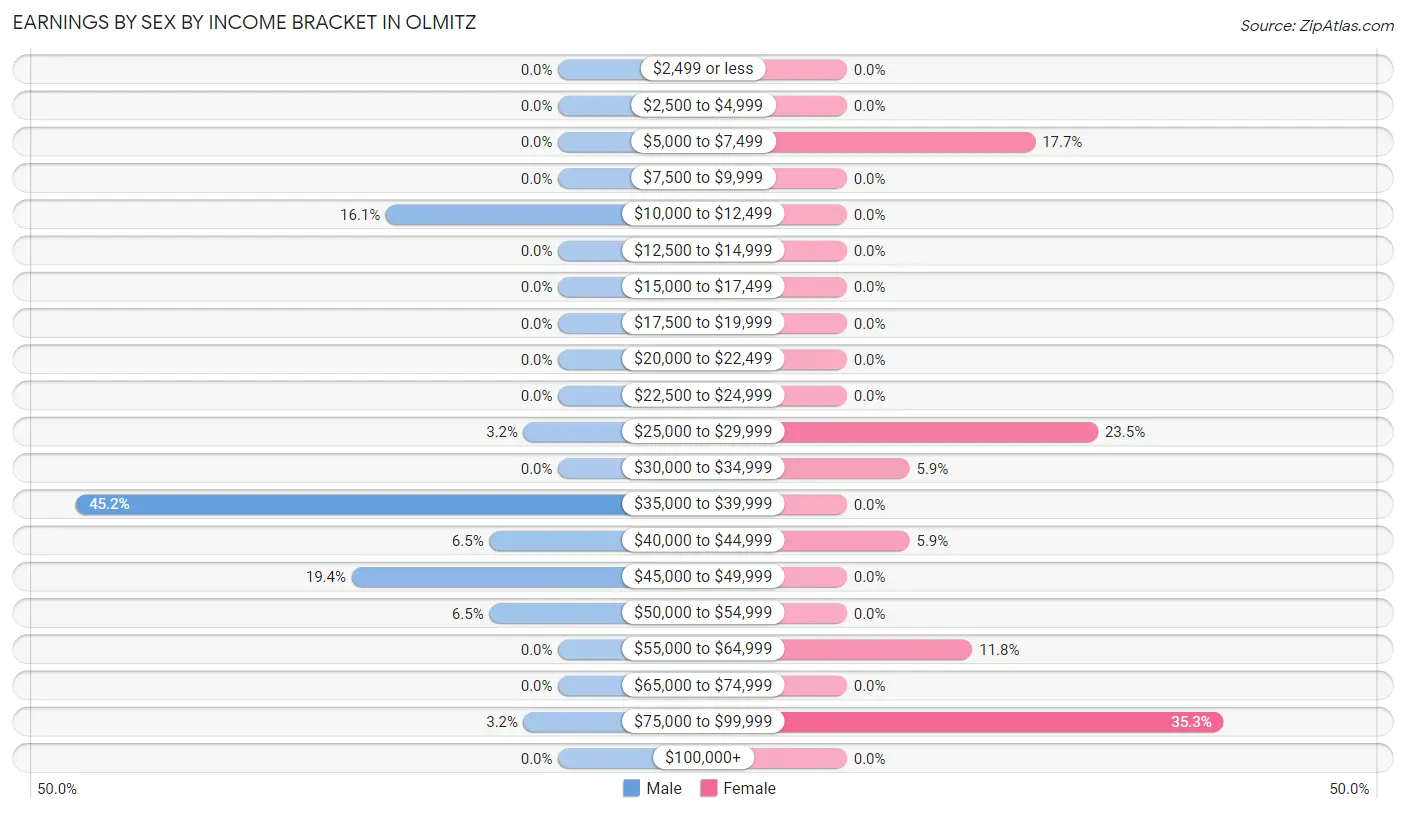
Earnings by Sex by Income Bracket in Olmitz
The most common earnings brackets in Olmitz are $35,000 to $39,999 for men (14 | 45.2%) and $75,000 to $99,999 for women (6 | 35.3%).
| Income | Male | Female |
| $2,499 or less | 0 (0.0%) | 0 (0.0%) |
| $2,500 to $4,999 | 0 (0.0%) | 0 (0.0%) |
| $5,000 to $7,499 | 0 (0.0%) | 3 (17.6%) |
| $7,500 to $9,999 | 0 (0.0%) | 0 (0.0%) |
| $10,000 to $12,499 | 5 (16.1%) | 0 (0.0%) |
| $12,500 to $14,999 | 0 (0.0%) | 0 (0.0%) |
| $15,000 to $17,499 | 0 (0.0%) | 0 (0.0%) |
| $17,500 to $19,999 | 0 (0.0%) | 0 (0.0%) |
| $20,000 to $22,499 | 0 (0.0%) | 0 (0.0%) |
| $22,500 to $24,999 | 0 (0.0%) | 0 (0.0%) |
| $25,000 to $29,999 | 1 (3.2%) | 4 (23.5%) |
| $30,000 to $34,999 | 0 (0.0%) | 1 (5.9%) |
| $35,000 to $39,999 | 14 (45.2%) | 0 (0.0%) |
| $40,000 to $44,999 | 2 (6.5%) | 1 (5.9%) |
| $45,000 to $49,999 | 6 (19.4%) | 0 (0.0%) |
| $50,000 to $54,999 | 2 (6.5%) | 0 (0.0%) |
| $55,000 to $64,999 | 0 (0.0%) | 2 (11.8%) |
| $65,000 to $74,999 | 0 (0.0%) | 0 (0.0%) |
| $75,000 to $99,999 | 1 (3.2%) | 6 (35.3%) |
| $100,000+ | 0 (0.0%) | 0 (0.0%) |
| Total | 31 (100.0%) | 17 (100.0%) |
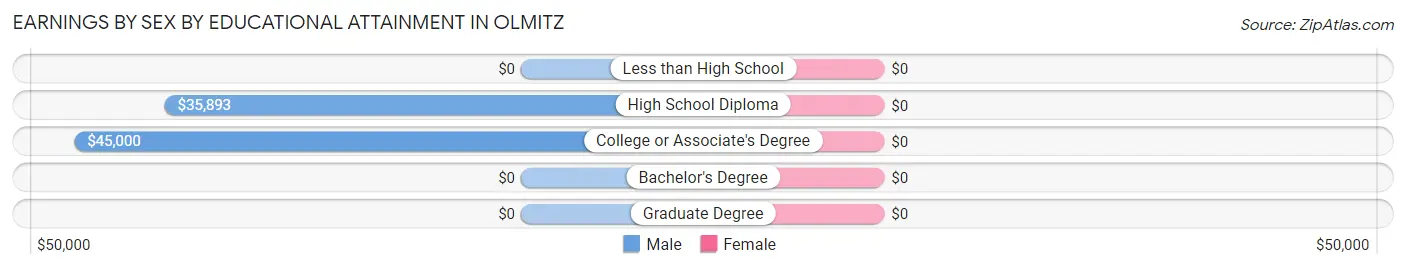
Earnings by Sex by Educational Attainment in Olmitz
| Educational Attainment | Male Income | Female Income |
| Less than High School | - | - |
| High School Diploma | $35,893 | $0 |
| College or Associate's Degree | $45,000 | $0 |
| Bachelor's Degree | - | - |
| Graduate Degree | - | - |
| Total | $36,696 | $0 |
Family Income in Olmitz
Family Income Brackets in Olmitz
According to the Olmitz family income data, there are 11 families falling into the $75,000 to $99,999 income range, which is the most common income bracket and makes up 57.9% of all families.
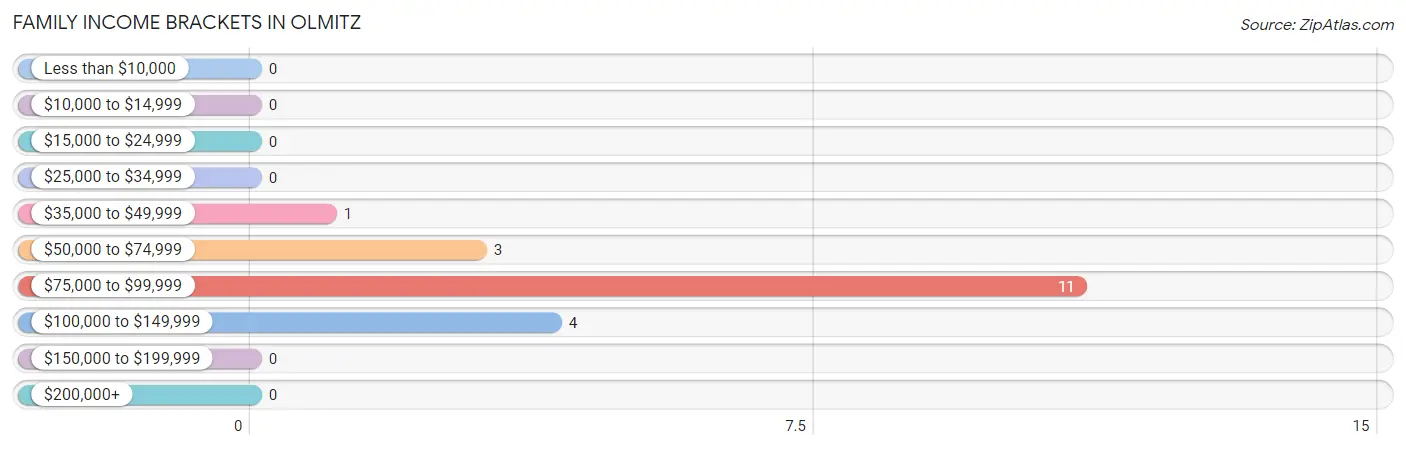
| Income Bracket | # Families | % Families |
| Less than $10,000 | 0 | 0.0% |
| $10,000 to $14,999 | 0 | 0.0% |
| $15,000 to $24,999 | 0 | 0.0% |
| $25,000 to $34,999 | 0 | 0.0% |
| $35,000 to $49,999 | 1 | 5.3% |
| $50,000 to $74,999 | 3 | 15.8% |
| $75,000 to $99,999 | 11 | 57.9% |
| $100,000 to $149,999 | 4 | 21.1% |
| $150,000 to $199,999 | 0 | 0.0% |
| $200,000+ | 0 | 0.0% |
Family Income by Famaliy Size in Olmitz
2-person families (12 | 63.2%) account for the highest median family income in Olmitz with $88,571 per family, while 2-person families (12 | 63.2%) have the highest median income of $44,286 per family member.
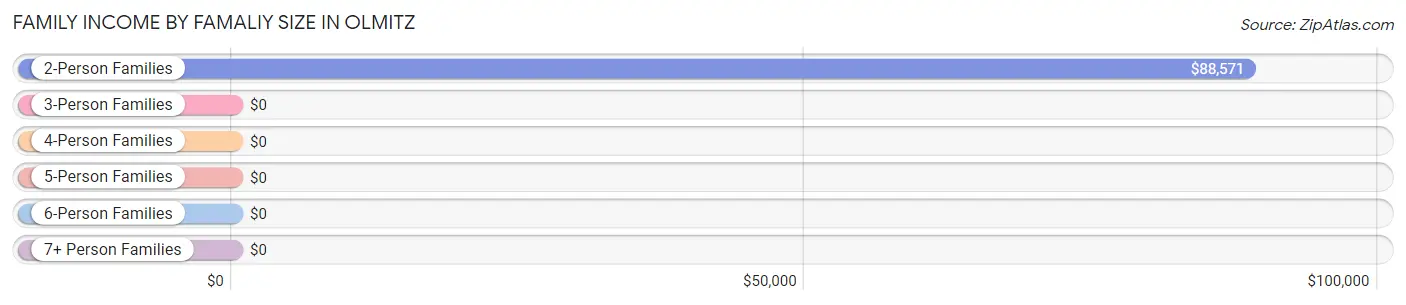
| Income Bracket | # Families | Median Income |
| 2-Person Families | 12 (63.2%) | $88,571 |
| 3-Person Families | 6 (31.6%) | $0 |
| 4-Person Families | 1 (5.3%) | $0 |
| 5-Person Families | 0 (0.0%) | $0 |
| 6-Person Families | 0 (0.0%) | $0 |
| 7+ Person Families | 0 (0.0%) | $0 |
| Total | 19 (100.0%) | $88,036 |
Family Income by Number of Earners in Olmitz
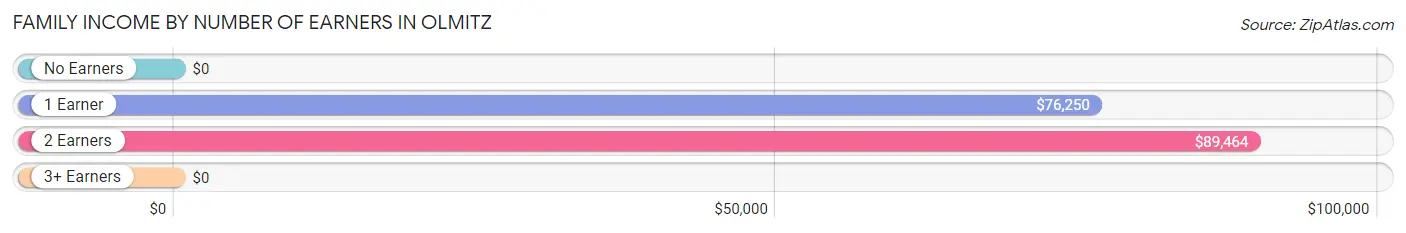
| Number of Earners | # Families | Median Income |
| No Earners | 0 (0.0%) | $0 |
| 1 Earner | 8 (42.1%) | $76,250 |
| 2 Earners | 11 (57.9%) | $89,464 |
| 3+ Earners | 0 (0.0%) | $0 |
| Total | 19 (100.0%) | $88,036 |
Household Income in Olmitz
Household Income Brackets in Olmitz
With 13 households falling in the category, the $25,000 to $34,999 income range is the most frequent in Olmitz, accounting for 27.1% of all households.
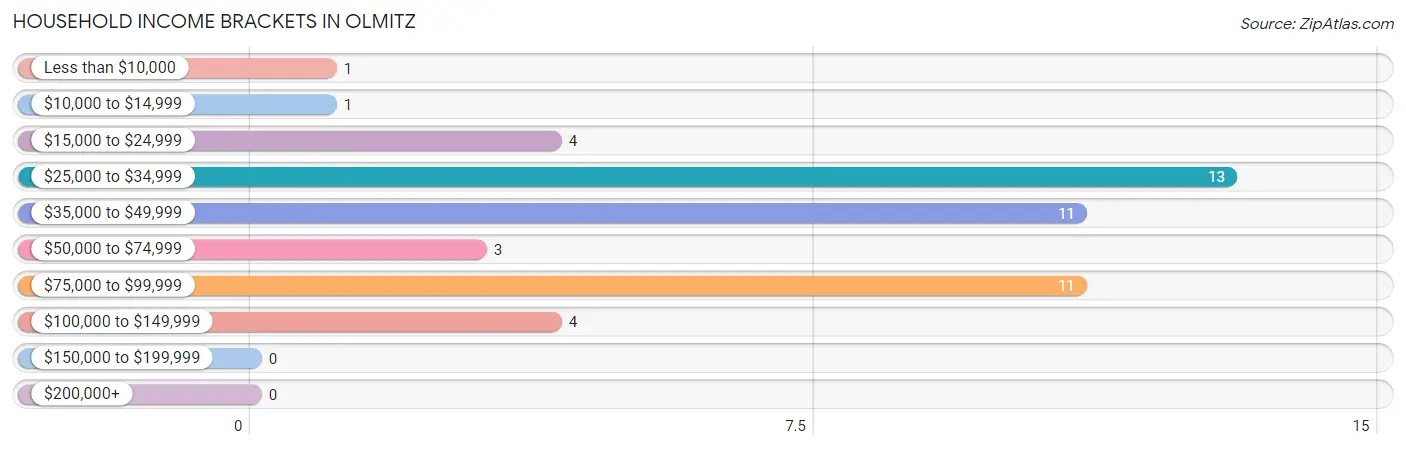
| Income Bracket | # Households | % Households |
| Less than $10,000 | 1 | 2.1% |
| $10,000 to $14,999 | 1 | 2.1% |
| $15,000 to $24,999 | 4 | 8.3% |
| $25,000 to $34,999 | 13 | 27.1% |
| $35,000 to $49,999 | 11 | 22.9% |
| $50,000 to $74,999 | 3 | 6.3% |
| $75,000 to $99,999 | 11 | 22.9% |
| $100,000 to $149,999 | 4 | 8.3% |
| $150,000 to $199,999 | 0 | 0.0% |
| $200,000+ | 0 | 0.0% |
Household Income by Householder Age in Olmitz
The median household income in Olmitz is $44,583, with the highest median household income of $75,000 found in the 45 to 64 years age bracket for the primary householder. A total of 18 households (37.5%) fall into this category.
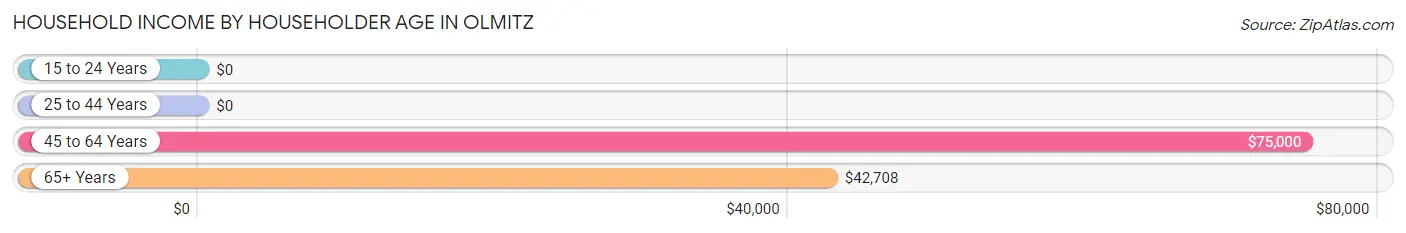
| Income Bracket | # Households | Median Income |
| 15 to 24 Years | 0 (0.0%) | $0 |
| 25 to 44 Years | 7 (14.6%) | $0 |
| 45 to 64 Years | 18 (37.5%) | $75,000 |
| 65+ Years | 23 (47.9%) | $42,708 |
| Total | 48 (100.0%) | $44,583 |
Poverty in Olmitz
Income Below Poverty by Sex and Age in Olmitz
With 1.8% poverty level for males and 16.7% for females among the residents of Olmitz, 55 to 64 year old males and 35 to 44 year old females are the most vulnerable to poverty, with 1 males (7.1%) and 6 females (100.0%) in their respective age groups living below the poverty level.
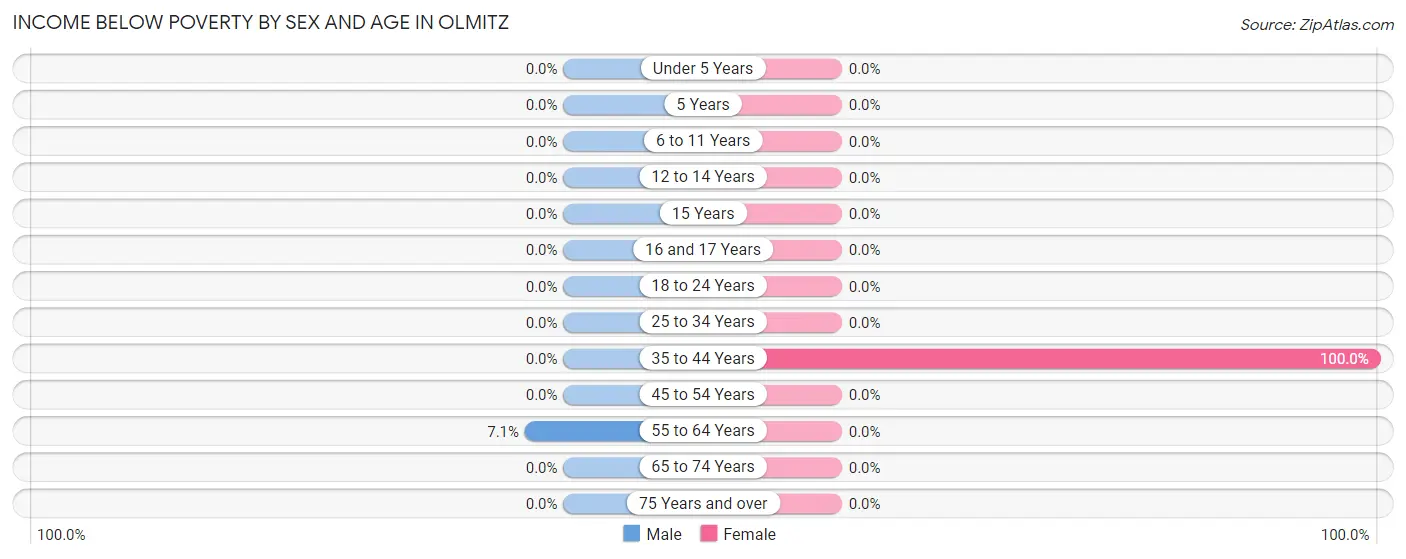
| Age Bracket | Male | Female |
| Under 5 Years | 0 (0.0%) | 0 (0.0%) |
| 5 Years | 0 (0.0%) | 0 (0.0%) |
| 6 to 11 Years | 0 (0.0%) | 0 (0.0%) |
| 12 to 14 Years | 0 (0.0%) | 0 (0.0%) |
| 15 Years | 0 (0.0%) | 0 (0.0%) |
| 16 and 17 Years | 0 (0.0%) | 0 (0.0%) |
| 18 to 24 Years | 0 (0.0%) | 0 (0.0%) |
| 25 to 34 Years | 0 (0.0%) | 0 (0.0%) |
| 35 to 44 Years | 0 (0.0%) | 6 (100.0%) |
| 45 to 54 Years | 0 (0.0%) | 0 (0.0%) |
| 55 to 64 Years | 1 (7.1%) | 0 (0.0%) |
| 65 to 74 Years | 0 (0.0%) | 0 (0.0%) |
| 75 Years and over | 0 (0.0%) | 0 (0.0%) |
| Total | 1 (1.8%) | 6 (16.7%) |
Income Above Poverty by Sex and Age in Olmitz
According to the poverty statistics in Olmitz, males aged 6 to 11 years and females aged under 5 years are the age groups that are most secure financially, with 100.0% of males and 100.0% of females in these age groups living above the poverty line.
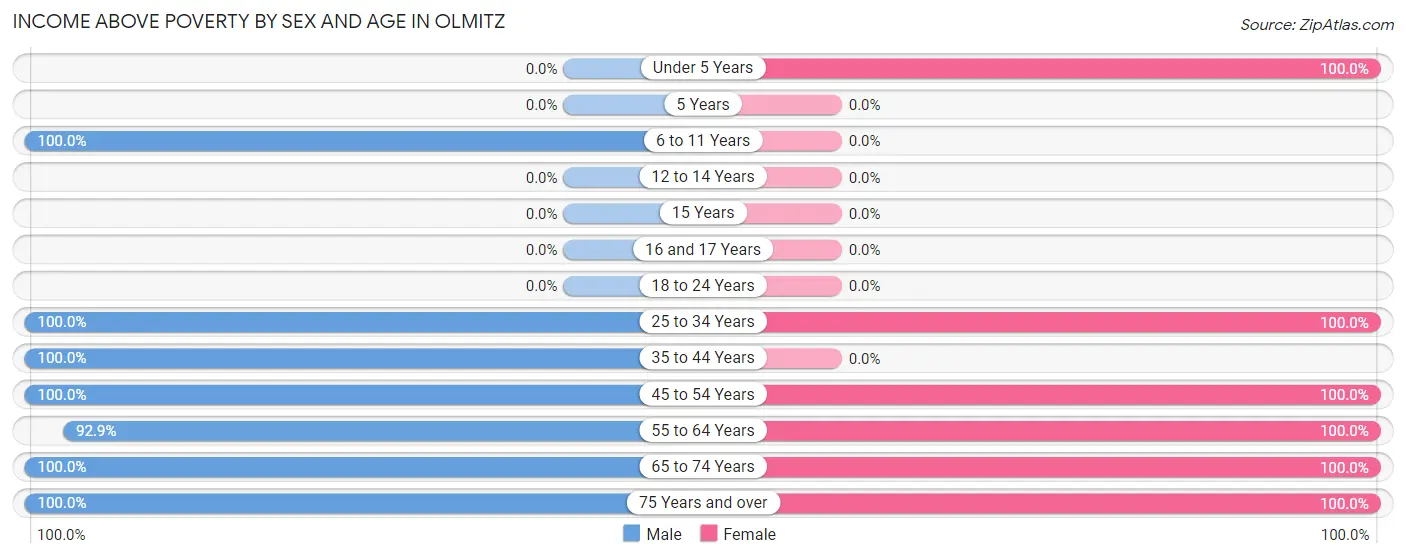
| Age Bracket | Male | Female |
| Under 5 Years | 0 (0.0%) | 1 (100.0%) |
| 5 Years | 0 (0.0%) | 0 (0.0%) |
| 6 to 11 Years | 3 (100.0%) | 0 (0.0%) |
| 12 to 14 Years | 0 (0.0%) | 0 (0.0%) |
| 15 Years | 0 (0.0%) | 0 (0.0%) |
| 16 and 17 Years | 0 (0.0%) | 0 (0.0%) |
| 18 to 24 Years | 0 (0.0%) | 0 (0.0%) |
| 25 to 34 Years | 2 (100.0%) | 3 (100.0%) |
| 35 to 44 Years | 4 (100.0%) | 0 (0.0%) |
| 45 to 54 Years | 15 (100.0%) | 2 (100.0%) |
| 55 to 64 Years | 13 (92.9%) | 15 (100.0%) |
| 65 to 74 Years | 6 (100.0%) | 8 (100.0%) |
| 75 Years and over | 10 (100.0%) | 1 (100.0%) |
| Total | 53 (98.2%) | 30 (83.3%) |
Income Below Poverty Among Married-Couple Families in Olmitz
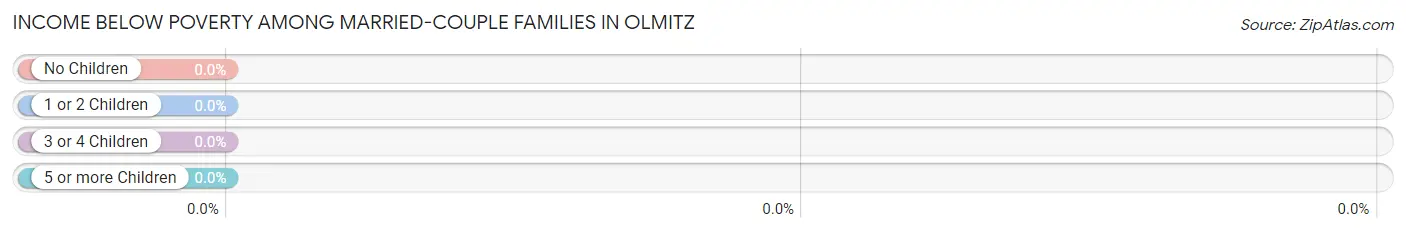
| Children | Above Poverty | Below Poverty |
| No Children | 16 (100.0%) | 0 (0.0%) |
| 1 or 2 Children | 3 (100.0%) | 0 (0.0%) |
| 3 or 4 Children | 0 (0.0%) | 0 (0.0%) |
| 5 or more Children | 0 (0.0%) | 0 (0.0%) |
| Total | 19 (100.0%) | 0 (0.0%) |
Income Below Poverty Among Single-Parent Households in Olmitz
| Children | Single Father | Single Mother |
| No Children | 0 (0.0%) | 0 (0.0%) |
| 1 or 2 Children | 0 (0.0%) | 0 (0.0%) |
| 3 or 4 Children | 0 (0.0%) | 0 (0.0%) |
| 5 or more Children | 0 (0.0%) | 0 (0.0%) |
| Total | 0 (0.0%) | 0 (0.0%) |
Income Below Poverty Among Married-Couple vs Single-Parent Households in Olmitz
| Children | Married-Couple Families | Single-Parent Households |
| No Children | 0 (0.0%) | 0 (0.0%) |
| 1 or 2 Children | 0 (0.0%) | 0 (0.0%) |
| 3 or 4 Children | 0 (0.0%) | 0 (0.0%) |
| 5 or more Children | 0 (0.0%) | 0 (0.0%) |
| Total | 0 (0.0%) | 0 (0.0%) |
Race in Olmitz
The most populous races in Olmitz are White / Caucasian (86 | 95.6%), Hispanic or Latino (3 | 3.3%), and Native / Alaskan (2 | 2.2%).
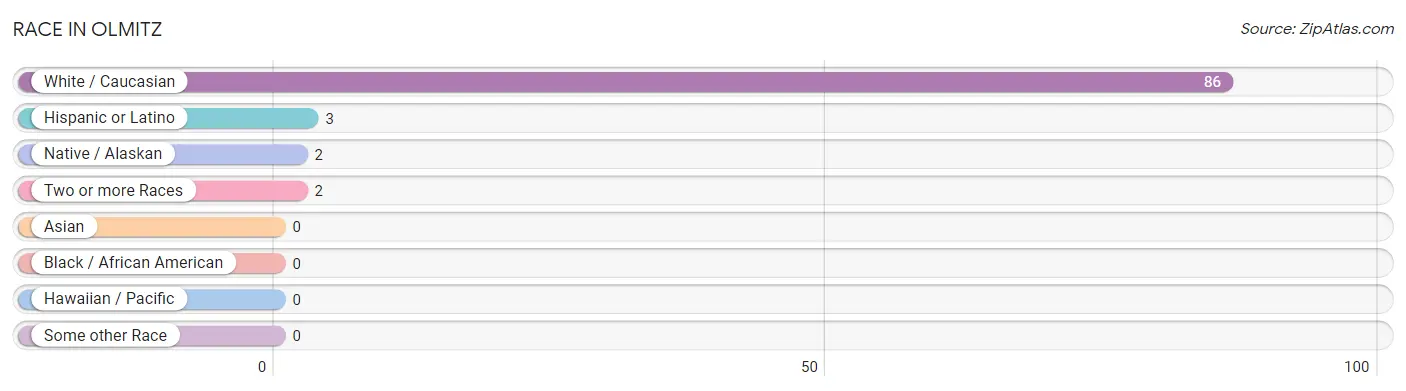
| Race | # Population | % Population |
| Asian | 0 | 0.0% |
| Black / African American | 0 | 0.0% |
| Hawaiian / Pacific | 0 | 0.0% |
| Hispanic or Latino | 3 | 3.3% |
| Native / Alaskan | 2 | 2.2% |
| White / Caucasian | 86 | 95.6% |
| Two or more Races | 2 | 2.2% |
| Some other Race | 0 | 0.0% |
| Total | 90 | 100.0% |
Ancestry in Olmitz
The most populous ancestries reported in Olmitz are German (17 | 18.9%), English (7 | 7.8%), Irish (4 | 4.4%), Potawatomi (4 | 4.4%), and Mexican (3 | 3.3%), together accounting for 38.9% of all Olmitz residents.
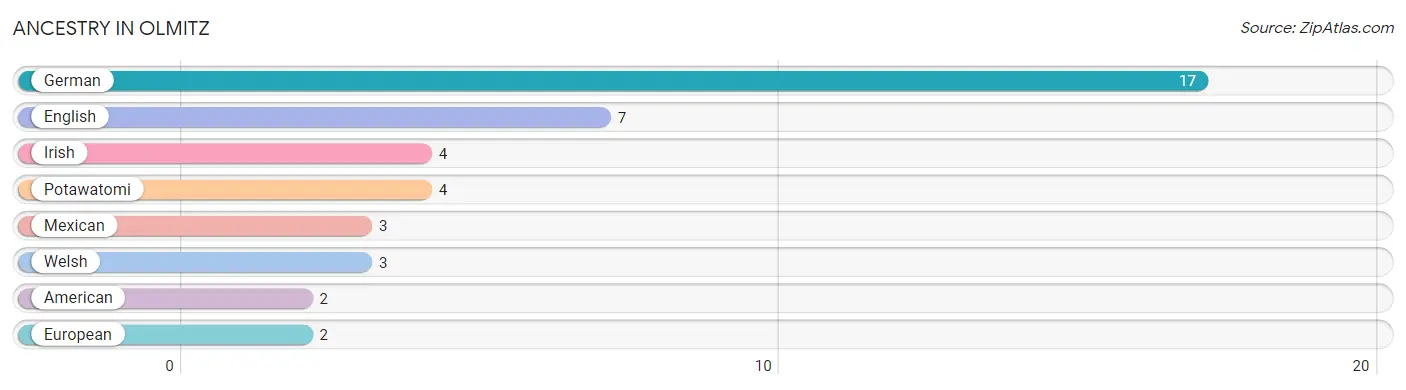
| Ancestry | # Population | % Population |
| American | 2 | 2.2% |
| English | 7 | 7.8% |
| European | 2 | 2.2% |
| German | 17 | 18.9% |
| Irish | 4 | 4.4% |
| Mexican | 3 | 3.3% |
| Potawatomi | 4 | 4.4% |
| Welsh | 3 | 3.3% | View All 8 Rows |
Immigrants in Olmitz

| Immigration Origin | # Population | % Population | View All 0 Rows |
Sex and Age in Olmitz
Sex and Age in Olmitz
The most populous age groups in Olmitz are 45 to 49 Years (15 | 27.8%) for men and 55 to 59 Years (8 | 22.2%) for women.
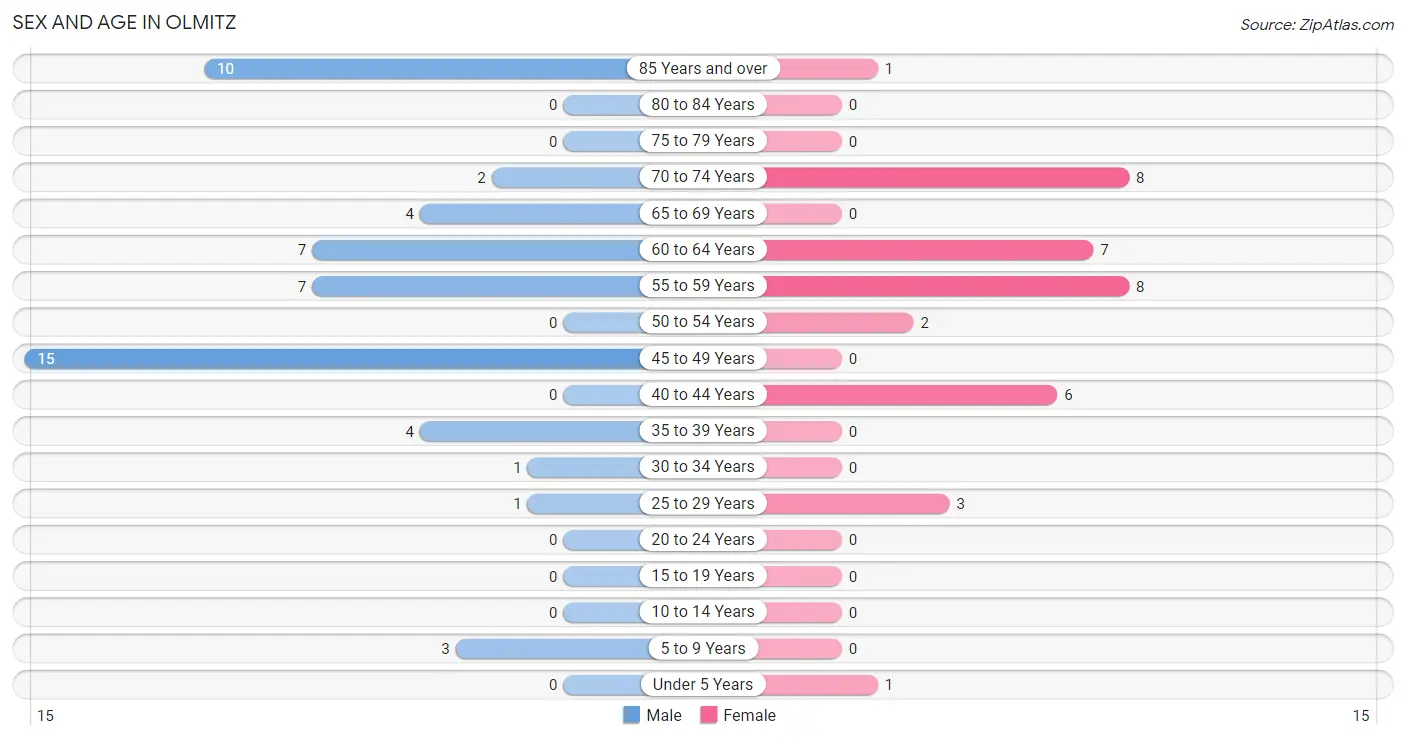
| Age Bracket | Male | Female |
| Under 5 Years | 0 (0.0%) | 1 (2.8%) |
| 5 to 9 Years | 3 (5.6%) | 0 (0.0%) |
| 10 to 14 Years | 0 (0.0%) | 0 (0.0%) |
| 15 to 19 Years | 0 (0.0%) | 0 (0.0%) |
| 20 to 24 Years | 0 (0.0%) | 0 (0.0%) |
| 25 to 29 Years | 1 (1.8%) | 3 (8.3%) |
| 30 to 34 Years | 1 (1.8%) | 0 (0.0%) |
| 35 to 39 Years | 4 (7.4%) | 0 (0.0%) |
| 40 to 44 Years | 0 (0.0%) | 6 (16.7%) |
| 45 to 49 Years | 15 (27.8%) | 0 (0.0%) |
| 50 to 54 Years | 0 (0.0%) | 2 (5.6%) |
| 55 to 59 Years | 7 (13.0%) | 8 (22.2%) |
| 60 to 64 Years | 7 (13.0%) | 7 (19.4%) |
| 65 to 69 Years | 4 (7.4%) | 0 (0.0%) |
| 70 to 74 Years | 2 (3.7%) | 8 (22.2%) |
| 75 to 79 Years | 0 (0.0%) | 0 (0.0%) |
| 80 to 84 Years | 0 (0.0%) | 0 (0.0%) |
| 85 Years and over | 10 (18.5%) | 1 (2.8%) |
| Total | 54 (100.0%) | 36 (100.0%) |
Families and Households in Olmitz
Median Family Size in Olmitz
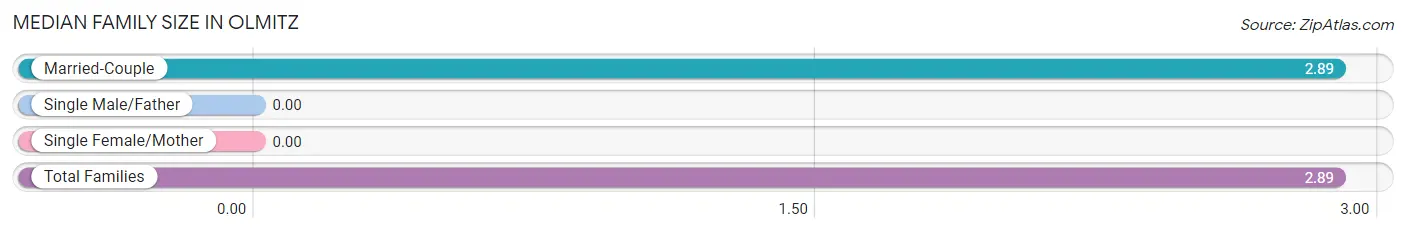
| Family Type | # Families | Family Size |
| Married-Couple | 19 (100.0%) | 2.89 |
| Single Male/Father | 0 (0.0%) | - |
| Single Female/Mother | 0 (0.0%) | - |
| Total Families | 19 (100.0%) | 2.89 |
Median Household Size in Olmitz
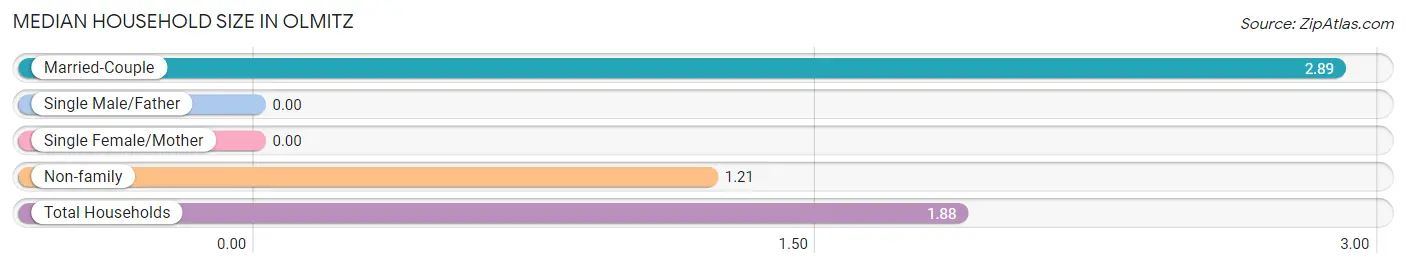
| Household Type | # Households | Household Size |
| Married-Couple | 19 (39.6%) | 2.89 |
| Single Male/Father | 0 (0.0%) | - |
| Single Female/Mother | 0 (0.0%) | - |
| Non-family | 29 (60.4%) | 1.21 |
| Total Households | 48 (100.0%) | 1.88 |
Household Size by Marriage Status in Olmitz
Out of a total of 48 households in Olmitz, 19 (39.6%) are family households, while 29 (60.4%) are nonfamily households. The most numerous type of family households are 2-person households, comprising 12, and the most common type of nonfamily households are 1-person households, comprising 24.
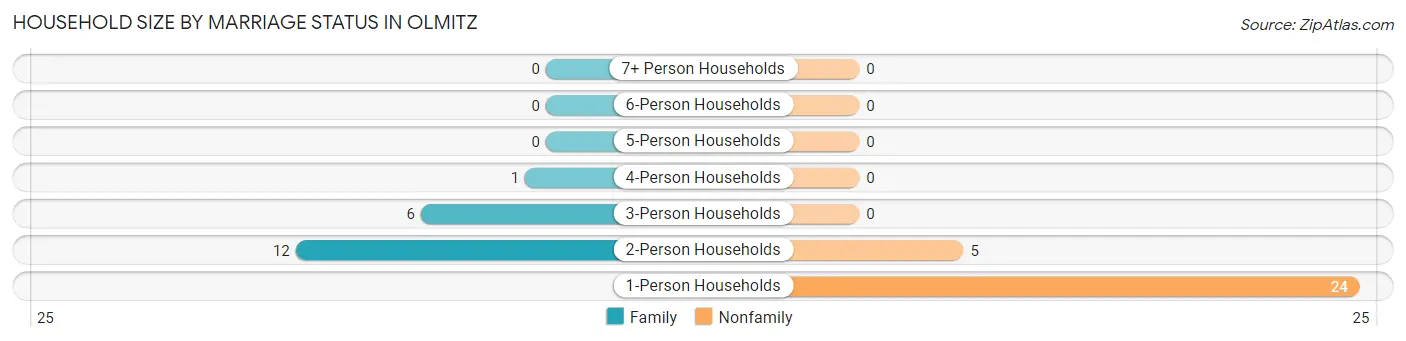
| Household Size | Family Households | Nonfamily Households |
| 1-Person Households | - | 24 (50.0%) |
| 2-Person Households | 12 (25.0%) | 5 (10.4%) |
| 3-Person Households | 6 (12.5%) | 0 (0.0%) |
| 4-Person Households | 1 (2.1%) | 0 (0.0%) |
| 5-Person Households | 0 (0.0%) | 0 (0.0%) |
| 6-Person Households | 0 (0.0%) | 0 (0.0%) |
| 7+ Person Households | 0 (0.0%) | 0 (0.0%) |
| Total | 19 (39.6%) | 29 (60.4%) |
Female Fertility in Olmitz
Fertility by Age in Olmitz
Average fertility rate in Olmitz is 222.0 births per 1,000 women. Women in the age bracket of 20 to 34 years have the highest fertility rate with 667.0 births per 1,000 women. Women in the age bracket of 20 to 34 years acount for 100.0% of all women with births.
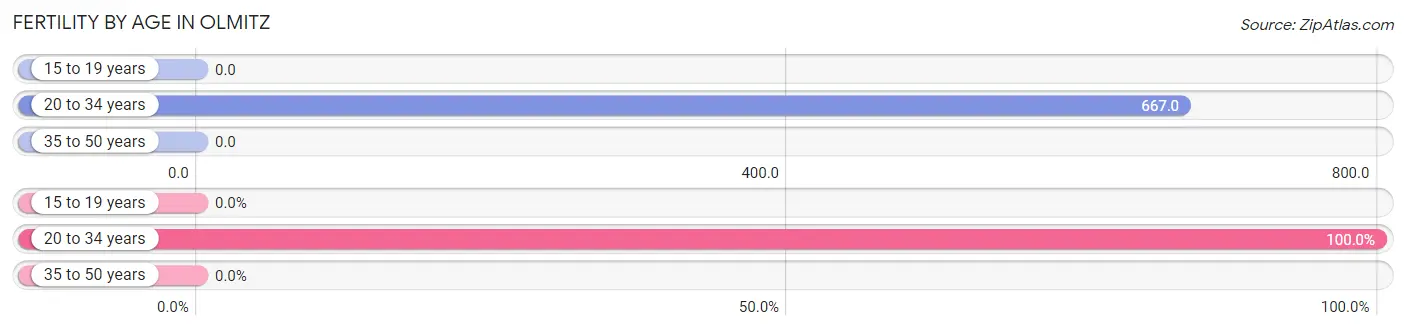
| Age Bracket | Women with Births | Births / 1,000 Women |
| 15 to 19 years | 0 (0.0%) | 0.0 |
| 20 to 34 years | 2 (100.0%) | 667.0 |
| 35 to 50 years | 0 (0.0%) | 0.0 |
| Total | 2 (100.0%) | 222.0 |
Fertility by Age by Marriage Status in Olmitz
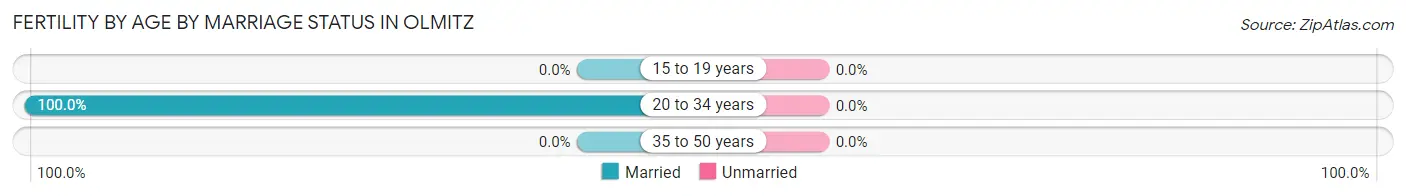
| Age Bracket | Married | Unmarried |
| 15 to 19 years | 0 (0.0%) | 0 (0.0%) |
| 20 to 34 years | 2 (100.0%) | 0 (0.0%) |
| 35 to 50 years | 0 (0.0%) | 0 (0.0%) |
| Total | 2 (100.0%) | 0 (0.0%) |
Fertility by Education in Olmitz
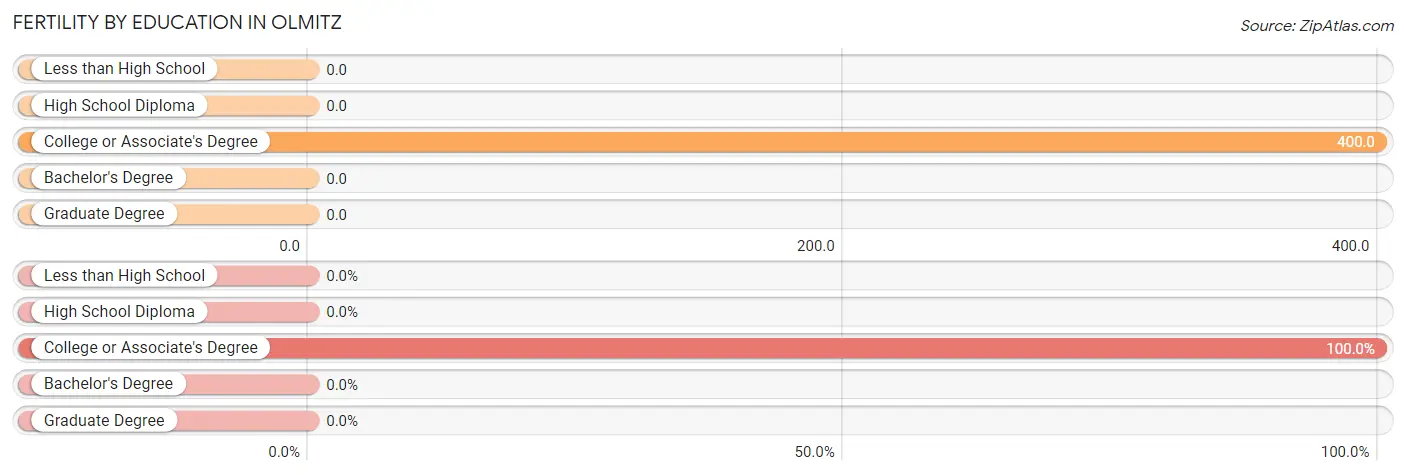
| Educational Attainment | Women with Births | Births / 1,000 Women |
| Less than High School | 0 (0.0%) | 0.0 |
| High School Diploma | 0 (0.0%) | 0.0 |
| College or Associate's Degree | 2 (100.0%) | 400.0 |
| Bachelor's Degree | 0 (0.0%) | 0.0 |
| Graduate Degree | 0 (0.0%) | 0.0 |
| Total | 2 (100.0%) | 222.0 |
Fertility by Education by Marriage Status in Olmitz
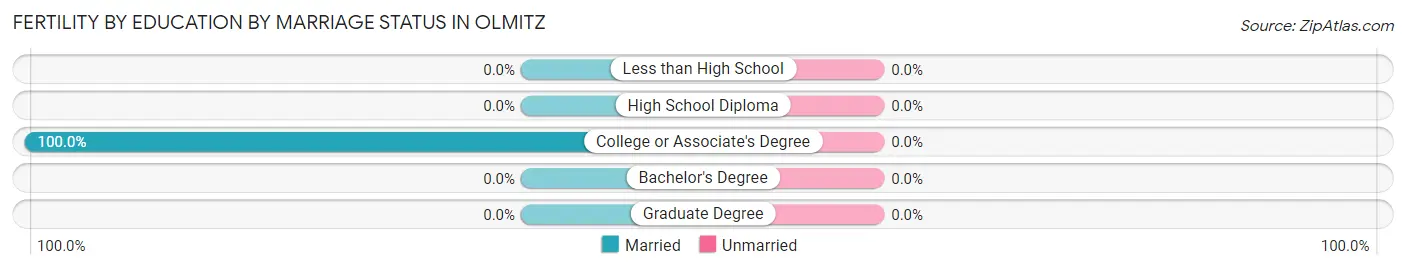
| Educational Attainment | Married | Unmarried |
| Less than High School | 0 (0.0%) | 0 (0.0%) |
| High School Diploma | 0 (0.0%) | 0 (0.0%) |
| College or Associate's Degree | 2 (100.0%) | 0 (0.0%) |
| Bachelor's Degree | 0 (0.0%) | 0 (0.0%) |
| Graduate Degree | 0 (0.0%) | 0 (0.0%) |
| Total | 2 (100.0%) | 0 (0.0%) |
Employment Characteristics in Olmitz
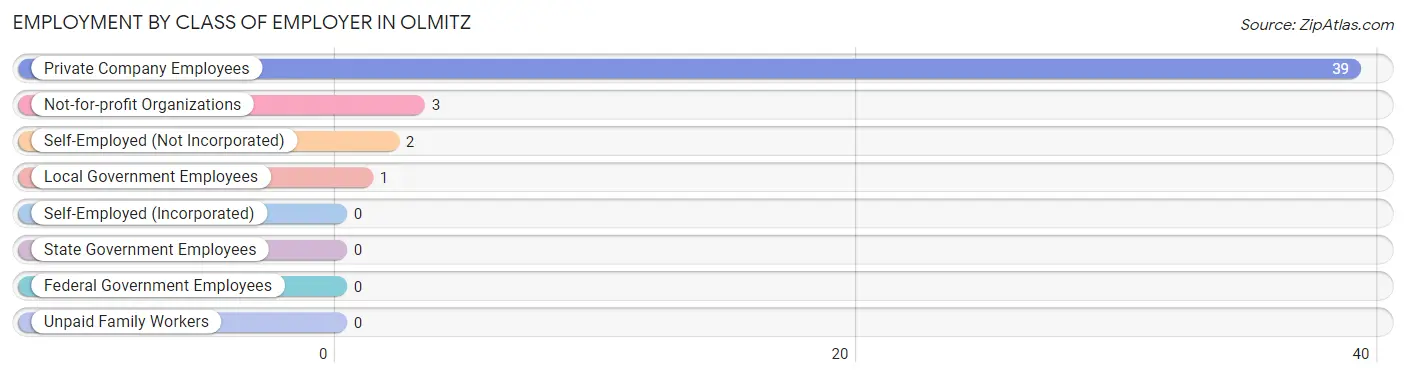
Employment by Class of Employer in Olmitz
Among the 45 employed individuals in Olmitz, private company employees (39 | 86.7%), not-for-profit organizations (3 | 6.7%), and self-employed (not incorporated) (2 | 4.4%) make up the most common classes of employment.
| Employer Class | # Employees | % Employees |
| Private Company Employees | 39 | 86.7% |
| Self-Employed (Incorporated) | 0 | 0.0% |
| Self-Employed (Not Incorporated) | 2 | 4.4% |
| Not-for-profit Organizations | 3 | 6.7% |
| Local Government Employees | 1 | 2.2% |
| State Government Employees | 0 | 0.0% |
| Federal Government Employees | 0 | 0.0% |
| Unpaid Family Workers | 0 | 0.0% |
| Total | 45 | 100.0% |
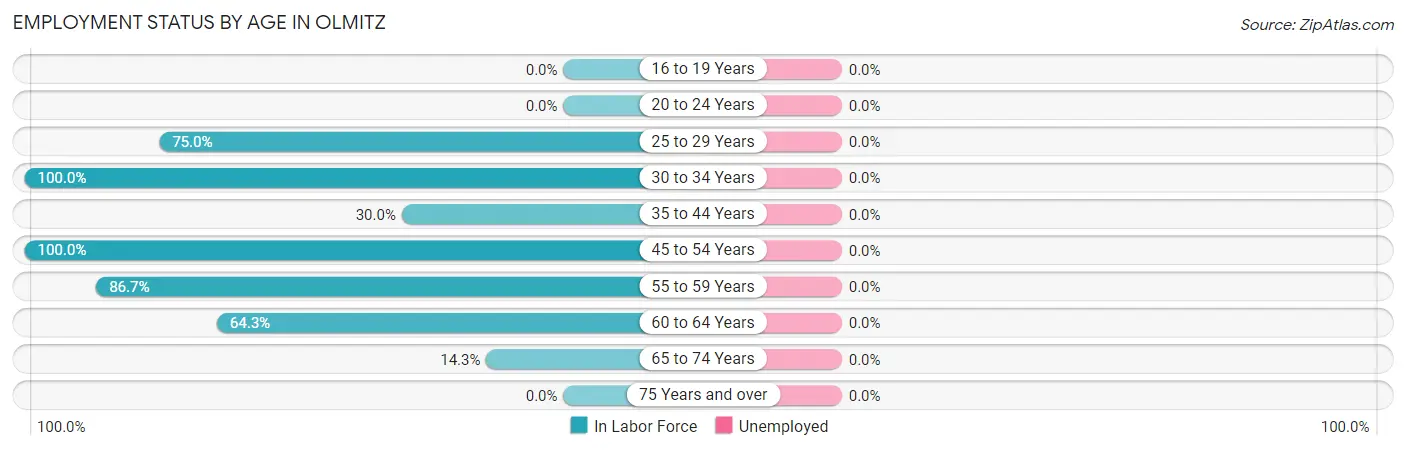
Employment Status by Age in Olmitz
| Age Bracket | In Labor Force | Unemployed |
| 16 to 19 Years | 0 (0.0%) | 0 (0.0%) |
| 20 to 24 Years | 0 (0.0%) | 0 (0.0%) |
| 25 to 29 Years | 3 (75.0%) | 0 (0.0%) |
| 30 to 34 Years | 1 (100.0%) | 0 (0.0%) |
| 35 to 44 Years | 3 (30.0%) | 0 (0.0%) |
| 45 to 54 Years | 17 (100.0%) | 0 (0.0%) |
| 55 to 59 Years | 13 (86.7%) | 0 (0.0%) |
| 60 to 64 Years | 9 (64.3%) | 0 (0.0%) |
| 65 to 74 Years | 2 (14.3%) | 0 (0.0%) |
| 75 Years and over | 0 (0.0%) | 0 (0.0%) |
| Total | 48 (55.8%) | 0 (0.0%) |
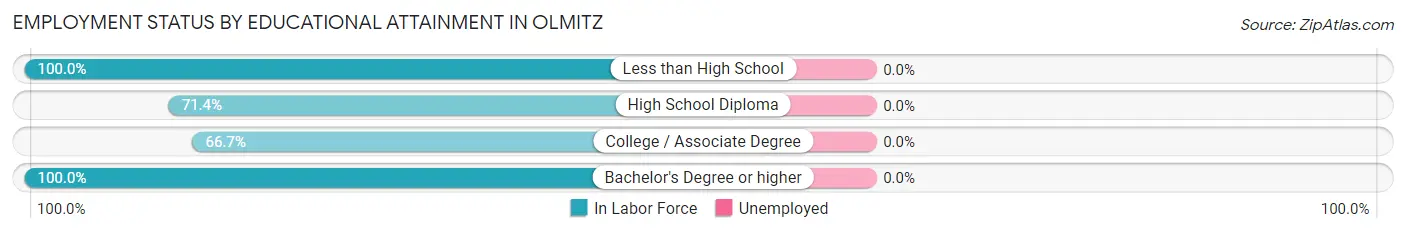
Employment Status by Educational Attainment in Olmitz
| Educational Attainment | In Labor Force | Unemployed |
| Less than High School | 6 (100.0%) | 0 (0.0%) |
| High School Diploma | 20 (71.4%) | 0 (0.0%) |
| College / Associate Degree | 14 (66.7%) | 0 (0.0%) |
| Bachelor's Degree or higher | 6 (100.0%) | 0 (0.0%) |
| Total | 46 (75.4%) | 0 (0.0%) |
Employment Occupations by Sex in Olmitz
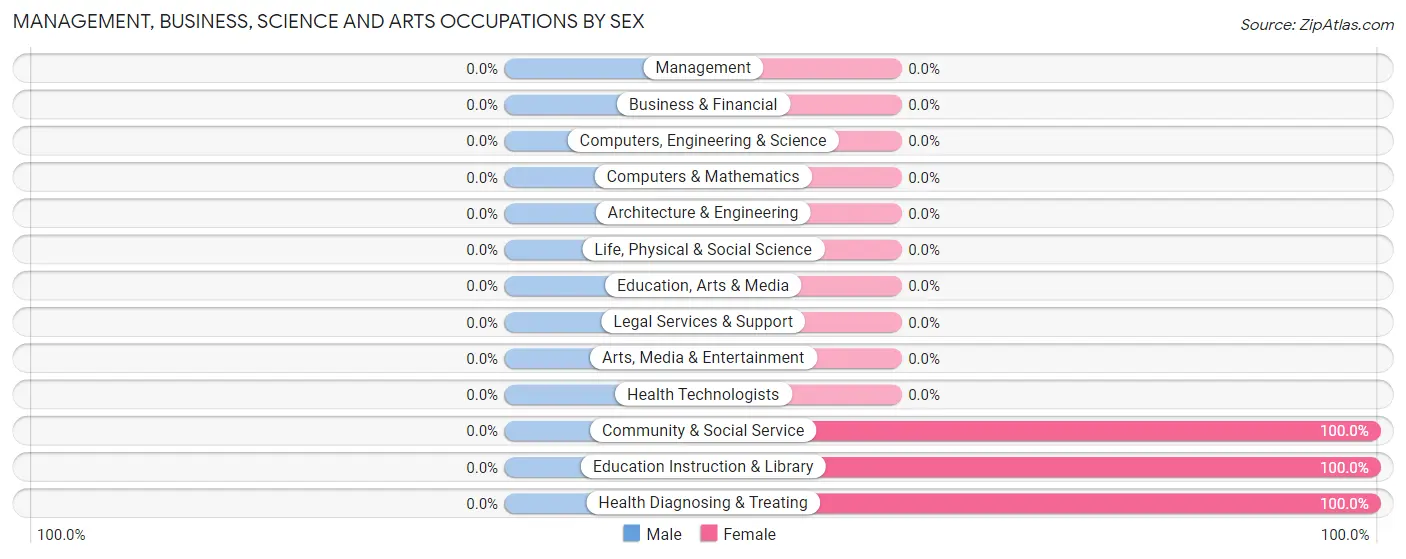
Management, Business, Science and Arts Occupations
The most common Management, Business, Science and Arts occupations in Olmitz are Health Diagnosing & Treating (5 | 10.4%), Community & Social Service (2 | 4.2%), and Education Instruction & Library (2 | 4.2%).
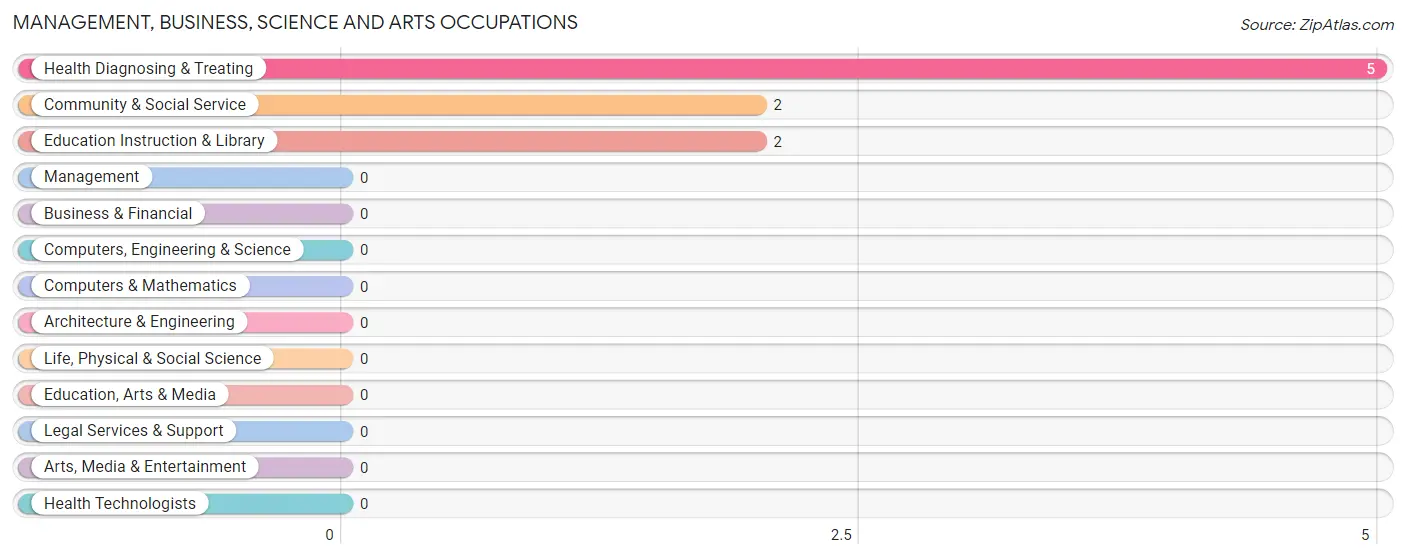
Management, Business, Science and Arts Occupations by Sex
| Occupation | Male | Female |
| Management | 0 (0.0%) | 0 (0.0%) |
| Business & Financial | 0 (0.0%) | 0 (0.0%) |
| Computers, Engineering & Science | 0 (0.0%) | 0 (0.0%) |
| Computers & Mathematics | 0 (0.0%) | 0 (0.0%) |
| Architecture & Engineering | 0 (0.0%) | 0 (0.0%) |
| Life, Physical & Social Science | 0 (0.0%) | 0 (0.0%) |
| Community & Social Service | 0 (0.0%) | 2 (100.0%) |
| Education, Arts & Media | 0 (0.0%) | 0 (0.0%) |
| Legal Services & Support | 0 (0.0%) | 0 (0.0%) |
| Education Instruction & Library | 0 (0.0%) | 2 (100.0%) |
| Arts, Media & Entertainment | 0 (0.0%) | 0 (0.0%) |
| Health Diagnosing & Treating | 0 (0.0%) | 5 (100.0%) |
| Health Technologists | 0 (0.0%) | 0 (0.0%) |
| Total (Category) | 0 (0.0%) | 7 (100.0%) |
| Total (Overall) | 31 (64.6%) | 17 (35.4%) |
Services Occupations
Services Occupations by Sex
| Occupation | Male | Female |
| Healthcare Support | 0 (0.0%) | 0 (0.0%) |
| Security & Protection | 0 (0.0%) | 0 (0.0%) |
| Firefighting & Prevention | 0 (0.0%) | 0 (0.0%) |
| Law Enforcement | 0 (0.0%) | 0 (0.0%) |
| Food Preparation & Serving | 0 (0.0%) | 0 (0.0%) |
| Cleaning & Maintenance | 0 (0.0%) | 0 (0.0%) |
| Personal Care & Service | 0 (0.0%) | 0 (0.0%) |
| Total (Category) | 0 (0.0%) | 0 (0.0%) |
| Total (Overall) | 31 (64.6%) | 17 (35.4%) |
Sales and Office Occupations
The most common Sales and Office occupations in Olmitz are Office & Administration (9 | 18.8%), and Sales & Related (1 | 2.1%).
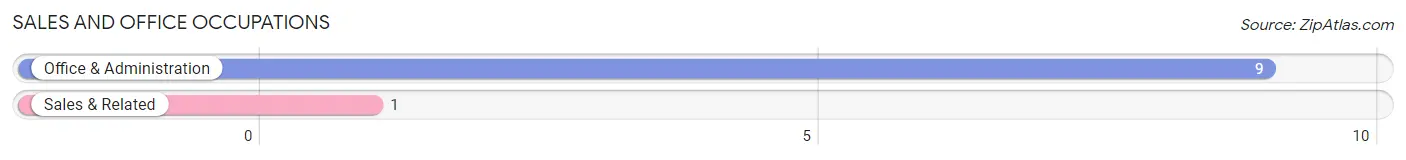
Sales and Office Occupations by Sex
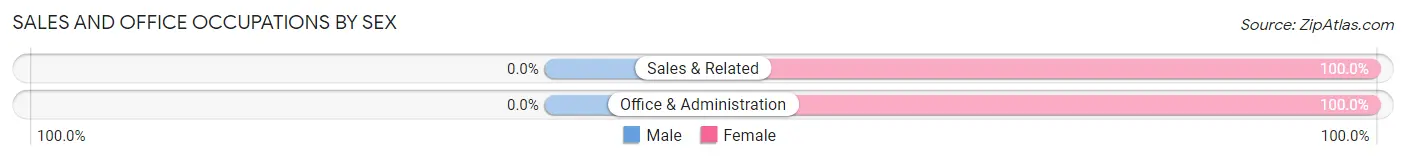
| Occupation | Male | Female |
| Sales & Related | 0 (0.0%) | 1 (100.0%) |
| Office & Administration | 0 (0.0%) | 9 (100.0%) |
| Total (Category) | 0 (0.0%) | 10 (100.0%) |
| Total (Overall) | 31 (64.6%) | 17 (35.4%) |
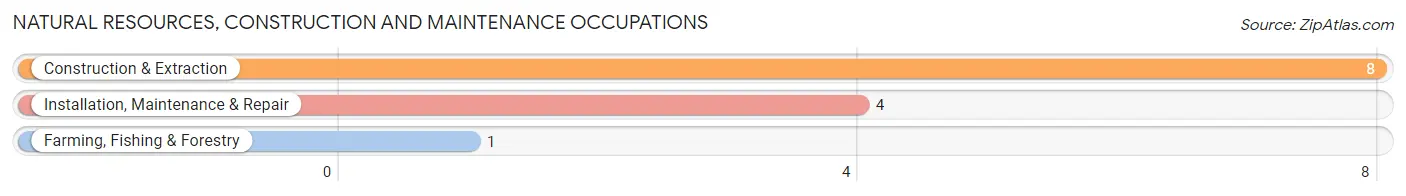
Natural Resources, Construction and Maintenance Occupations
The most common Natural Resources, Construction and Maintenance occupations in Olmitz are Construction & Extraction (8 | 16.7%), Installation, Maintenance & Repair (4 | 8.3%), and Farming, Fishing & Forestry (1 | 2.1%).
Natural Resources, Construction and Maintenance Occupations by Sex
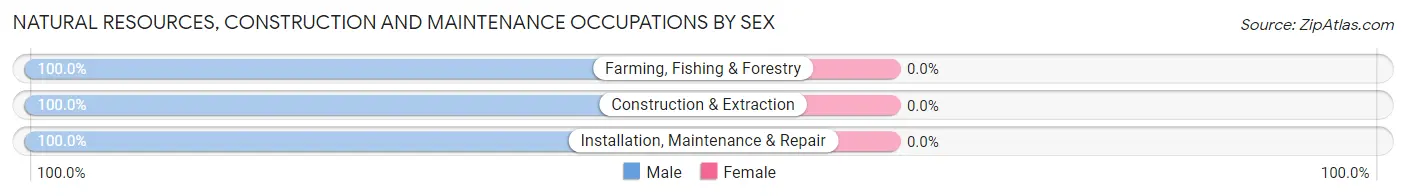
| Occupation | Male | Female |
| Farming, Fishing & Forestry | 1 (100.0%) | 0 (0.0%) |
| Construction & Extraction | 8 (100.0%) | 0 (0.0%) |
| Installation, Maintenance & Repair | 4 (100.0%) | 0 (0.0%) |
| Total (Category) | 13 (100.0%) | 0 (0.0%) |
| Total (Overall) | 31 (64.6%) | 17 (35.4%) |
Production, Transportation and Moving Occupations
The most common Production, Transportation and Moving occupations in Olmitz are Material Moving (16 | 33.3%), and Production (2 | 4.2%).
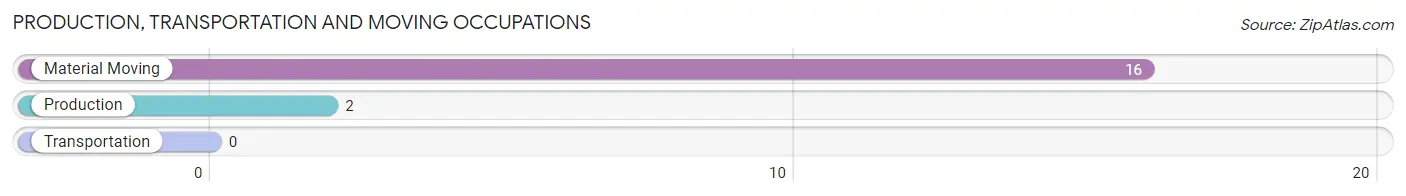
Production, Transportation and Moving Occupations by Sex
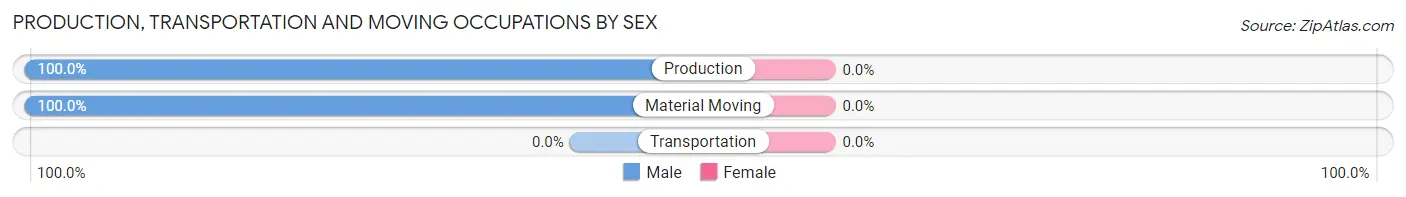
| Occupation | Male | Female |
| Production | 2 (100.0%) | 0 (0.0%) |
| Transportation | 0 (0.0%) | 0 (0.0%) |
| Material Moving | 16 (100.0%) | 0 (0.0%) |
| Total (Category) | 18 (100.0%) | 0 (0.0%) |
| Total (Overall) | 31 (64.6%) | 17 (35.4%) |
Employment Industries by Sex in Olmitz
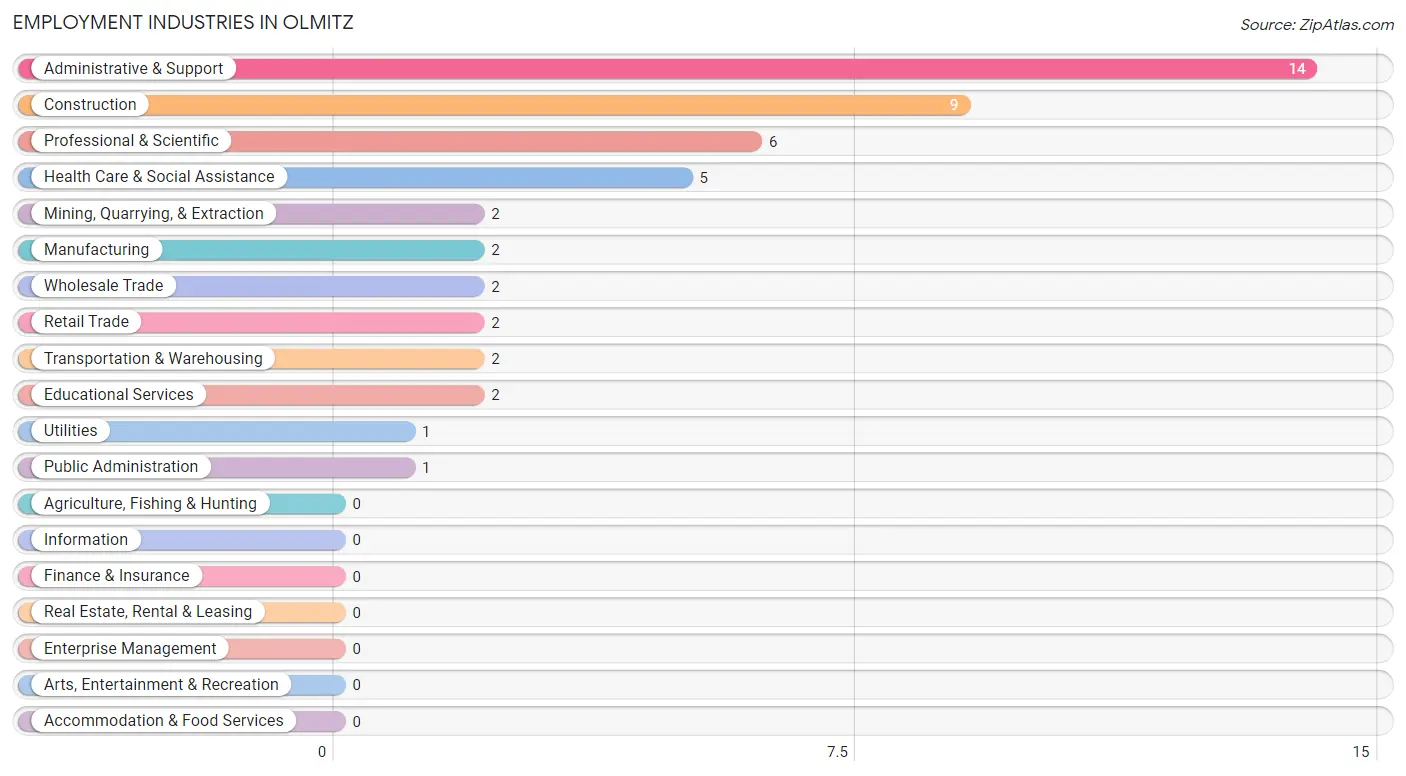
Employment Industries in Olmitz
The major employment industries in Olmitz include Administrative & Support (14 | 29.2%), Construction (9 | 18.8%), Professional & Scientific (6 | 12.5%), Health Care & Social Assistance (5 | 10.4%), and Mining, Quarrying, & Extraction (2 | 4.2%).
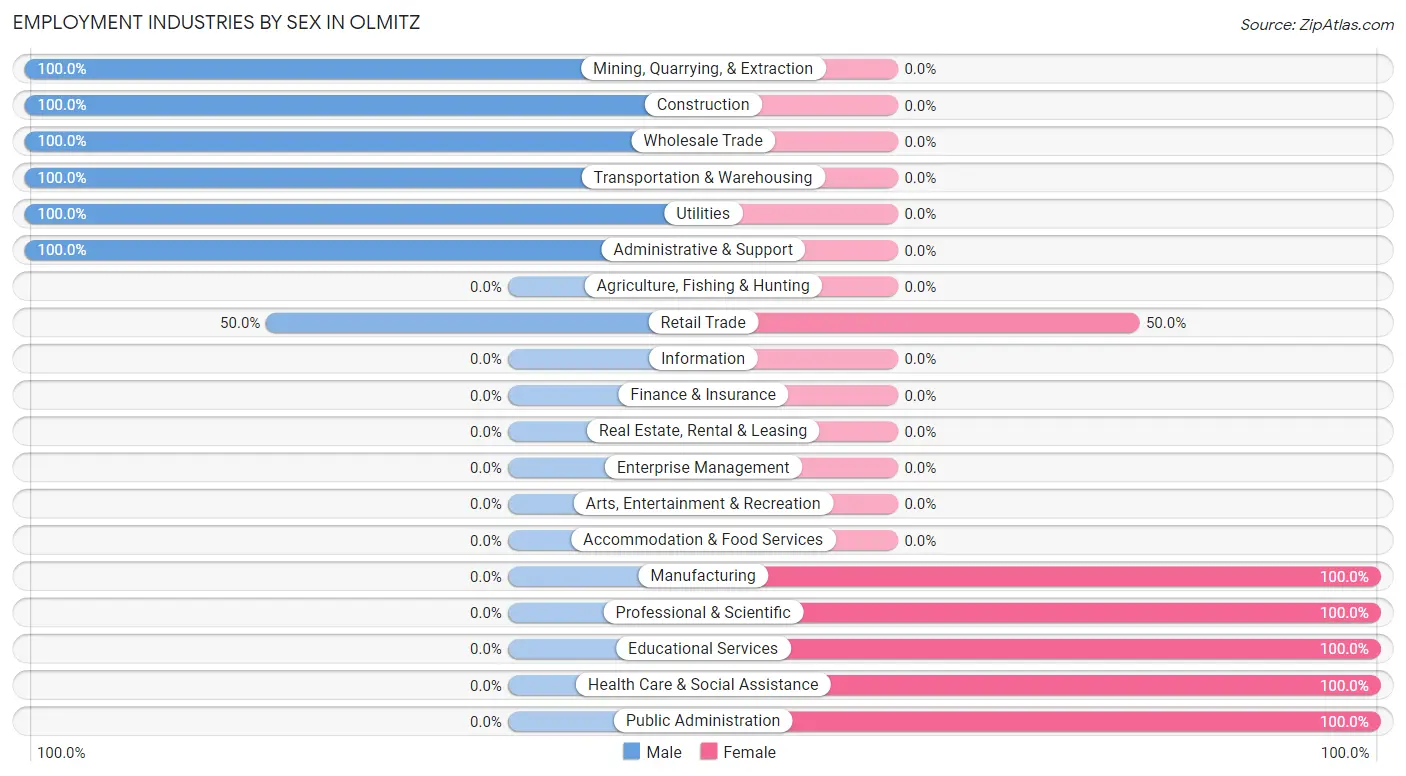
Employment Industries by Sex in Olmitz
The Olmitz industries that see more men than women are Mining, Quarrying, & Extraction (100.0%), Construction (100.0%), and Wholesale Trade (100.0%), whereas the industries that tend to have a higher number of women are Manufacturing (100.0%), Professional & Scientific (100.0%), and Educational Services (100.0%).
| Industry | Male | Female |
| Agriculture, Fishing & Hunting | 0 (0.0%) | 0 (0.0%) |
| Mining, Quarrying, & Extraction | 2 (100.0%) | 0 (0.0%) |
| Construction | 9 (100.0%) | 0 (0.0%) |
| Manufacturing | 0 (0.0%) | 2 (100.0%) |
| Wholesale Trade | 2 (100.0%) | 0 (0.0%) |
| Retail Trade | 1 (50.0%) | 1 (50.0%) |
| Transportation & Warehousing | 2 (100.0%) | 0 (0.0%) |
| Utilities | 1 (100.0%) | 0 (0.0%) |
| Information | 0 (0.0%) | 0 (0.0%) |
| Finance & Insurance | 0 (0.0%) | 0 (0.0%) |
| Real Estate, Rental & Leasing | 0 (0.0%) | 0 (0.0%) |
| Professional & Scientific | 0 (0.0%) | 6 (100.0%) |
| Enterprise Management | 0 (0.0%) | 0 (0.0%) |
| Administrative & Support | 14 (100.0%) | 0 (0.0%) |
| Educational Services | 0 (0.0%) | 2 (100.0%) |
| Health Care & Social Assistance | 0 (0.0%) | 5 (100.0%) |
| Arts, Entertainment & Recreation | 0 (0.0%) | 0 (0.0%) |
| Accommodation & Food Services | 0 (0.0%) | 0 (0.0%) |
| Public Administration | 0 (0.0%) | 1 (100.0%) |
| Total | 31 (64.6%) | 17 (35.4%) |
Education in Olmitz
School Enrollment in Olmitz
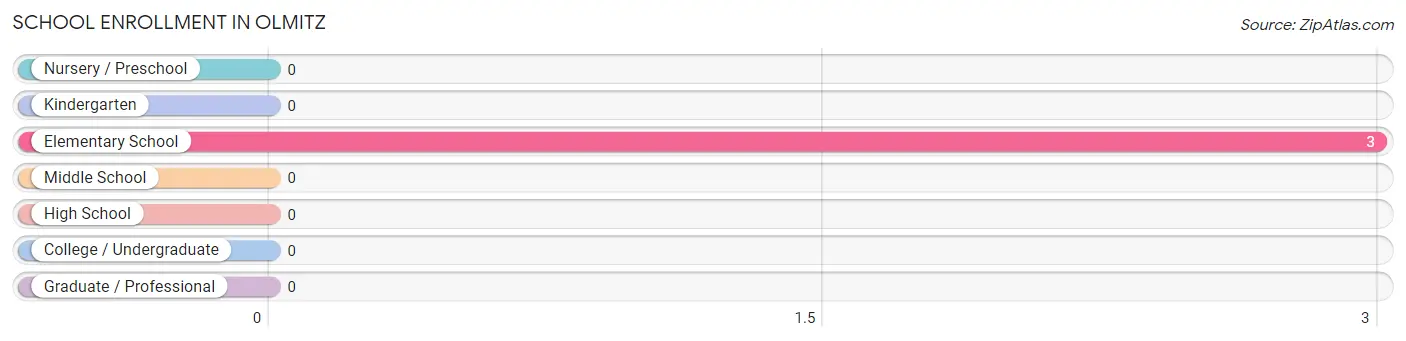
| School Level | # Students | % Students |
| Nursery / Preschool | 0 | 0.0% |
| Kindergarten | 0 | 0.0% |
| Elementary School | 3 | 100.0% |
| Middle School | 0 | 0.0% |
| High School | 0 | 0.0% |
| College / Undergraduate | 0 | 0.0% |
| Graduate / Professional | 0 | 0.0% |
| Total | 3 | 100.0% |
School Enrollment by Age by Funding Source in Olmitz
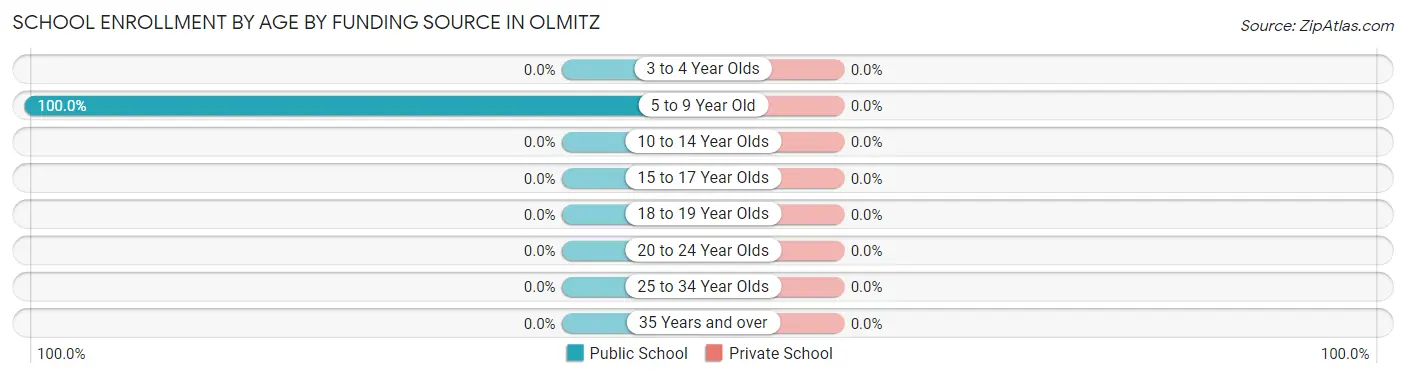
| Age Bracket | Public School | Private School |
| 3 to 4 Year Olds | 0 (0.0%) | 0 (0.0%) |
| 5 to 9 Year Old | 3 (100.0%) | 0 (0.0%) |
| 10 to 14 Year Olds | 0 (0.0%) | 0 (0.0%) |
| 15 to 17 Year Olds | 0 (0.0%) | 0 (0.0%) |
| 18 to 19 Year Olds | 0 (0.0%) | 0 (0.0%) |
| 20 to 24 Year Olds | 0 (0.0%) | 0 (0.0%) |
| 25 to 34 Year Olds | 0 (0.0%) | 0 (0.0%) |
| 35 Years and over | 0 (0.0%) | 0 (0.0%) |
| Total | 3 (100.0%) | 0 (0.0%) |
Educational Attainment by Field of Study in Olmitz
Education (8 | 57.1%), science & technology (2 | 14.3%), business (2 | 14.3%), and liberal arts & history (2 | 14.3%) are the most common fields of study among 14 individuals in Olmitz who have obtained a bachelor's degree or higher.
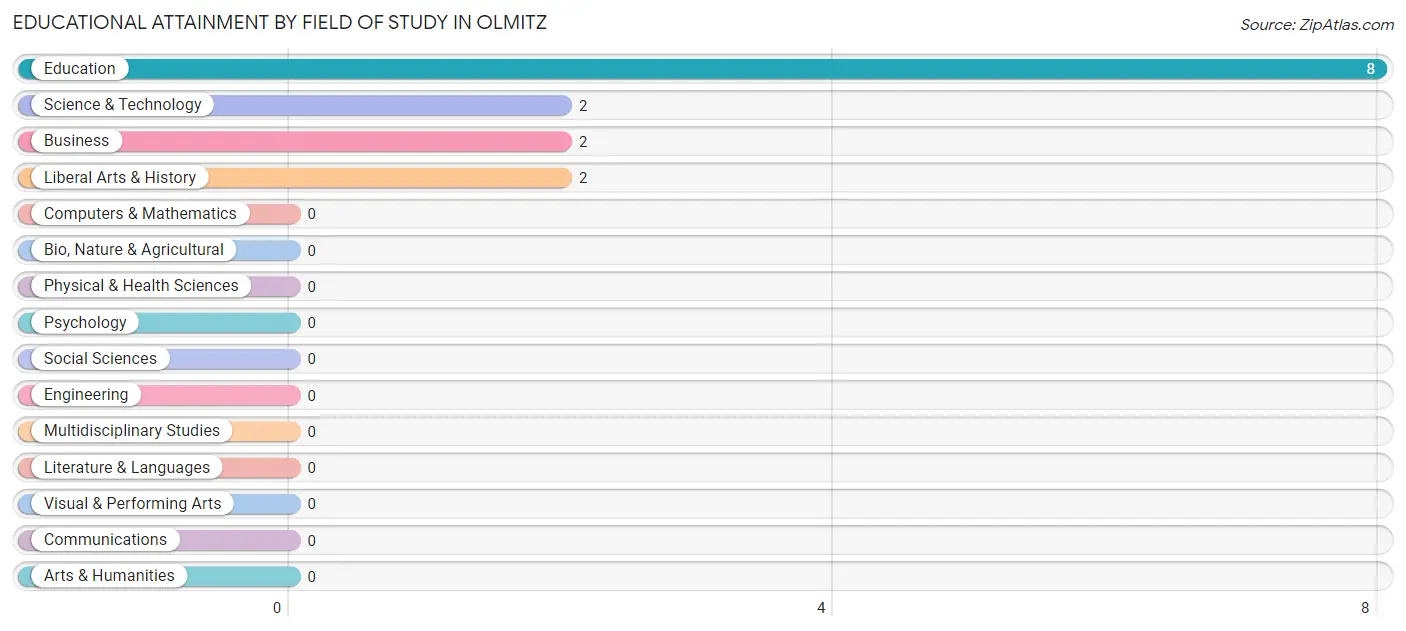
| Field of Study | # Graduates | % Graduates |
| Computers & Mathematics | 0 | 0.0% |
| Bio, Nature & Agricultural | 0 | 0.0% |
| Physical & Health Sciences | 0 | 0.0% |
| Psychology | 0 | 0.0% |
| Social Sciences | 0 | 0.0% |
| Engineering | 0 | 0.0% |
| Multidisciplinary Studies | 0 | 0.0% |
| Science & Technology | 2 | 14.3% |
| Business | 2 | 14.3% |
| Education | 8 | 57.1% |
| Literature & Languages | 0 | 0.0% |
| Liberal Arts & History | 2 | 14.3% |
| Visual & Performing Arts | 0 | 0.0% |
| Communications | 0 | 0.0% |
| Arts & Humanities | 0 | 0.0% |
| Total | 14 | 100.0% |
Transportation & Commute in Olmitz
Vehicle Availability by Sex in Olmitz
The most prevalent vehicle ownership categories in Olmitz are males with 4 vehicles (15, accounting for 48.4%) and females with 4 vehicles (2, making up 107.1%).
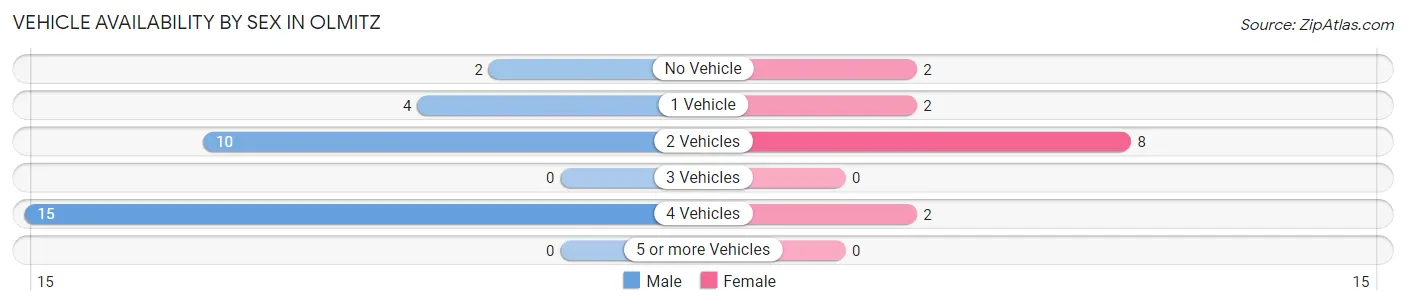
| Vehicles Available | Male | Female |
| No Vehicle | 2 (6.5%) | 2 (14.3%) |
| 1 Vehicle | 4 (12.9%) | 2 (14.3%) |
| 2 Vehicles | 10 (32.3%) | 8 (57.1%) |
| 3 Vehicles | 0 (0.0%) | 0 (0.0%) |
| 4 Vehicles | 15 (48.4%) | 2 (14.3%) |
| 5 or more Vehicles | 0 (0.0%) | 0 (0.0%) |
| Total | 31 (100.0%) | 14 (100.0%) |
Commute Time in Olmitz
The most frequently occuring commute durations in Olmitz are 20 to 24 minutes (20 commuters, 44.4%), 30 to 34 minutes (8 commuters, 17.8%), and 40 to 44 minutes (6 commuters, 13.3%).
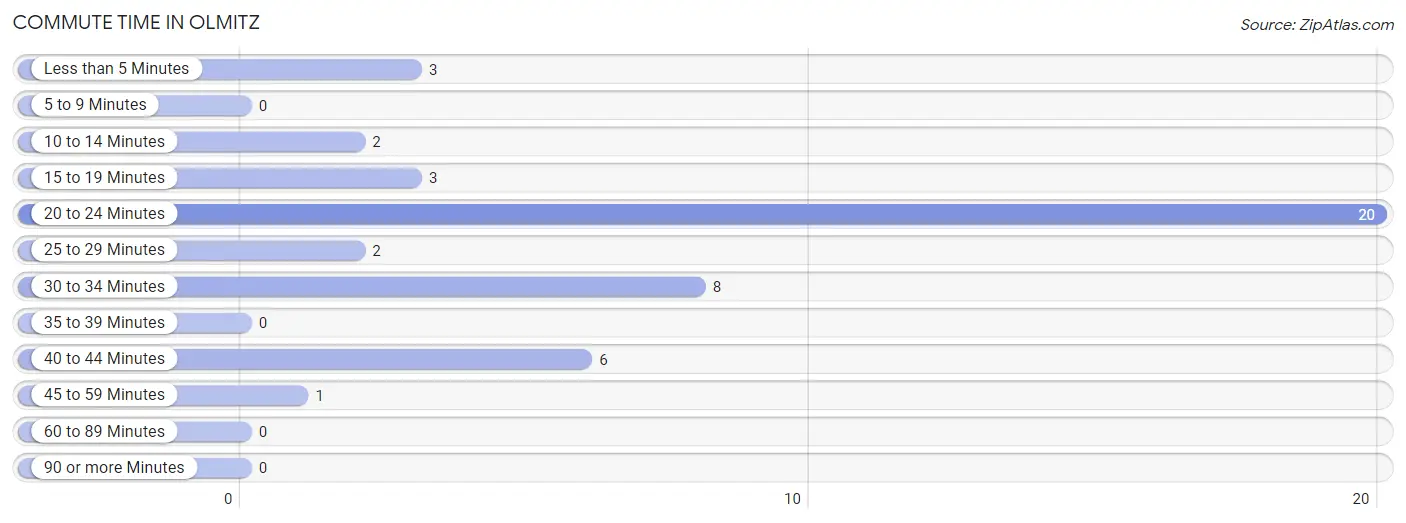
| Commute Time | # Commuters | % Commuters |
| Less than 5 Minutes | 3 | 6.7% |
| 5 to 9 Minutes | 0 | 0.0% |
| 10 to 14 Minutes | 2 | 4.4% |
| 15 to 19 Minutes | 3 | 6.7% |
| 20 to 24 Minutes | 20 | 44.4% |
| 25 to 29 Minutes | 2 | 4.4% |
| 30 to 34 Minutes | 8 | 17.8% |
| 35 to 39 Minutes | 0 | 0.0% |
| 40 to 44 Minutes | 6 | 13.3% |
| 45 to 59 Minutes | 1 | 2.2% |
| 60 to 89 Minutes | 0 | 0.0% |
| 90 or more Minutes | 0 | 0.0% |
Commute Time by Sex in Olmitz
The most common commute times in Olmitz are 20 to 24 minutes (14 commuters, 45.2%) for males and 30 to 34 minutes (8 commuters, 57.1%) for females.
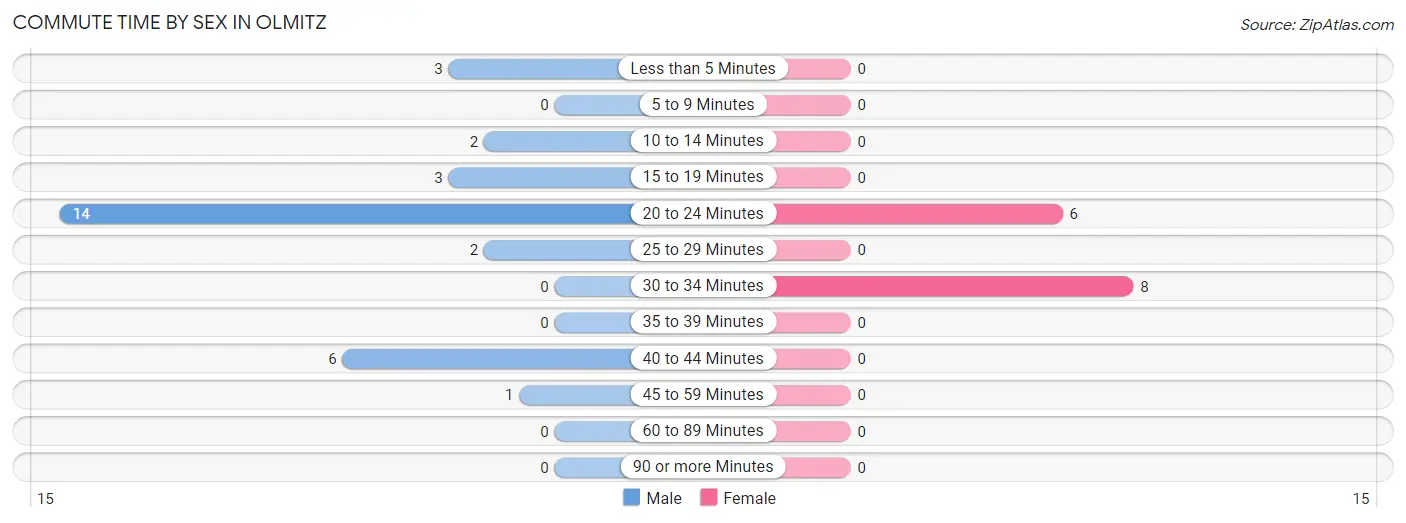
| Commute Time | Male | Female |
| Less than 5 Minutes | 3 (9.7%) | 0 (0.0%) |
| 5 to 9 Minutes | 0 (0.0%) | 0 (0.0%) |
| 10 to 14 Minutes | 2 (6.5%) | 0 (0.0%) |
| 15 to 19 Minutes | 3 (9.7%) | 0 (0.0%) |
| 20 to 24 Minutes | 14 (45.2%) | 6 (42.9%) |
| 25 to 29 Minutes | 2 (6.5%) | 0 (0.0%) |
| 30 to 34 Minutes | 0 (0.0%) | 8 (57.1%) |
| 35 to 39 Minutes | 0 (0.0%) | 0 (0.0%) |
| 40 to 44 Minutes | 6 (19.4%) | 0 (0.0%) |
| 45 to 59 Minutes | 1 (3.2%) | 0 (0.0%) |
| 60 to 89 Minutes | 0 (0.0%) | 0 (0.0%) |
| 90 or more Minutes | 0 (0.0%) | 0 (0.0%) |
Time of Departure to Work by Sex in Olmitz
The most frequent times of departure to work in Olmitz are 7:30 AM to 7:59 AM (15, 48.4%) for males and 4:00 PM to 11:59 PM (6, 42.9%) for females.
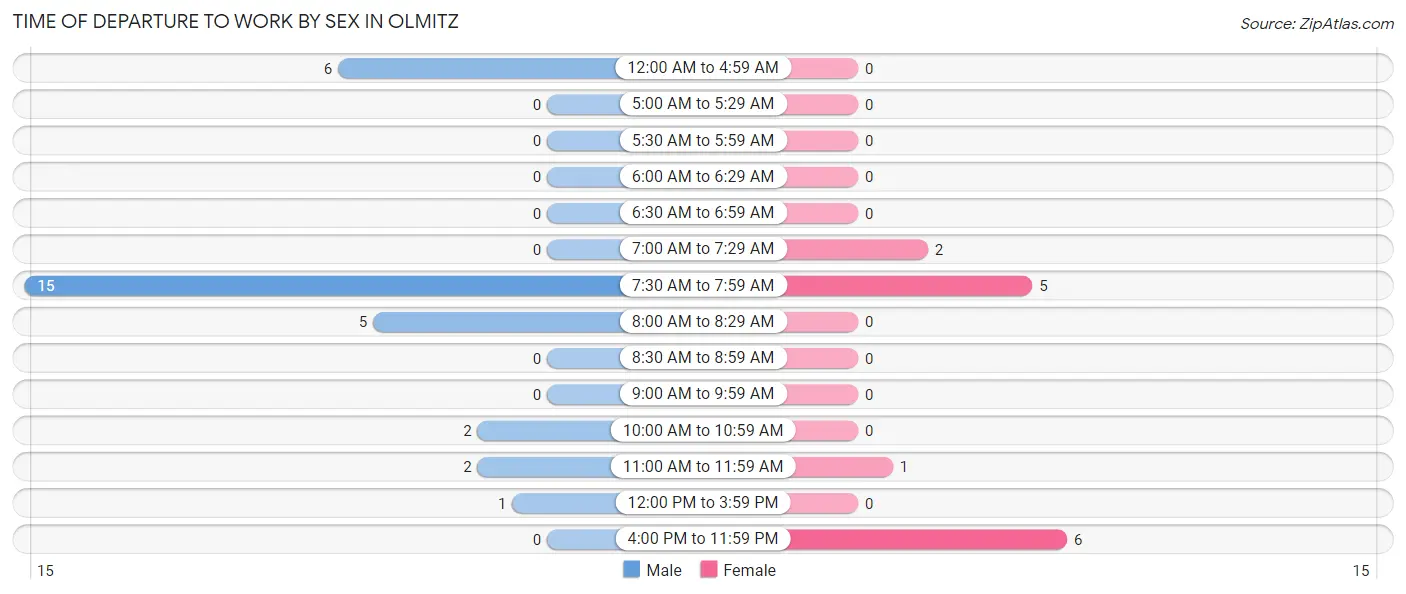
| Time of Departure | Male | Female |
| 12:00 AM to 4:59 AM | 6 (19.4%) | 0 (0.0%) |
| 5:00 AM to 5:29 AM | 0 (0.0%) | 0 (0.0%) |
| 5:30 AM to 5:59 AM | 0 (0.0%) | 0 (0.0%) |
| 6:00 AM to 6:29 AM | 0 (0.0%) | 0 (0.0%) |
| 6:30 AM to 6:59 AM | 0 (0.0%) | 0 (0.0%) |
| 7:00 AM to 7:29 AM | 0 (0.0%) | 2 (14.3%) |
| 7:30 AM to 7:59 AM | 15 (48.4%) | 5 (35.7%) |
| 8:00 AM to 8:29 AM | 5 (16.1%) | 0 (0.0%) |
| 8:30 AM to 8:59 AM | 0 (0.0%) | 0 (0.0%) |
| 9:00 AM to 9:59 AM | 0 (0.0%) | 0 (0.0%) |
| 10:00 AM to 10:59 AM | 2 (6.5%) | 0 (0.0%) |
| 11:00 AM to 11:59 AM | 2 (6.5%) | 1 (7.1%) |
| 12:00 PM to 3:59 PM | 1 (3.2%) | 0 (0.0%) |
| 4:00 PM to 11:59 PM | 0 (0.0%) | 6 (42.9%) |
| Total | 31 (100.0%) | 14 (100.0%) |
Housing Occupancy in Olmitz
Occupancy by Ownership in Olmitz
Of the total 48 dwellings in Olmitz, owner-occupied units account for 41 (85.4%), while renter-occupied units make up 7 (14.6%).
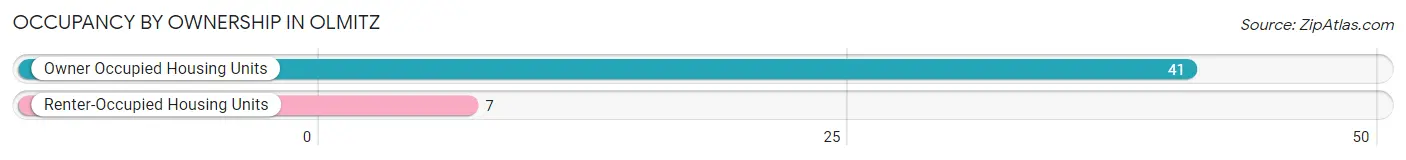
| Occupancy | # Housing Units | % Housing Units |
| Owner Occupied Housing Units | 41 | 85.4% |
| Renter-Occupied Housing Units | 7 | 14.6% |
| Total Occupied Housing Units | 48 | 100.0% |
Occupancy by Household Size in Olmitz
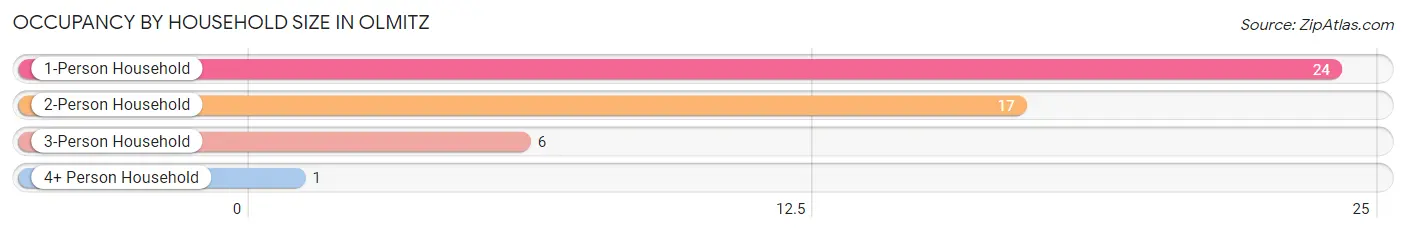
| Household Size | # Housing Units | % Housing Units |
| 1-Person Household | 24 | 50.0% |
| 2-Person Household | 17 | 35.4% |
| 3-Person Household | 6 | 12.5% |
| 4+ Person Household | 1 | 2.1% |
| Total Housing Units | 48 | 100.0% |
Occupancy by Ownership by Household Size in Olmitz
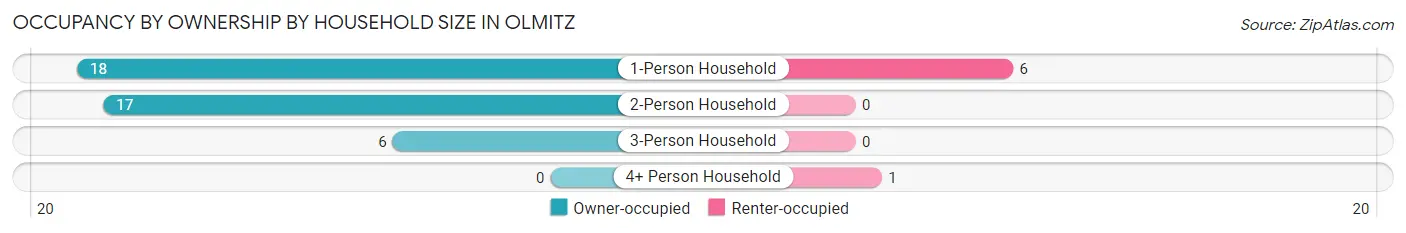
| Household Size | Owner-occupied | Renter-occupied |
| 1-Person Household | 18 (75.0%) | 6 (25.0%) |
| 2-Person Household | 17 (100.0%) | 0 (0.0%) |
| 3-Person Household | 6 (100.0%) | 0 (0.0%) |
| 4+ Person Household | 0 (0.0%) | 1 (100.0%) |
| Total Housing Units | 41 (85.4%) | 7 (14.6%) |
Occupancy by Educational Attainment in Olmitz
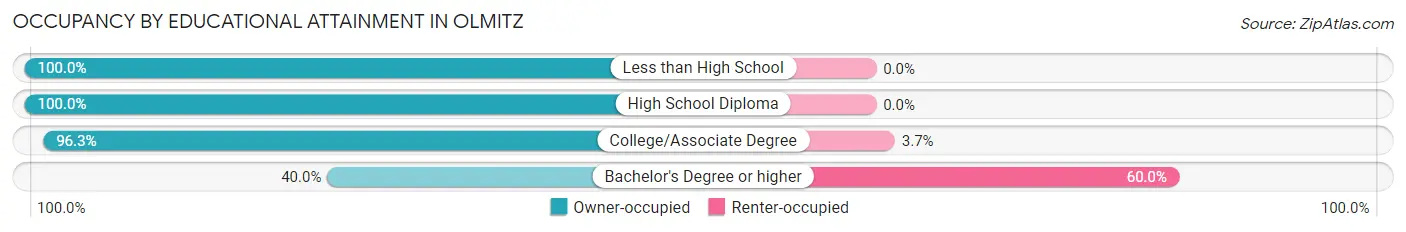
| Household Size | Owner-occupied | Renter-occupied |
| Less than High School | 3 (100.0%) | 0 (0.0%) |
| High School Diploma | 8 (100.0%) | 0 (0.0%) |
| College/Associate Degree | 26 (96.3%) | 1 (3.7%) |
| Bachelor's Degree or higher | 4 (40.0%) | 6 (60.0%) |
Occupancy by Age of Householder in Olmitz
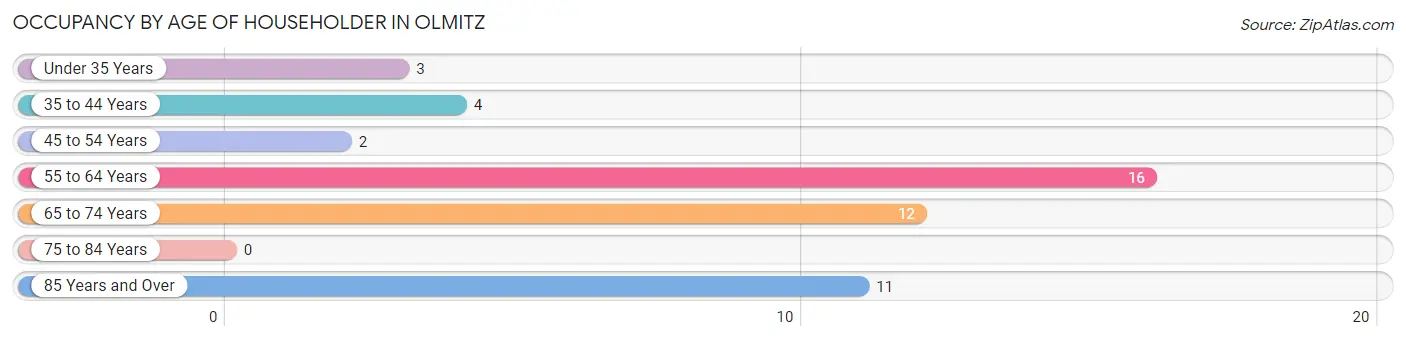
| Age Bracket | # Households | % Households |
| Under 35 Years | 3 | 6.2% |
| 35 to 44 Years | 4 | 8.3% |
| 45 to 54 Years | 2 | 4.2% |
| 55 to 64 Years | 16 | 33.3% |
| 65 to 74 Years | 12 | 25.0% |
| 75 to 84 Years | 0 | 0.0% |
| 85 Years and Over | 11 | 22.9% |
| Total | 48 | 100.0% |
Housing Finances in Olmitz
Median Income by Occupancy in Olmitz
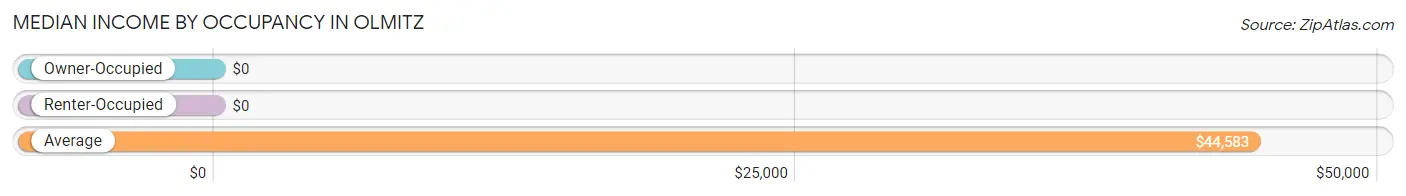
| Occupancy Type | # Households | Median Income |
| Owner-Occupied | 41 (85.4%) | $0 |
| Renter-Occupied | 7 (14.6%) | $0 |
| Average | 48 (100.0%) | $44,583 |
Occupancy by Householder Income Bracket in Olmitz
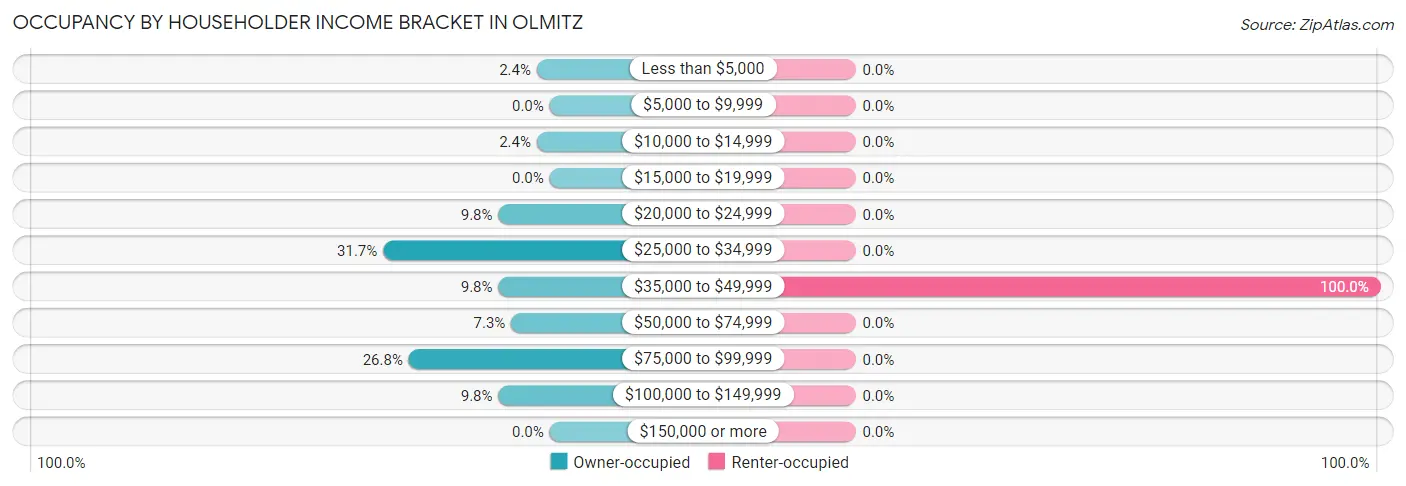
| Income Bracket | Owner-occupied | Renter-occupied |
| Less than $5,000 | 1 (2.4%) | 0 (0.0%) |
| $5,000 to $9,999 | 0 (0.0%) | 0 (0.0%) |
| $10,000 to $14,999 | 1 (2.4%) | 0 (0.0%) |
| $15,000 to $19,999 | 0 (0.0%) | 0 (0.0%) |
| $20,000 to $24,999 | 4 (9.8%) | 0 (0.0%) |
| $25,000 to $34,999 | 13 (31.7%) | 0 (0.0%) |
| $35,000 to $49,999 | 4 (9.8%) | 7 (100.0%) |
| $50,000 to $74,999 | 3 (7.3%) | 0 (0.0%) |
| $75,000 to $99,999 | 11 (26.8%) | 0 (0.0%) |
| $100,000 to $149,999 | 4 (9.8%) | 0 (0.0%) |
| $150,000 or more | 0 (0.0%) | 0 (0.0%) |
| Total | 41 (100.0%) | 7 (100.0%) |
Monthly Housing Cost Tiers in Olmitz
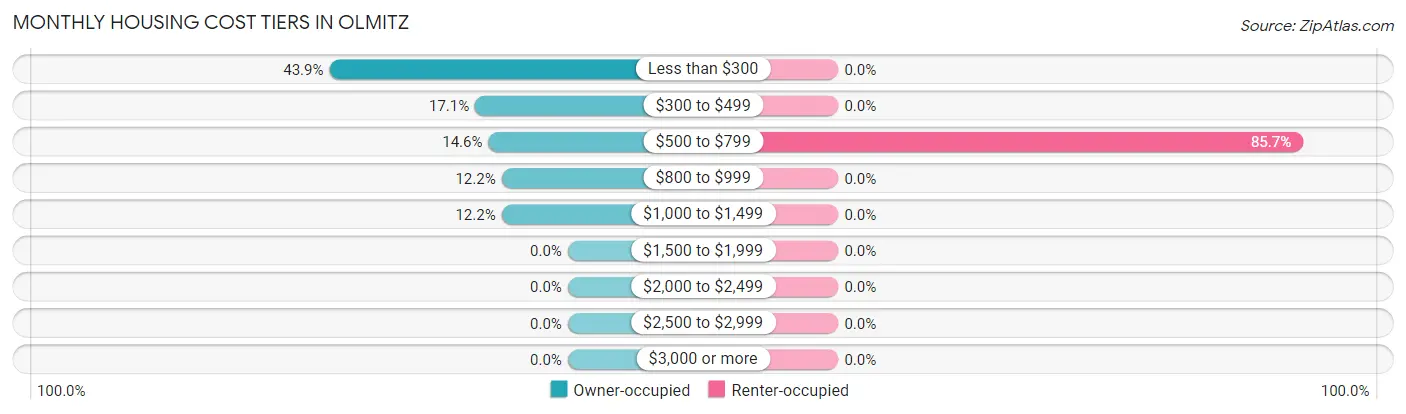
| Monthly Cost | Owner-occupied | Renter-occupied |
| Less than $300 | 18 (43.9%) | 0 (0.0%) |
| $300 to $499 | 7 (17.1%) | 0 (0.0%) |
| $500 to $799 | 6 (14.6%) | 6 (85.7%) |
| $800 to $999 | 5 (12.2%) | 0 (0.0%) |
| $1,000 to $1,499 | 5 (12.2%) | 0 (0.0%) |
| $1,500 to $1,999 | 0 (0.0%) | 0 (0.0%) |
| $2,000 to $2,499 | 0 (0.0%) | 0 (0.0%) |
| $2,500 to $2,999 | 0 (0.0%) | 0 (0.0%) |
| $3,000 or more | 0 (0.0%) | 0 (0.0%) |
| Total | 41 (100.0%) | 7 (100.0%) |
Physical Housing Characteristics in Olmitz
Housing Structures in Olmitz
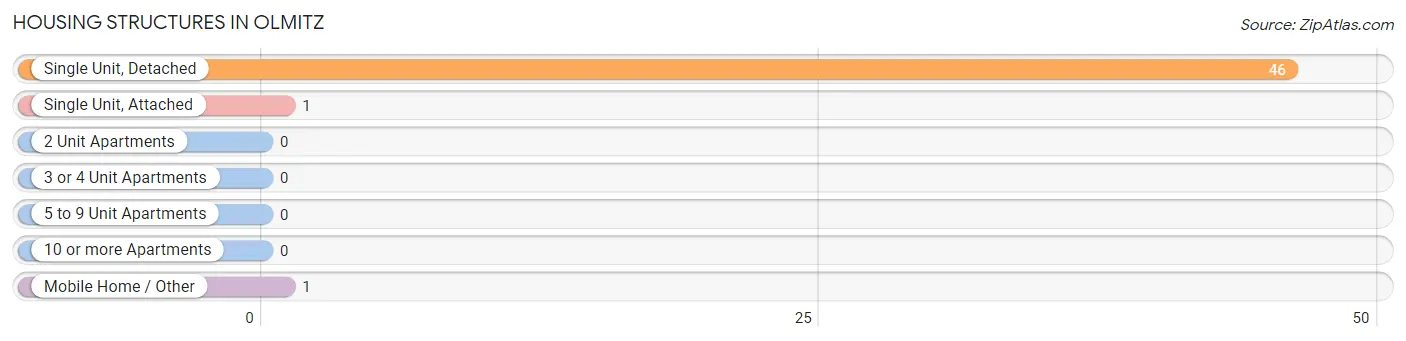
| Structure Type | # Housing Units | % Housing Units |
| Single Unit, Detached | 46 | 95.8% |
| Single Unit, Attached | 1 | 2.1% |
| 2 Unit Apartments | 0 | 0.0% |
| 3 or 4 Unit Apartments | 0 | 0.0% |
| 5 to 9 Unit Apartments | 0 | 0.0% |
| 10 or more Apartments | 0 | 0.0% |
| Mobile Home / Other | 1 | 2.1% |
| Total | 48 | 100.0% |
Housing Structures by Occupancy in Olmitz
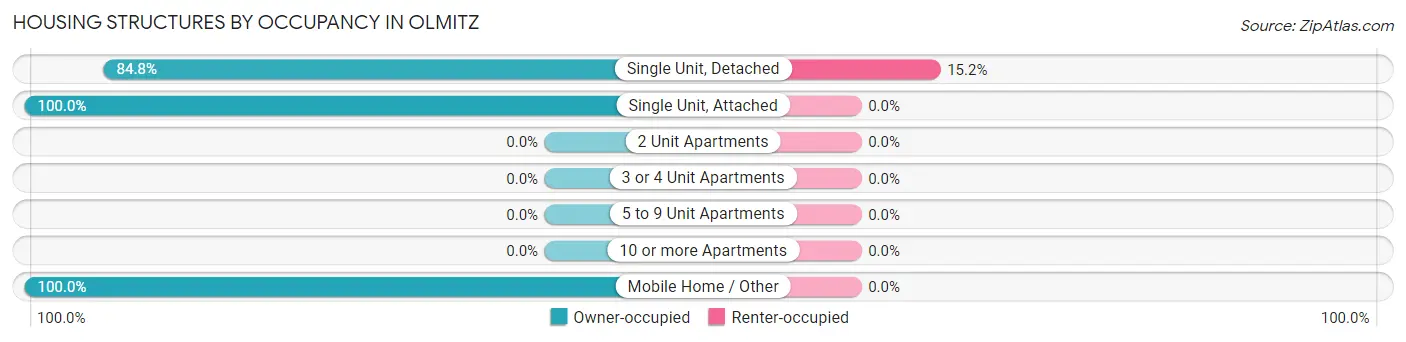
| Structure Type | Owner-occupied | Renter-occupied |
| Single Unit, Detached | 39 (84.8%) | 7 (15.2%) |
| Single Unit, Attached | 1 (100.0%) | 0 (0.0%) |
| 2 Unit Apartments | 0 (0.0%) | 0 (0.0%) |
| 3 or 4 Unit Apartments | 0 (0.0%) | 0 (0.0%) |
| 5 to 9 Unit Apartments | 0 (0.0%) | 0 (0.0%) |
| 10 or more Apartments | 0 (0.0%) | 0 (0.0%) |
| Mobile Home / Other | 1 (100.0%) | 0 (0.0%) |
| Total | 41 (85.4%) | 7 (14.6%) |
Housing Structures by Number of Rooms in Olmitz
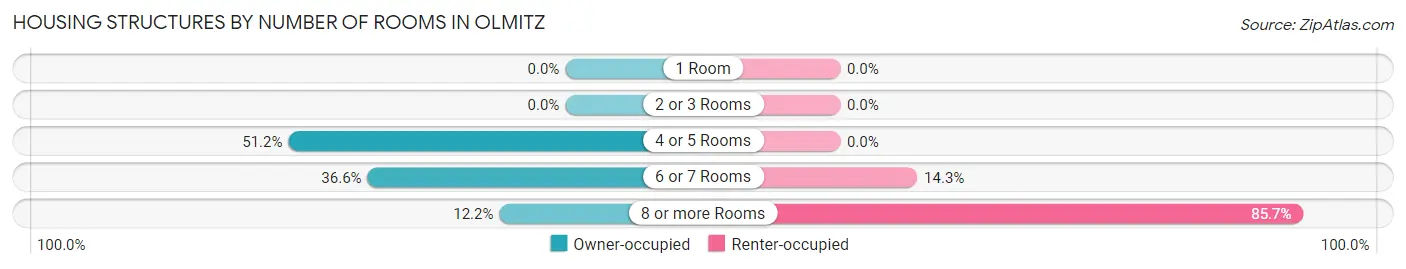
| Number of Rooms | Owner-occupied | Renter-occupied |
| 1 Room | 0 (0.0%) | 0 (0.0%) |
| 2 or 3 Rooms | 0 (0.0%) | 0 (0.0%) |
| 4 or 5 Rooms | 21 (51.2%) | 0 (0.0%) |
| 6 or 7 Rooms | 15 (36.6%) | 1 (14.3%) |
| 8 or more Rooms | 5 (12.2%) | 6 (85.7%) |
| Total | 41 (100.0%) | 7 (100.0%) |
Housing Structure by Heating Type in Olmitz
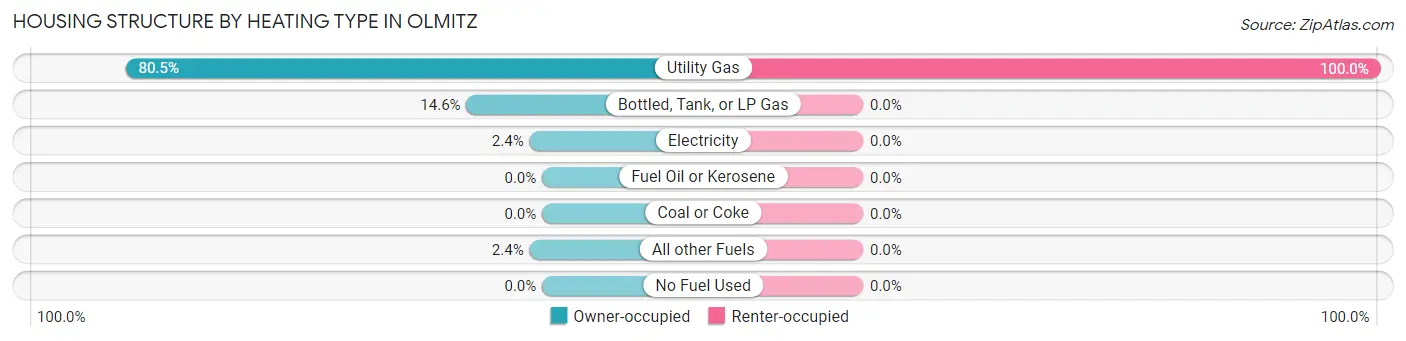
| Heating Type | Owner-occupied | Renter-occupied |
| Utility Gas | 33 (80.5%) | 7 (100.0%) |
| Bottled, Tank, or LP Gas | 6 (14.6%) | 0 (0.0%) |
| Electricity | 1 (2.4%) | 0 (0.0%) |
| Fuel Oil or Kerosene | 0 (0.0%) | 0 (0.0%) |
| Coal or Coke | 0 (0.0%) | 0 (0.0%) |
| All other Fuels | 1 (2.4%) | 0 (0.0%) |
| No Fuel Used | 0 (0.0%) | 0 (0.0%) |
| Total | 41 (100.0%) | 7 (100.0%) |
Household Vehicle Usage in Olmitz
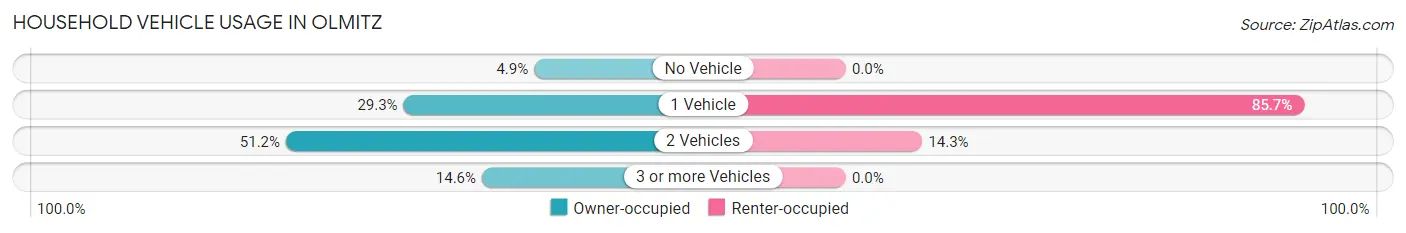
| Vehicles per Household | Owner-occupied | Renter-occupied |
| No Vehicle | 2 (4.9%) | 0 (0.0%) |
| 1 Vehicle | 12 (29.3%) | 6 (85.7%) |
| 2 Vehicles | 21 (51.2%) | 1 (14.3%) |
| 3 or more Vehicles | 6 (14.6%) | 0 (0.0%) |
| Total | 41 (100.0%) | 7 (100.0%) |
Real Estate & Mortgages in Olmitz
Real Estate and Mortgage Overview in Olmitz
| Characteristic | Without Mortgage | With Mortgage |
| Housing Units | 25 | 16 |
| Median Property Value | $21,900 | $60,000 |
| Median Household Income | $26,354 | $0 |
| Monthly Housing Costs | $245 | $0 |
| Real Estate Taxes | $425 | $0 |
Property Value by Mortgage Status in Olmitz
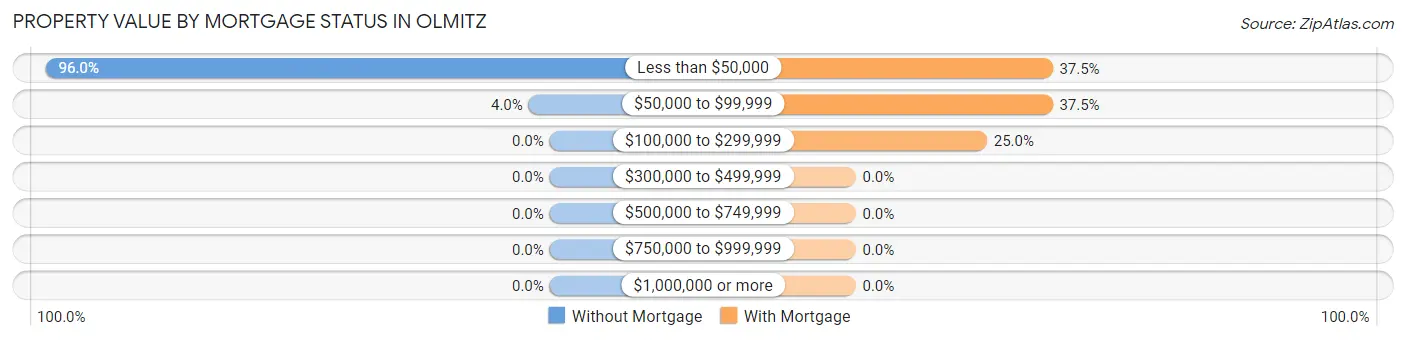
| Property Value | Without Mortgage | With Mortgage |
| Less than $50,000 | 24 (96.0%) | 6 (37.5%) |
| $50,000 to $99,999 | 1 (4.0%) | 6 (37.5%) |
| $100,000 to $299,999 | 0 (0.0%) | 4 (25.0%) |
| $300,000 to $499,999 | 0 (0.0%) | 0 (0.0%) |
| $500,000 to $749,999 | 0 (0.0%) | 0 (0.0%) |
| $750,000 to $999,999 | 0 (0.0%) | 0 (0.0%) |
| $1,000,000 or more | 0 (0.0%) | 0 (0.0%) |
| Total | 25 (100.0%) | 16 (100.0%) |
Household Income by Mortgage Status in Olmitz
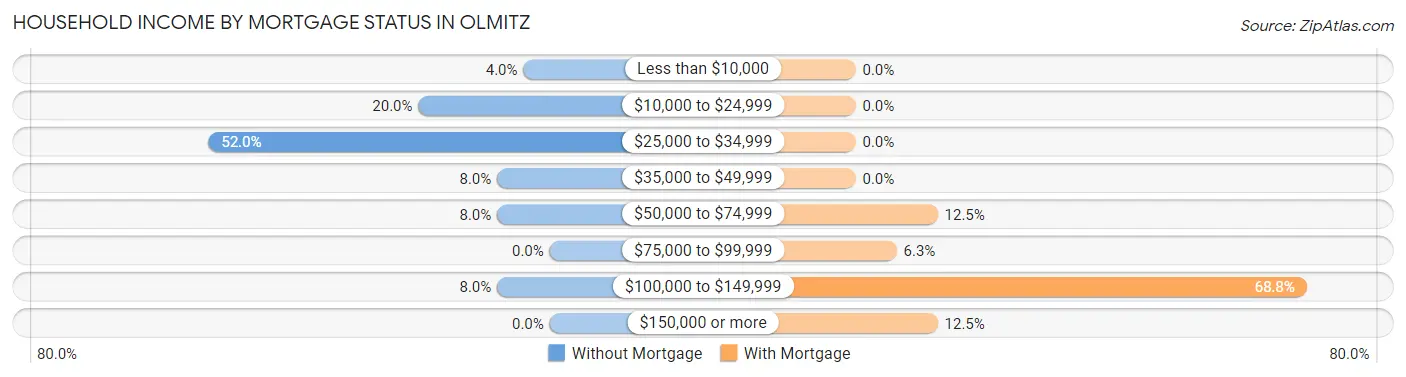
| Household Income | Without Mortgage | With Mortgage |
| Less than $10,000 | 1 (4.0%) | 0 (0.0%) |
| $10,000 to $24,999 | 5 (20.0%) | 0 (0.0%) |
| $25,000 to $34,999 | 13 (52.0%) | 0 (0.0%) |
| $35,000 to $49,999 | 2 (8.0%) | 0 (0.0%) |
| $50,000 to $74,999 | 2 (8.0%) | 2 (12.5%) |
| $75,000 to $99,999 | 0 (0.0%) | 1 (6.2%) |
| $100,000 to $149,999 | 2 (8.0%) | 11 (68.8%) |
| $150,000 or more | 0 (0.0%) | 2 (12.5%) |
| Total | 25 (100.0%) | 16 (100.0%) |
Property Value to Household Income Ratio in Olmitz
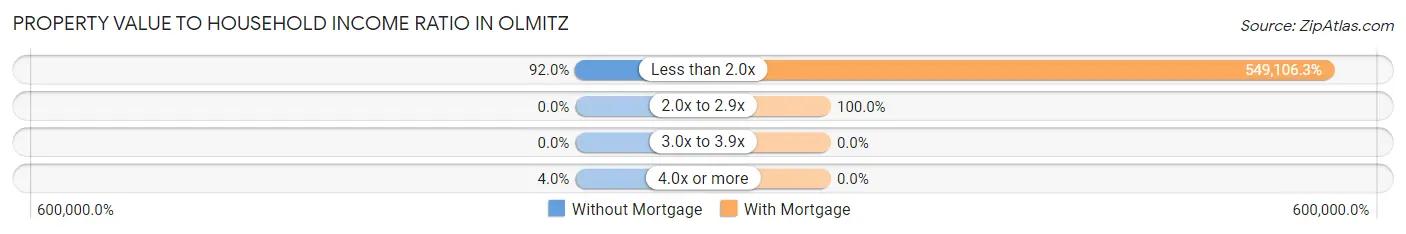
| Value-to-Income Ratio | Without Mortgage | With Mortgage |
| Less than 2.0x | 23 (92.0%) | 87,857 (549,106.2%) |
| 2.0x to 2.9x | 0 (0.0%) | 16 (100.0%) |
| 3.0x to 3.9x | 0 (0.0%) | 0 (0.0%) |
| 4.0x or more | 1 (4.0%) | 0 (0.0%) |
| Total | 25 (100.0%) | 16 (100.0%) |
Real Estate Taxes by Mortgage Status in Olmitz
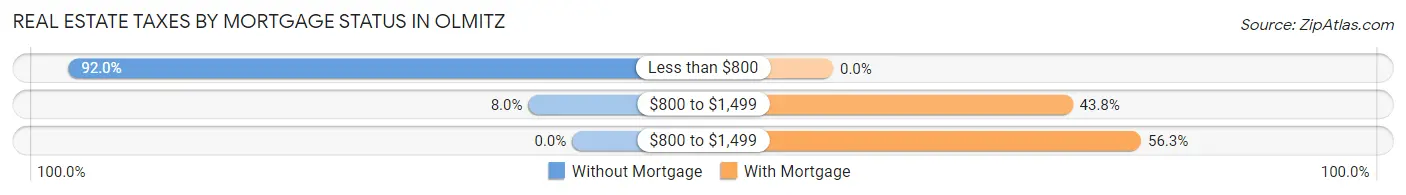
| Property Taxes | Without Mortgage | With Mortgage |
| Less than $800 | 23 (92.0%) | 0 (0.0%) |
| $800 to $1,499 | 2 (8.0%) | 7 (43.8%) |
| $800 to $1,499 | 0 (0.0%) | 9 (56.2%) |
| Total | 25 (100.0%) | 16 (100.0%) |
Health & Disability in Olmitz
Health Insurance Coverage by Age in Olmitz
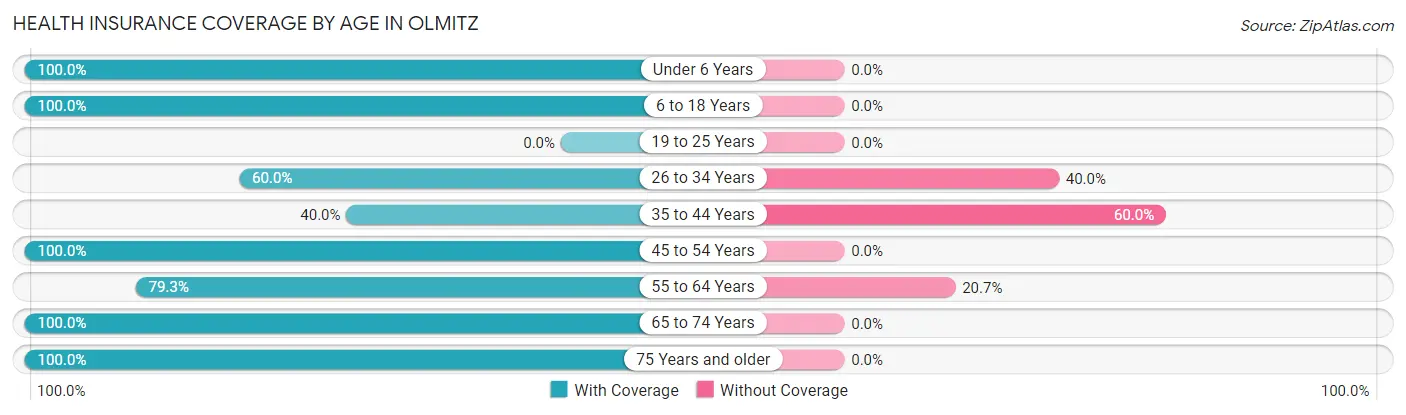
| Age Bracket | With Coverage | Without Coverage |
| Under 6 Years | 1 (100.0%) | 0 (0.0%) |
| 6 to 18 Years | 3 (100.0%) | 0 (0.0%) |
| 19 to 25 Years | 0 (0.0%) | 0 (0.0%) |
| 26 to 34 Years | 3 (60.0%) | 2 (40.0%) |
| 35 to 44 Years | 4 (40.0%) | 6 (60.0%) |
| 45 to 54 Years | 17 (100.0%) | 0 (0.0%) |
| 55 to 64 Years | 23 (79.3%) | 6 (20.7%) |
| 65 to 74 Years | 14 (100.0%) | 0 (0.0%) |
| 75 Years and older | 11 (100.0%) | 0 (0.0%) |
| Total | 76 (84.4%) | 14 (15.6%) |
Health Insurance Coverage by Citizenship Status in Olmitz
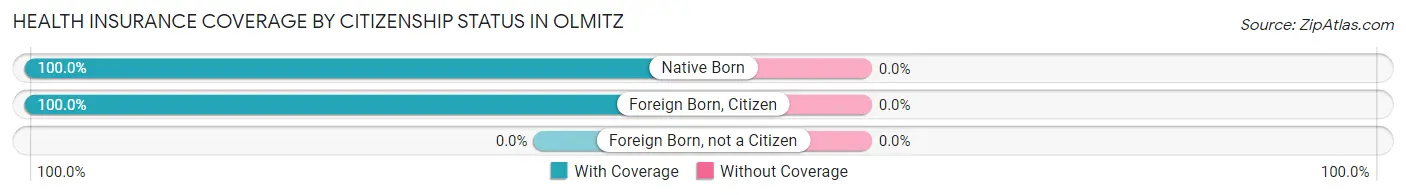
| Citizenship Status | With Coverage | Without Coverage |
| Native Born | 1 (100.0%) | 0 (0.0%) |
| Foreign Born, Citizen | 3 (100.0%) | 0 (0.0%) |
| Foreign Born, not a Citizen | 0 (0.0%) | 0 (0.0%) |
Health Insurance Coverage by Household Income in Olmitz
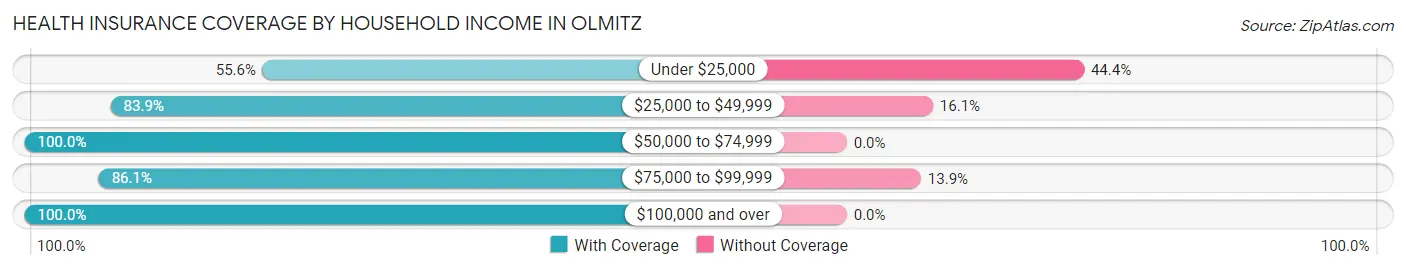
| Household Income | With Coverage | Without Coverage |
| Under $25,000 | 5 (55.6%) | 4 (44.4%) |
| $25,000 to $49,999 | 26 (83.9%) | 5 (16.1%) |
| $50,000 to $74,999 | 6 (100.0%) | 0 (0.0%) |
| $75,000 to $99,999 | 31 (86.1%) | 5 (13.9%) |
| $100,000 and over | 8 (100.0%) | 0 (0.0%) |
Public vs Private Health Insurance Coverage by Age in Olmitz
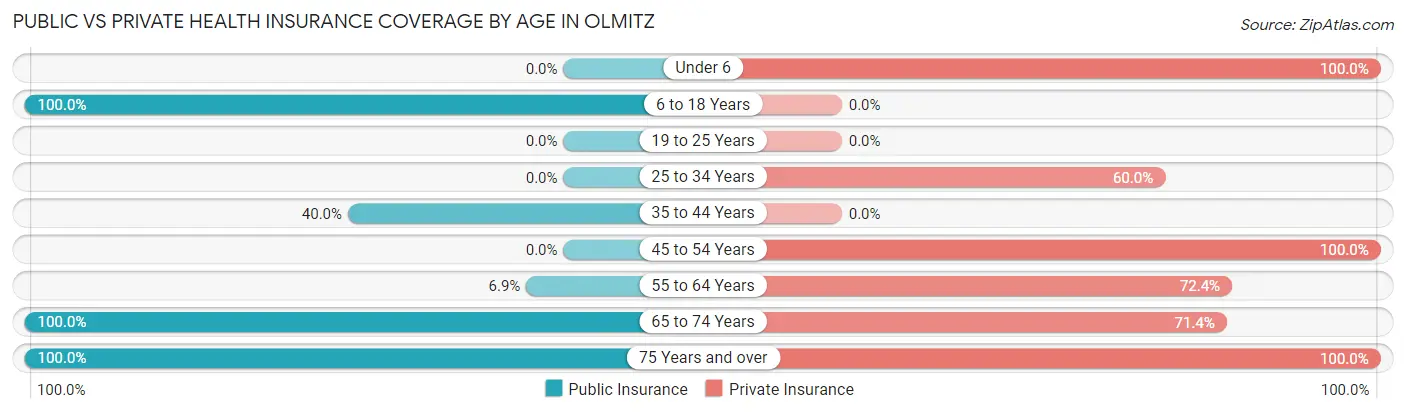
| Age Bracket | Public Insurance | Private Insurance |
| Under 6 | 0 (0.0%) | 1 (100.0%) |
| 6 to 18 Years | 3 (100.0%) | 0 (0.0%) |
| 19 to 25 Years | 0 (0.0%) | 0 (0.0%) |
| 25 to 34 Years | 0 (0.0%) | 3 (60.0%) |
| 35 to 44 Years | 4 (40.0%) | 0 (0.0%) |
| 45 to 54 Years | 0 (0.0%) | 17 (100.0%) |
| 55 to 64 Years | 2 (6.9%) | 21 (72.4%) |
| 65 to 74 Years | 14 (100.0%) | 10 (71.4%) |
| 75 Years and over | 11 (100.0%) | 11 (100.0%) |
| Total | 34 (37.8%) | 63 (70.0%) |
Disability Status by Sex by Age in Olmitz
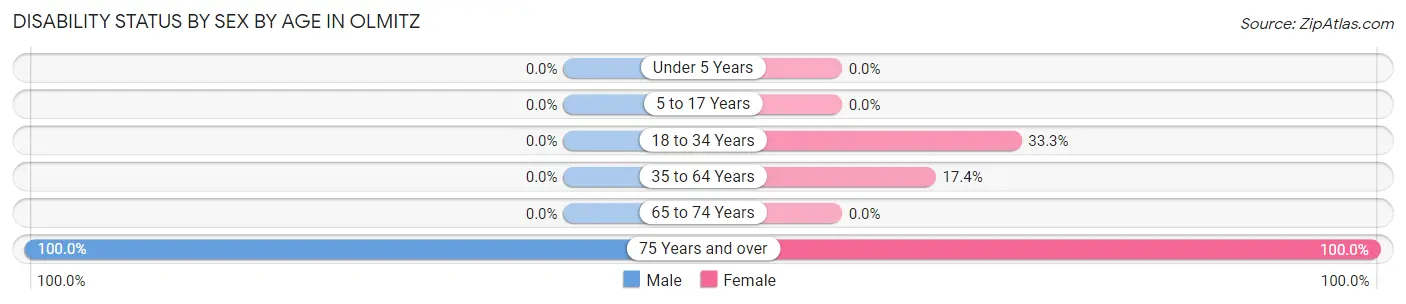
| Age Bracket | Male | Female |
| Under 5 Years | 0 (0.0%) | 0 (0.0%) |
| 5 to 17 Years | 0 (0.0%) | 0 (0.0%) |
| 18 to 34 Years | 0 (0.0%) | 1 (33.3%) |
| 35 to 64 Years | 0 (0.0%) | 4 (17.4%) |
| 65 to 74 Years | 0 (0.0%) | 0 (0.0%) |
| 75 Years and over | 10 (100.0%) | 1 (100.0%) |
Disability Class by Sex by Age in Olmitz
Disability Class: Hearing Difficulty
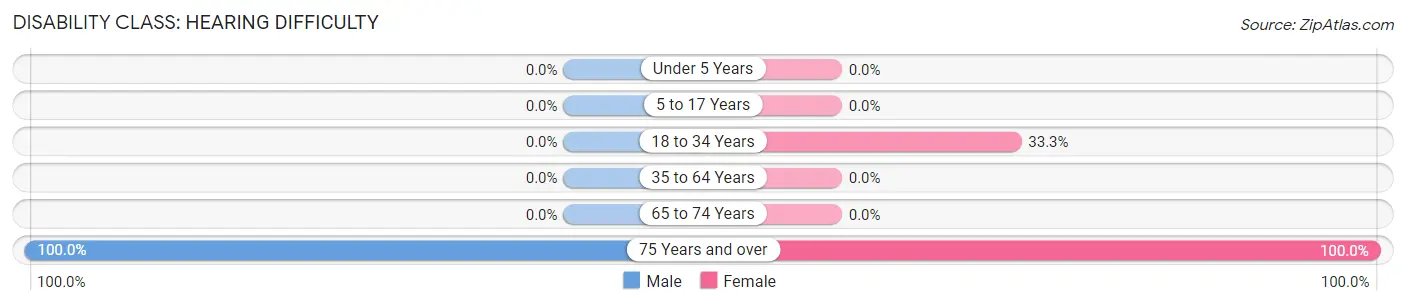
| Age Bracket | Male | Female |
| Under 5 Years | 0 (0.0%) | 0 (0.0%) |
| 5 to 17 Years | 0 (0.0%) | 0 (0.0%) |
| 18 to 34 Years | 0 (0.0%) | 1 (33.3%) |
| 35 to 64 Years | 0 (0.0%) | 0 (0.0%) |
| 65 to 74 Years | 0 (0.0%) | 0 (0.0%) |
| 75 Years and over | 10 (100.0%) | 1 (100.0%) |
Disability Class: Vision Difficulty
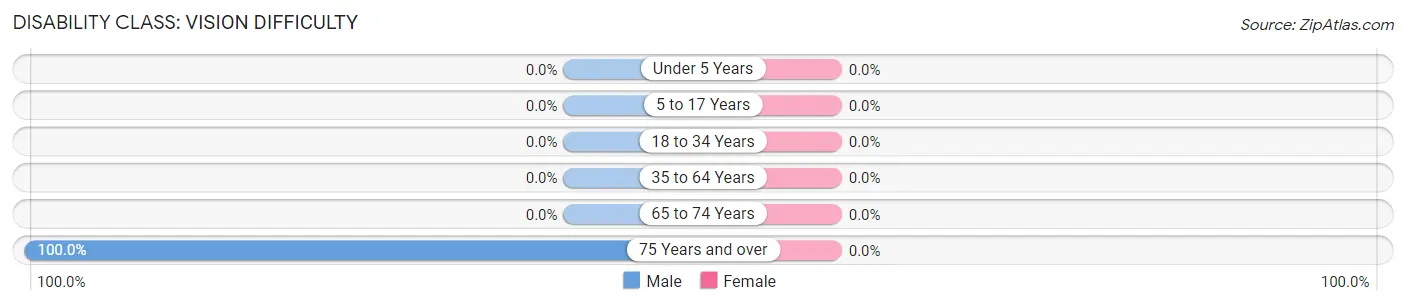
| Age Bracket | Male | Female |
| Under 5 Years | 0 (0.0%) | 0 (0.0%) |
| 5 to 17 Years | 0 (0.0%) | 0 (0.0%) |
| 18 to 34 Years | 0 (0.0%) | 0 (0.0%) |
| 35 to 64 Years | 0 (0.0%) | 0 (0.0%) |
| 65 to 74 Years | 0 (0.0%) | 0 (0.0%) |
| 75 Years and over | 10 (100.0%) | 0 (0.0%) |
Disability Class: Cognitive Difficulty
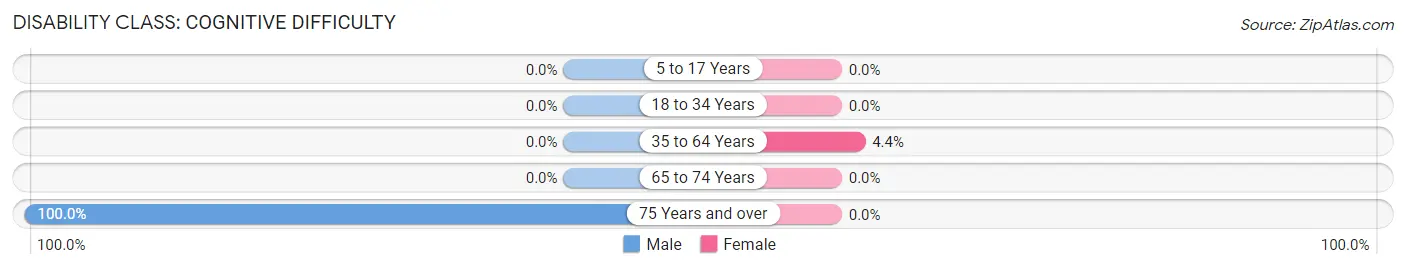
| Age Bracket | Male | Female |
| 5 to 17 Years | 0 (0.0%) | 0 (0.0%) |
| 18 to 34 Years | 0 (0.0%) | 0 (0.0%) |
| 35 to 64 Years | 0 (0.0%) | 1 (4.3%) |
| 65 to 74 Years | 0 (0.0%) | 0 (0.0%) |
| 75 Years and over | 10 (100.0%) | 0 (0.0%) |
Disability Class: Ambulatory Difficulty
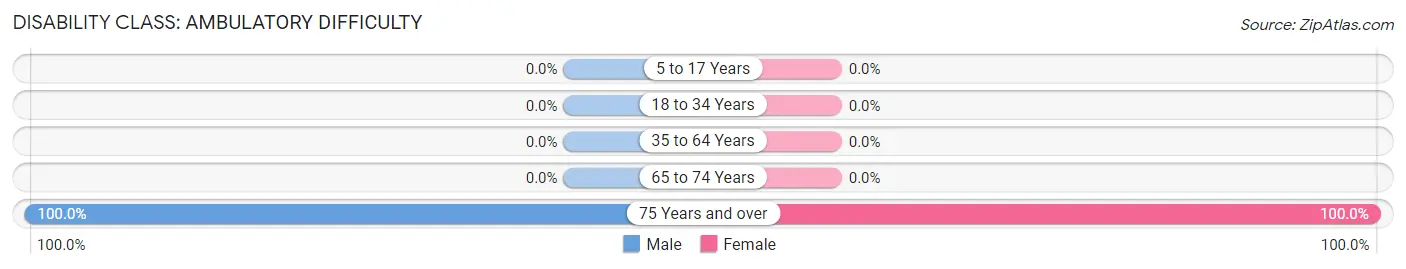
| Age Bracket | Male | Female |
| 5 to 17 Years | 0 (0.0%) | 0 (0.0%) |
| 18 to 34 Years | 0 (0.0%) | 0 (0.0%) |
| 35 to 64 Years | 0 (0.0%) | 0 (0.0%) |
| 65 to 74 Years | 0 (0.0%) | 0 (0.0%) |
| 75 Years and over | 10 (100.0%) | 1 (100.0%) |
Disability Class: Self-Care Difficulty
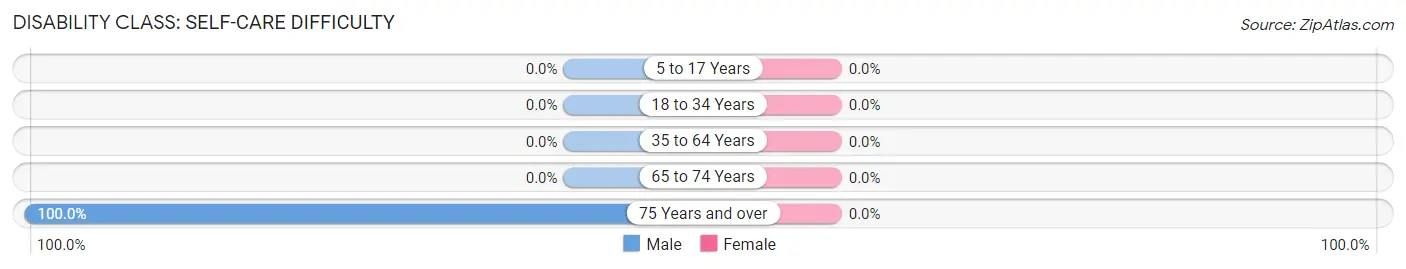
| Age Bracket | Male | Female |
| 5 to 17 Years | 0 (0.0%) | 0 (0.0%) |
| 18 to 34 Years | 0 (0.0%) | 0 (0.0%) |
| 35 to 64 Years | 0 (0.0%) | 0 (0.0%) |
| 65 to 74 Years | 0 (0.0%) | 0 (0.0%) |
| 75 Years and over | 10 (100.0%) | 0 (0.0%) |
Technology Access in Olmitz
Computing Device Access in Olmitz
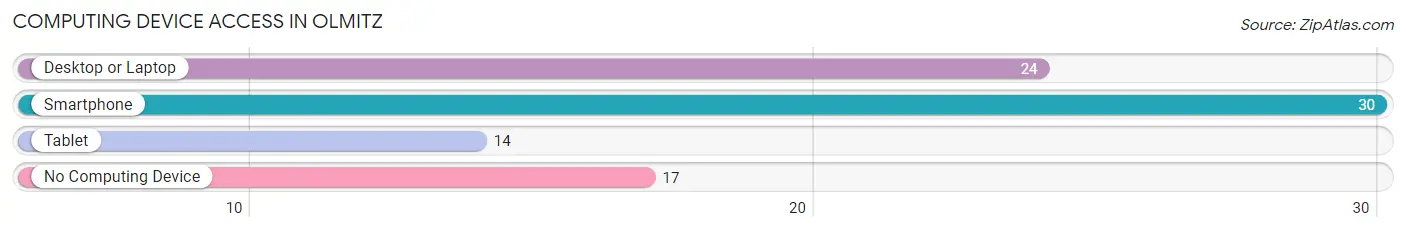
| Device Type | # Households | % Households |
| Desktop or Laptop | 24 | 50.0% |
| Smartphone | 30 | 62.5% |
| Tablet | 14 | 29.2% |
| No Computing Device | 17 | 35.4% |
| Total | 48 | 100.0% |
Internet Access in Olmitz
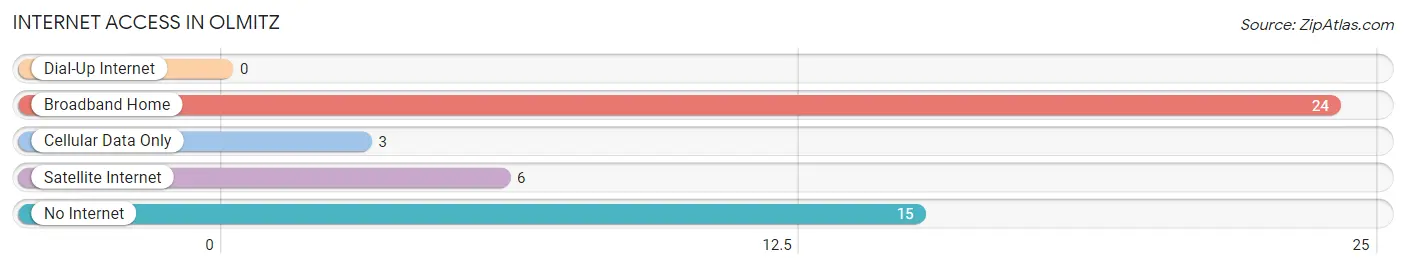
| Internet Type | # Households | % Households |
| Dial-Up Internet | 0 | 0.0% |
| Broadband Home | 24 | 50.0% |
| Cellular Data Only | 3 | 6.2% |
| Satellite Internet | 6 | 12.5% |
| No Internet | 15 | 31.2% |
| Total | 48 | 100.0% |
Olmitz Summary
Olmitz, Kansas is a small town located in Barton County, in the central part of the state. It is situated on the banks of the Arkansas River, about 25 miles south of Great Bend. The town was founded in 1887 and was named after the first postmaster, John Olmitz. The population of Olmitz was estimated to be around 200 people in 2020.
Geography
Olmitz is located in the Great Plains region of the United States. The town is situated on the banks of the Arkansas River, about 25 miles south of Great Bend. The terrain is mostly flat, with some rolling hills in the area. The climate is semi-arid, with hot summers and cold winters. The average annual precipitation is around 20 inches.
Economy
The economy of Olmitz is largely based on agriculture. The town is home to several farms, which produce a variety of crops, including wheat, corn, soybeans, and sorghum. The town also has a few small businesses, including a grocery store, a hardware store, and a few restaurants.
Demographics
The population of Olmitz was estimated to be around 200 people in 2020. The racial makeup of the town is predominantly white, with a small percentage of African Americans and Hispanics. The median household income is around $35,000, and the median home value is around $90,000.
History
Olmitz was founded in 1887 and was named after the first postmaster, John Olmitz. The town was originally a farming community, and the first settlers were mostly German immigrants. The town grew slowly over the years, and by the early 1900s, it had a population of around 500 people.
In the 1920s, the town experienced a period of growth, as the railroad was extended to Olmitz. This allowed the town to become a shipping center for the surrounding area. The population of Olmitz peaked in the 1940s, with around 1,000 people living in the town.
In the 1950s, the population of Olmitz began to decline, as many of the town’s residents moved away in search of better economic opportunities. The population continued to decline over the years, and by the 2000s, it had dropped to around 200 people.
Today, Olmitz is a small, quiet town. It is a popular destination for tourists, who come to enjoy the peaceful atmosphere and the beautiful scenery. The town is also home to several small businesses, which provide employment opportunities for the local residents.
Common Questions
What is Per Capita Income in Olmitz?
Per Capita income in Olmitz is $31,856.
What is the Median Family Income in Olmitz?
Median Family Income in Olmitz is $88,036.
What is the Median Household income in Olmitz?
Median Household Income in Olmitz is $44,583.
What is Inequality or Gini Index in Olmitz?
Inequality or Gini Index in Olmitz is 0.32.
What is the Total Population of Olmitz?
Total Population of Olmitz is 90.
What is the Total Male Population of Olmitz?
Total Male Population of Olmitz is 54.
What is the Total Female Population of Olmitz?
Total Female Population of Olmitz is 36.
What is the Ratio of Males per 100 Females in Olmitz?
There are 150.00 Males per 100 Females in Olmitz.
What is the Ratio of Females per 100 Males in Olmitz?
There are 66.67 Females per 100 Males in Olmitz.
What is the Median Population Age in Olmitz?
Median Population Age in Olmitz is 57.6 Years.
What is the Average Family Size in Olmitz
Average Family Size in Olmitz is 2.9 People.
What is the Average Household Size in Olmitz
Average Household Size in Olmitz is 1.9 People.
How Large is the Labor Force in Olmitz?
There are 48 People in the Labor Forcein in Olmitz.
What is the Percentage of People in the Labor Force in Olmitz?
55.8% of People are in the Labor Force in Olmitz.