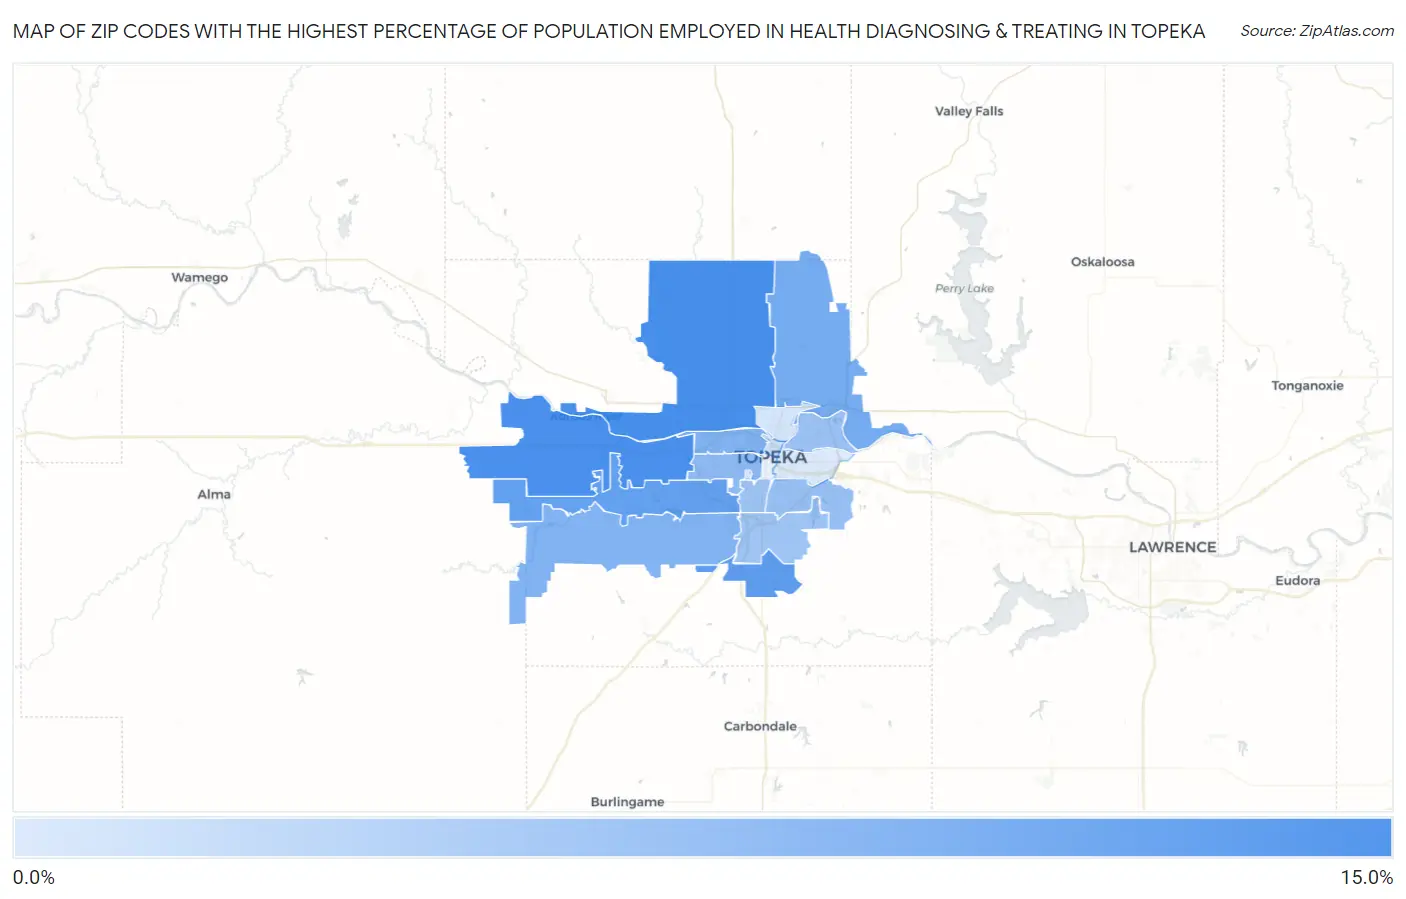
Zip Codes with the Highest Percentage of Population Employed in Health Diagnosing & Treating in Topeka, KS
RELATED REPORTS & OPTIONS
Health Diagnosing & Treating
Topeka
Compare Zip Codes
Map of Zip Codes with the Highest Percentage of Population Employed in Health Diagnosing & Treating in Topeka
0.86%
12.2%
Zip Codes with the Highest Percentage of Population Employed in Health Diagnosing & Treating in Topeka, KS
| Zip Code | % Employed | vs State | vs National | |
| 1. | 66618 | 12.2% | 6.6%(+5.64)#52 | 6.2%(+5.99)#2,086 |
| 2. | 66615 | 12.0% | 6.6%(+5.37)#54 | 6.2%(+5.72)#2,234 |
| 3. | 66619 | 10.3% | 6.6%(+3.73)#83 | 6.2%(+4.09)#3,491 |
| 4. | 66614 | 10.1% | 6.6%(+3.53)#92 | 6.2%(+3.89)#3,722 |
| 5. | 66617 | 8.6% | 6.6%(+1.98)#148 | 6.2%(+2.33)#6,175 |
| 6. | 66606 | 7.7% | 6.6%(+1.09)#191 | 6.2%(+1.44)#8,295 |
| 7. | 66610 | 7.6% | 6.6%(+1.05)#192 | 6.2%(+1.40)#8,385 |
| 8. | 66604 | 6.7% | 6.6%(+0.142)#239 | 6.2%(+0.492)#11,207 |
| 9. | 66605 | 6.0% | 6.6%(-0.611)#292 | 6.2%(-0.260)#13,931 |
| 10. | 66616 | 5.8% | 6.6%(-0.802)#306 | 6.2%(-0.451)#14,625 |
| 11. | 66609 | 5.4% | 6.6%(-1.17)#332 | 6.2%(-0.824)#16,088 |
| 12. | 66611 | 5.4% | 6.6%(-1.22)#339 | 6.2%(-0.871)#16,272 |
| 13. | 66603 | 2.2% | 6.6%(-4.39)#537 | 6.2%(-4.04)#26,099 |
| 14. | 66608 | 1.5% | 6.6%(-5.14)#574 | 6.2%(-4.79)#27,266 |
| 15. | 66621 | 1.3% | 6.6%(-5.28)#578 | 6.2%(-4.93)#27,438 |
| 16. | 66607 | 0.86% | 6.6%(-5.73)#597 | 6.2%(-5.38)#27,996 |
1
Common Questions
What are the Top 10 Zip Codes with the Highest Percentage of Population Employed in Health Diagnosing & Treating in Topeka, KS?
Top 10 Zip Codes with the Highest Percentage of Population Employed in Health Diagnosing & Treating in Topeka, KS are:
What zip code has the Highest Percentage of Population Employed in Health Diagnosing & Treating in Topeka, KS?
66618 has the Highest Percentage of Population Employed in Health Diagnosing & Treating in Topeka, KS with 12.2%.
What is the Percentage of Population Employed in Health Diagnosing & Treating in Topeka, KS?
Percentage of Population Employed in Health Diagnosing & Treating in Topeka is 6.7%.
What is the Percentage of Population Employed in Health Diagnosing & Treating in Kansas?
Percentage of Population Employed in Health Diagnosing & Treating in Kansas is 6.6%.
What is the Percentage of Population Employed in Health Diagnosing & Treating in the United States?
Percentage of Population Employed in Health Diagnosing & Treating in the United States is 6.2%.