Conkling Park, ID Map & Demographics
Conkling Park Map
Conkling Park Overview
$27,688
PER CAPITA INCOME
$32,014
AVG FAMILY INCOME
$32,118
AVG HOUSEHOLD INCOME
0.40
INEQUALITY / GINI INDEX
130
TOTAL POPULATION
65
MALE POPULATION
65
FEMALE POPULATION
100.00
MALES / 100 FEMALES
100.00
FEMALES / 100 MALES
68.3
MEDIAN AGE
2.0
AVG FAMILY SIZE
1.9
AVG HOUSEHOLD SIZE
23
LABOR FORCE [ PEOPLE ]
17.7%
PERCENT IN LABOR FORCE
Income in Conkling Park
Income Overview in Conkling Park
Per Capita Income in Conkling Park is $27,688, while median incomes of families and households are $32,014 and $32,118 respectively.
| Characteristic | Number | Measure |
| Per Capita Income | 130 | $27,688 |
| Median Family Income | 64 | $32,014 |
| Mean Family Income | 64 | $55,100 |
| Median Household Income | 67 | $32,118 |
| Mean Household Income | 67 | $54,910 |
| Income Deficit | 64 | $0 |
| Wage / Income Gap (%) | 130 | 0.00% |
| Wage / Income Gap ($) | 130 | 100.00¢ per $1 |
| Gini / Inequality Index | 130 | 0.40 |
Earnings by Sex in Conkling Park
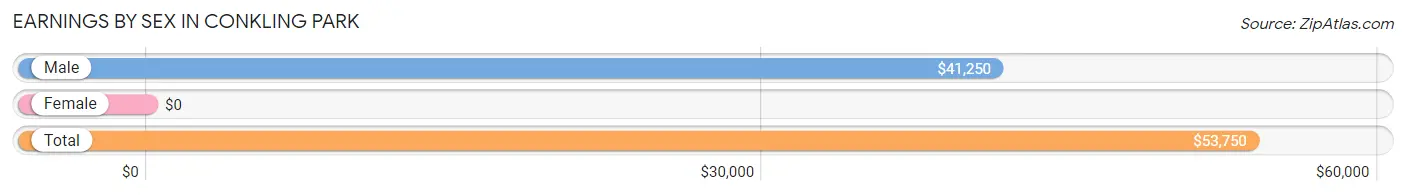
| Sex | Number | Average Earnings |
| Male | 15 (57.7%) | $41,250 |
| Female | 11 (42.3%) | $0 |
| Total | 26 (100.0%) | $53,750 |
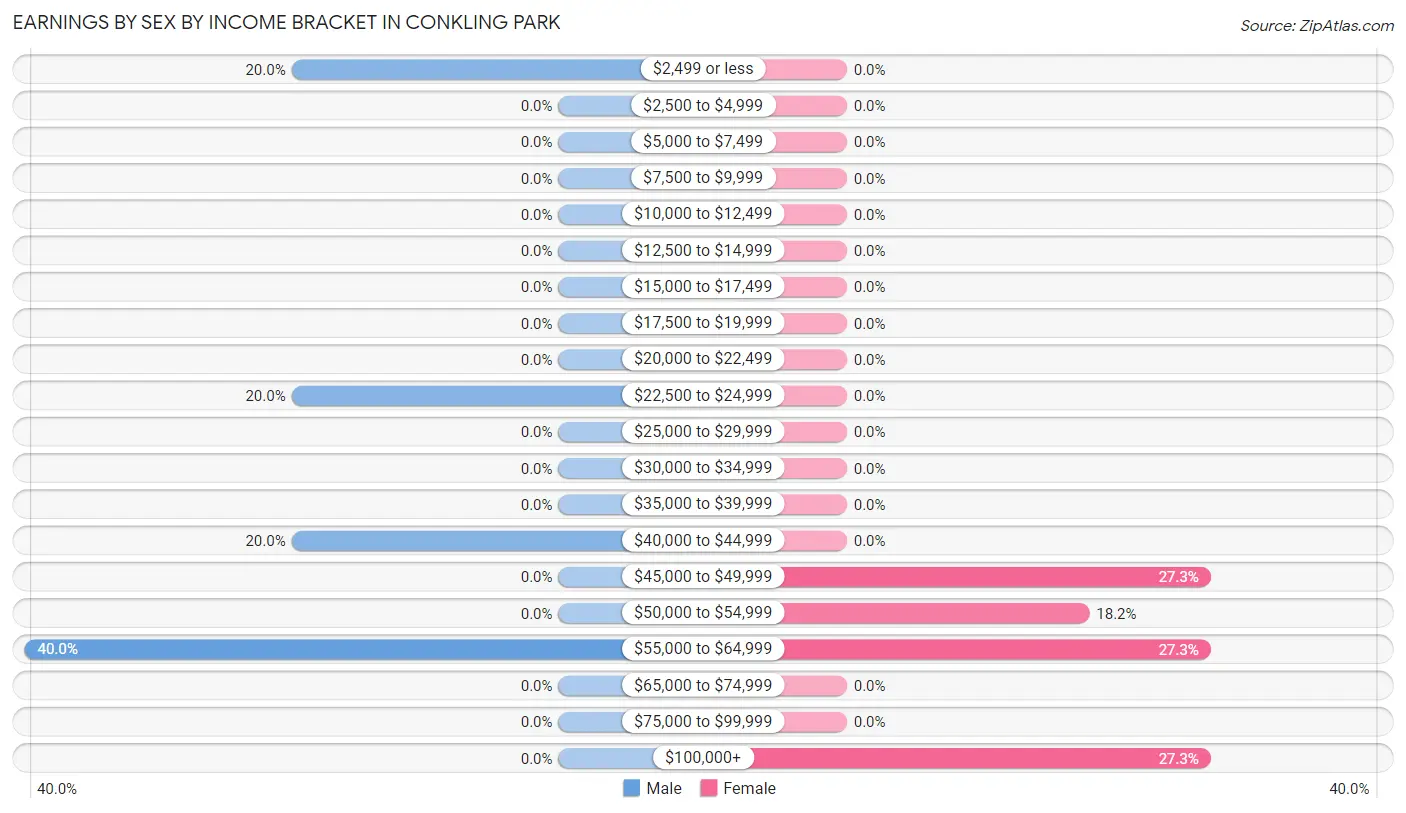
Earnings by Sex by Income Bracket in Conkling Park
The most common earnings brackets in Conkling Park are $55,000 to $64,999 for men (6 | 40.0%) and $45,000 to $49,999 for women (3 | 27.3%).
| Income | Male | Female |
| $2,499 or less | 3 (20.0%) | 0 (0.0%) |
| $2,500 to $4,999 | 0 (0.0%) | 0 (0.0%) |
| $5,000 to $7,499 | 0 (0.0%) | 0 (0.0%) |
| $7,500 to $9,999 | 0 (0.0%) | 0 (0.0%) |
| $10,000 to $12,499 | 0 (0.0%) | 0 (0.0%) |
| $12,500 to $14,999 | 0 (0.0%) | 0 (0.0%) |
| $15,000 to $17,499 | 0 (0.0%) | 0 (0.0%) |
| $17,500 to $19,999 | 0 (0.0%) | 0 (0.0%) |
| $20,000 to $22,499 | 0 (0.0%) | 0 (0.0%) |
| $22,500 to $24,999 | 3 (20.0%) | 0 (0.0%) |
| $25,000 to $29,999 | 0 (0.0%) | 0 (0.0%) |
| $30,000 to $34,999 | 0 (0.0%) | 0 (0.0%) |
| $35,000 to $39,999 | 0 (0.0%) | 0 (0.0%) |
| $40,000 to $44,999 | 3 (20.0%) | 0 (0.0%) |
| $45,000 to $49,999 | 0 (0.0%) | 3 (27.3%) |
| $50,000 to $54,999 | 0 (0.0%) | 2 (18.2%) |
| $55,000 to $64,999 | 6 (40.0%) | 3 (27.3%) |
| $65,000 to $74,999 | 0 (0.0%) | 0 (0.0%) |
| $75,000 to $99,999 | 0 (0.0%) | 0 (0.0%) |
| $100,000+ | 0 (0.0%) | 3 (27.3%) |
| Total | 15 (100.0%) | 11 (100.0%) |
Earnings by Sex by Educational Attainment in Conkling Park
| Educational Attainment | Male Income | Female Income |
| Less than High School | - | - |
| High School Diploma | - | - |
| College or Associate's Degree | - | - |
| Bachelor's Degree | - | - |
| Graduate Degree | - | - |
| Total | $41,250 | $0 |
Family Income in Conkling Park
Family Income Brackets in Conkling Park
According to the Conkling Park family income data, there are 36 families falling into the $25,000 to $34,999 income range, which is the most common income bracket and makes up 56.2% of all families.
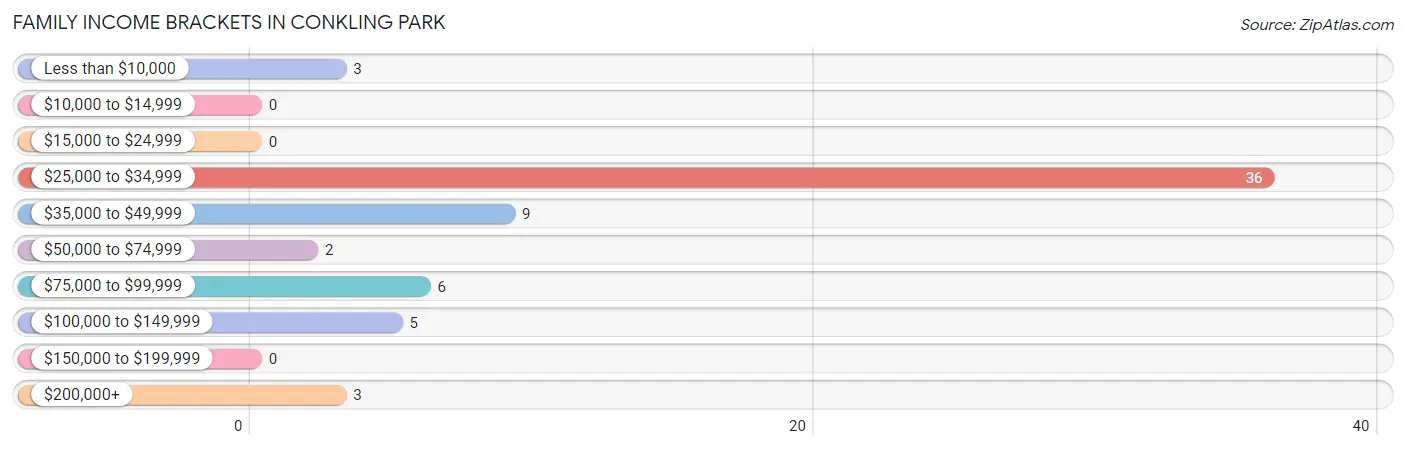
| Income Bracket | # Families | % Families |
| Less than $10,000 | 3 | 4.7% |
| $10,000 to $14,999 | 0 | 0.0% |
| $15,000 to $24,999 | 0 | 0.0% |
| $25,000 to $34,999 | 36 | 56.3% |
| $35,000 to $49,999 | 9 | 14.1% |
| $50,000 to $74,999 | 2 | 3.1% |
| $75,000 to $99,999 | 6 | 9.4% |
| $100,000 to $149,999 | 5 | 7.8% |
| $150,000 to $199,999 | 0 | 0.0% |
| $200,000+ | 3 | 4.7% |
Family Income by Famaliy Size in Conkling Park
2-person families (62 | 96.9%) account for the highest median family income in Conkling Park with $31,944 per family, while 2-person families (62 | 96.9%) have the highest median income of $15,972 per family member.
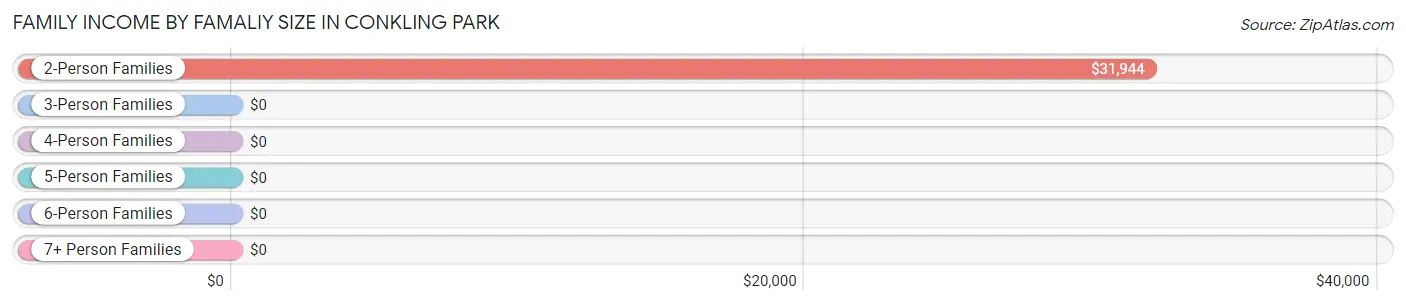
| Income Bracket | # Families | Median Income |
| 2-Person Families | 62 (96.9%) | $31,944 |
| 3-Person Families | 0 (0.0%) | $0 |
| 4-Person Families | 2 (3.1%) | $0 |
| 5-Person Families | 0 (0.0%) | $0 |
| 6-Person Families | 0 (0.0%) | $0 |
| 7+ Person Families | 0 (0.0%) | $0 |
| Total | 64 (100.0%) | $32,014 |
Family Income by Number of Earners in Conkling Park
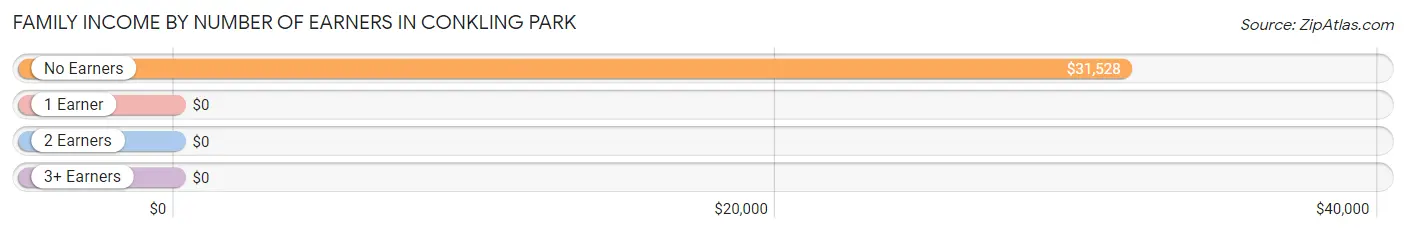
| Number of Earners | # Families | Median Income |
| No Earners | 50 (78.1%) | $31,528 |
| 1 Earner | 3 (4.7%) | $0 |
| 2 Earners | 11 (17.2%) | $0 |
| 3+ Earners | 0 (0.0%) | $0 |
| Total | 64 (100.0%) | $32,014 |
Household Income in Conkling Park
Household Income Brackets in Conkling Park
With 36 households falling in the category, the $25,000 to $34,999 income range is the most frequent in Conkling Park, accounting for 53.7% of all households.
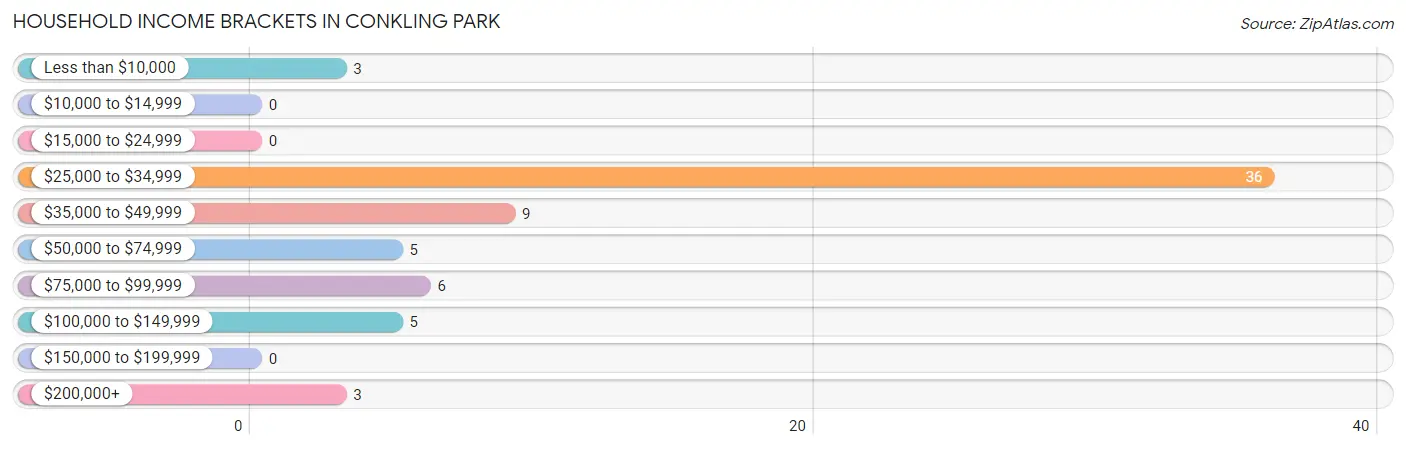
| Income Bracket | # Households | % Households |
| Less than $10,000 | 3 | 4.5% |
| $10,000 to $14,999 | 0 | 0.0% |
| $15,000 to $24,999 | 0 | 0.0% |
| $25,000 to $34,999 | 36 | 53.7% |
| $35,000 to $49,999 | 9 | 13.4% |
| $50,000 to $74,999 | 5 | 7.5% |
| $75,000 to $99,999 | 6 | 9.0% |
| $100,000 to $149,999 | 5 | 7.5% |
| $150,000 to $199,999 | 0 | 0.0% |
| $200,000+ | 3 | 4.5% |
Household Income by Householder Age in Conkling Park
The median household income in Conkling Park is $32,118, with the highest median household income of $51,250 found in the 45 to 64 years age bracket for the primary householder. A total of 21 households (31.3%) fall into this category.
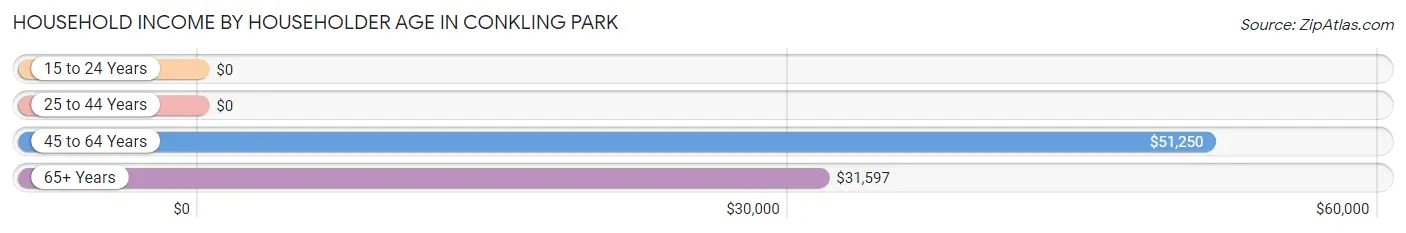
| Income Bracket | # Households | Median Income |
| 15 to 24 Years | 0 (0.0%) | $0 |
| 25 to 44 Years | 0 (0.0%) | $0 |
| 45 to 64 Years | 21 (31.3%) | $51,250 |
| 65+ Years | 46 (68.7%) | $31,597 |
| Total | 67 (100.0%) | $32,118 |
Poverty in Conkling Park
Income Below Poverty by Sex and Age in Conkling Park
With 4.6% poverty level for males and 4.6% for females among the residents of Conkling Park, 55 to 64 year old males and 55 to 64 year old females are the most vulnerable to poverty, with 3 males (14.3%) and 3 females (27.3%) in their respective age groups living below the poverty level.
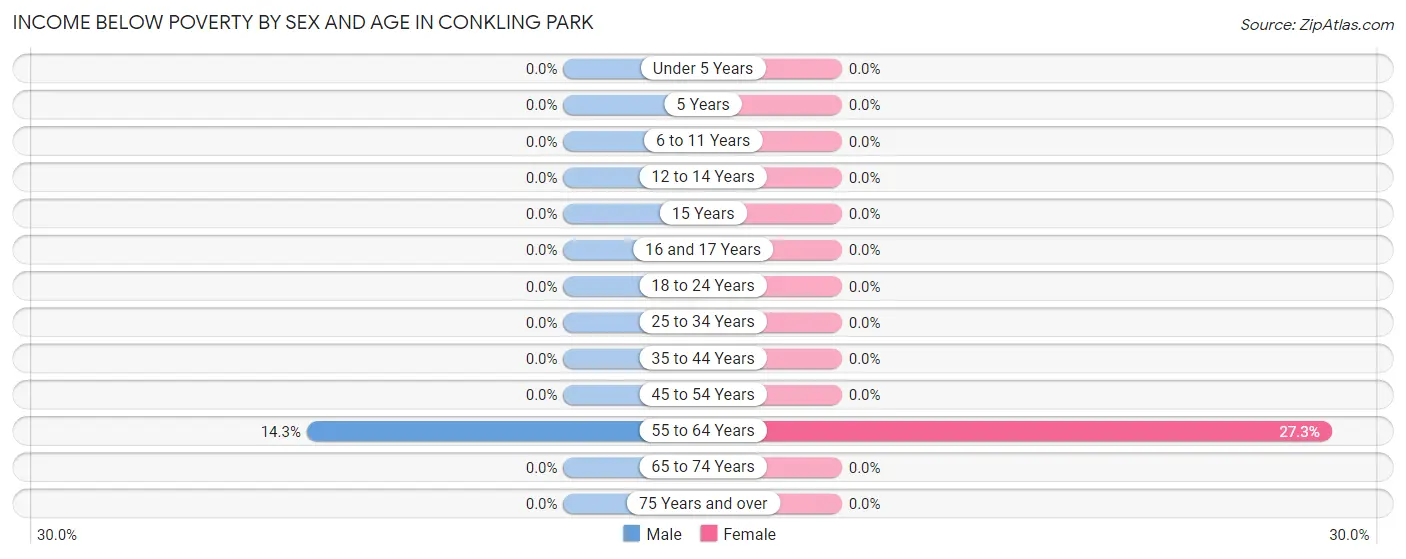
| Age Bracket | Male | Female |
| Under 5 Years | 0 (0.0%) | 0 (0.0%) |
| 5 Years | 0 (0.0%) | 0 (0.0%) |
| 6 to 11 Years | 0 (0.0%) | 0 (0.0%) |
| 12 to 14 Years | 0 (0.0%) | 0 (0.0%) |
| 15 Years | 0 (0.0%) | 0 (0.0%) |
| 16 and 17 Years | 0 (0.0%) | 0 (0.0%) |
| 18 to 24 Years | 0 (0.0%) | 0 (0.0%) |
| 25 to 34 Years | 0 (0.0%) | 0 (0.0%) |
| 35 to 44 Years | 0 (0.0%) | 0 (0.0%) |
| 45 to 54 Years | 0 (0.0%) | 0 (0.0%) |
| 55 to 64 Years | 3 (14.3%) | 3 (27.3%) |
| 65 to 74 Years | 0 (0.0%) | 0 (0.0%) |
| 75 Years and over | 0 (0.0%) | 0 (0.0%) |
| Total | 3 (4.6%) | 3 (4.6%) |
Income Above Poverty by Sex and Age in Conkling Park
According to the poverty statistics in Conkling Park, males aged 45 to 54 years and females aged 45 to 54 years are the age groups that are most secure financially, with 100.0% of males and 100.0% of females in these age groups living above the poverty line.
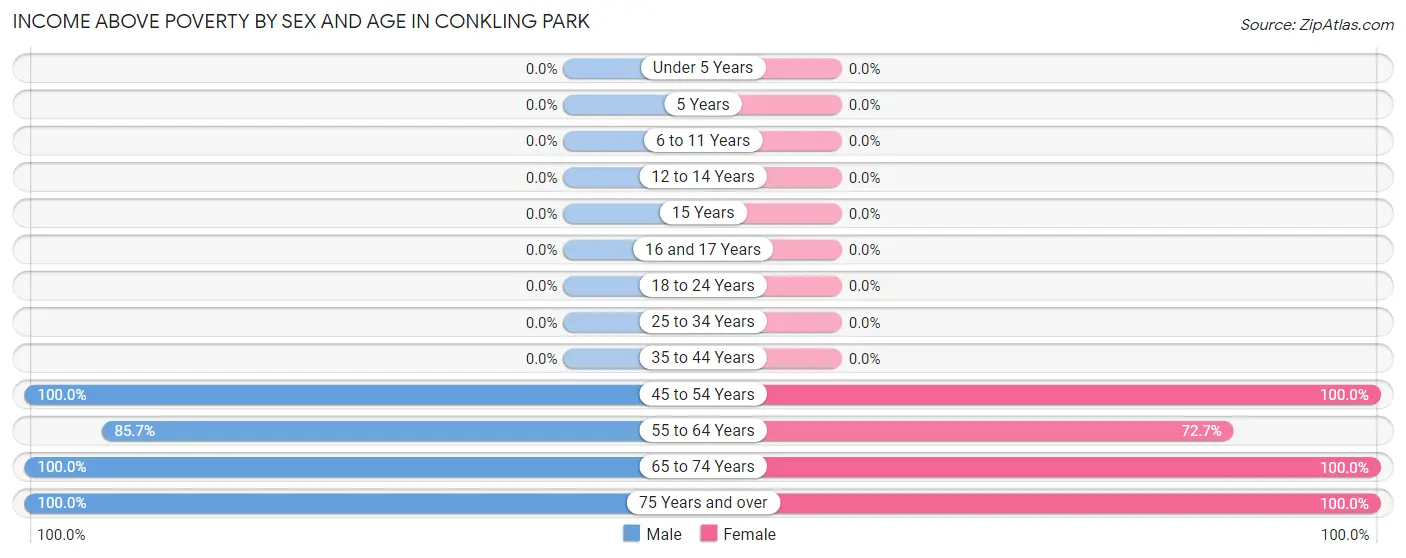
| Age Bracket | Male | Female |
| Under 5 Years | 0 (0.0%) | 0 (0.0%) |
| 5 Years | 0 (0.0%) | 0 (0.0%) |
| 6 to 11 Years | 0 (0.0%) | 0 (0.0%) |
| 12 to 14 Years | 0 (0.0%) | 0 (0.0%) |
| 15 Years | 0 (0.0%) | 0 (0.0%) |
| 16 and 17 Years | 0 (0.0%) | 0 (0.0%) |
| 18 to 24 Years | 0 (0.0%) | 0 (0.0%) |
| 25 to 34 Years | 0 (0.0%) | 0 (0.0%) |
| 35 to 44 Years | 0 (0.0%) | 0 (0.0%) |
| 45 to 54 Years | 3 (100.0%) | 8 (100.0%) |
| 55 to 64 Years | 18 (85.7%) | 8 (72.7%) |
| 65 to 74 Years | 33 (100.0%) | 36 (100.0%) |
| 75 Years and over | 8 (100.0%) | 10 (100.0%) |
| Total | 62 (95.4%) | 62 (95.4%) |
Income Below Poverty Among Married-Couple Families in Conkling Park
The poverty statistics for married-couple families in Conkling Park show that 4.9% or 3 of the total 61 families live below the poverty line. Families with no children have the highest poverty rate of 4.9%, comprising of 3 families. On the other hand, families with no children have the lowest poverty rate of 4.9%, which includes 3 families.
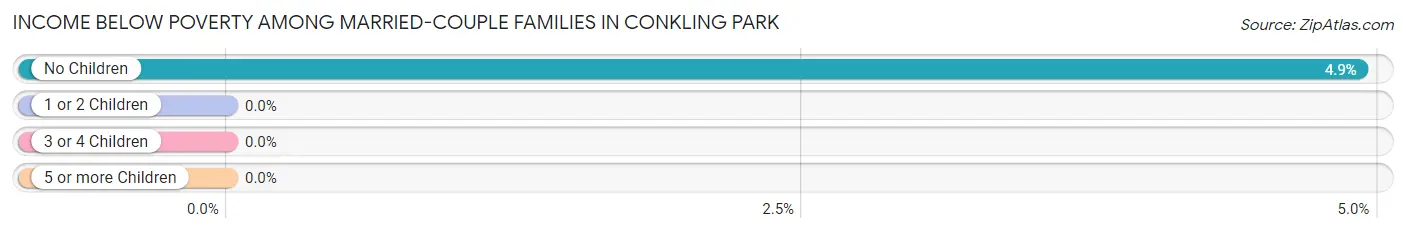
| Children | Above Poverty | Below Poverty |
| No Children | 58 (95.1%) | 3 (4.9%) |
| 1 or 2 Children | 0 (0.0%) | 0 (0.0%) |
| 3 or 4 Children | 0 (0.0%) | 0 (0.0%) |
| 5 or more Children | 0 (0.0%) | 0 (0.0%) |
| Total | 58 (95.1%) | 3 (4.9%) |
Income Below Poverty Among Single-Parent Households in Conkling Park
| Children | Single Father | Single Mother |
| No Children | 0 (0.0%) | 0 (0.0%) |
| 1 or 2 Children | 0 (0.0%) | 0 (0.0%) |
| 3 or 4 Children | 0 (0.0%) | 0 (0.0%) |
| 5 or more Children | 0 (0.0%) | 0 (0.0%) |
| Total | 0 (0.0%) | 0 (0.0%) |
Income Below Poverty Among Married-Couple vs Single-Parent Households in Conkling Park
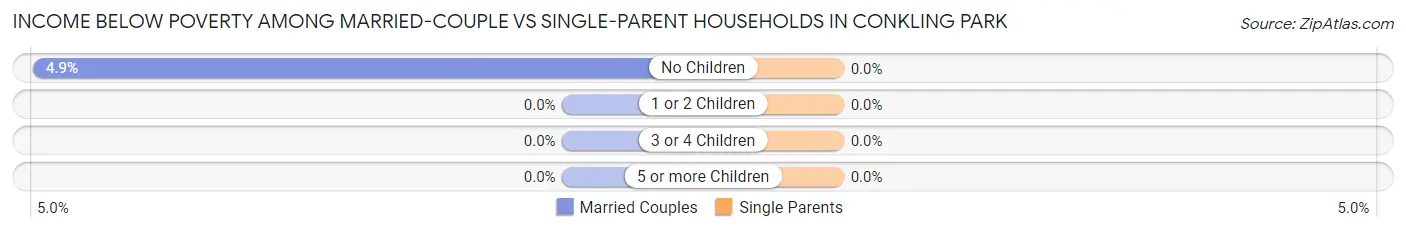
| Children | Married-Couple Families | Single-Parent Households |
| No Children | 3 (4.9%) | 0 (0.0%) |
| 1 or 2 Children | 0 (0.0%) | 0 (0.0%) |
| 3 or 4 Children | 0 (0.0%) | 0 (0.0%) |
| 5 or more Children | 0 (0.0%) | 0 (0.0%) |
| Total | 3 (4.9%) | 0 (0.0%) |
Race in Conkling Park
The most populous races in Conkling Park are , and White / Caucasian (130 | 100.0%).
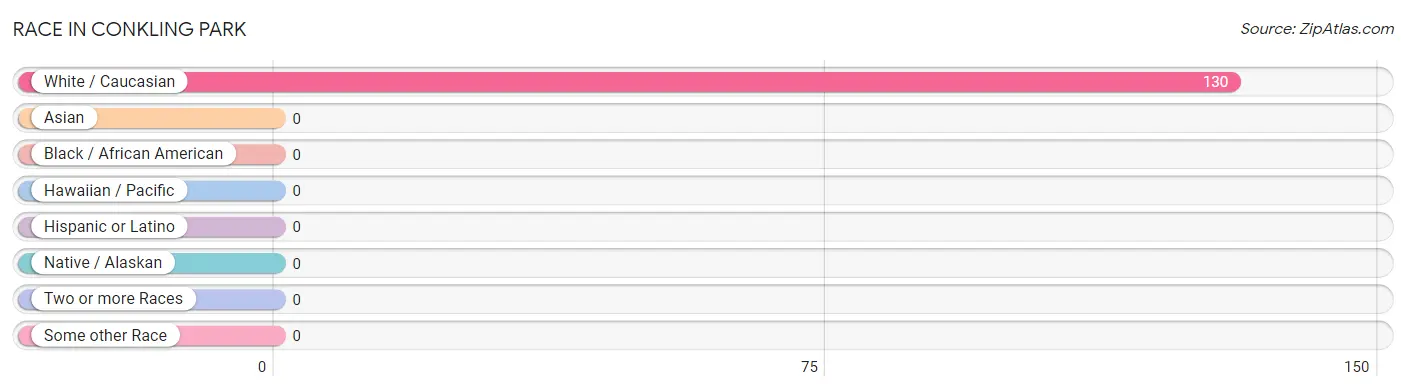
| Race | # Population | % Population |
| Asian | 0 | 0.0% |
| Black / African American | 0 | 0.0% |
| Hawaiian / Pacific | 0 | 0.0% |
| Hispanic or Latino | 0 | 0.0% |
| Native / Alaskan | 0 | 0.0% |
| White / Caucasian | 130 | 100.0% |
| Two or more Races | 0 | 0.0% |
| Some other Race | 0 | 0.0% |
| Total | 130 | 100.0% |
Ancestry in Conkling Park
The most populous ancestries reported in Conkling Park are Irish (39 | 30.0%), German (38 | 29.2%), English (24 | 18.5%), Norwegian (5 | 3.8%), and Scottish (5 | 3.8%), together accounting for 85.4% of all Conkling Park residents.
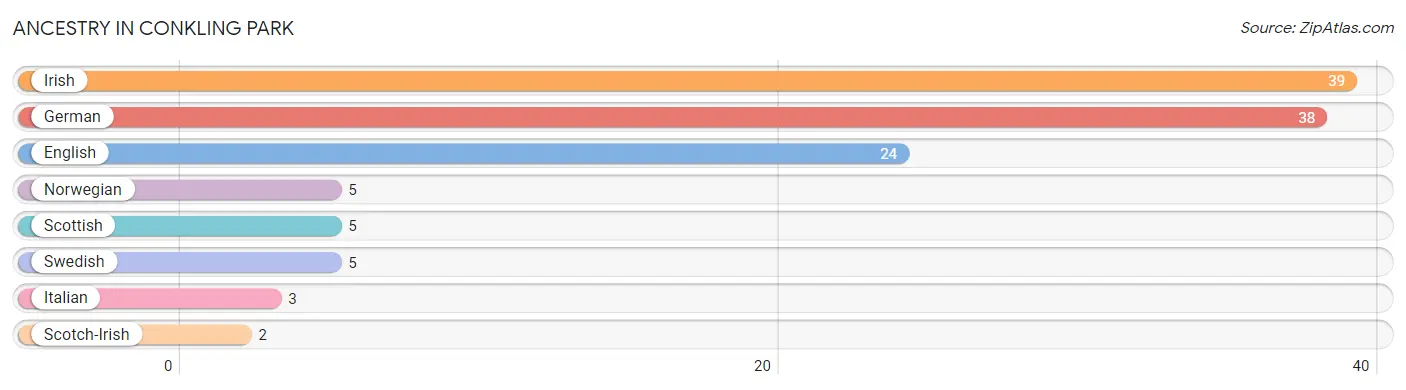
| Ancestry | # Population | % Population |
| English | 24 | 18.5% |
| German | 38 | 29.2% |
| Irish | 39 | 30.0% |
| Italian | 3 | 2.3% |
| Norwegian | 5 | 3.8% |
| Scotch-Irish | 2 | 1.5% |
| Scottish | 5 | 3.8% |
| Swedish | 5 | 3.8% | View All 8 Rows |
Immigrants in Conkling Park

| Immigration Origin | # Population | % Population | View All 0 Rows |
Sex and Age in Conkling Park
Sex and Age in Conkling Park
The most populous age groups in Conkling Park are 65 to 69 Years (33 | 50.8%) for men and 65 to 69 Years (36 | 55.4%) for women.
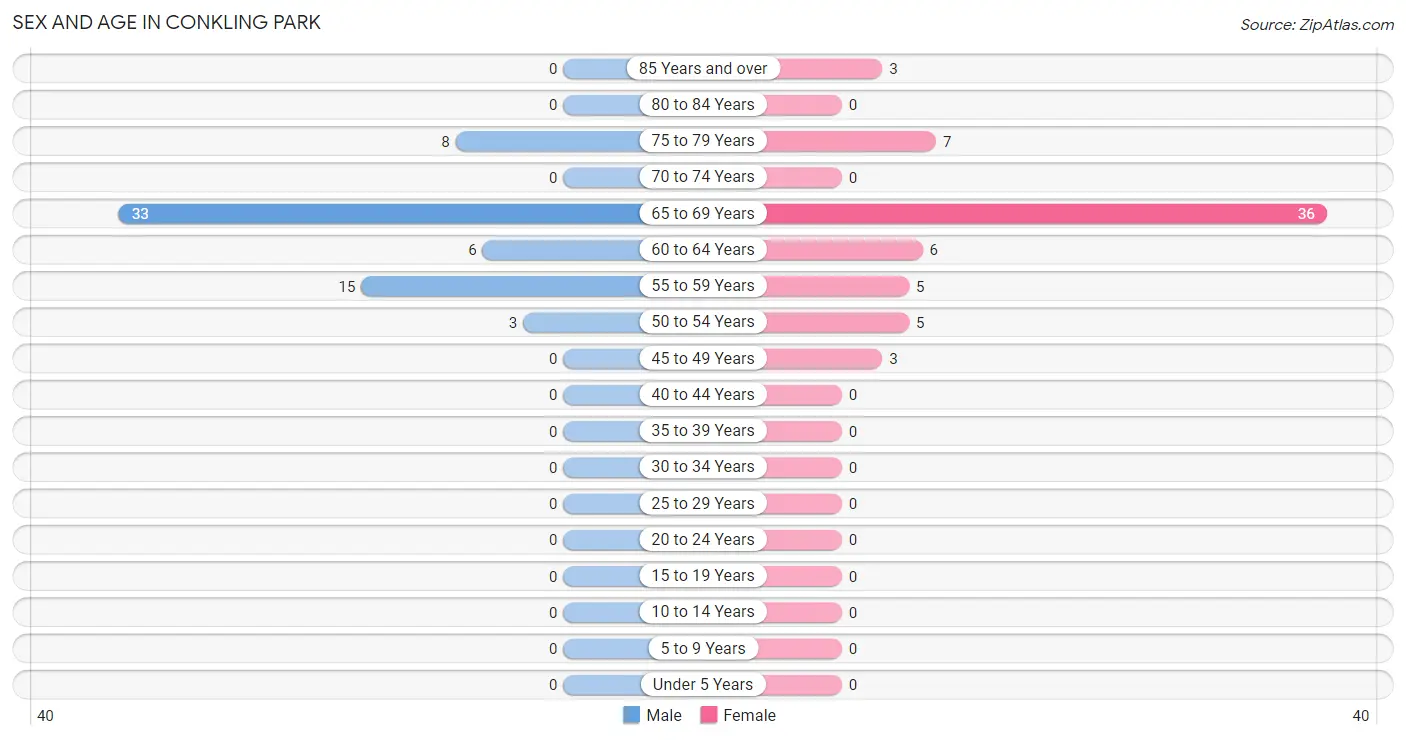
| Age Bracket | Male | Female |
| Under 5 Years | 0 (0.0%) | 0 (0.0%) |
| 5 to 9 Years | 0 (0.0%) | 0 (0.0%) |
| 10 to 14 Years | 0 (0.0%) | 0 (0.0%) |
| 15 to 19 Years | 0 (0.0%) | 0 (0.0%) |
| 20 to 24 Years | 0 (0.0%) | 0 (0.0%) |
| 25 to 29 Years | 0 (0.0%) | 0 (0.0%) |
| 30 to 34 Years | 0 (0.0%) | 0 (0.0%) |
| 35 to 39 Years | 0 (0.0%) | 0 (0.0%) |
| 40 to 44 Years | 0 (0.0%) | 0 (0.0%) |
| 45 to 49 Years | 0 (0.0%) | 3 (4.6%) |
| 50 to 54 Years | 3 (4.6%) | 5 (7.7%) |
| 55 to 59 Years | 15 (23.1%) | 5 (7.7%) |
| 60 to 64 Years | 6 (9.2%) | 6 (9.2%) |
| 65 to 69 Years | 33 (50.8%) | 36 (55.4%) |
| 70 to 74 Years | 0 (0.0%) | 0 (0.0%) |
| 75 to 79 Years | 8 (12.3%) | 7 (10.8%) |
| 80 to 84 Years | 0 (0.0%) | 0 (0.0%) |
| 85 Years and over | 0 (0.0%) | 3 (4.6%) |
| Total | 65 (100.0%) | 65 (100.0%) |
Families and Households in Conkling Park
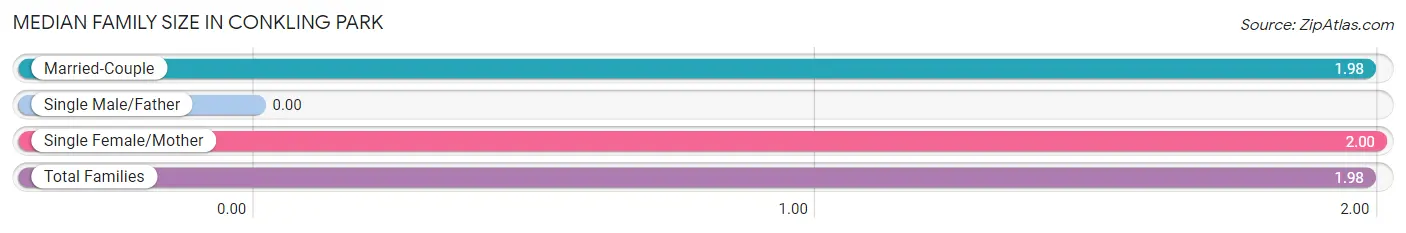
Median Family Size in Conkling Park
| Family Type | # Families | Family Size |
| Married-Couple | 61 (95.3%) | 1.98 |
| Single Male/Father | 0 (0.0%) | - |
| Single Female/Mother | 3 (4.7%) | 2.00 |
| Total Families | 64 (100.0%) | 1.98 |
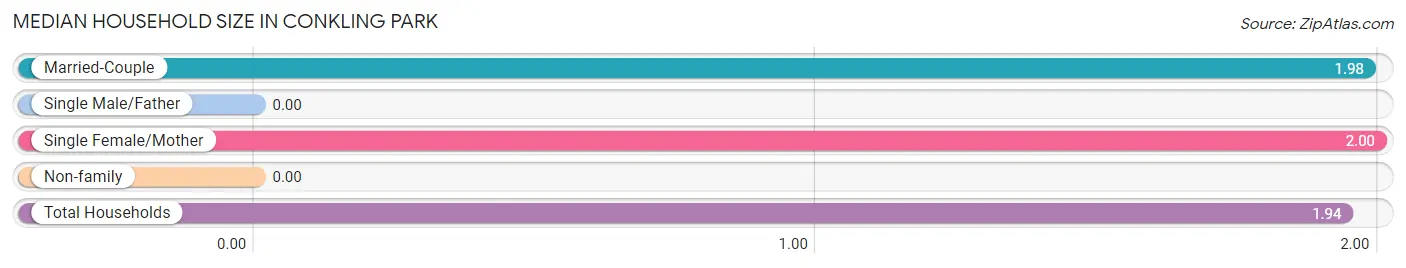
Median Household Size in Conkling Park
| Household Type | # Households | Household Size |
| Married-Couple | 61 (91.0%) | 1.98 |
| Single Male/Father | 0 (0.0%) | - |
| Single Female/Mother | 3 (4.5%) | 2.00 |
| Non-family | 3 (4.5%) | - |
| Total Households | 67 (100.0%) | 1.94 |
Household Size by Marriage Status in Conkling Park
Out of a total of 67 households in Conkling Park, 64 (95.5%) are family households, while 3 (4.5%) are nonfamily households. The most numerous type of family households are 2-person households, comprising 62, and the most common type of nonfamily households are 1-person households, comprising 3.
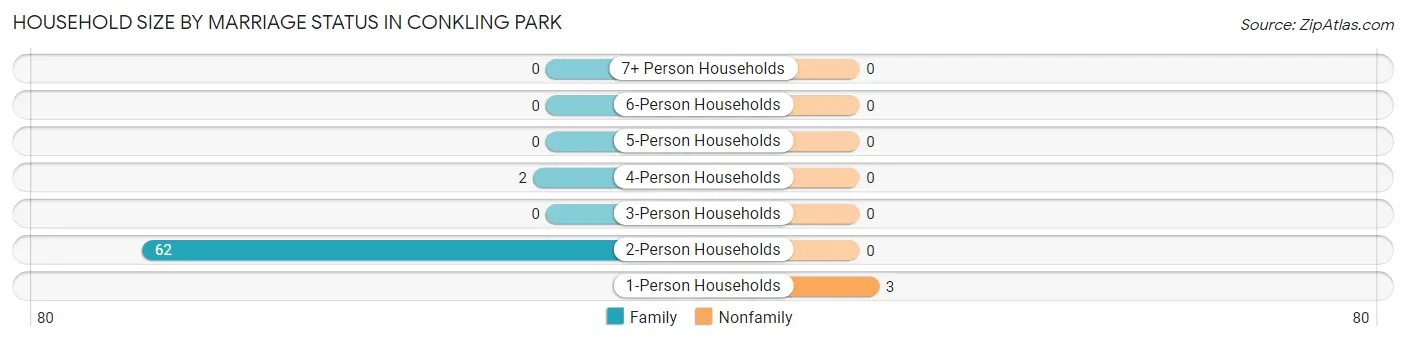
| Household Size | Family Households | Nonfamily Households |
| 1-Person Households | - | 3 (4.5%) |
| 2-Person Households | 62 (92.5%) | 0 (0.0%) |
| 3-Person Households | 0 (0.0%) | 0 (0.0%) |
| 4-Person Households | 2 (3.0%) | 0 (0.0%) |
| 5-Person Households | 0 (0.0%) | 0 (0.0%) |
| 6-Person Households | 0 (0.0%) | 0 (0.0%) |
| 7+ Person Households | 0 (0.0%) | 0 (0.0%) |
| Total | 64 (95.5%) | 3 (4.5%) |
Female Fertility in Conkling Park
Fertility by Age in Conkling Park
| Age Bracket | Women with Births | Births / 1,000 Women |
| 15 to 19 years | 0 (0.0%) | 0.0 |
| 20 to 34 years | 0 (0.0%) | 0.0 |
| 35 to 50 years | 0 (0.0%) | 0.0 |
| Total | 0 (0.0%) | 0.0 |
Fertility by Age by Marriage Status in Conkling Park
| Age Bracket | Married | Unmarried |
| 15 to 19 years | 0 (0.0%) | 0 (0.0%) |
| 20 to 34 years | 0 (0.0%) | 0 (0.0%) |
| 35 to 50 years | 0 (0.0%) | 0 (0.0%) |
| Total | 0 (0.0%) | 0 (0.0%) |
Fertility by Education in Conkling Park
| Educational Attainment | Women with Births | Births / 1,000 Women |
| Less than High School | 0 (0.0%) | 0.0 |
| High School Diploma | 0 (0.0%) | 0.0 |
| College or Associate's Degree | 0 (0.0%) | 0.0 |
| Bachelor's Degree | 0 (0.0%) | 0.0 |
| Graduate Degree | 0 (0.0%) | 0.0 |
| Total | 0 (0.0%) | 0.0 |
Fertility by Education by Marriage Status in Conkling Park
| Educational Attainment | Married | Unmarried |
| Less than High School | 0 (0.0%) | 0 (0.0%) |
| High School Diploma | 0 (0.0%) | 0 (0.0%) |
| College or Associate's Degree | 0 (0.0%) | 0 (0.0%) |
| Bachelor's Degree | 0 (0.0%) | 0 (0.0%) |
| Graduate Degree | 0 (0.0%) | 0 (0.0%) |
| Total | 0 (0.0%) | 0 (0.0%) |
Employment Characteristics in Conkling Park
Employment by Class of Employer in Conkling Park
Among the 23 employed individuals in Conkling Park, private company employees (11 | 47.8%), state government employees (6 | 26.1%), and not-for-profit organizations (3 | 13.0%) make up the most common classes of employment.
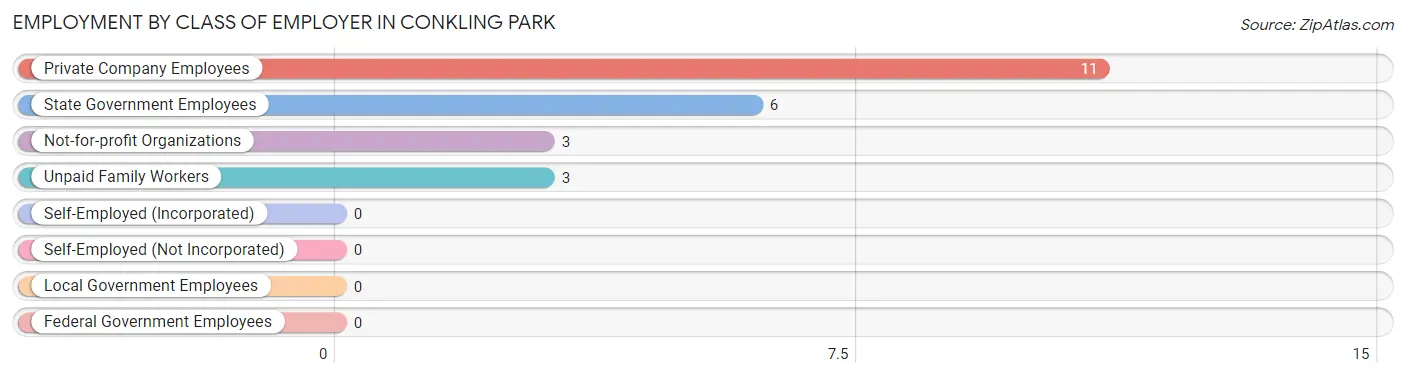
| Employer Class | # Employees | % Employees |
| Private Company Employees | 11 | 47.8% |
| Self-Employed (Incorporated) | 0 | 0.0% |
| Self-Employed (Not Incorporated) | 0 | 0.0% |
| Not-for-profit Organizations | 3 | 13.0% |
| Local Government Employees | 0 | 0.0% |
| State Government Employees | 6 | 26.1% |
| Federal Government Employees | 0 | 0.0% |
| Unpaid Family Workers | 3 | 13.0% |
| Total | 23 | 100.0% |
Employment Status by Age in Conkling Park
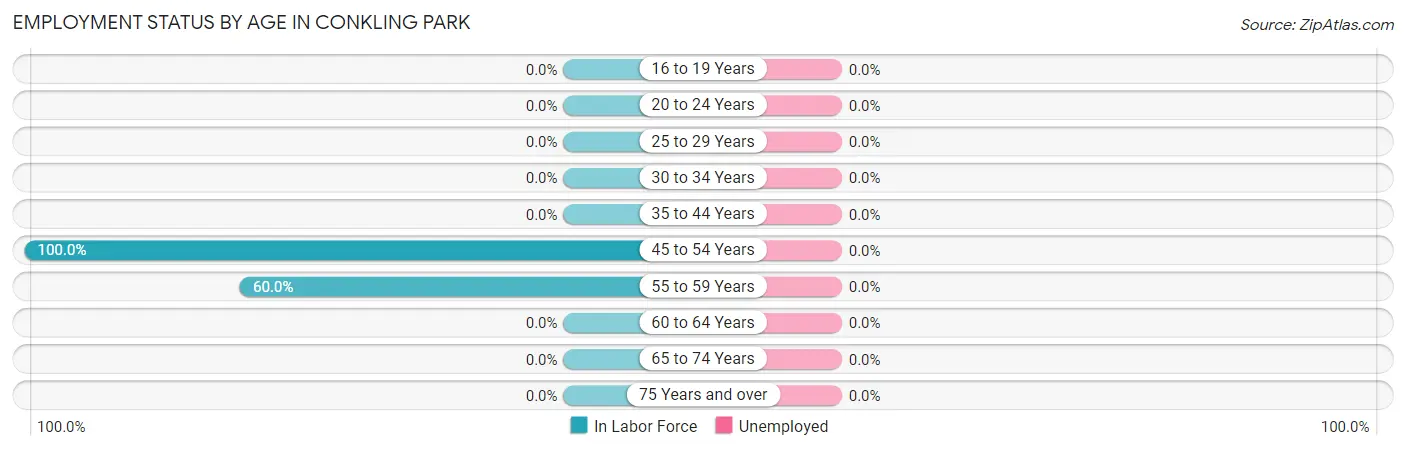
| Age Bracket | In Labor Force | Unemployed |
| 16 to 19 Years | 0 (0.0%) | 0 (0.0%) |
| 20 to 24 Years | 0 (0.0%) | 0 (0.0%) |
| 25 to 29 Years | 0 (0.0%) | 0 (0.0%) |
| 30 to 34 Years | 0 (0.0%) | 0 (0.0%) |
| 35 to 44 Years | 0 (0.0%) | 0 (0.0%) |
| 45 to 54 Years | 11 (100.0%) | 0 (0.0%) |
| 55 to 59 Years | 12 (60.0%) | 0 (0.0%) |
| 60 to 64 Years | 0 (0.0%) | 0 (0.0%) |
| 65 to 74 Years | 0 (0.0%) | 0 (0.0%) |
| 75 Years and over | 0 (0.0%) | 0 (0.0%) |
| Total | 23 (17.7%) | 0 (0.0%) |
Employment Status by Educational Attainment in Conkling Park
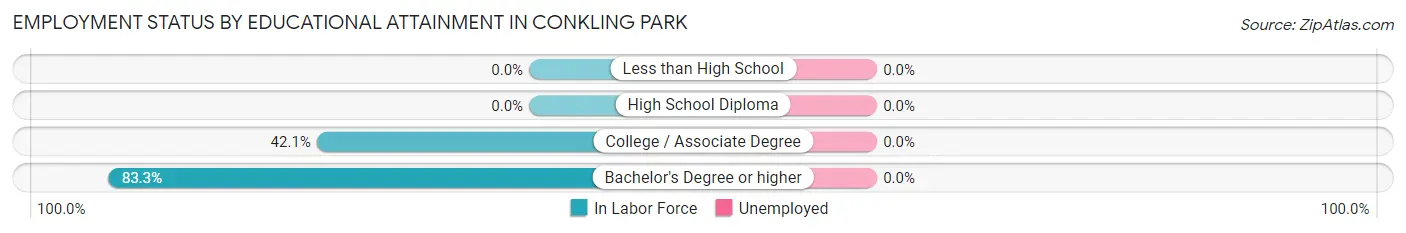
| Educational Attainment | In Labor Force | Unemployed |
| Less than High School | 0 (0.0%) | 0 (0.0%) |
| High School Diploma | 0 (0.0%) | 0 (0.0%) |
| College / Associate Degree | 8 (42.1%) | 0 (0.0%) |
| Bachelor's Degree or higher | 15 (83.3%) | 0 (0.0%) |
| Total | 23 (53.5%) | 0 (0.0%) |
Employment Occupations by Sex in Conkling Park
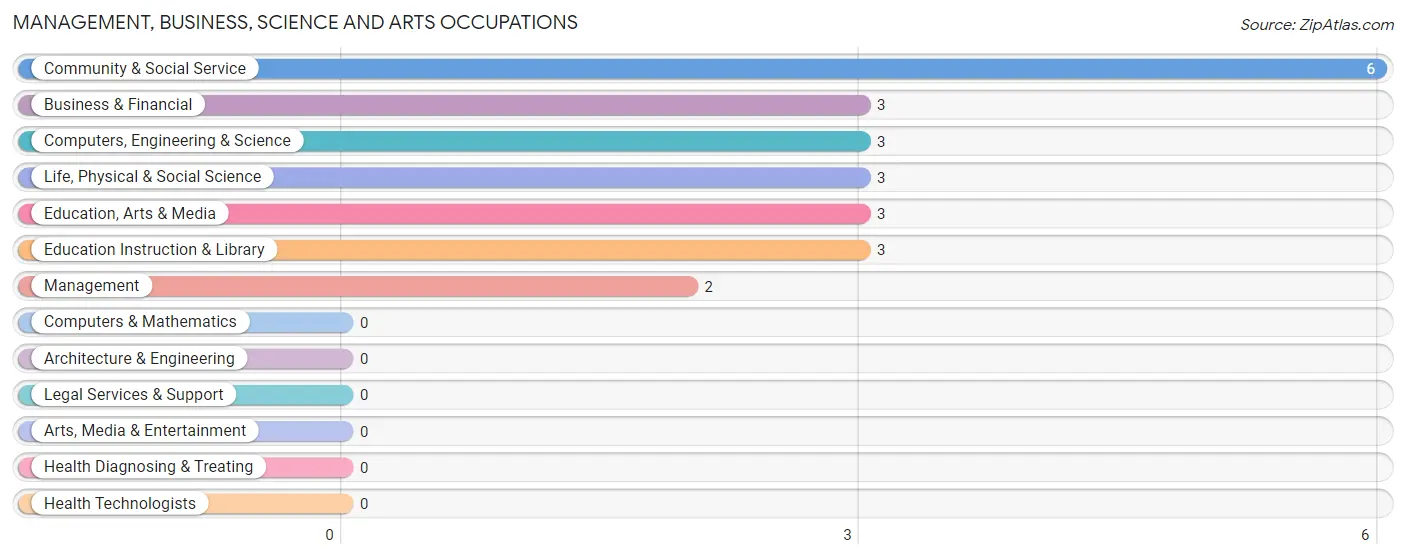
Management, Business, Science and Arts Occupations
The most common Management, Business, Science and Arts occupations in Conkling Park are Community & Social Service (6 | 26.1%), Business & Financial (3 | 13.0%), Computers, Engineering & Science (3 | 13.0%), Life, Physical & Social Science (3 | 13.0%), and Education, Arts & Media (3 | 13.0%).
Management, Business, Science and Arts Occupations by Sex
Within the Management, Business, Science and Arts occupations in Conkling Park, the most male-oriented occupations are Education Instruction & Library (100.0%), and Community & Social Service (50.0%), while the most female-oriented occupations are Management (100.0%), Business & Financial (100.0%), and Computers, Engineering & Science (100.0%).
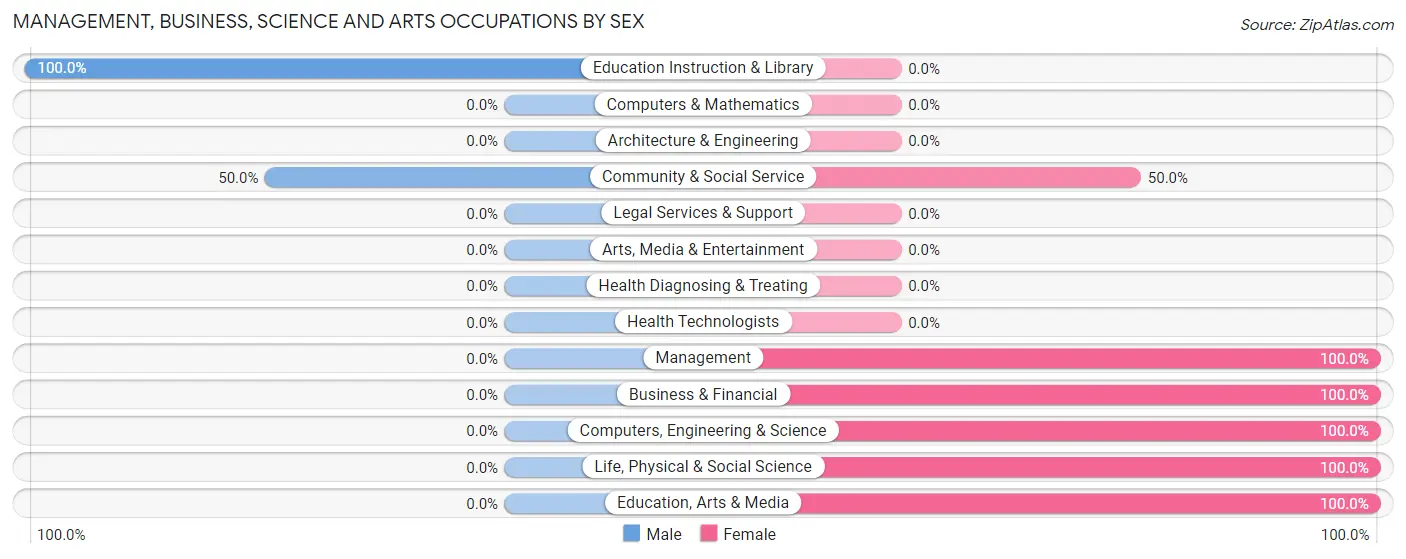
| Occupation | Male | Female |
| Management | 0 (0.0%) | 2 (100.0%) |
| Business & Financial | 0 (0.0%) | 3 (100.0%) |
| Computers, Engineering & Science | 0 (0.0%) | 3 (100.0%) |
| Computers & Mathematics | 0 (0.0%) | 0 (0.0%) |
| Architecture & Engineering | 0 (0.0%) | 0 (0.0%) |
| Life, Physical & Social Science | 0 (0.0%) | 3 (100.0%) |
| Community & Social Service | 3 (50.0%) | 3 (50.0%) |
| Education, Arts & Media | 0 (0.0%) | 3 (100.0%) |
| Legal Services & Support | 0 (0.0%) | 0 (0.0%) |
| Education Instruction & Library | 3 (100.0%) | 0 (0.0%) |
| Arts, Media & Entertainment | 0 (0.0%) | 0 (0.0%) |
| Health Diagnosing & Treating | 0 (0.0%) | 0 (0.0%) |
| Health Technologists | 0 (0.0%) | 0 (0.0%) |
| Total (Category) | 3 (21.4%) | 11 (78.6%) |
| Total (Overall) | 12 (52.2%) | 11 (47.8%) |
Services Occupations
The most common Services occupations in Conkling Park are , and Cleaning & Maintenance (3 | 13.0%).
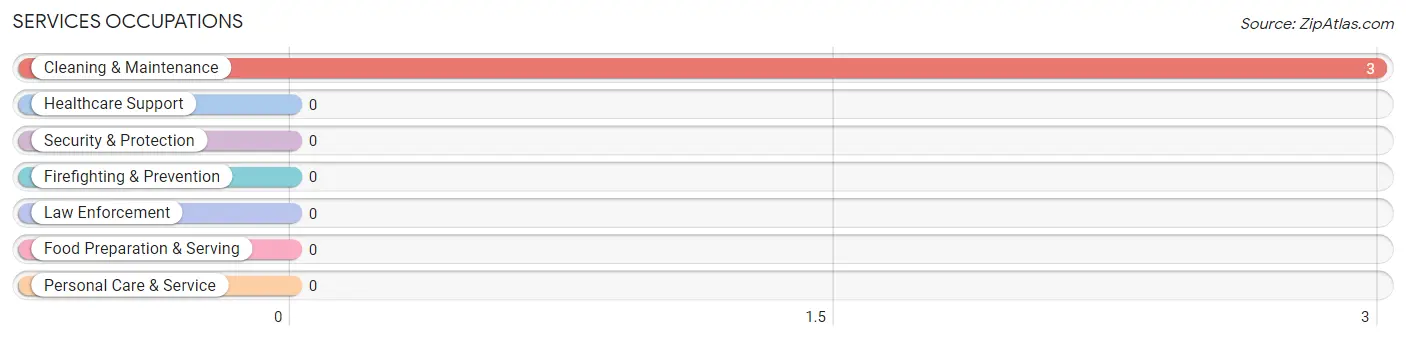
Services Occupations by Sex
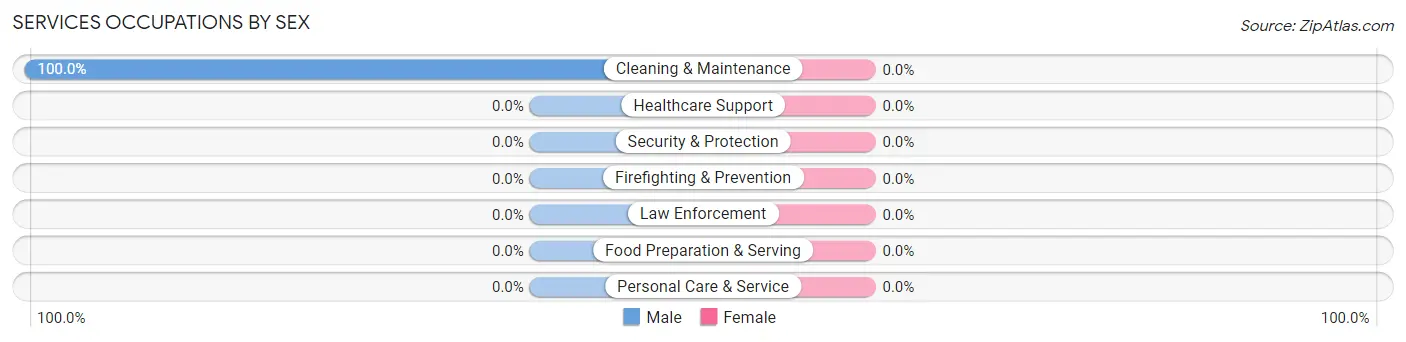
| Occupation | Male | Female |
| Healthcare Support | 0 (0.0%) | 0 (0.0%) |
| Security & Protection | 0 (0.0%) | 0 (0.0%) |
| Firefighting & Prevention | 0 (0.0%) | 0 (0.0%) |
| Law Enforcement | 0 (0.0%) | 0 (0.0%) |
| Food Preparation & Serving | 0 (0.0%) | 0 (0.0%) |
| Cleaning & Maintenance | 3 (100.0%) | 0 (0.0%) |
| Personal Care & Service | 0 (0.0%) | 0 (0.0%) |
| Total (Category) | 3 (100.0%) | 0 (0.0%) |
| Total (Overall) | 12 (52.2%) | 11 (47.8%) |
Sales and Office Occupations
Sales and Office Occupations by Sex
| Occupation | Male | Female |
| Sales & Related | 0 (0.0%) | 0 (0.0%) |
| Office & Administration | 0 (0.0%) | 0 (0.0%) |
| Total (Category) | 0 (0.0%) | 0 (0.0%) |
| Total (Overall) | 12 (52.2%) | 11 (47.8%) |
Natural Resources, Construction and Maintenance Occupations
The most common Natural Resources, Construction and Maintenance occupations in Conkling Park are , and Construction & Extraction (6 | 26.1%).
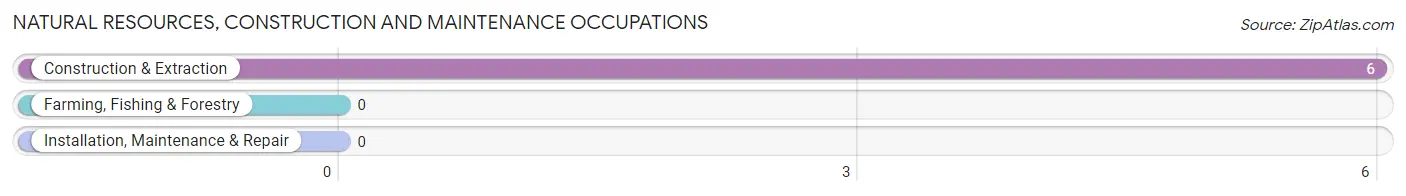
Natural Resources, Construction and Maintenance Occupations by Sex
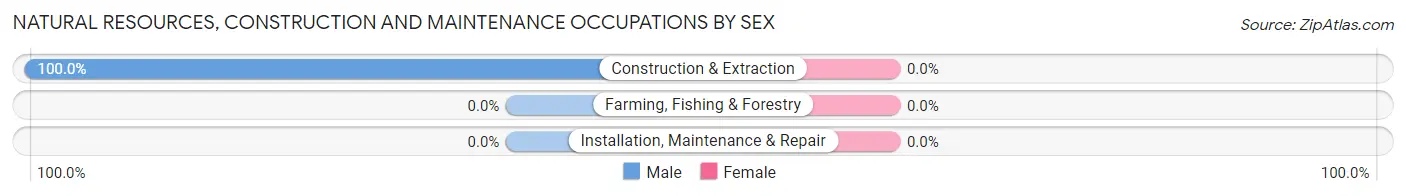
| Occupation | Male | Female |
| Farming, Fishing & Forestry | 0 (0.0%) | 0 (0.0%) |
| Construction & Extraction | 6 (100.0%) | 0 (0.0%) |
| Installation, Maintenance & Repair | 0 (0.0%) | 0 (0.0%) |
| Total (Category) | 6 (100.0%) | 0 (0.0%) |
| Total (Overall) | 12 (52.2%) | 11 (47.8%) |
Production, Transportation and Moving Occupations
Production, Transportation and Moving Occupations by Sex
| Occupation | Male | Female |
| Production | 0 (0.0%) | 0 (0.0%) |
| Transportation | 0 (0.0%) | 0 (0.0%) |
| Material Moving | 0 (0.0%) | 0 (0.0%) |
| Total (Category) | 0 (0.0%) | 0 (0.0%) |
| Total (Overall) | 12 (52.2%) | 11 (47.8%) |
Employment Industries by Sex in Conkling Park
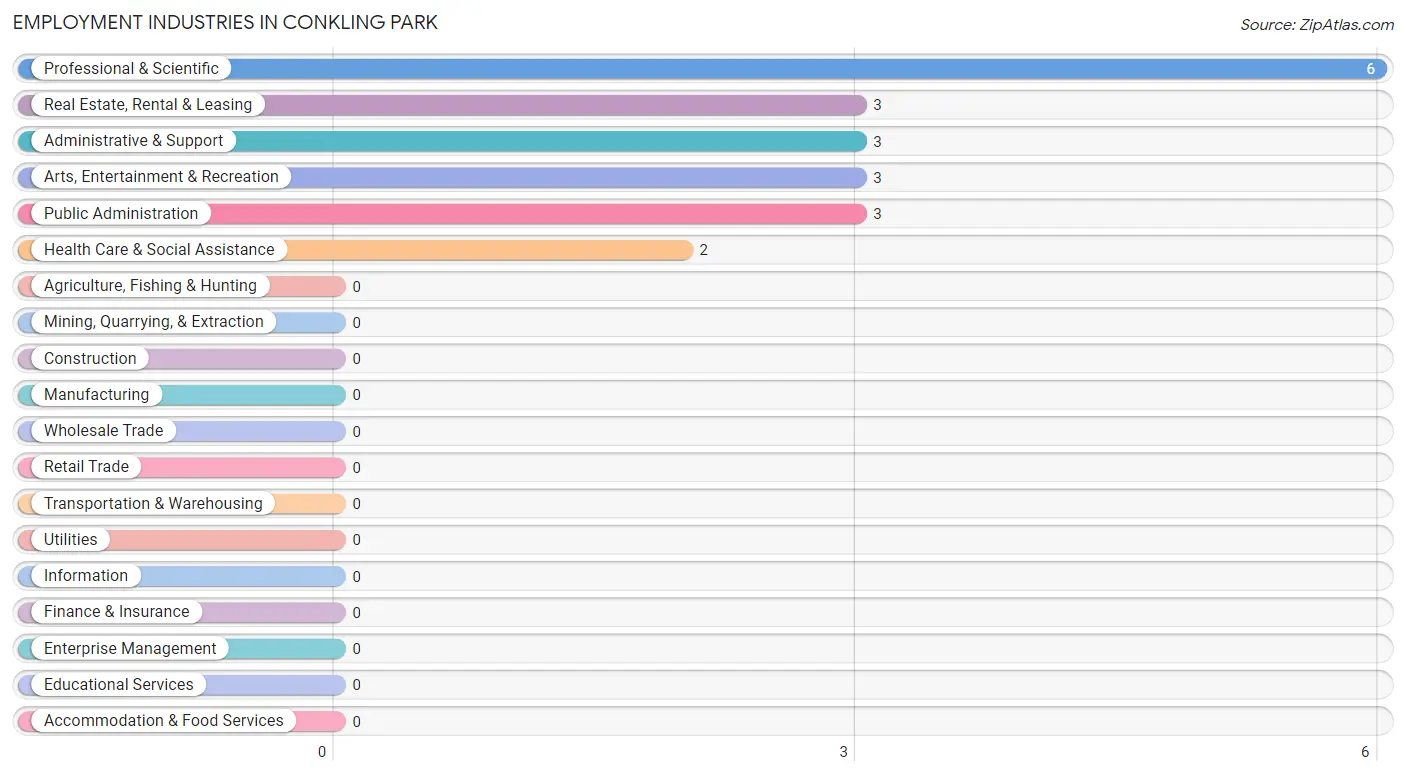
Employment Industries in Conkling Park
The major employment industries in Conkling Park include Professional & Scientific (6 | 26.1%), Real Estate, Rental & Leasing (3 | 13.0%), Administrative & Support (3 | 13.0%), Arts, Entertainment & Recreation (3 | 13.0%), and Public Administration (3 | 13.0%).
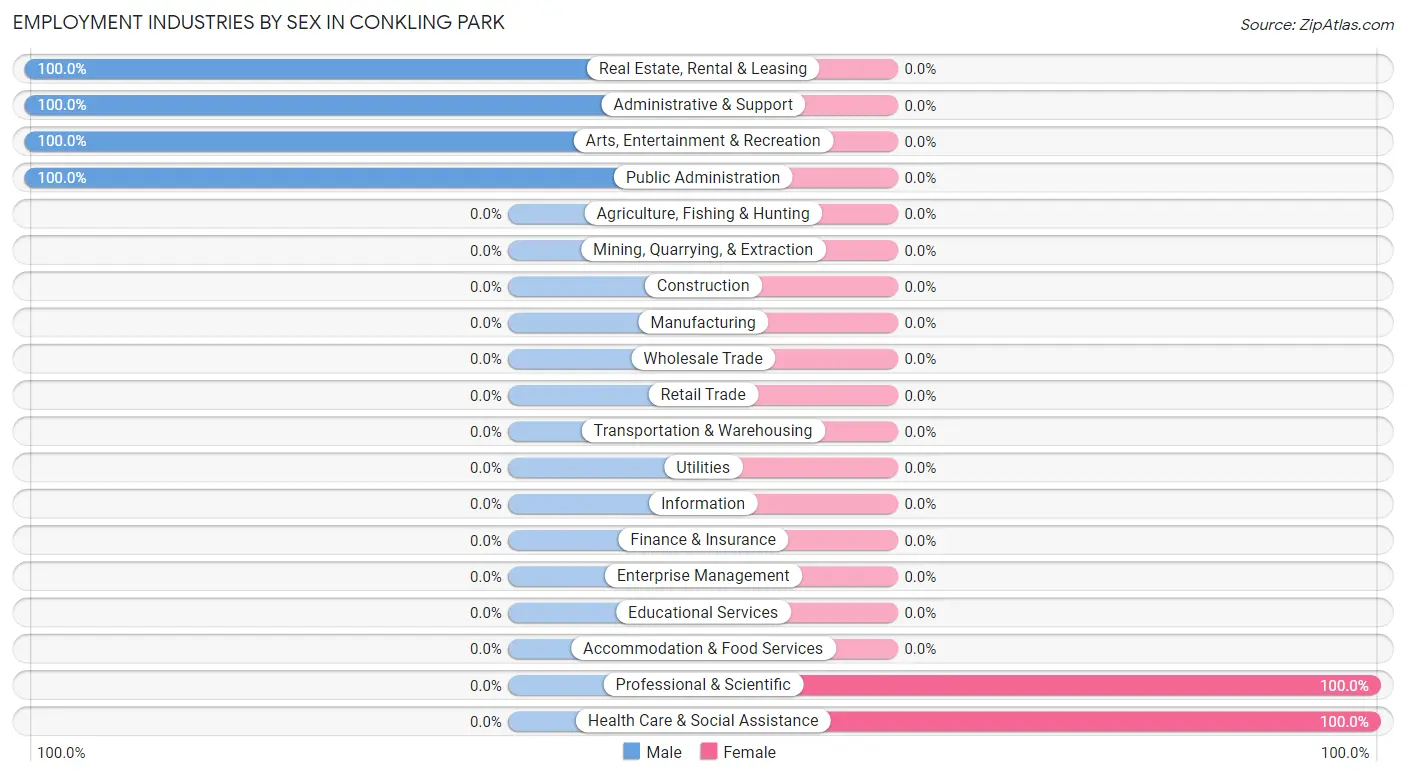
Employment Industries by Sex in Conkling Park
The Conkling Park industries that see more men than women are Real Estate, Rental & Leasing (100.0%), Administrative & Support (100.0%), and Arts, Entertainment & Recreation (100.0%), whereas the industries that tend to have a higher number of women are Professional & Scientific (100.0%), and Health Care & Social Assistance (100.0%).
| Industry | Male | Female |
| Agriculture, Fishing & Hunting | 0 (0.0%) | 0 (0.0%) |
| Mining, Quarrying, & Extraction | 0 (0.0%) | 0 (0.0%) |
| Construction | 0 (0.0%) | 0 (0.0%) |
| Manufacturing | 0 (0.0%) | 0 (0.0%) |
| Wholesale Trade | 0 (0.0%) | 0 (0.0%) |
| Retail Trade | 0 (0.0%) | 0 (0.0%) |
| Transportation & Warehousing | 0 (0.0%) | 0 (0.0%) |
| Utilities | 0 (0.0%) | 0 (0.0%) |
| Information | 0 (0.0%) | 0 (0.0%) |
| Finance & Insurance | 0 (0.0%) | 0 (0.0%) |
| Real Estate, Rental & Leasing | 3 (100.0%) | 0 (0.0%) |
| Professional & Scientific | 0 (0.0%) | 6 (100.0%) |
| Enterprise Management | 0 (0.0%) | 0 (0.0%) |
| Administrative & Support | 3 (100.0%) | 0 (0.0%) |
| Educational Services | 0 (0.0%) | 0 (0.0%) |
| Health Care & Social Assistance | 0 (0.0%) | 2 (100.0%) |
| Arts, Entertainment & Recreation | 3 (100.0%) | 0 (0.0%) |
| Accommodation & Food Services | 0 (0.0%) | 0 (0.0%) |
| Public Administration | 3 (100.0%) | 0 (0.0%) |
| Total | 12 (52.2%) | 11 (47.8%) |
Education in Conkling Park
School Enrollment in Conkling Park
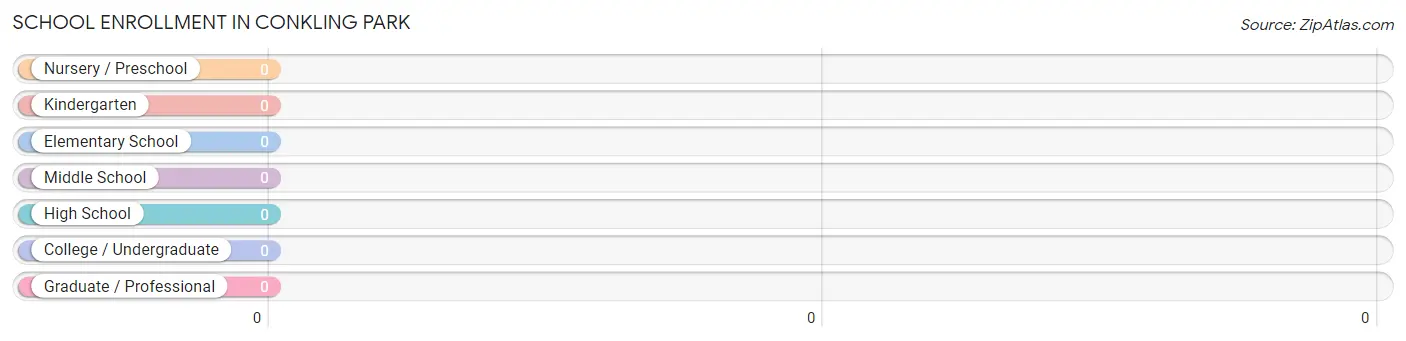
| School Level | # Students | % Students |
| Nursery / Preschool | 0 | 0.0% |
| Kindergarten | 0 | 0.0% |
| Elementary School | 0 | 0.0% |
| Middle School | 0 | 0.0% |
| High School | 0 | 0.0% |
| College / Undergraduate | 0 | 0.0% |
| Graduate / Professional | 0 | 0.0% |
| Total | 0 | 0.0% |
School Enrollment by Age by Funding Source in Conkling Park
| Age Bracket | Public School | Private School |
| 3 to 4 Year Olds | 0 (0.0%) | 0 (0.0%) |
| 5 to 9 Year Old | 0 (0.0%) | 0 (0.0%) |
| 10 to 14 Year Olds | 0 (0.0%) | 0 (0.0%) |
| 15 to 17 Year Olds | 0 (0.0%) | 0 (0.0%) |
| 18 to 19 Year Olds | 0 (0.0%) | 0 (0.0%) |
| 20 to 24 Year Olds | 0 (0.0%) | 0 (0.0%) |
| 25 to 34 Year Olds | 0 (0.0%) | 0 (0.0%) |
| 35 Years and over | 0 (0.0%) | 0 (0.0%) |
| Total | 0 (0.0%) | 0 (0.0%) |
Educational Attainment by Field of Study in Conkling Park
Business (39 | 41.0%), visual & performing arts (30 | 31.6%), education (6 | 6.3%), bio, nature & agricultural (5 | 5.3%), and multidisciplinary studies (3 | 3.2%) are the most common fields of study among 95 individuals in Conkling Park who have obtained a bachelor's degree or higher.
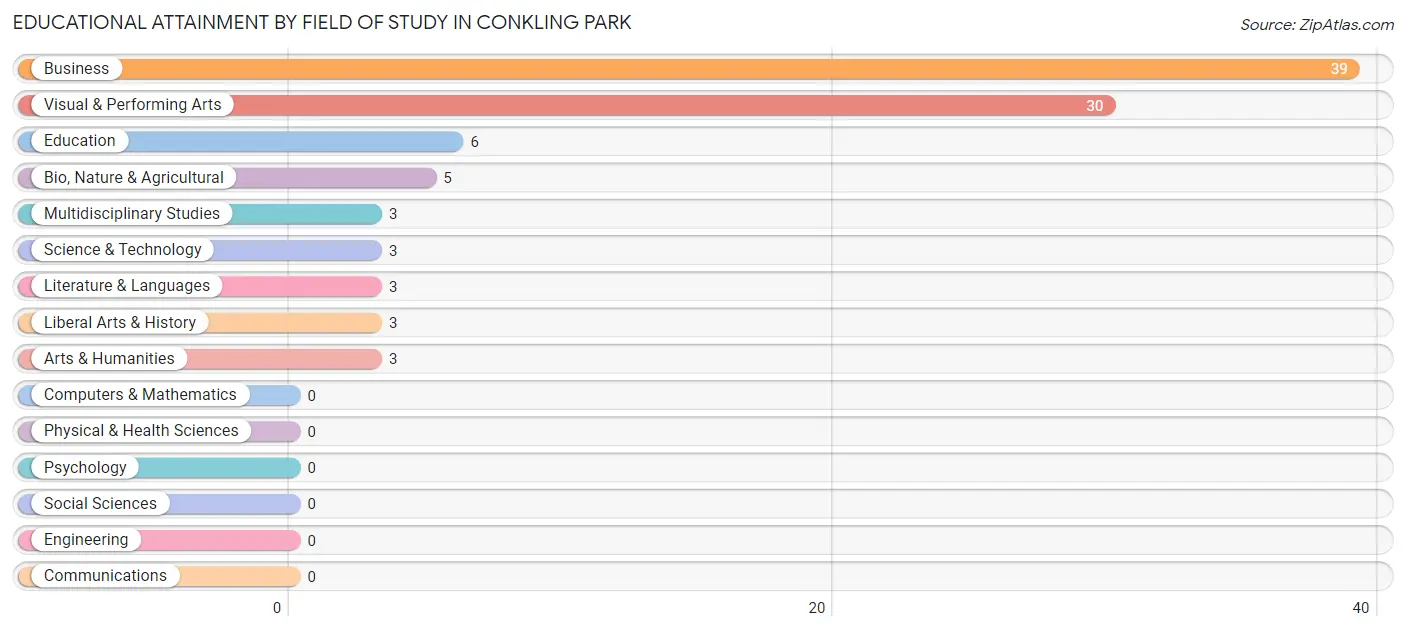
| Field of Study | # Graduates | % Graduates |
| Computers & Mathematics | 0 | 0.0% |
| Bio, Nature & Agricultural | 5 | 5.3% |
| Physical & Health Sciences | 0 | 0.0% |
| Psychology | 0 | 0.0% |
| Social Sciences | 0 | 0.0% |
| Engineering | 0 | 0.0% |
| Multidisciplinary Studies | 3 | 3.2% |
| Science & Technology | 3 | 3.2% |
| Business | 39 | 41.0% |
| Education | 6 | 6.3% |
| Literature & Languages | 3 | 3.2% |
| Liberal Arts & History | 3 | 3.2% |
| Visual & Performing Arts | 30 | 31.6% |
| Communications | 0 | 0.0% |
| Arts & Humanities | 3 | 3.2% |
| Total | 95 | 100.0% |
Transportation & Commute in Conkling Park
Vehicle Availability by Sex in Conkling Park
The most prevalent vehicle ownership categories in Conkling Park are males with 2 vehicles (9, accounting for 75.0%) and females with 2 vehicles (6, making up 81.8%).
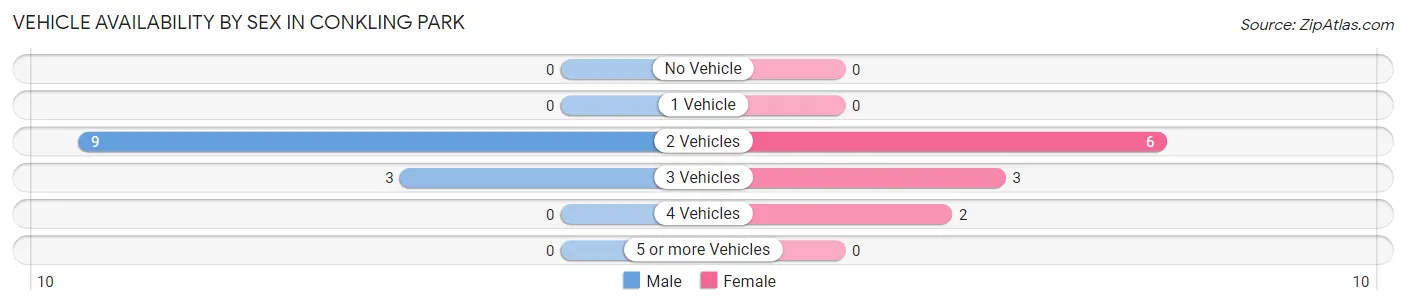
| Vehicles Available | Male | Female |
| No Vehicle | 0 (0.0%) | 0 (0.0%) |
| 1 Vehicle | 0 (0.0%) | 0 (0.0%) |
| 2 Vehicles | 9 (75.0%) | 6 (54.5%) |
| 3 Vehicles | 3 (25.0%) | 3 (27.3%) |
| 4 Vehicles | 0 (0.0%) | 2 (18.2%) |
| 5 or more Vehicles | 0 (0.0%) | 0 (0.0%) |
| Total | 12 (100.0%) | 11 (100.0%) |
Commute Time in Conkling Park
The most frequently occuring commute durations in Conkling Park are 10 to 14 minutes (6 commuters, 42.9%), less than 5 minutes (3 commuters, 21.4%), and 60 to 89 minutes (3 commuters, 21.4%).
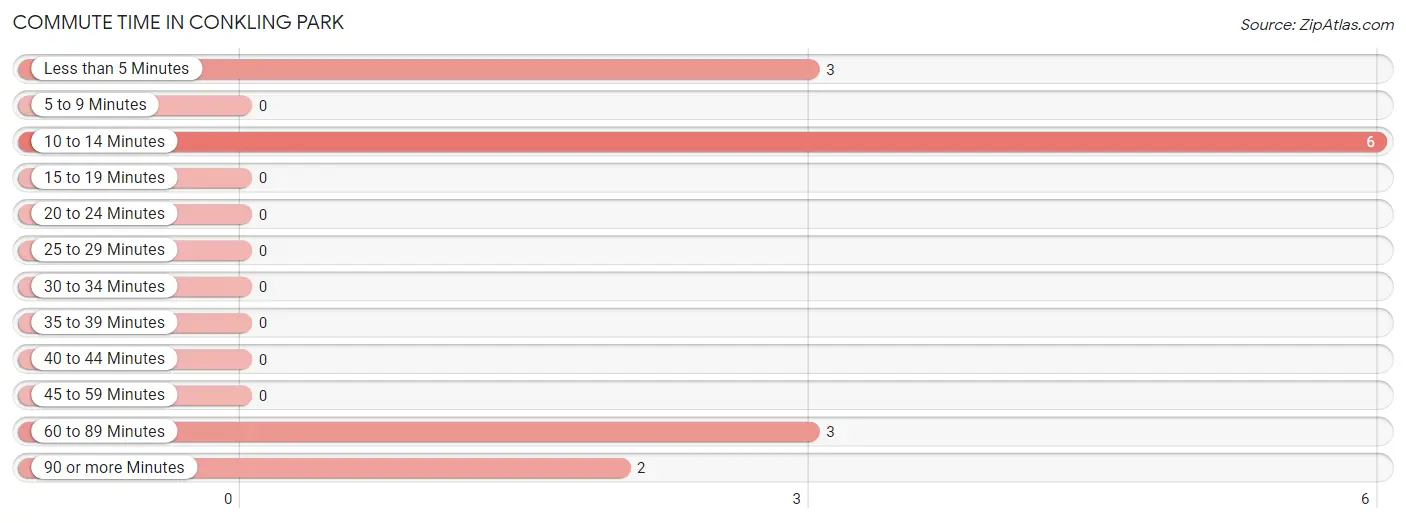
| Commute Time | # Commuters | % Commuters |
| Less than 5 Minutes | 3 | 21.4% |
| 5 to 9 Minutes | 0 | 0.0% |
| 10 to 14 Minutes | 6 | 42.9% |
| 15 to 19 Minutes | 0 | 0.0% |
| 20 to 24 Minutes | 0 | 0.0% |
| 25 to 29 Minutes | 0 | 0.0% |
| 30 to 34 Minutes | 0 | 0.0% |
| 35 to 39 Minutes | 0 | 0.0% |
| 40 to 44 Minutes | 0 | 0.0% |
| 45 to 59 Minutes | 0 | 0.0% |
| 60 to 89 Minutes | 3 | 21.4% |
| 90 or more Minutes | 2 | 14.3% |
Commute Time by Sex in Conkling Park
The most common commute times in Conkling Park are 10 to 14 minutes (6 commuters, 66.7%) for males and 60 to 89 minutes (3 commuters, 60.0%) for females.
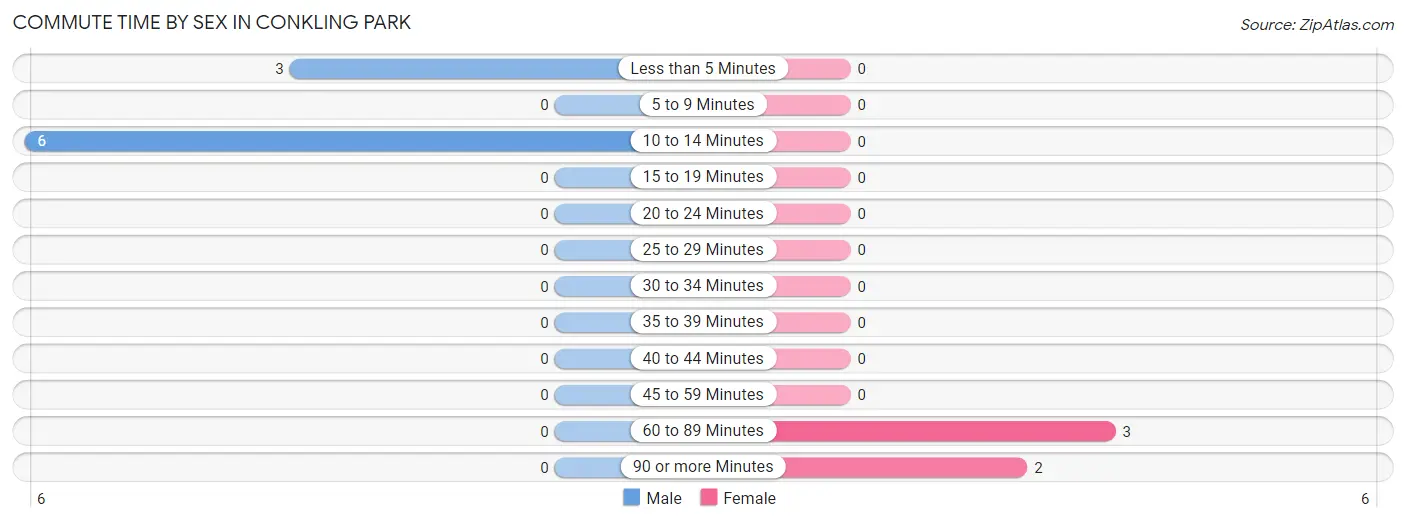
| Commute Time | Male | Female |
| Less than 5 Minutes | 3 (33.3%) | 0 (0.0%) |
| 5 to 9 Minutes | 0 (0.0%) | 0 (0.0%) |
| 10 to 14 Minutes | 6 (66.7%) | 0 (0.0%) |
| 15 to 19 Minutes | 0 (0.0%) | 0 (0.0%) |
| 20 to 24 Minutes | 0 (0.0%) | 0 (0.0%) |
| 25 to 29 Minutes | 0 (0.0%) | 0 (0.0%) |
| 30 to 34 Minutes | 0 (0.0%) | 0 (0.0%) |
| 35 to 39 Minutes | 0 (0.0%) | 0 (0.0%) |
| 40 to 44 Minutes | 0 (0.0%) | 0 (0.0%) |
| 45 to 59 Minutes | 0 (0.0%) | 0 (0.0%) |
| 60 to 89 Minutes | 0 (0.0%) | 3 (60.0%) |
| 90 or more Minutes | 0 (0.0%) | 2 (40.0%) |
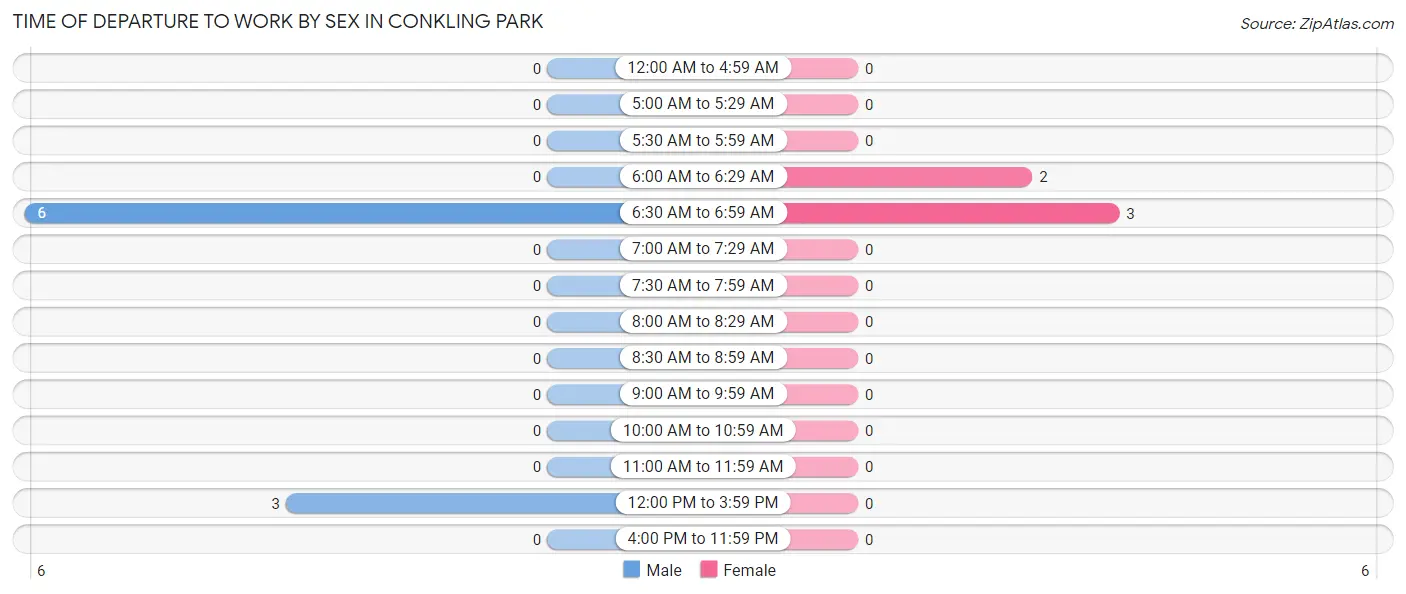
Time of Departure to Work by Sex in Conkling Park
The most frequent times of departure to work in Conkling Park are 6:30 AM to 6:59 AM (6, 66.7%) for males and 6:30 AM to 6:59 AM (3, 60.0%) for females.
| Time of Departure | Male | Female |
| 12:00 AM to 4:59 AM | 0 (0.0%) | 0 (0.0%) |
| 5:00 AM to 5:29 AM | 0 (0.0%) | 0 (0.0%) |
| 5:30 AM to 5:59 AM | 0 (0.0%) | 0 (0.0%) |
| 6:00 AM to 6:29 AM | 0 (0.0%) | 2 (40.0%) |
| 6:30 AM to 6:59 AM | 6 (66.7%) | 3 (60.0%) |
| 7:00 AM to 7:29 AM | 0 (0.0%) | 0 (0.0%) |
| 7:30 AM to 7:59 AM | 0 (0.0%) | 0 (0.0%) |
| 8:00 AM to 8:29 AM | 0 (0.0%) | 0 (0.0%) |
| 8:30 AM to 8:59 AM | 0 (0.0%) | 0 (0.0%) |
| 9:00 AM to 9:59 AM | 0 (0.0%) | 0 (0.0%) |
| 10:00 AM to 10:59 AM | 0 (0.0%) | 0 (0.0%) |
| 11:00 AM to 11:59 AM | 0 (0.0%) | 0 (0.0%) |
| 12:00 PM to 3:59 PM | 3 (33.3%) | 0 (0.0%) |
| 4:00 PM to 11:59 PM | 0 (0.0%) | 0 (0.0%) |
| Total | 9 (100.0%) | 5 (100.0%) |
Housing Occupancy in Conkling Park
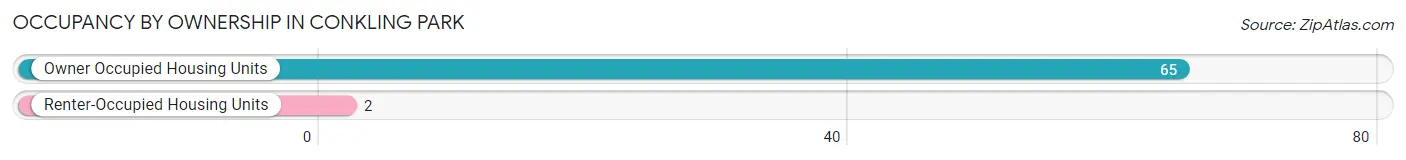
Occupancy by Ownership in Conkling Park
Of the total 67 dwellings in Conkling Park, owner-occupied units account for 65 (97.0%), while renter-occupied units make up 2 (3.0%).
| Occupancy | # Housing Units | % Housing Units |
| Owner Occupied Housing Units | 65 | 97.0% |
| Renter-Occupied Housing Units | 2 | 3.0% |
| Total Occupied Housing Units | 67 | 100.0% |
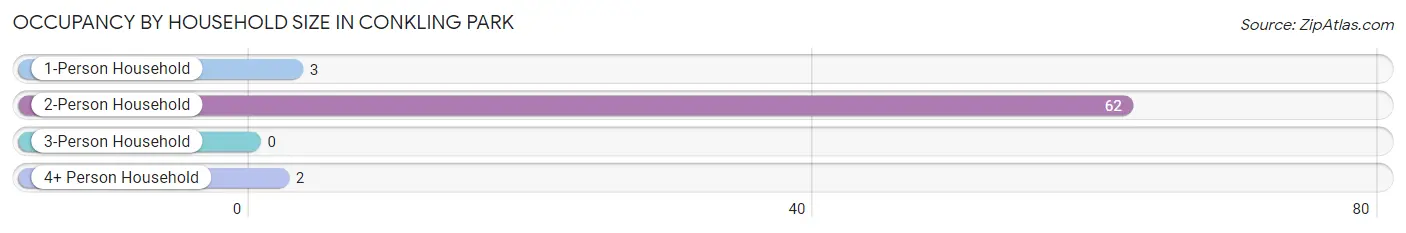
Occupancy by Household Size in Conkling Park
| Household Size | # Housing Units | % Housing Units |
| 1-Person Household | 3 | 4.5% |
| 2-Person Household | 62 | 92.5% |
| 3-Person Household | 0 | 0.0% |
| 4+ Person Household | 2 | 3.0% |
| Total Housing Units | 67 | 100.0% |
Occupancy by Ownership by Household Size in Conkling Park
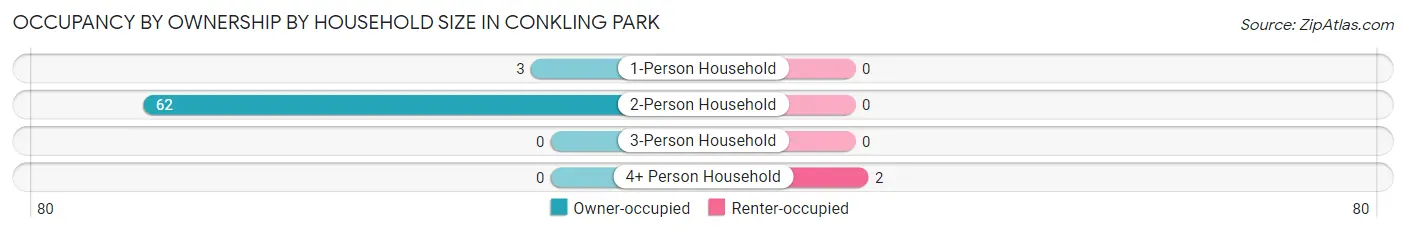
| Household Size | Owner-occupied | Renter-occupied |
| 1-Person Household | 3 (100.0%) | 0 (0.0%) |
| 2-Person Household | 62 (100.0%) | 0 (0.0%) |
| 3-Person Household | 0 (0.0%) | 0 (0.0%) |
| 4+ Person Household | 0 (0.0%) | 2 (100.0%) |
| Total Housing Units | 65 (97.0%) | 2 (3.0%) |
Occupancy by Educational Attainment in Conkling Park
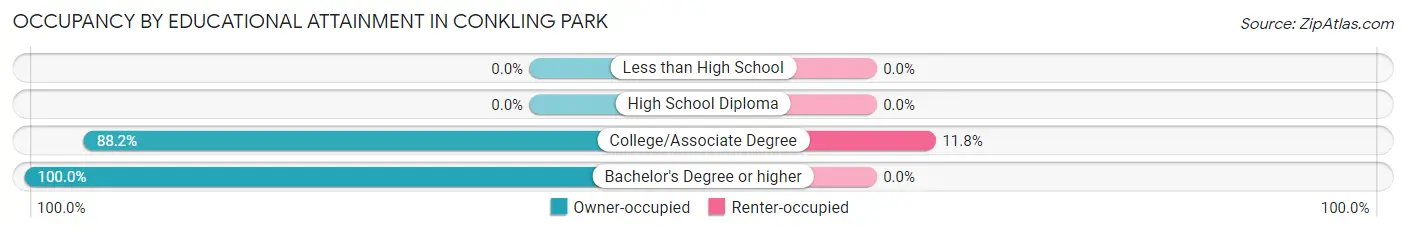
| Household Size | Owner-occupied | Renter-occupied |
| Less than High School | 0 (0.0%) | 0 (0.0%) |
| High School Diploma | 0 (0.0%) | 0 (0.0%) |
| College/Associate Degree | 15 (88.2%) | 2 (11.8%) |
| Bachelor's Degree or higher | 50 (100.0%) | 0 (0.0%) |
Occupancy by Age of Householder in Conkling Park
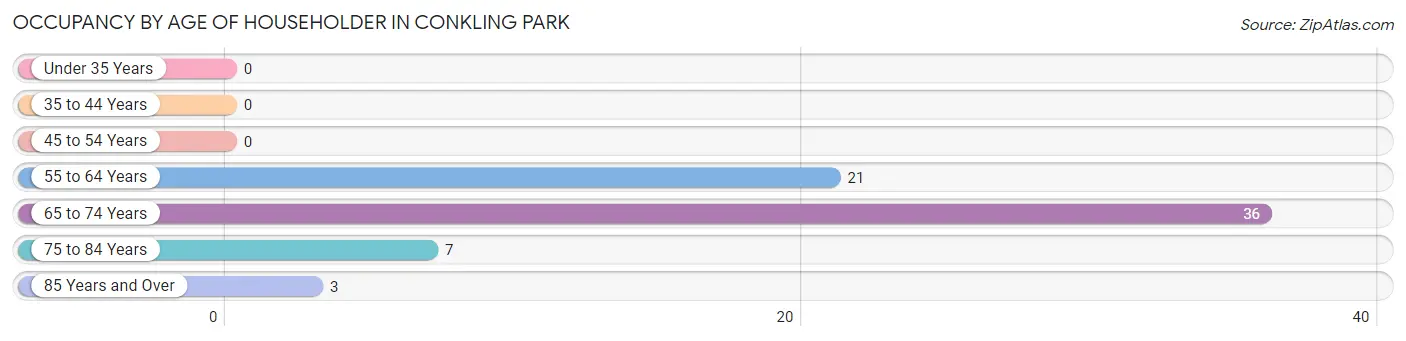
| Age Bracket | # Households | % Households |
| Under 35 Years | 0 | 0.0% |
| 35 to 44 Years | 0 | 0.0% |
| 45 to 54 Years | 0 | 0.0% |
| 55 to 64 Years | 21 | 31.3% |
| 65 to 74 Years | 36 | 53.7% |
| 75 to 84 Years | 7 | 10.4% |
| 85 Years and Over | 3 | 4.5% |
| Total | 67 | 100.0% |
Housing Finances in Conkling Park
Median Income by Occupancy in Conkling Park
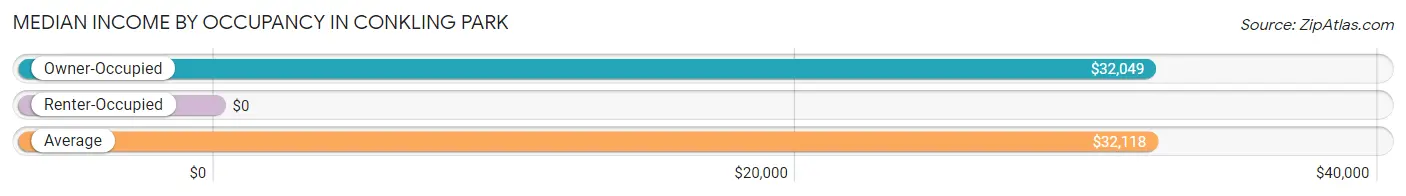
| Occupancy Type | # Households | Median Income |
| Owner-Occupied | 65 (97.0%) | $32,049 |
| Renter-Occupied | 2 (3.0%) | $0 |
| Average | 67 (100.0%) | $32,118 |
Occupancy by Householder Income Bracket in Conkling Park
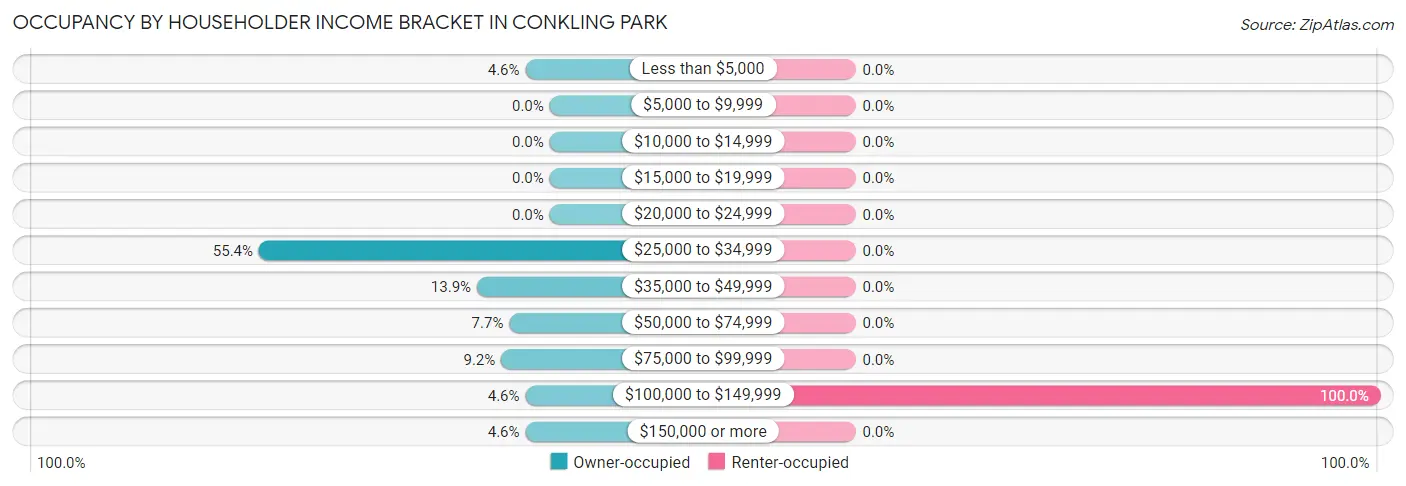
| Income Bracket | Owner-occupied | Renter-occupied |
| Less than $5,000 | 3 (4.6%) | 0 (0.0%) |
| $5,000 to $9,999 | 0 (0.0%) | 0 (0.0%) |
| $10,000 to $14,999 | 0 (0.0%) | 0 (0.0%) |
| $15,000 to $19,999 | 0 (0.0%) | 0 (0.0%) |
| $20,000 to $24,999 | 0 (0.0%) | 0 (0.0%) |
| $25,000 to $34,999 | 36 (55.4%) | 0 (0.0%) |
| $35,000 to $49,999 | 9 (13.9%) | 0 (0.0%) |
| $50,000 to $74,999 | 5 (7.7%) | 0 (0.0%) |
| $75,000 to $99,999 | 6 (9.2%) | 0 (0.0%) |
| $100,000 to $149,999 | 3 (4.6%) | 2 (100.0%) |
| $150,000 or more | 3 (4.6%) | 0 (0.0%) |
| Total | 65 (100.0%) | 2 (100.0%) |
Monthly Housing Cost Tiers in Conkling Park
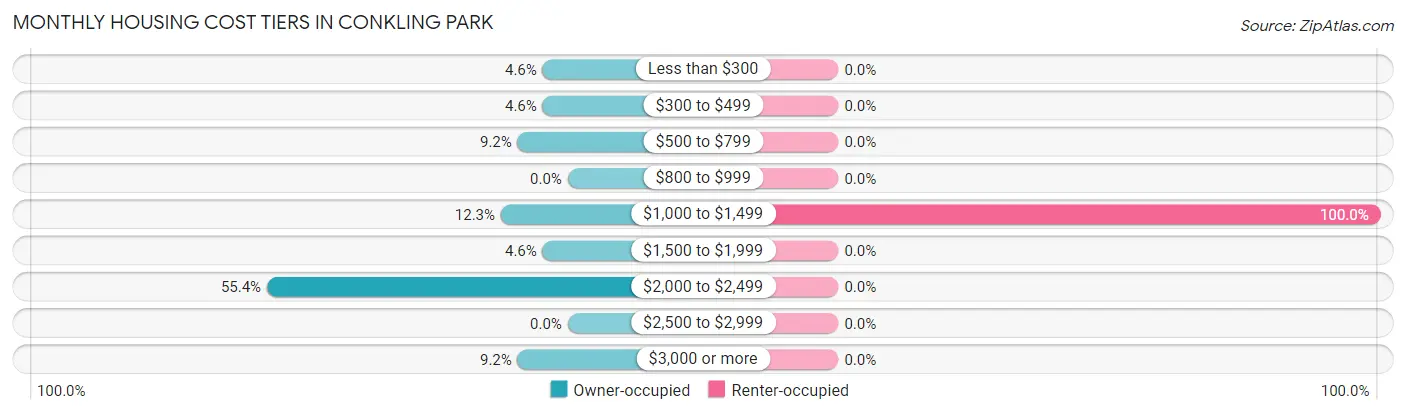
| Monthly Cost | Owner-occupied | Renter-occupied |
| Less than $300 | 3 (4.6%) | 0 (0.0%) |
| $300 to $499 | 3 (4.6%) | 0 (0.0%) |
| $500 to $799 | 6 (9.2%) | 0 (0.0%) |
| $800 to $999 | 0 (0.0%) | 0 (0.0%) |
| $1,000 to $1,499 | 8 (12.3%) | 2 (100.0%) |
| $1,500 to $1,999 | 3 (4.6%) | 0 (0.0%) |
| $2,000 to $2,499 | 36 (55.4%) | 0 (0.0%) |
| $2,500 to $2,999 | 0 (0.0%) | 0 (0.0%) |
| $3,000 or more | 6 (9.2%) | 0 (0.0%) |
| Total | 65 (100.0%) | 2 (100.0%) |
Physical Housing Characteristics in Conkling Park
Housing Structures in Conkling Park
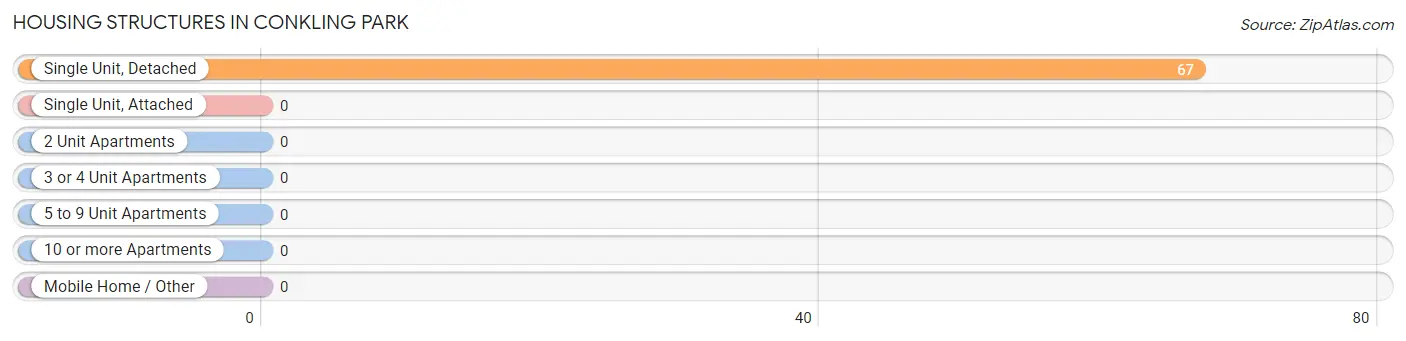
| Structure Type | # Housing Units | % Housing Units |
| Single Unit, Detached | 67 | 100.0% |
| Single Unit, Attached | 0 | 0.0% |
| 2 Unit Apartments | 0 | 0.0% |
| 3 or 4 Unit Apartments | 0 | 0.0% |
| 5 to 9 Unit Apartments | 0 | 0.0% |
| 10 or more Apartments | 0 | 0.0% |
| Mobile Home / Other | 0 | 0.0% |
| Total | 67 | 100.0% |
Housing Structures by Occupancy in Conkling Park
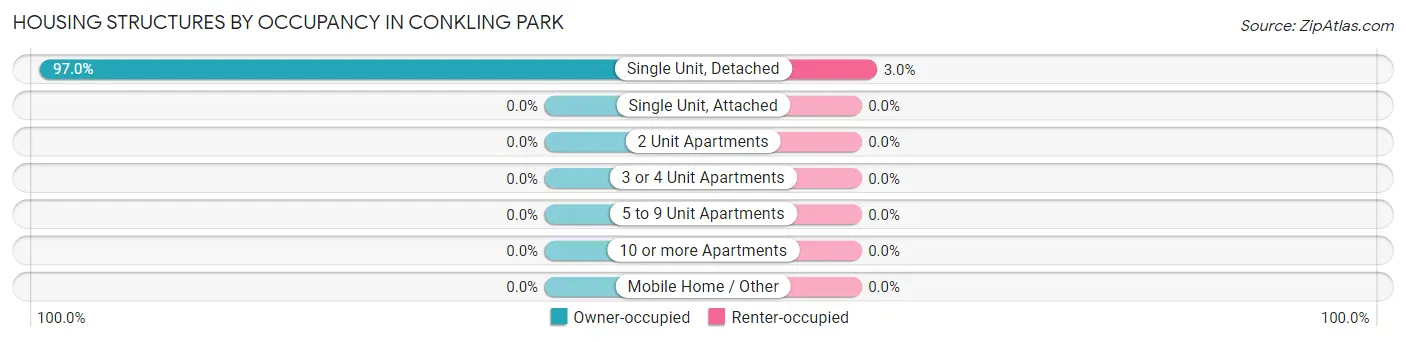
| Structure Type | Owner-occupied | Renter-occupied |
| Single Unit, Detached | 65 (97.0%) | 2 (3.0%) |
| Single Unit, Attached | 0 (0.0%) | 0 (0.0%) |
| 2 Unit Apartments | 0 (0.0%) | 0 (0.0%) |
| 3 or 4 Unit Apartments | 0 (0.0%) | 0 (0.0%) |
| 5 to 9 Unit Apartments | 0 (0.0%) | 0 (0.0%) |
| 10 or more Apartments | 0 (0.0%) | 0 (0.0%) |
| Mobile Home / Other | 0 (0.0%) | 0 (0.0%) |
| Total | 65 (97.0%) | 2 (3.0%) |
Housing Structures by Number of Rooms in Conkling Park
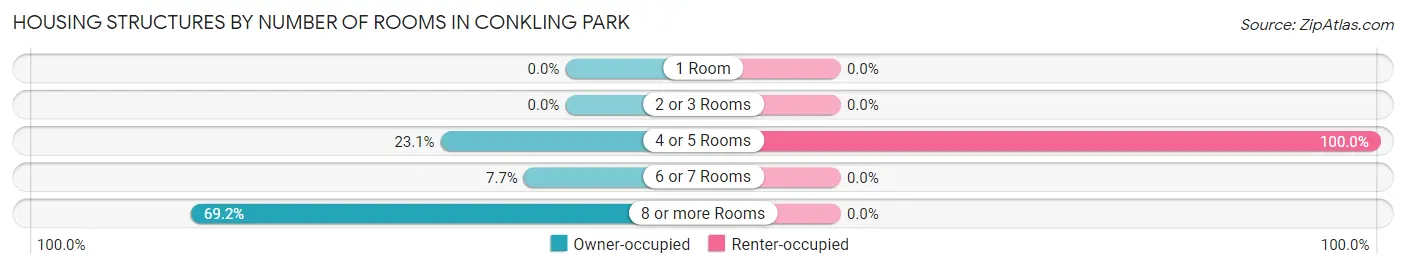
| Number of Rooms | Owner-occupied | Renter-occupied |
| 1 Room | 0 (0.0%) | 0 (0.0%) |
| 2 or 3 Rooms | 0 (0.0%) | 0 (0.0%) |
| 4 or 5 Rooms | 15 (23.1%) | 2 (100.0%) |
| 6 or 7 Rooms | 5 (7.7%) | 0 (0.0%) |
| 8 or more Rooms | 45 (69.2%) | 0 (0.0%) |
| Total | 65 (100.0%) | 2 (100.0%) |
Housing Structure by Heating Type in Conkling Park
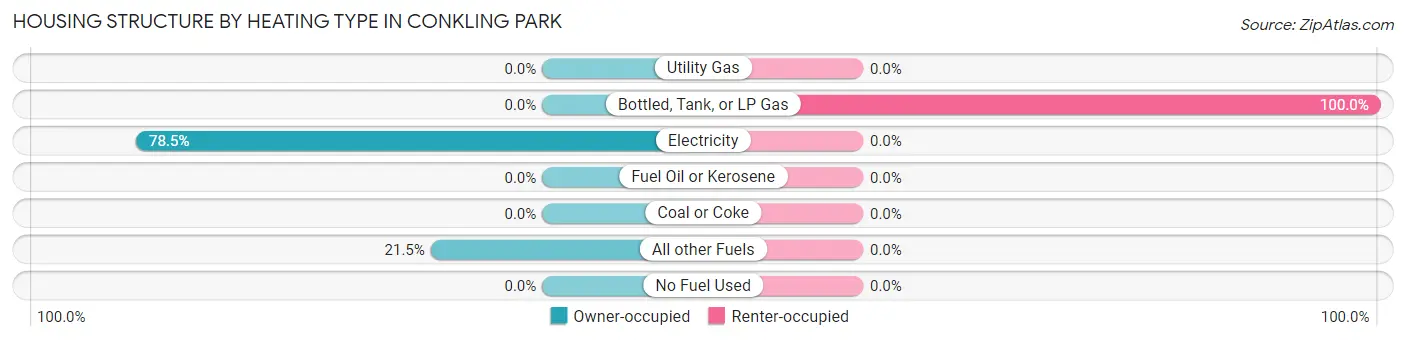
| Heating Type | Owner-occupied | Renter-occupied |
| Utility Gas | 0 (0.0%) | 0 (0.0%) |
| Bottled, Tank, or LP Gas | 0 (0.0%) | 2 (100.0%) |
| Electricity | 51 (78.5%) | 0 (0.0%) |
| Fuel Oil or Kerosene | 0 (0.0%) | 0 (0.0%) |
| Coal or Coke | 0 (0.0%) | 0 (0.0%) |
| All other Fuels | 14 (21.5%) | 0 (0.0%) |
| No Fuel Used | 0 (0.0%) | 0 (0.0%) |
| Total | 65 (100.0%) | 2 (100.0%) |
Household Vehicle Usage in Conkling Park
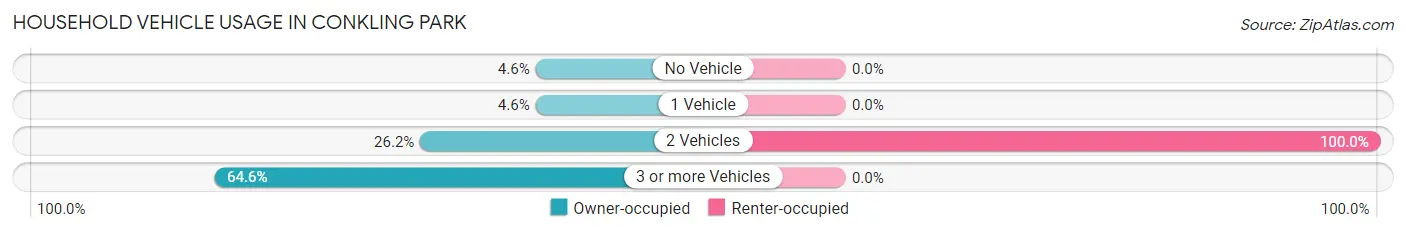
| Vehicles per Household | Owner-occupied | Renter-occupied |
| No Vehicle | 3 (4.6%) | 0 (0.0%) |
| 1 Vehicle | 3 (4.6%) | 0 (0.0%) |
| 2 Vehicles | 17 (26.2%) | 2 (100.0%) |
| 3 or more Vehicles | 42 (64.6%) | 0 (0.0%) |
| Total | 65 (100.0%) | 2 (100.0%) |
Real Estate & Mortgages in Conkling Park
Real Estate and Mortgage Overview in Conkling Park
| Characteristic | Without Mortgage | With Mortgage |
| Housing Units | 12 | 53 |
| Median Property Value | $275,000 | $592,300 |
| Median Household Income | $43,750 | $3 |
| Monthly Housing Costs | $450 | $6 |
| Real Estate Taxes | - | - |
Property Value by Mortgage Status in Conkling Park
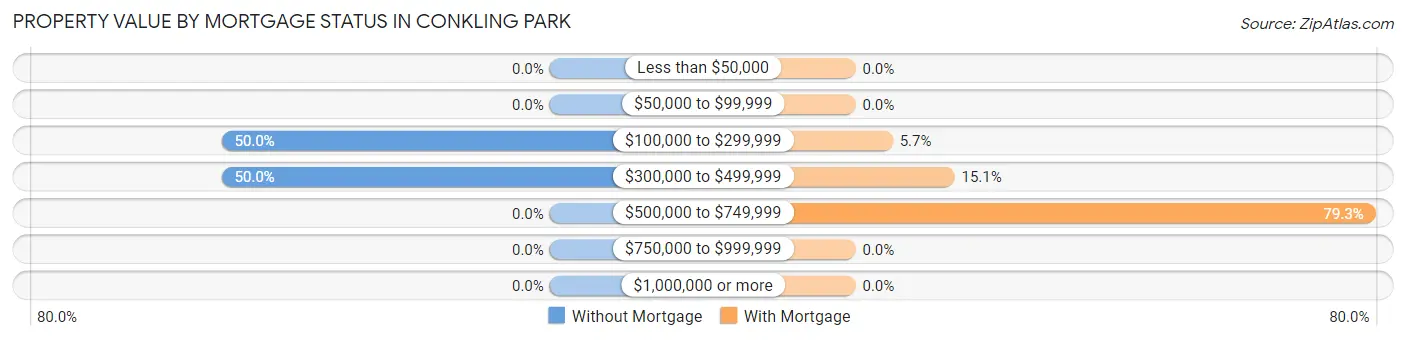
| Property Value | Without Mortgage | With Mortgage |
| Less than $50,000 | 0 (0.0%) | 0 (0.0%) |
| $50,000 to $99,999 | 0 (0.0%) | 0 (0.0%) |
| $100,000 to $299,999 | 6 (50.0%) | 3 (5.7%) |
| $300,000 to $499,999 | 6 (50.0%) | 8 (15.1%) |
| $500,000 to $749,999 | 0 (0.0%) | 42 (79.2%) |
| $750,000 to $999,999 | 0 (0.0%) | 0 (0.0%) |
| $1,000,000 or more | 0 (0.0%) | 0 (0.0%) |
| Total | 12 (100.0%) | 53 (100.0%) |
Household Income by Mortgage Status in Conkling Park
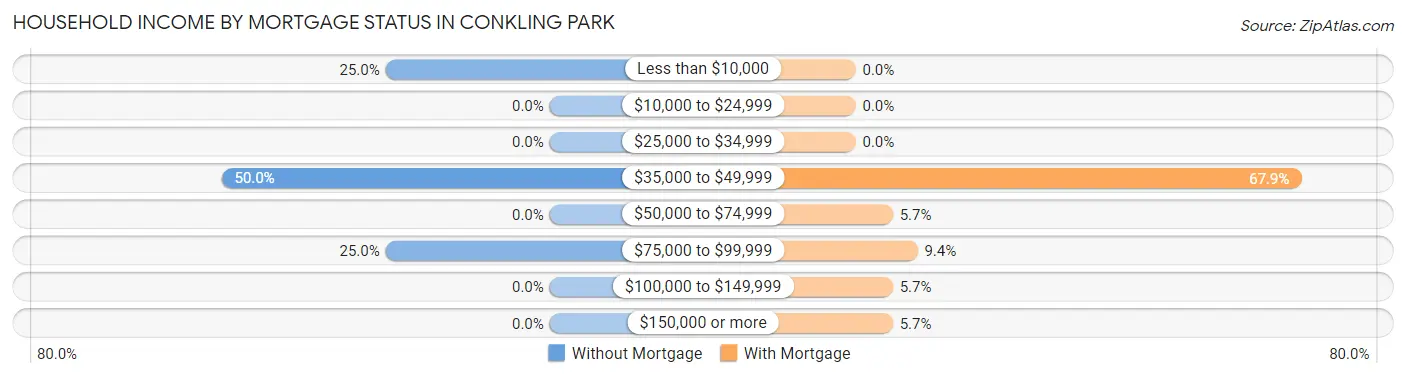
| Household Income | Without Mortgage | With Mortgage |
| Less than $10,000 | 3 (25.0%) | 0 (0.0%) |
| $10,000 to $24,999 | 0 (0.0%) | 0 (0.0%) |
| $25,000 to $34,999 | 0 (0.0%) | 0 (0.0%) |
| $35,000 to $49,999 | 6 (50.0%) | 36 (67.9%) |
| $50,000 to $74,999 | 0 (0.0%) | 3 (5.7%) |
| $75,000 to $99,999 | 3 (25.0%) | 5 (9.4%) |
| $100,000 to $149,999 | 0 (0.0%) | 3 (5.7%) |
| $150,000 or more | 0 (0.0%) | 3 (5.7%) |
| Total | 12 (100.0%) | 53 (100.0%) |
Property Value to Household Income Ratio in Conkling Park
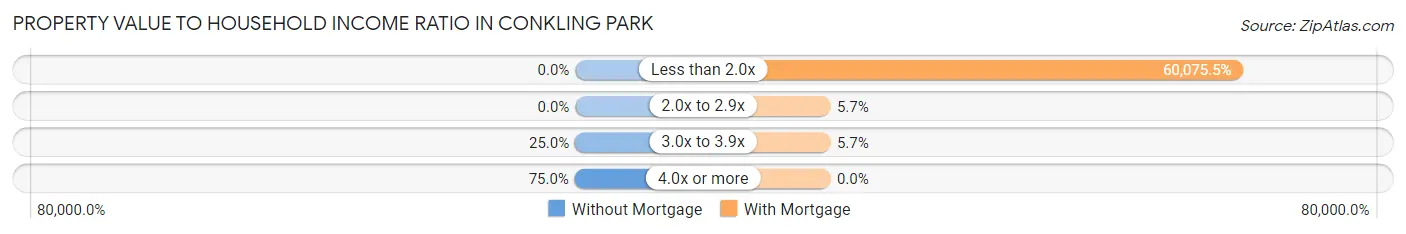
| Value-to-Income Ratio | Without Mortgage | With Mortgage |
| Less than 2.0x | 0 (0.0%) | 31,840 (60,075.5%) |
| 2.0x to 2.9x | 0 (0.0%) | 3 (5.7%) |
| 3.0x to 3.9x | 3 (25.0%) | 3 (5.7%) |
| 4.0x or more | 9 (75.0%) | 0 (0.0%) |
| Total | 12 (100.0%) | 53 (100.0%) |
Real Estate Taxes by Mortgage Status in Conkling Park
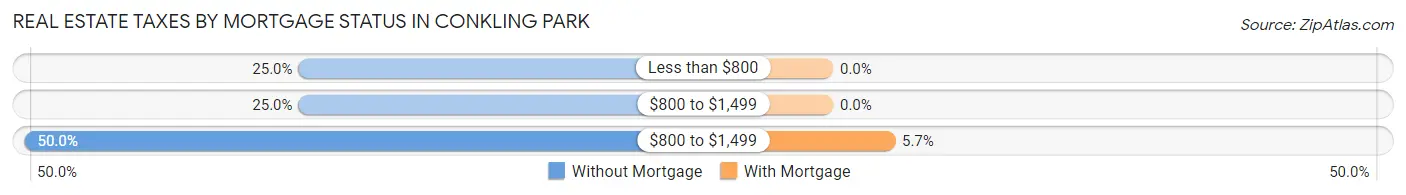
| Property Taxes | Without Mortgage | With Mortgage |
| Less than $800 | 3 (25.0%) | 0 (0.0%) |
| $800 to $1,499 | 3 (25.0%) | 0 (0.0%) |
| $800 to $1,499 | 6 (50.0%) | 3 (5.7%) |
| Total | 12 (100.0%) | 53 (100.0%) |
Health & Disability in Conkling Park
Health Insurance Coverage by Age in Conkling Park
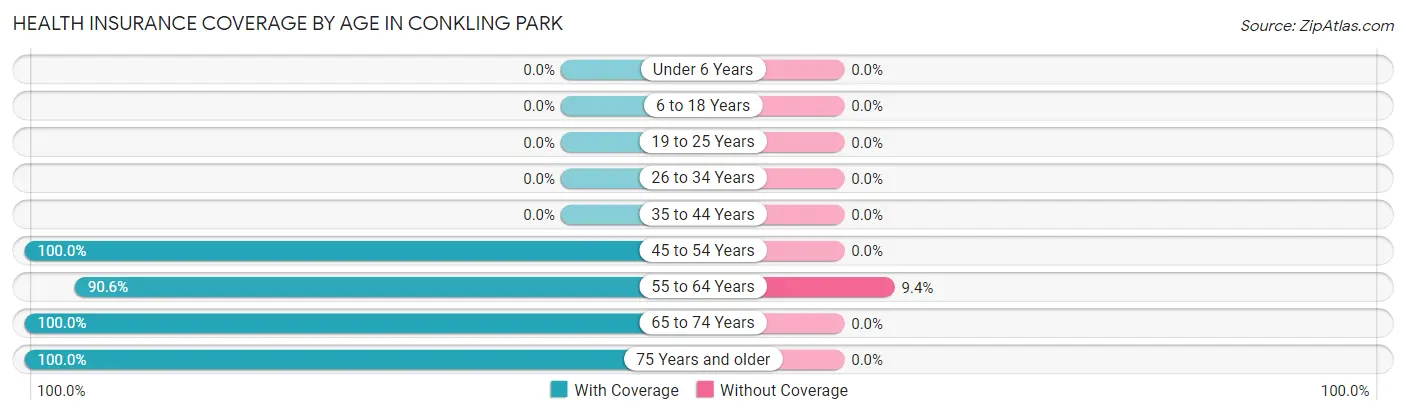
| Age Bracket | With Coverage | Without Coverage |
| Under 6 Years | 0 (0.0%) | 0 (0.0%) |
| 6 to 18 Years | 0 (0.0%) | 0 (0.0%) |
| 19 to 25 Years | 0 (0.0%) | 0 (0.0%) |
| 26 to 34 Years | 0 (0.0%) | 0 (0.0%) |
| 35 to 44 Years | 0 (0.0%) | 0 (0.0%) |
| 45 to 54 Years | 11 (100.0%) | 0 (0.0%) |
| 55 to 64 Years | 29 (90.6%) | 3 (9.4%) |
| 65 to 74 Years | 69 (100.0%) | 0 (0.0%) |
| 75 Years and older | 18 (100.0%) | 0 (0.0%) |
| Total | 127 (97.7%) | 3 (2.3%) |
Health Insurance Coverage by Citizenship Status in Conkling Park
| Citizenship Status | With Coverage | Without Coverage |
| Native Born | 0 (0.0%) | 0 (0.0%) |
| Foreign Born, Citizen | 0 (0.0%) | 0 (0.0%) |
| Foreign Born, not a Citizen | 0 (0.0%) | 0 (0.0%) |
Health Insurance Coverage by Household Income in Conkling Park
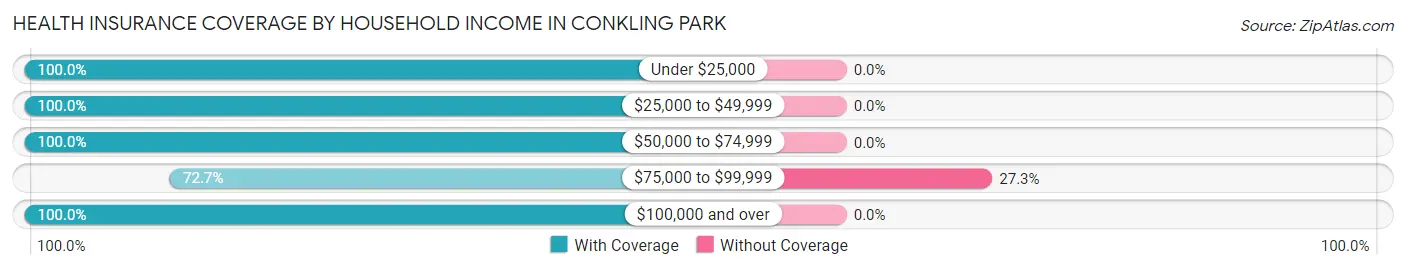
| Household Income | With Coverage | Without Coverage |
| Under $25,000 | 6 (100.0%) | 0 (0.0%) |
| $25,000 to $49,999 | 83 (100.0%) | 0 (0.0%) |
| $50,000 to $74,999 | 8 (100.0%) | 0 (0.0%) |
| $75,000 to $99,999 | 8 (72.7%) | 3 (27.3%) |
| $100,000 and over | 22 (100.0%) | 0 (0.0%) |
Public vs Private Health Insurance Coverage by Age in Conkling Park
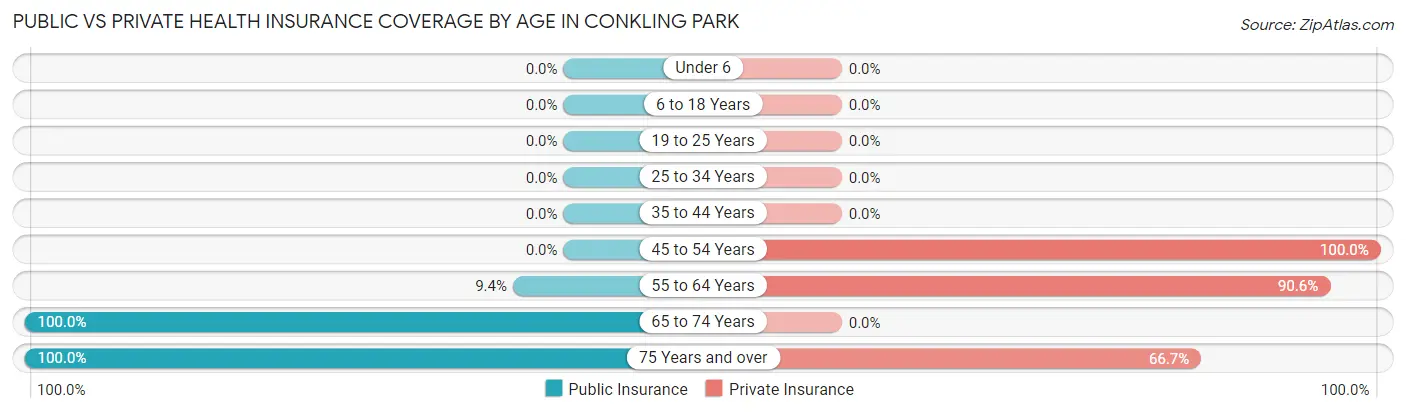
| Age Bracket | Public Insurance | Private Insurance |
| Under 6 | 0 (0.0%) | 0 (0.0%) |
| 6 to 18 Years | 0 (0.0%) | 0 (0.0%) |
| 19 to 25 Years | 0 (0.0%) | 0 (0.0%) |
| 25 to 34 Years | 0 (0.0%) | 0 (0.0%) |
| 35 to 44 Years | 0 (0.0%) | 0 (0.0%) |
| 45 to 54 Years | 0 (0.0%) | 11 (100.0%) |
| 55 to 64 Years | 3 (9.4%) | 29 (90.6%) |
| 65 to 74 Years | 69 (100.0%) | 0 (0.0%) |
| 75 Years and over | 18 (100.0%) | 12 (66.7%) |
| Total | 90 (69.2%) | 52 (40.0%) |
Disability Status by Sex by Age in Conkling Park
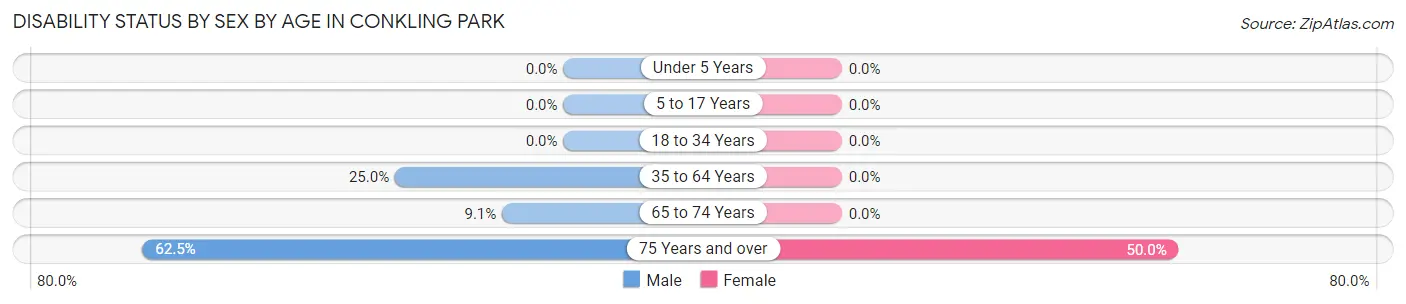
| Age Bracket | Male | Female |
| Under 5 Years | 0 (0.0%) | 0 (0.0%) |
| 5 to 17 Years | 0 (0.0%) | 0 (0.0%) |
| 18 to 34 Years | 0 (0.0%) | 0 (0.0%) |
| 35 to 64 Years | 6 (25.0%) | 0 (0.0%) |
| 65 to 74 Years | 3 (9.1%) | 0 (0.0%) |
| 75 Years and over | 5 (62.5%) | 5 (50.0%) |
Disability Class by Sex by Age in Conkling Park
Disability Class: Hearing Difficulty
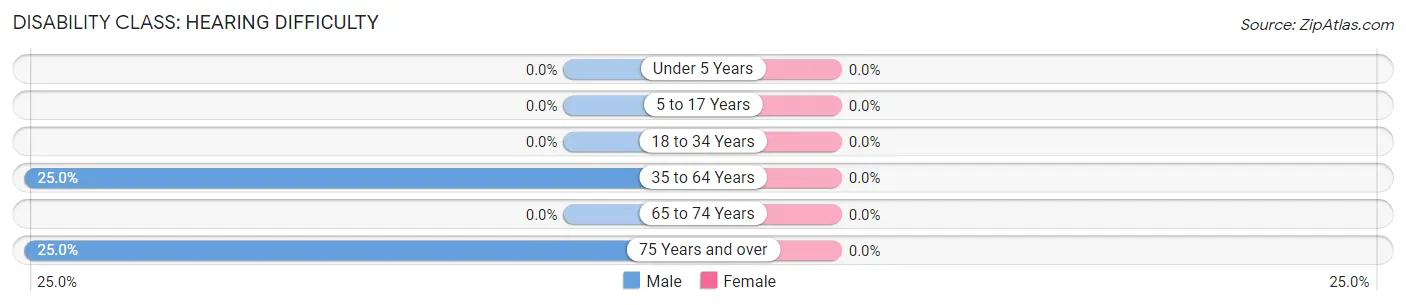
| Age Bracket | Male | Female |
| Under 5 Years | 0 (0.0%) | 0 (0.0%) |
| 5 to 17 Years | 0 (0.0%) | 0 (0.0%) |
| 18 to 34 Years | 0 (0.0%) | 0 (0.0%) |
| 35 to 64 Years | 6 (25.0%) | 0 (0.0%) |
| 65 to 74 Years | 0 (0.0%) | 0 (0.0%) |
| 75 Years and over | 2 (25.0%) | 0 (0.0%) |
Disability Class: Vision Difficulty
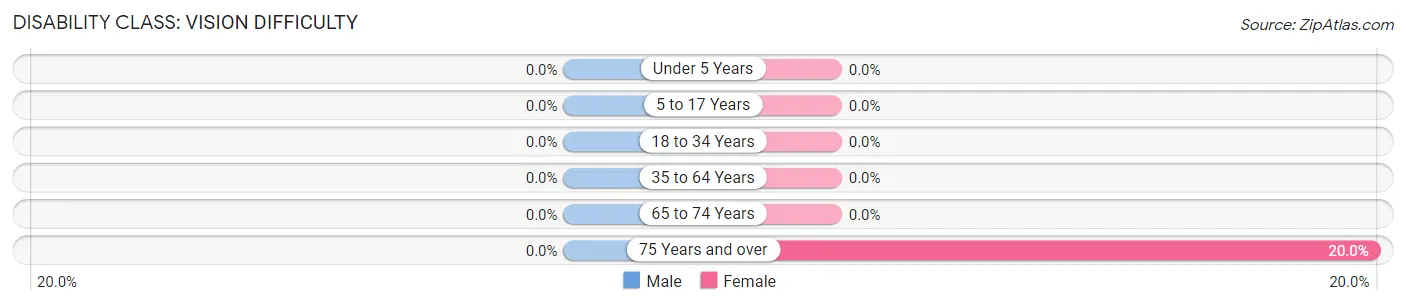
| Age Bracket | Male | Female |
| Under 5 Years | 0 (0.0%) | 0 (0.0%) |
| 5 to 17 Years | 0 (0.0%) | 0 (0.0%) |
| 18 to 34 Years | 0 (0.0%) | 0 (0.0%) |
| 35 to 64 Years | 0 (0.0%) | 0 (0.0%) |
| 65 to 74 Years | 0 (0.0%) | 0 (0.0%) |
| 75 Years and over | 0 (0.0%) | 2 (20.0%) |
Disability Class: Cognitive Difficulty
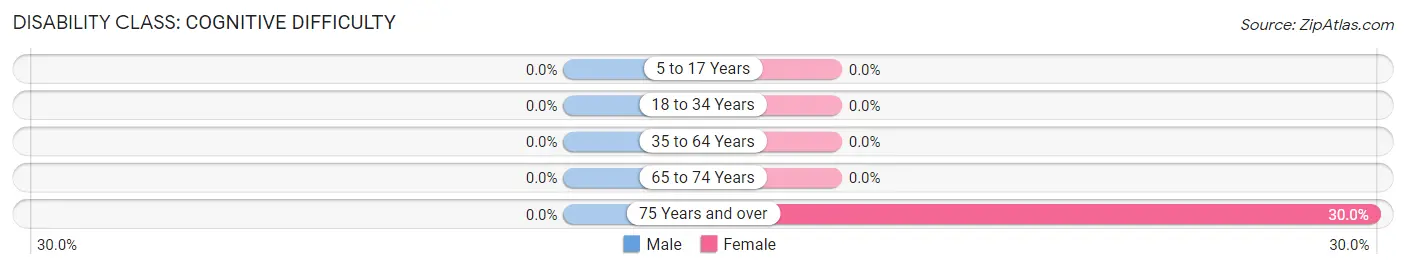
| Age Bracket | Male | Female |
| 5 to 17 Years | 0 (0.0%) | 0 (0.0%) |
| 18 to 34 Years | 0 (0.0%) | 0 (0.0%) |
| 35 to 64 Years | 0 (0.0%) | 0 (0.0%) |
| 65 to 74 Years | 0 (0.0%) | 0 (0.0%) |
| 75 Years and over | 0 (0.0%) | 3 (30.0%) |
Disability Class: Ambulatory Difficulty
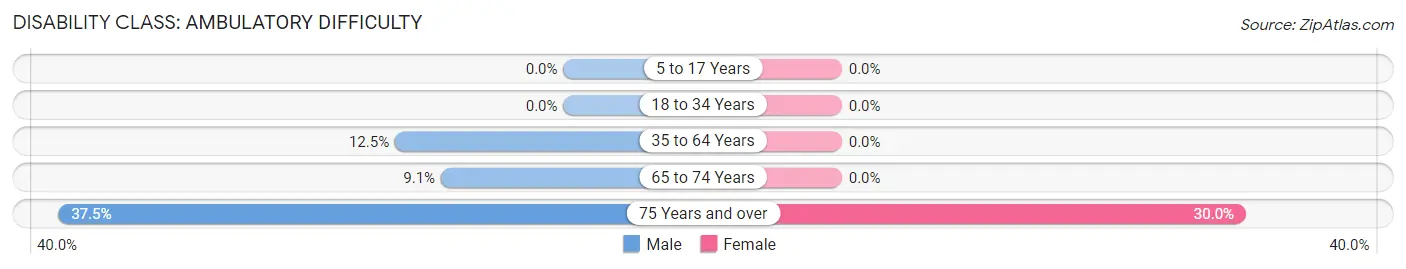
| Age Bracket | Male | Female |
| 5 to 17 Years | 0 (0.0%) | 0 (0.0%) |
| 18 to 34 Years | 0 (0.0%) | 0 (0.0%) |
| 35 to 64 Years | 3 (12.5%) | 0 (0.0%) |
| 65 to 74 Years | 3 (9.1%) | 0 (0.0%) |
| 75 Years and over | 3 (37.5%) | 3 (30.0%) |
Disability Class: Self-Care Difficulty
| Age Bracket | Male | Female |
| 5 to 17 Years | 0 (0.0%) | 0 (0.0%) |
| 18 to 34 Years | 0 (0.0%) | 0 (0.0%) |
| 35 to 64 Years | 0 (0.0%) | 0 (0.0%) |
| 65 to 74 Years | 0 (0.0%) | 0 (0.0%) |
| 75 Years and over | 0 (0.0%) | 0 (0.0%) |
Technology Access in Conkling Park
Computing Device Access in Conkling Park
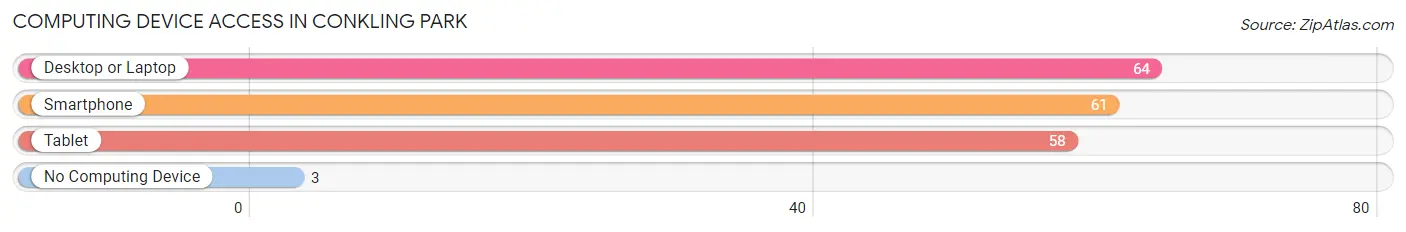
| Device Type | # Households | % Households |
| Desktop or Laptop | 64 | 95.5% |
| Smartphone | 61 | 91.0% |
| Tablet | 58 | 86.6% |
| No Computing Device | 3 | 4.5% |
| Total | 67 | 100.0% |
Internet Access in Conkling Park
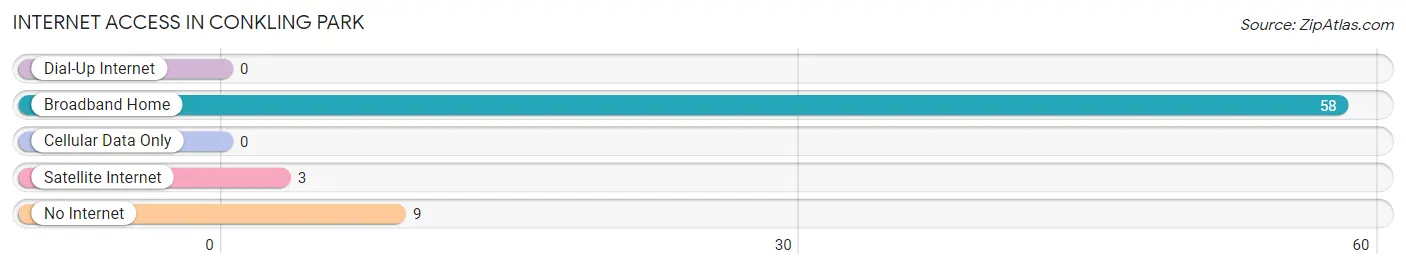
| Internet Type | # Households | % Households |
| Dial-Up Internet | 0 | 0.0% |
| Broadband Home | 58 | 86.6% |
| Cellular Data Only | 0 | 0.0% |
| Satellite Internet | 3 | 4.5% |
| No Internet | 9 | 13.4% |
| Total | 67 | 100.0% |
Conkling Park Summary
Conkling Park is a small, rural community located in the northern part of Idaho, near the border of Montana. It is situated in the Clearwater National Forest, and is surrounded by mountains, rivers, and lakes. The population of Conkling Park is estimated to be around 200 people, and the majority of the population is white.
History
Conkling Park was founded in the late 1800s by a group of settlers who were looking for a place to settle and start a new life. The area was originally known as "Conkling's Park" after the first settler, John Conkling. The settlers built a small log cabin and began to farm the land. The area was also used for logging and mining, and the town grew slowly over the years.
In the early 1900s, the town was renamed "Conkling Park" and the population began to grow. The town was home to a variety of businesses, including a general store, a post office, a blacksmith shop, and a sawmill. The town also had a school, a church, and a few other small businesses.
Geography
Conkling Park is located in the northern part of Idaho, near the border of Montana. It is situated in the Clearwater National Forest, and is surrounded by mountains, rivers, and lakes. The area is known for its beautiful scenery and outdoor activities, such as fishing, hunting, and camping. The town is also close to several ski resorts, making it a popular destination for winter sports.
Economy
The economy of Conkling Park is largely based on tourism and outdoor recreation. The town is home to several small businesses, including a general store, a post office, a blacksmith shop, and a sawmill. The town also has a few restaurants and bars, as well as a few small hotels. The town is also home to a ski resort, which attracts visitors from all over the country.
Demographics
As of the 2010 census, the population of Conkling Park was estimated to be around 200 people. The majority of the population is white, with a small percentage of Native American and Hispanic residents. The median household income is around $30,000, and the median age is around 40 years old. The town is home to a variety of religious denominations, including Catholic, Protestant, and Mormon.
Common Questions
What is Per Capita Income in Conkling Park?
Per Capita income in Conkling Park is $27,688.
What is the Median Family Income in Conkling Park?
Median Family Income in Conkling Park is $32,014.
What is the Median Household income in Conkling Park?
Median Household Income in Conkling Park is $32,118.
What is Inequality or Gini Index in Conkling Park?
Inequality or Gini Index in Conkling Park is 0.40.
What is the Total Population of Conkling Park?
Total Population of Conkling Park is 130.
What is the Total Male Population of Conkling Park?
Total Male Population of Conkling Park is 65.
What is the Total Female Population of Conkling Park?
Total Female Population of Conkling Park is 65.
What is the Ratio of Males per 100 Females in Conkling Park?
There are 100.00 Males per 100 Females in Conkling Park.
What is the Ratio of Females per 100 Males in Conkling Park?
There are 100.00 Females per 100 Males in Conkling Park.
What is the Median Population Age in Conkling Park?
Median Population Age in Conkling Park is 68.3 Years.
What is the Average Family Size in Conkling Park
Average Family Size in Conkling Park is 2.0 People.
What is the Average Household Size in Conkling Park
Average Household Size in Conkling Park is 1.9 People.
How Large is the Labor Force in Conkling Park?
There are 23 People in the Labor Forcein in Conkling Park.
What is the Percentage of People in the Labor Force in Conkling Park?
17.7% of People are in the Labor Force in Conkling Park.