Ketchum, ID Map & Demographics
Ketchum Map
Ketchum Overview
$59,167
PER CAPITA INCOME
$91,410
AVG FAMILY INCOME
$87,478
AVG HOUSEHOLD INCOME
39.5%
WAGE / INCOME GAP [ % ]
60.5¢/ $1
WAGE / INCOME GAP [ $ ]
0.42
INEQUALITY / GINI INDEX
3,490
TOTAL POPULATION
1,705
MALE POPULATION
1,785
FEMALE POPULATION
95.52
MALES / 100 FEMALES
104.69
FEMALES / 100 MALES
51.3
MEDIAN AGE
2.5
AVG FAMILY SIZE
1.9
AVG HOUSEHOLD SIZE
2,322
LABOR FORCE [ PEOPLE ]
71.5%
PERCENT IN LABOR FORCE
0.9%
UNEMPLOYMENT RATE
Ketchum Zip Codes
Ketchum Area Codes
Income in Ketchum
Income Overview in Ketchum
Per Capita Income in Ketchum is $59,167, while median incomes of families and households are $91,410 and $87,478 respectively.
| Characteristic | Number | Measure |
| Per Capita Income | 3,490 | $59,167 |
| Median Family Income | 948 | $91,410 |
| Mean Family Income | 948 | $106,225 |
| Median Household Income | 1,828 | $87,478 |
| Mean Household Income | 1,828 | $109,791 |
| Income Deficit | 948 | $0 |
| Wage / Income Gap (%) | 3,490 | 39.47% |
| Wage / Income Gap ($) | 3,490 | 60.53¢ per $1 |
| Gini / Inequality Index | 3,490 | 0.42 |
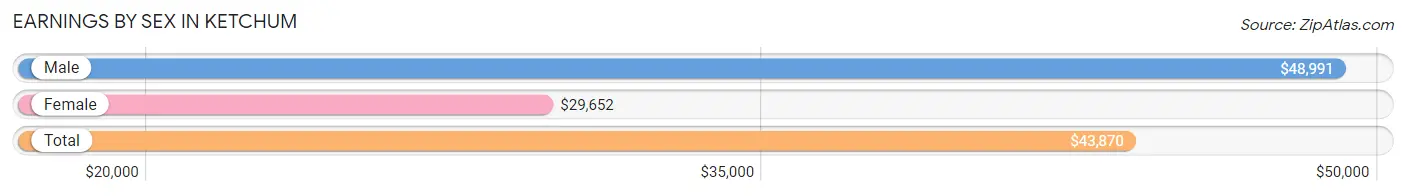
Earnings by Sex in Ketchum
Average Earnings in Ketchum are $43,870, $48,991 for men and $29,652 for women, a difference of 39.5%.
| Sex | Number | Average Earnings |
| Male | 1,224 (48.9%) | $48,991 |
| Female | 1,280 (51.1%) | $29,652 |
| Total | 2,504 (100.0%) | $43,870 |
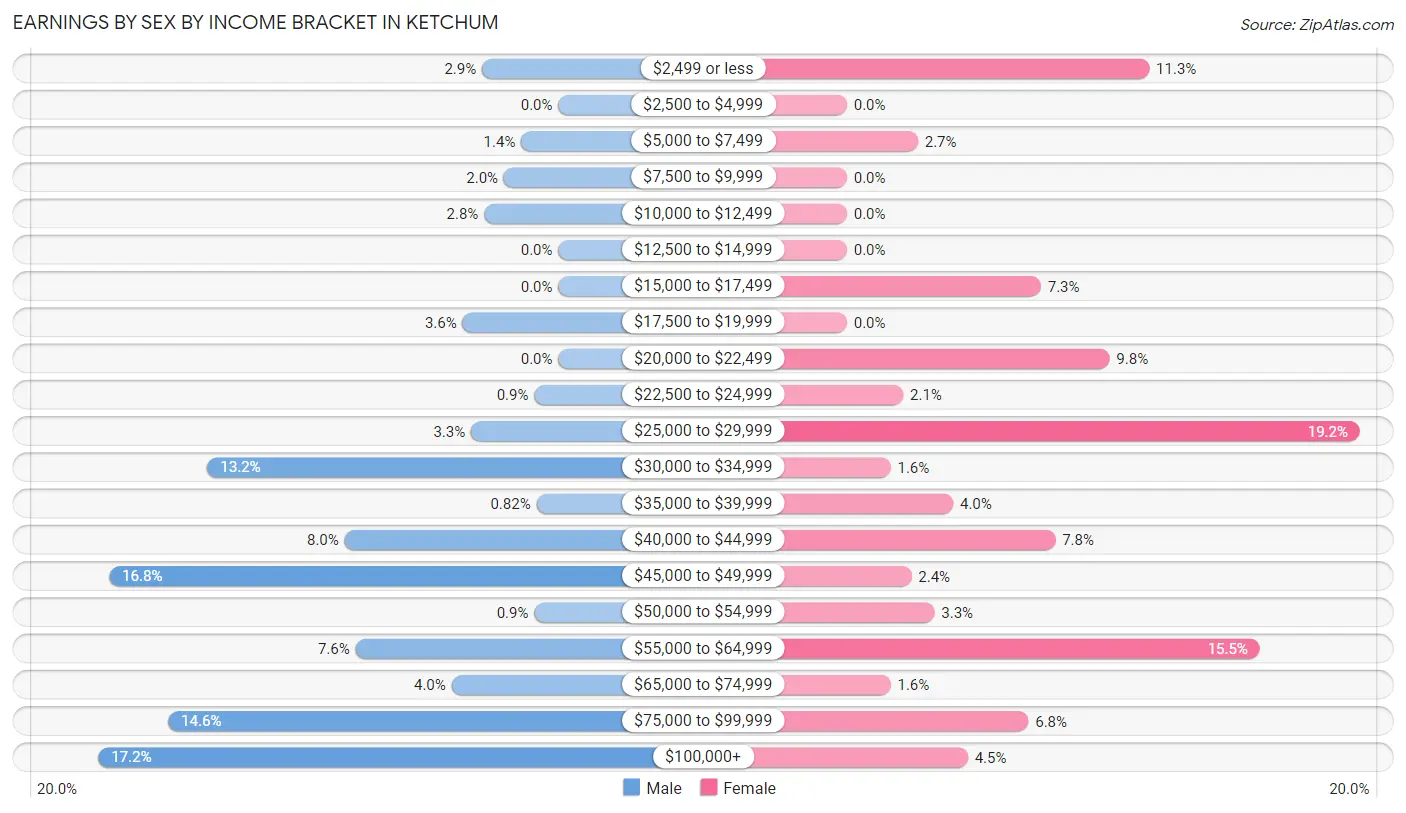
Earnings by Sex by Income Bracket in Ketchum
The most common earnings brackets in Ketchum are $100,000+ for men (211 | 17.2%) and $25,000 to $29,999 for women (246 | 19.2%).
| Income | Male | Female |
| $2,499 or less | 35 (2.9%) | 145 (11.3%) |
| $2,500 to $4,999 | 0 (0.0%) | 0 (0.0%) |
| $5,000 to $7,499 | 17 (1.4%) | 34 (2.7%) |
| $7,500 to $9,999 | 25 (2.0%) | 0 (0.0%) |
| $10,000 to $12,499 | 34 (2.8%) | 0 (0.0%) |
| $12,500 to $14,999 | 0 (0.0%) | 0 (0.0%) |
| $15,000 to $17,499 | 0 (0.0%) | 93 (7.3%) |
| $17,500 to $19,999 | 44 (3.6%) | 0 (0.0%) |
| $20,000 to $22,499 | 0 (0.0%) | 126 (9.8%) |
| $22,500 to $24,999 | 11 (0.9%) | 27 (2.1%) |
| $25,000 to $29,999 | 40 (3.3%) | 246 (19.2%) |
| $30,000 to $34,999 | 161 (13.2%) | 21 (1.6%) |
| $35,000 to $39,999 | 10 (0.8%) | 51 (4.0%) |
| $40,000 to $44,999 | 98 (8.0%) | 100 (7.8%) |
| $45,000 to $49,999 | 206 (16.8%) | 31 (2.4%) |
| $50,000 to $54,999 | 11 (0.9%) | 42 (3.3%) |
| $55,000 to $64,999 | 93 (7.6%) | 198 (15.5%) |
| $65,000 to $74,999 | 49 (4.0%) | 21 (1.6%) |
| $75,000 to $99,999 | 179 (14.6%) | 87 (6.8%) |
| $100,000+ | 211 (17.2%) | 58 (4.5%) |
| Total | 1,224 (100.0%) | 1,280 (100.0%) |
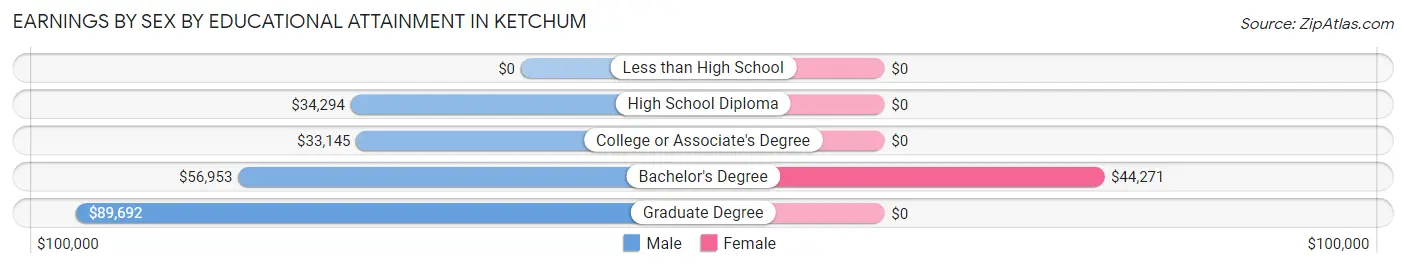
Earnings by Sex by Educational Attainment in Ketchum
Average earnings in Ketchum are $49,064 for men and $36,054 for women, a difference of 26.5%. Men with an educational attainment of graduate degree enjoy the highest average annual earnings of $89,692, while those with college or associate's degree education earn the least with $33,145. Women with an educational attainment of bachelor's degree earn the most with the average annual earnings of $44,271, while those with bachelor's degree education have the smallest earnings of $44,271.
| Educational Attainment | Male Income | Female Income |
| Less than High School | - | - |
| High School Diploma | $34,294 | $0 |
| College or Associate's Degree | $33,145 | $0 |
| Bachelor's Degree | $56,953 | $44,271 |
| Graduate Degree | $89,692 | $0 |
| Total | $49,064 | $36,054 |
Family Income in Ketchum
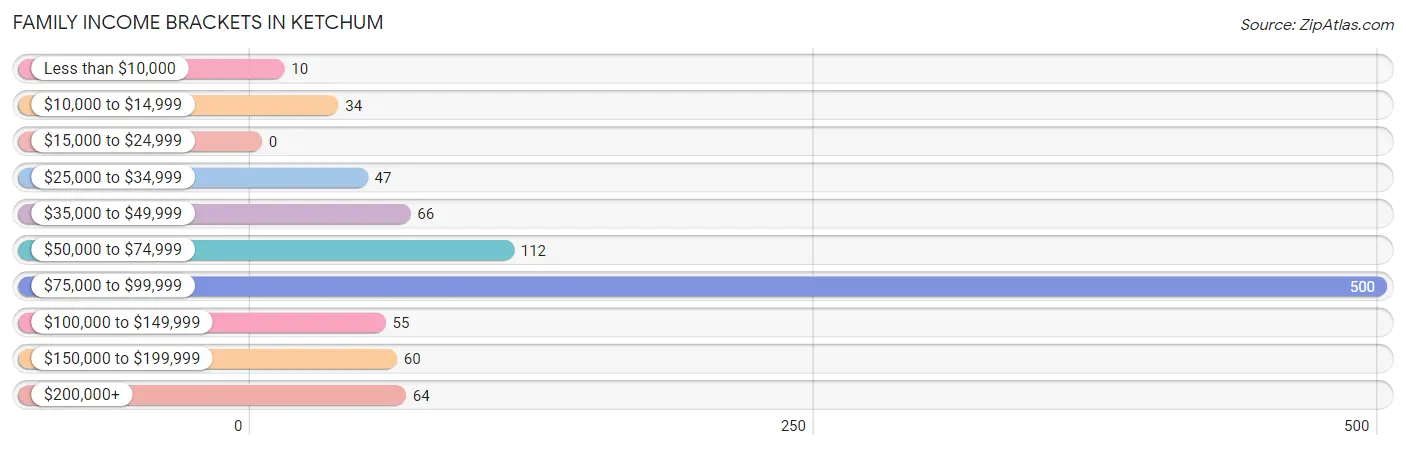
Family Income Brackets in Ketchum
According to the Ketchum family income data, there are 500 families falling into the $75,000 to $99,999 income range, which is the most common income bracket and makes up 52.7% of all families.
| Income Bracket | # Families | % Families |
| Less than $10,000 | 10 | 1.1% |
| $10,000 to $14,999 | 34 | 3.6% |
| $15,000 to $24,999 | 0 | 0.0% |
| $25,000 to $34,999 | 47 | 5.0% |
| $35,000 to $49,999 | 66 | 7.0% |
| $50,000 to $74,999 | 112 | 11.8% |
| $75,000 to $99,999 | 500 | 52.7% |
| $100,000 to $149,999 | 55 | 5.8% |
| $150,000 to $199,999 | 60 | 6.3% |
| $200,000+ | 64 | 6.8% |
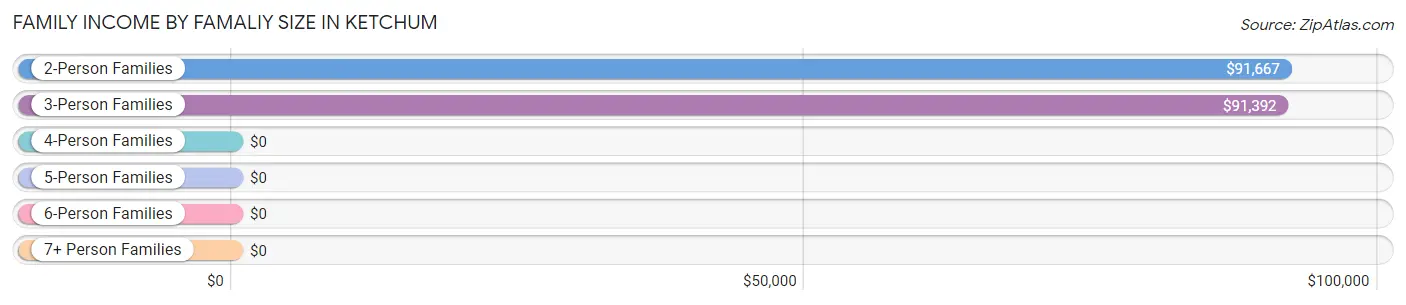
Family Income by Famaliy Size in Ketchum
2-person families (656 | 69.2%) account for the highest median family income in Ketchum with $91,667 per family, while 2-person families (656 | 69.2%) have the highest median income of $45,834 per family member.
| Income Bracket | # Families | Median Income |
| 2-Person Families | 656 (69.2%) | $91,667 |
| 3-Person Families | 163 (17.2%) | $91,392 |
| 4-Person Families | 85 (9.0%) | $0 |
| 5-Person Families | 44 (4.6%) | $0 |
| 6-Person Families | 0 (0.0%) | $0 |
| 7+ Person Families | 0 (0.0%) | $0 |
| Total | 948 (100.0%) | $91,410 |
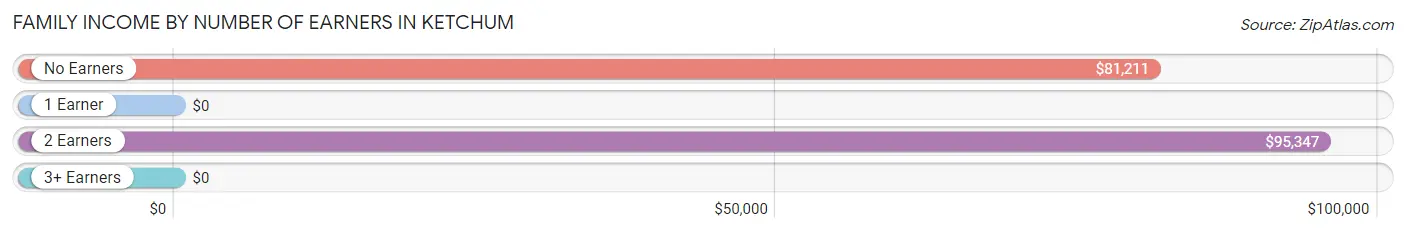
Family Income by Number of Earners in Ketchum
| Number of Earners | # Families | Median Income |
| No Earners | 155 (16.4%) | $81,211 |
| 1 Earner | 98 (10.3%) | $0 |
| 2 Earners | 563 (59.4%) | $95,347 |
| 3+ Earners | 132 (13.9%) | $0 |
| Total | 948 (100.0%) | $91,410 |
Household Income in Ketchum
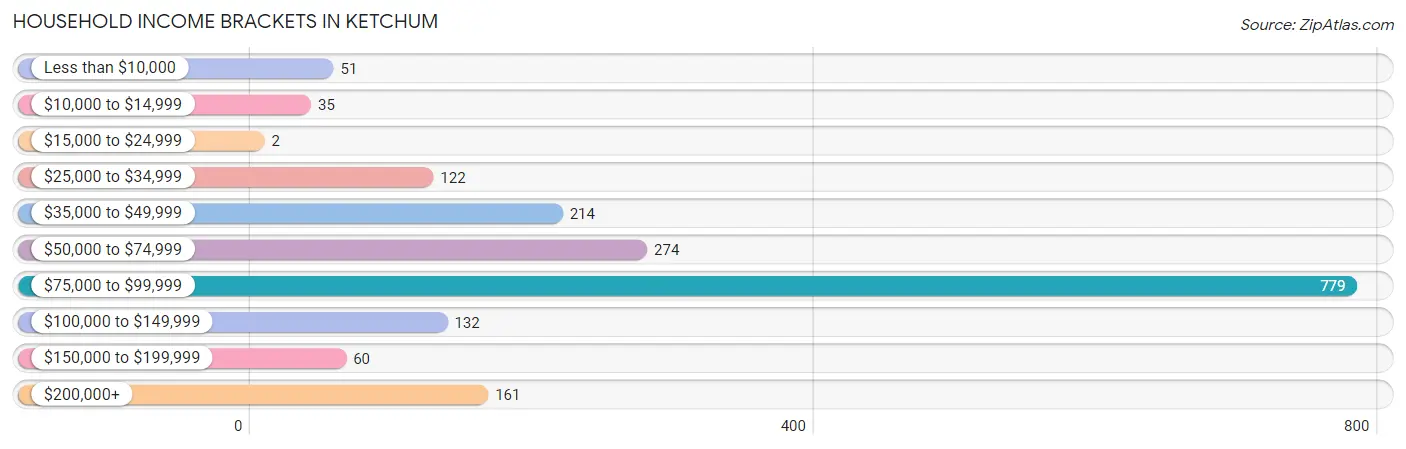
Household Income Brackets in Ketchum
With 779 households falling in the category, the $75,000 to $99,999 income range is the most frequent in Ketchum, accounting for 42.6% of all households. In contrast, only 2 households (0.1%) fall into the $15,000 to $24,999 income bracket, making it the least populous group.
| Income Bracket | # Households | % Households |
| Less than $10,000 | 51 | 2.8% |
| $10,000 to $14,999 | 35 | 1.9% |
| $15,000 to $24,999 | 2 | 0.1% |
| $25,000 to $34,999 | 122 | 6.7% |
| $35,000 to $49,999 | 214 | 11.7% |
| $50,000 to $74,999 | 274 | 15.0% |
| $75,000 to $99,999 | 779 | 42.6% |
| $100,000 to $149,999 | 132 | 7.2% |
| $150,000 to $199,999 | 60 | 3.3% |
| $200,000+ | 161 | 8.8% |
Household Income by Householder Age in Ketchum
The median household income in Ketchum is $87,478, with the highest median household income of $90,616 found in the 45 to 64 years age bracket for the primary householder. A total of 917 households (50.2%) fall into this category.
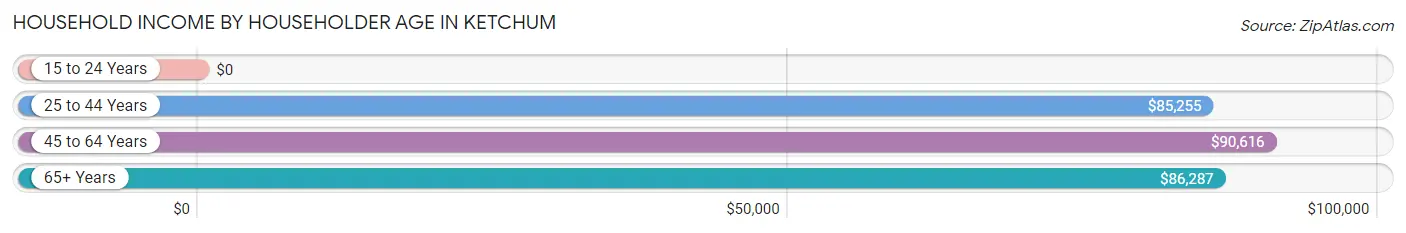
| Income Bracket | # Households | Median Income |
| 15 to 24 Years | 0 (0.0%) | $0 |
| 25 to 44 Years | 414 (22.7%) | $85,255 |
| 45 to 64 Years | 917 (50.2%) | $90,616 |
| 65+ Years | 497 (27.2%) | $86,287 |
| Total | 1,828 (100.0%) | $87,478 |
Poverty in Ketchum
Income Below Poverty by Sex and Age in Ketchum
With 11.2% poverty level for males and 8.0% for females among the residents of Ketchum, 16 and 17 year old males and 15 year old females are the most vulnerable to poverty, with 27 males (100.0%) and 47 females (59.5%) in their respective age groups living below the poverty level.
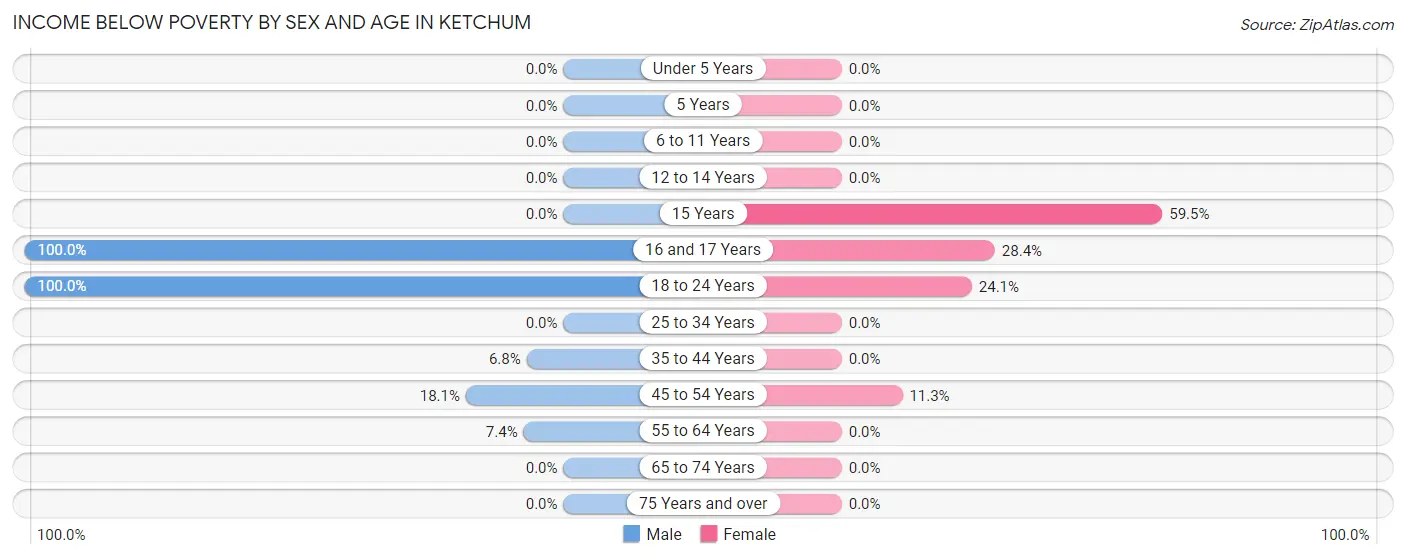
| Age Bracket | Male | Female |
| Under 5 Years | 0 (0.0%) | 0 (0.0%) |
| 5 Years | 0 (0.0%) | 0 (0.0%) |
| 6 to 11 Years | 0 (0.0%) | 0 (0.0%) |
| 12 to 14 Years | 0 (0.0%) | 0 (0.0%) |
| 15 Years | 0 (0.0%) | 47 (59.5%) |
| 16 and 17 Years | 27 (100.0%) | 27 (28.4%) |
| 18 to 24 Years | 76 (100.0%) | 35 (24.1%) |
| 25 to 34 Years | 0 (0.0%) | 0 (0.0%) |
| 35 to 44 Years | 17 (6.8%) | 0 (0.0%) |
| 45 to 54 Years | 44 (18.1%) | 33 (11.3%) |
| 55 to 64 Years | 25 (7.4%) | 0 (0.0%) |
| 65 to 74 Years | 0 (0.0%) | 0 (0.0%) |
| 75 Years and over | 0 (0.0%) | 0 (0.0%) |
| Total | 189 (11.2%) | 142 (8.0%) |
Income Above Poverty by Sex and Age in Ketchum
According to the poverty statistics in Ketchum, males aged under 5 years and females aged under 5 years are the age groups that are most secure financially, with 100.0% of males and 100.0% of females in these age groups living above the poverty line.
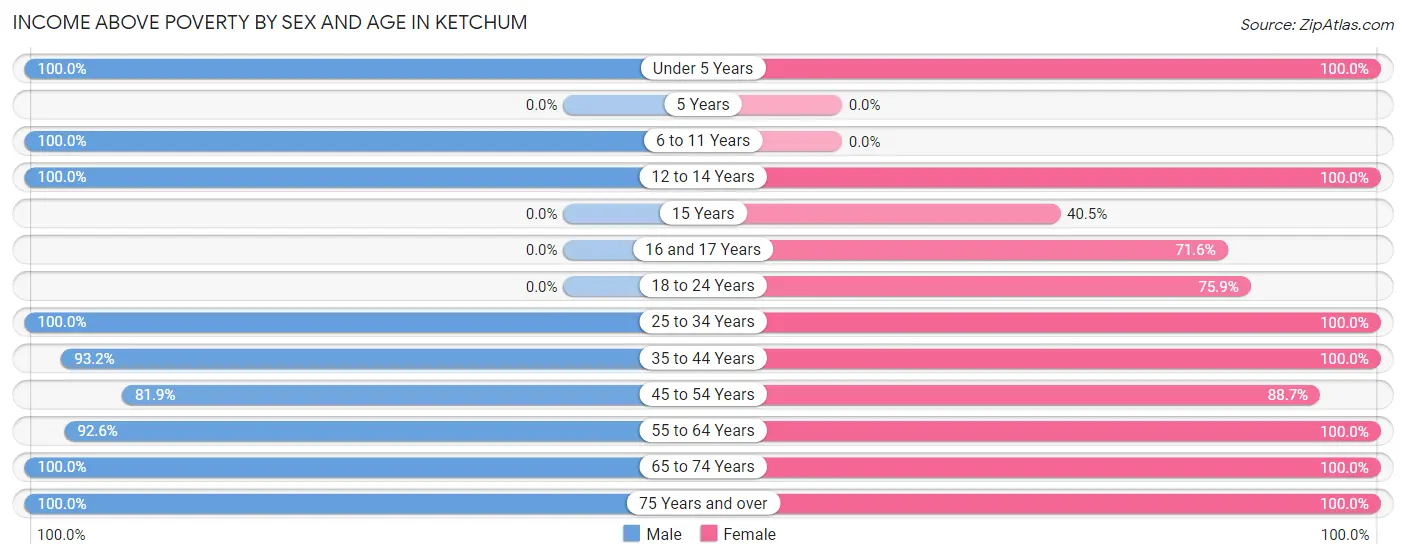
| Age Bracket | Male | Female |
| Under 5 Years | 60 (100.0%) | 14 (100.0%) |
| 5 Years | 0 (0.0%) | 0 (0.0%) |
| 6 to 11 Years | 54 (100.0%) | 0 (0.0%) |
| 12 to 14 Years | 21 (100.0%) | 14 (100.0%) |
| 15 Years | 0 (0.0%) | 32 (40.5%) |
| 16 and 17 Years | 0 (0.0%) | 68 (71.6%) |
| 18 to 24 Years | 0 (0.0%) | 110 (75.9%) |
| 25 to 34 Years | 205 (100.0%) | 318 (100.0%) |
| 35 to 44 Years | 232 (93.2%) | 21 (100.0%) |
| 45 to 54 Years | 199 (81.9%) | 260 (88.7%) |
| 55 to 64 Years | 313 (92.6%) | 432 (100.0%) |
| 65 to 74 Years | 290 (100.0%) | 199 (100.0%) |
| 75 Years and over | 132 (100.0%) | 175 (100.0%) |
| Total | 1,506 (88.8%) | 1,643 (92.0%) |
Income Below Poverty Among Married-Couple Families in Ketchum
The poverty statistics for married-couple families in Ketchum show that 4.1% or 34 of the total 832 families live below the poverty line. Families with 1 or 2 children have the highest poverty rate of 40.5%, comprising of 34 families. On the other hand, families with no children have the lowest poverty rate of 0.0%, which includes 0 families.
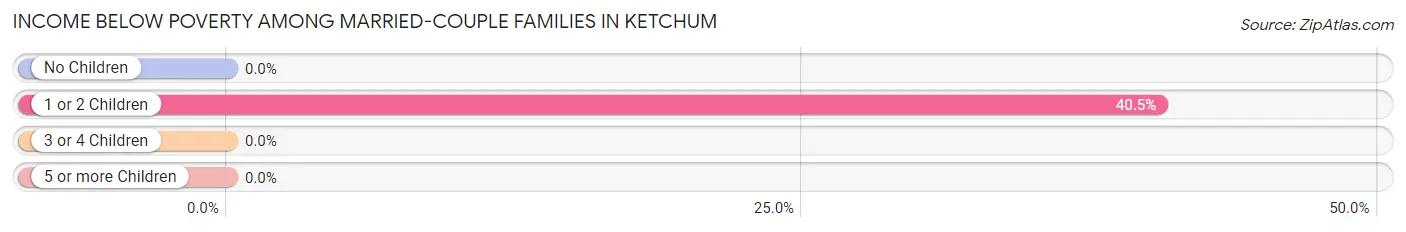
| Children | Above Poverty | Below Poverty |
| No Children | 704 (100.0%) | 0 (0.0%) |
| 1 or 2 Children | 50 (59.5%) | 34 (40.5%) |
| 3 or 4 Children | 44 (100.0%) | 0 (0.0%) |
| 5 or more Children | 0 (0.0%) | 0 (0.0%) |
| Total | 798 (95.9%) | 34 (4.1%) |
Income Below Poverty Among Single-Parent Households in Ketchum
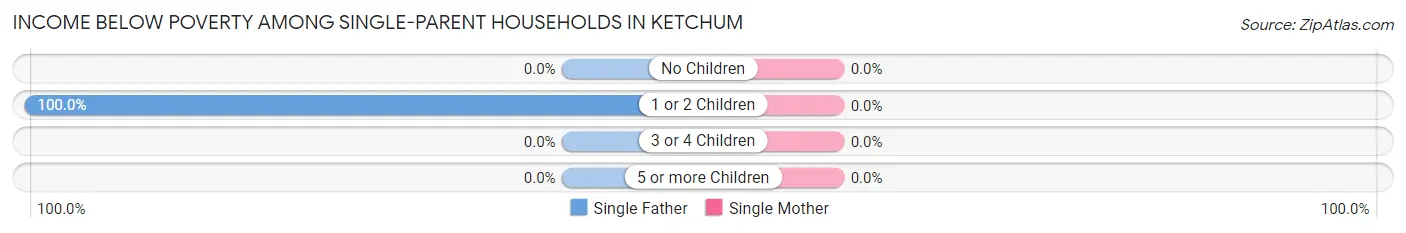
| Children | Single Father | Single Mother |
| No Children | 0 (0.0%) | 0 (0.0%) |
| 1 or 2 Children | 10 (100.0%) | 0 (0.0%) |
| 3 or 4 Children | 0 (0.0%) | 0 (0.0%) |
| 5 or more Children | 0 (0.0%) | 0 (0.0%) |
| Total | 10 (20.8%) | 0 (0.0%) |
Income Below Poverty Among Married-Couple vs Single-Parent Households in Ketchum
The poverty data for Ketchum shows that 34 of the married-couple family households (4.1%) and 10 of the single-parent households (8.6%) are living below the poverty level. Within the married-couple family households, those with 1 or 2 children have the highest poverty rate, with 34 households (40.5%) falling below the poverty line. Among the single-parent households, those with 1 or 2 children have the highest poverty rate, with 10 household (17.5%) living below poverty.
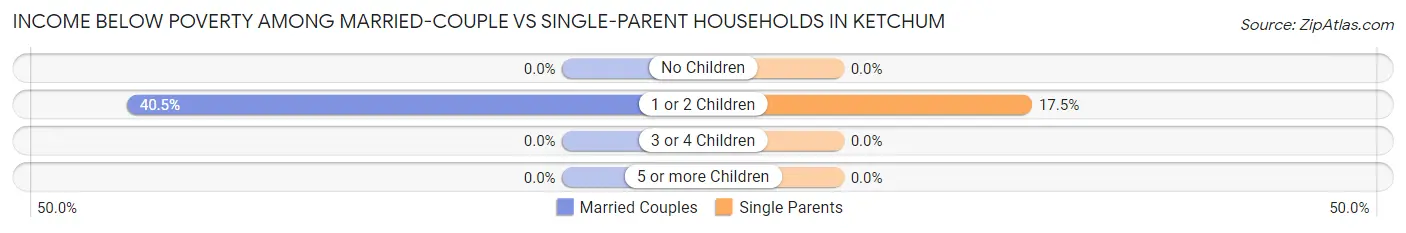
| Children | Married-Couple Families | Single-Parent Households |
| No Children | 0 (0.0%) | 0 (0.0%) |
| 1 or 2 Children | 34 (40.5%) | 10 (17.5%) |
| 3 or 4 Children | 0 (0.0%) | 0 (0.0%) |
| 5 or more Children | 0 (0.0%) | 0 (0.0%) |
| Total | 34 (4.1%) | 10 (8.6%) |
Race in Ketchum
The most populous races in Ketchum are White / Caucasian (3,261 | 93.4%), Hispanic or Latino (230 | 6.6%), and Some other Race (128 | 3.7%).
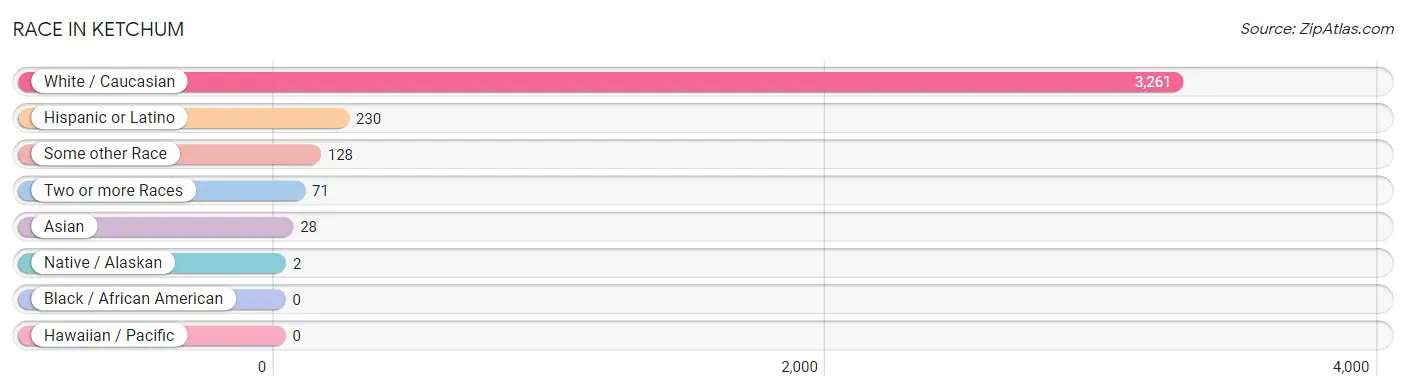
| Race | # Population | % Population |
| Asian | 28 | 0.8% |
| Black / African American | 0 | 0.0% |
| Hawaiian / Pacific | 0 | 0.0% |
| Hispanic or Latino | 230 | 6.6% |
| Native / Alaskan | 2 | 0.1% |
| White / Caucasian | 3,261 | 93.4% |
| Two or more Races | 71 | 2.0% |
| Some other Race | 128 | 3.7% |
| Total | 3,490 | 100.0% |
Ancestry in Ketchum
The most populous ancestries reported in Ketchum are German (408 | 11.7%), Scotch-Irish (309 | 8.8%), Norwegian (301 | 8.6%), English (289 | 8.3%), and Dutch (246 | 7.0%), together accounting for 44.5% of all Ketchum residents.
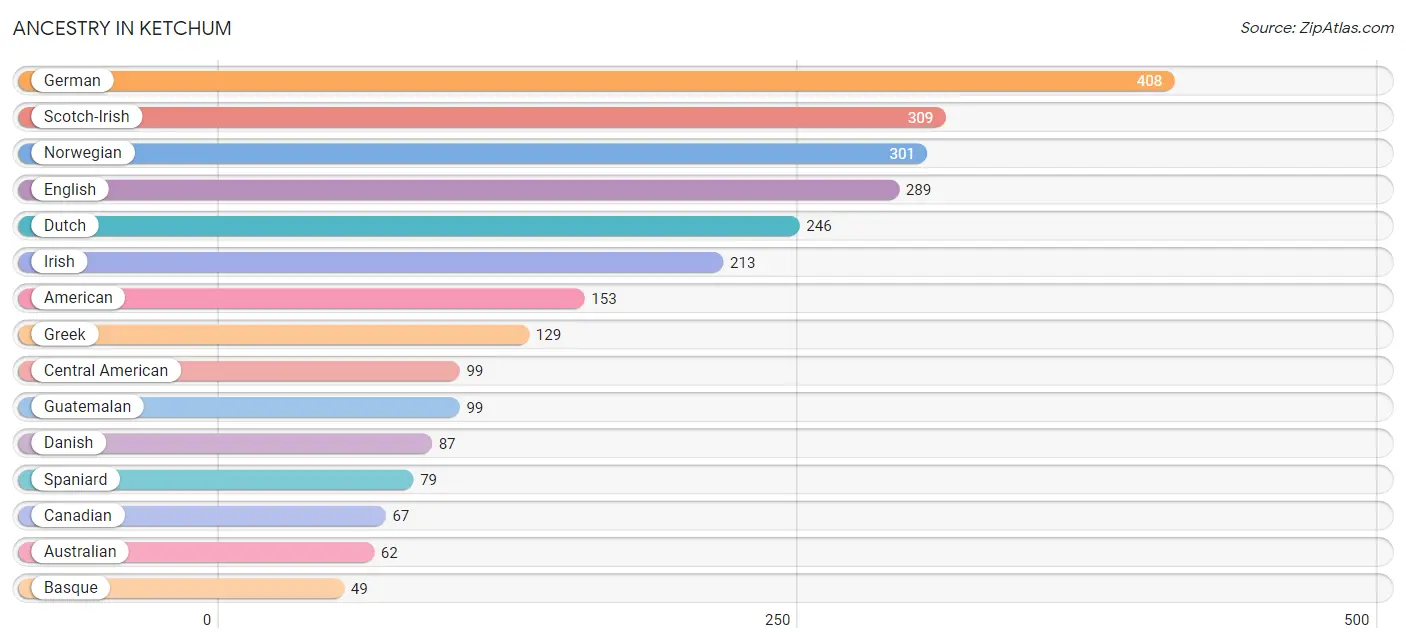
| Ancestry | # Population | % Population |
| American | 153 | 4.4% |
| Australian | 62 | 1.8% |
| Basque | 49 | 1.4% |
| Canadian | 67 | 1.9% |
| Central American | 99 | 2.8% |
| Danish | 87 | 2.5% |
| Dutch | 246 | 7.0% |
| English | 289 | 8.3% |
| European | 32 | 0.9% |
| French | 48 | 1.4% |
| German | 408 | 11.7% |
| Greek | 129 | 3.7% |
| Guatemalan | 99 | 2.8% |
| Indian (Asian) | 28 | 0.8% |
| Irish | 213 | 6.1% |
| Italian | 31 | 0.9% |
| Mexican | 31 | 0.9% |
| Norwegian | 301 | 8.6% |
| Peruvian | 21 | 0.6% |
| Scotch-Irish | 309 | 8.8% |
| South American | 21 | 0.6% |
| Spaniard | 79 | 2.3% |
| Swedish | 33 | 0.9% |
| Ukrainian | 15 | 0.4% | View All 24 Rows |
Immigrants in Ketchum
The most numerous immigrant groups reported in Ketchum came from Latin America (143 | 4.1%), Central America (122 | 3.5%), Canada (99 | 2.8%), Guatemala (99 | 2.8%), and Europe (34 | 1.0%), together accounting for 14.3% of all Ketchum residents.
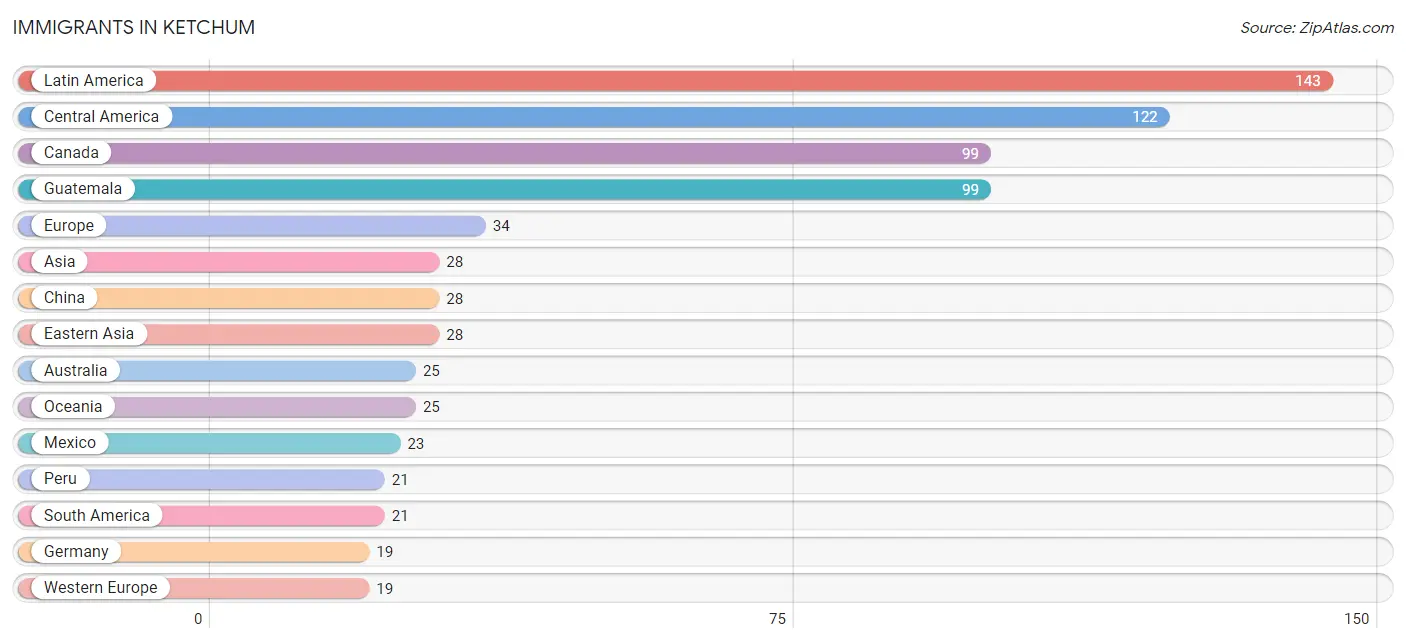
| Immigration Origin | # Population | % Population |
| Asia | 28 | 0.8% |
| Australia | 25 | 0.7% |
| Canada | 99 | 2.8% |
| Central America | 122 | 3.5% |
| China | 28 | 0.8% |
| Eastern Asia | 28 | 0.8% |
| Eastern Europe | 15 | 0.4% |
| Europe | 34 | 1.0% |
| Germany | 19 | 0.5% |
| Guatemala | 99 | 2.8% |
| Latin America | 143 | 4.1% |
| Mexico | 23 | 0.7% |
| Oceania | 25 | 0.7% |
| Peru | 21 | 0.6% |
| South America | 21 | 0.6% |
| Ukraine | 15 | 0.4% |
| Western Europe | 19 | 0.5% | View All 17 Rows |
Sex and Age in Ketchum
Sex and Age in Ketchum
The most populous age groups in Ketchum are 35 to 39 Years (230 | 13.5%) for men and 55 to 59 Years (365 | 20.4%) for women.
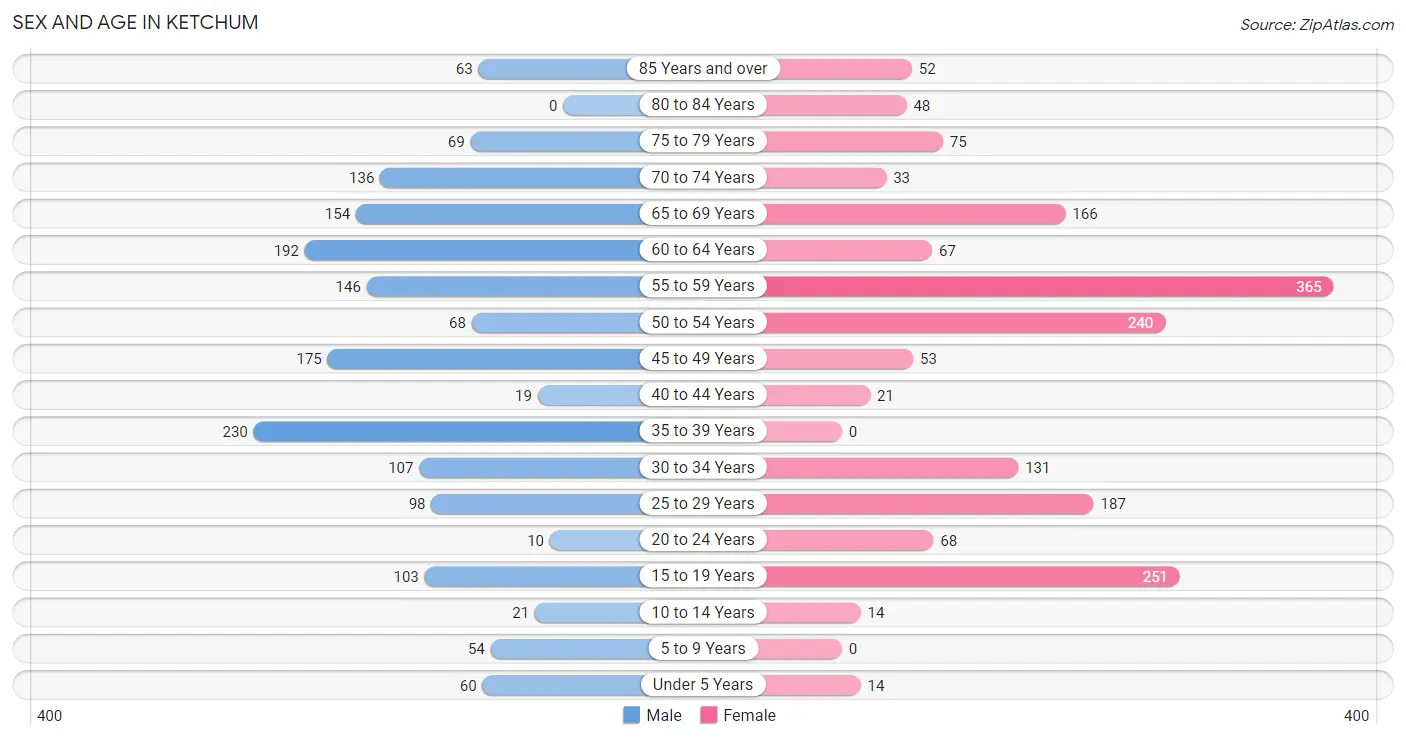
| Age Bracket | Male | Female |
| Under 5 Years | 60 (3.5%) | 14 (0.8%) |
| 5 to 9 Years | 54 (3.2%) | 0 (0.0%) |
| 10 to 14 Years | 21 (1.2%) | 14 (0.8%) |
| 15 to 19 Years | 103 (6.0%) | 251 (14.1%) |
| 20 to 24 Years | 10 (0.6%) | 68 (3.8%) |
| 25 to 29 Years | 98 (5.8%) | 187 (10.5%) |
| 30 to 34 Years | 107 (6.3%) | 131 (7.3%) |
| 35 to 39 Years | 230 (13.5%) | 0 (0.0%) |
| 40 to 44 Years | 19 (1.1%) | 21 (1.2%) |
| 45 to 49 Years | 175 (10.3%) | 53 (3.0%) |
| 50 to 54 Years | 68 (4.0%) | 240 (13.5%) |
| 55 to 59 Years | 146 (8.6%) | 365 (20.4%) |
| 60 to 64 Years | 192 (11.3%) | 67 (3.7%) |
| 65 to 69 Years | 154 (9.0%) | 166 (9.3%) |
| 70 to 74 Years | 136 (8.0%) | 33 (1.8%) |
| 75 to 79 Years | 69 (4.1%) | 75 (4.2%) |
| 80 to 84 Years | 0 (0.0%) | 48 (2.7%) |
| 85 Years and over | 63 (3.7%) | 52 (2.9%) |
| Total | 1,705 (100.0%) | 1,785 (100.0%) |
Families and Households in Ketchum
Median Family Size in Ketchum
The median family size in Ketchum is 2.52 persons per family, with single female/mother families (68 | 7.2%) accounting for the largest median family size of 4.57 persons per family. On the other hand, married-couple families (832 | 87.8%) represent the smallest median family size with 2.28 persons per family.
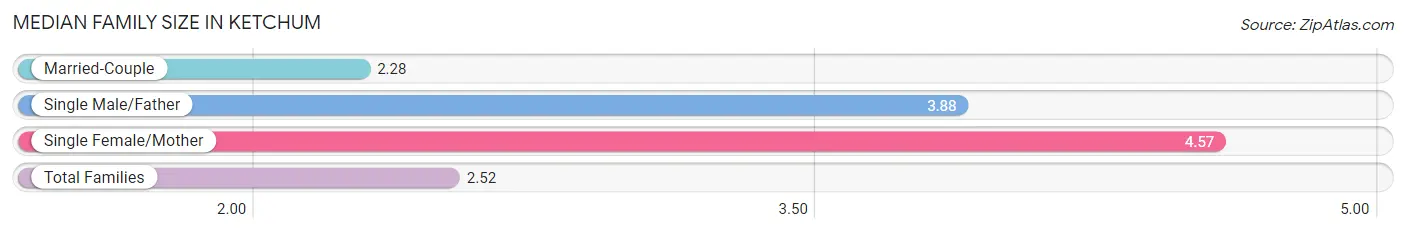
| Family Type | # Families | Family Size |
| Married-Couple | 832 (87.8%) | 2.28 |
| Single Male/Father | 48 (5.1%) | 3.88 |
| Single Female/Mother | 68 (7.2%) | 4.57 |
| Total Families | 948 (100.0%) | 2.52 |
Median Household Size in Ketchum
The median household size in Ketchum is 1.90 persons per household, with single female/mother households (68 | 3.7%) accounting for the largest median household size of 4.57 persons per household. non-family households (880 | 48.1%) represent the smallest median household size with 1.24 persons per household.
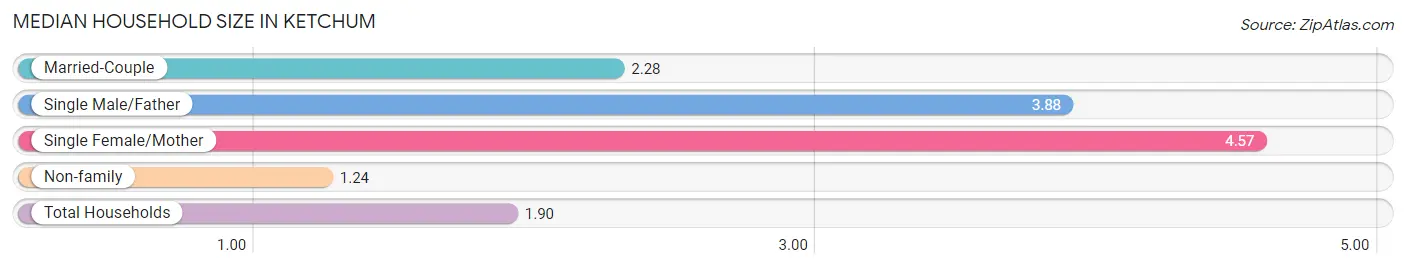
| Household Type | # Households | Household Size |
| Married-Couple | 832 (45.5%) | 2.28 |
| Single Male/Father | 48 (2.6%) | 3.88 |
| Single Female/Mother | 68 (3.7%) | 4.57 |
| Non-family | 880 (48.1%) | 1.24 |
| Total Households | 1,828 (100.0%) | 1.90 |
Household Size by Marriage Status in Ketchum
Out of a total of 1,828 households in Ketchum, 948 (51.9%) are family households, while 880 (48.1%) are nonfamily households. The most numerous type of family households are 2-person households, comprising 656, and the most common type of nonfamily households are 1-person households, comprising 798.
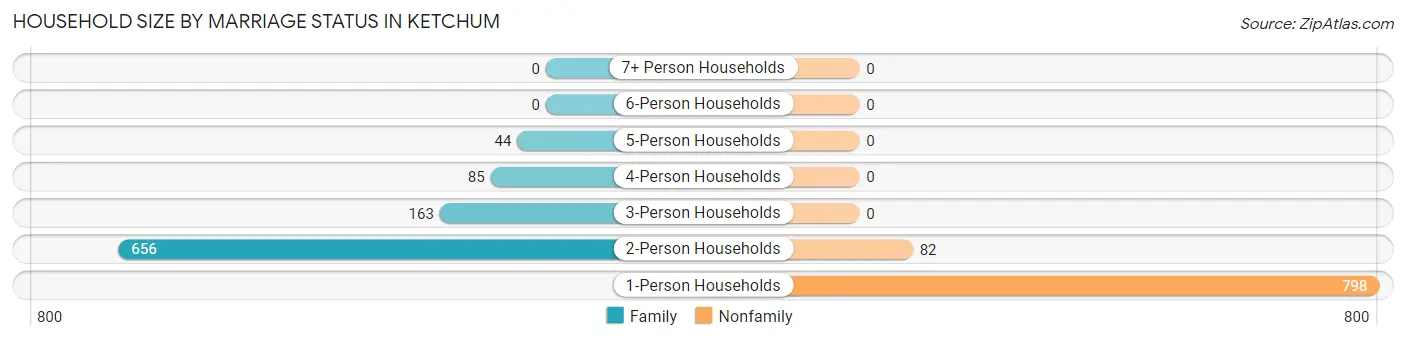
| Household Size | Family Households | Nonfamily Households |
| 1-Person Households | - | 798 (43.6%) |
| 2-Person Households | 656 (35.9%) | 82 (4.5%) |
| 3-Person Households | 163 (8.9%) | 0 (0.0%) |
| 4-Person Households | 85 (4.6%) | 0 (0.0%) |
| 5-Person Households | 44 (2.4%) | 0 (0.0%) |
| 6-Person Households | 0 (0.0%) | 0 (0.0%) |
| 7+ Person Households | 0 (0.0%) | 0 (0.0%) |
| Total | 948 (51.9%) | 880 (48.1%) |
Female Fertility in Ketchum
Fertility by Age in Ketchum
Average fertility rate in Ketchum is 61.0 births per 1,000 women. Women in the age bracket of 15 to 19 years have the highest fertility rate with 187.0 births per 1,000 women. Women in the age bracket of 15 to 19 years acount for 100.0% of all women with births.
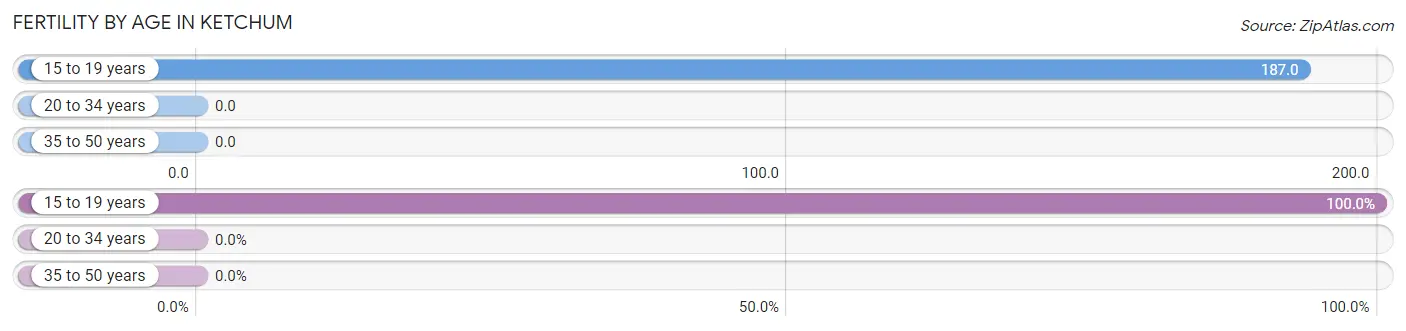
| Age Bracket | Women with Births | Births / 1,000 Women |
| 15 to 19 years | 47 (100.0%) | 187.0 |
| 20 to 34 years | 0 (0.0%) | 0.0 |
| 35 to 50 years | 0 (0.0%) | 0.0 |
| Total | 47 (100.0%) | 61.0 |
Fertility by Age by Marriage Status in Ketchum
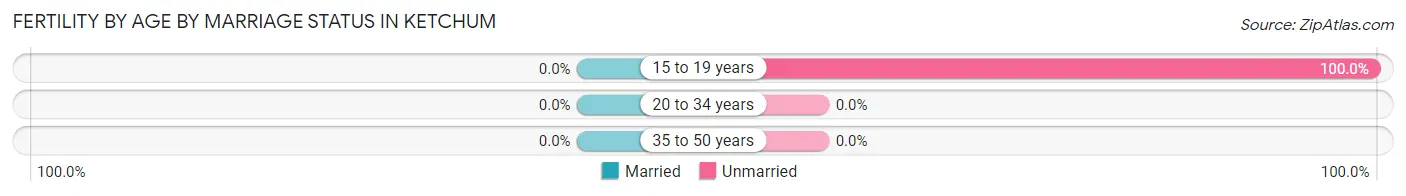
| Age Bracket | Married | Unmarried |
| 15 to 19 years | 0 (0.0%) | 47 (100.0%) |
| 20 to 34 years | 0 (0.0%) | 0 (0.0%) |
| 35 to 50 years | 0 (0.0%) | 0 (0.0%) |
| Total | 0 (0.0%) | 47 (100.0%) |
Fertility by Education in Ketchum
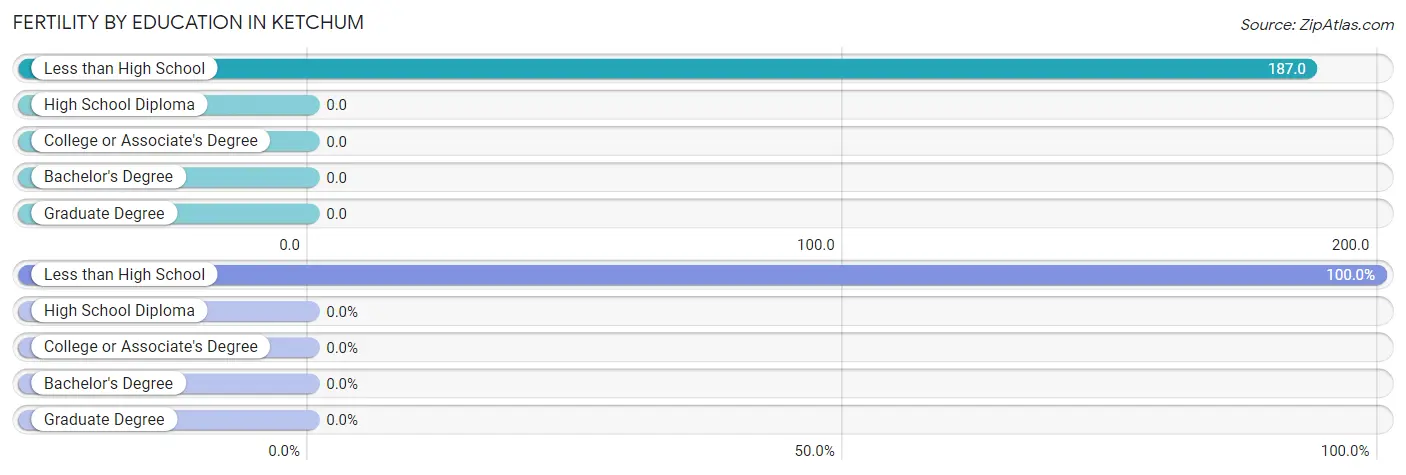
| Educational Attainment | Women with Births | Births / 1,000 Women |
| Less than High School | 47 (100.0%) | 187.0 |
| High School Diploma | 0 (0.0%) | 0.0 |
| College or Associate's Degree | 0 (0.0%) | 0.0 |
| Bachelor's Degree | 0 (0.0%) | 0.0 |
| Graduate Degree | 0 (0.0%) | 0.0 |
| Total | 47 (100.0%) | 61.0 |
Fertility by Education by Marriage Status in Ketchum

| Educational Attainment | Married | Unmarried |
| Less than High School | 0 (0.0%) | 47 (100.0%) |
| High School Diploma | 0 (0.0%) | 0 (0.0%) |
| College or Associate's Degree | 0 (0.0%) | 0 (0.0%) |
| Bachelor's Degree | 0 (0.0%) | 0 (0.0%) |
| Graduate Degree | 0 (0.0%) | 0 (0.0%) |
| Total | 0 (0.0%) | 47 (100.0%) |
Employment Characteristics in Ketchum
Employment by Class of Employer in Ketchum
Among the 2,209 employed individuals in Ketchum, private company employees (1,449 | 65.6%), self-employed (not incorporated) (209 | 9.5%), and self-employed (incorporated) (200 | 9.0%) make up the most common classes of employment.
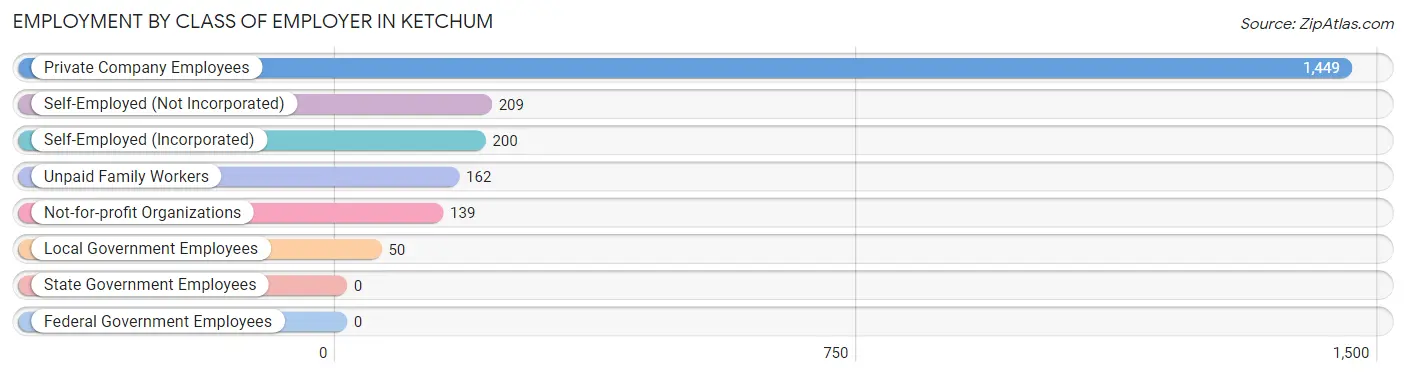
| Employer Class | # Employees | % Employees |
| Private Company Employees | 1,449 | 65.6% |
| Self-Employed (Incorporated) | 200 | 9.0% |
| Self-Employed (Not Incorporated) | 209 | 9.5% |
| Not-for-profit Organizations | 139 | 6.3% |
| Local Government Employees | 50 | 2.3% |
| State Government Employees | 0 | 0.0% |
| Federal Government Employees | 0 | 0.0% |
| Unpaid Family Workers | 162 | 7.3% |
| Total | 2,209 | 100.0% |
Employment Status by Age in Ketchum
According to the labor force statistics for Ketchum, out of the total population over 16 years of age (3,248), 71.5% or 2,322 individuals are in the labor force, with 0.9% or 21 of them unemployed. The age group with the highest labor force participation rate is 20 to 24 years, with 100.0% or 78 individuals in the labor force. Within the labor force, the 45 to 54 years age range has the highest percentage of unemployed individuals, with 4.4% or 22 of them being unemployed.
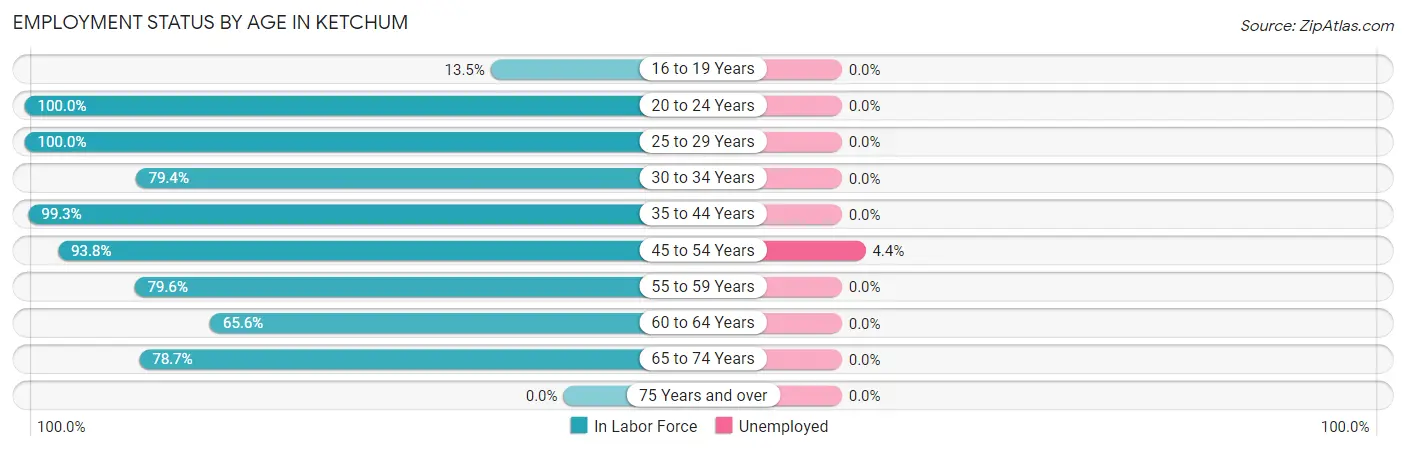
| Age Bracket | In Labor Force | Unemployed |
| 16 to 19 Years | 37 (13.5%) | 0 (0.0%) |
| 20 to 24 Years | 78 (100.0%) | 0 (0.0%) |
| 25 to 29 Years | 285 (100.0%) | 0 (0.0%) |
| 30 to 34 Years | 189 (79.4%) | 0 (0.0%) |
| 35 to 44 Years | 268 (99.3%) | 0 (0.0%) |
| 45 to 54 Years | 503 (93.8%) | 22 (4.4%) |
| 55 to 59 Years | 407 (79.6%) | 0 (0.0%) |
| 60 to 64 Years | 170 (65.6%) | 0 (0.0%) |
| 65 to 74 Years | 385 (78.7%) | 0 (0.0%) |
| 75 Years and over | 0 (0.0%) | 0 (0.0%) |
| Total | 2,322 (71.5%) | 21 (0.9%) |
Employment Status by Educational Attainment in Ketchum
According to labor force statistics for Ketchum, 86.8% of individuals (1,822) out of the total population between 25 and 64 years of age (2,099) are in the labor force, with 1.2% or 22 of them being unemployed. The group with the highest labor force participation rate are those with the educational attainment of less than high school, with 93.9% or 31 individuals in the labor force. Within the labor force, individuals with college / associate degree education have the highest percentage of unemployment, with 5.0% or 22 of them being unemployed.
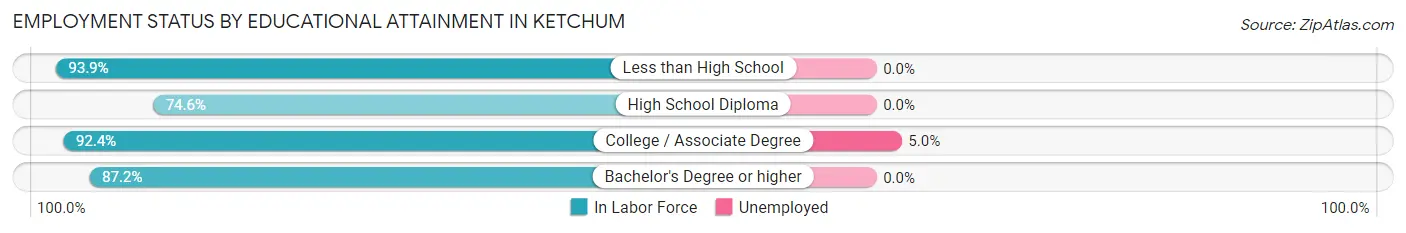
| Educational Attainment | In Labor Force | Unemployed |
| Less than High School | 31 (93.9%) | 0 (0.0%) |
| High School Diploma | 208 (74.6%) | 0 (0.0%) |
| College / Associate Degree | 440 (92.4%) | 24 (5.0%) |
| Bachelor's Degree or higher | 1,143 (87.2%) | 0 (0.0%) |
| Total | 1,822 (86.8%) | 25 (1.2%) |
Employment Occupations by Sex in Ketchum
Management, Business, Science and Arts Occupations
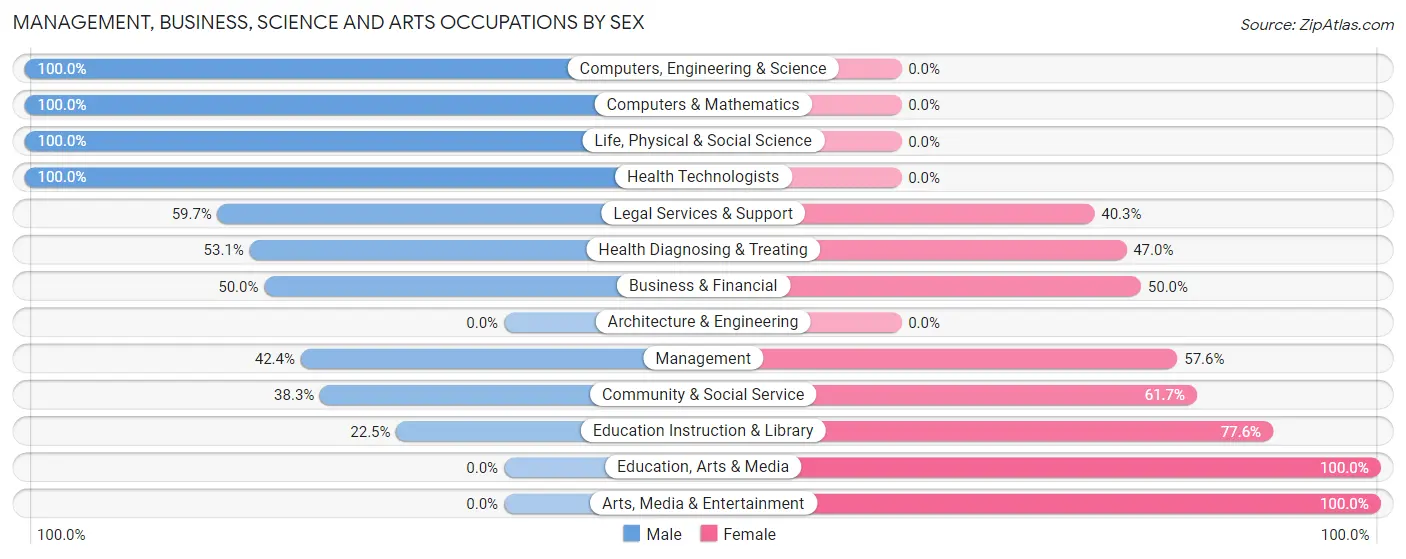
The most common Management, Business, Science and Arts occupations in Ketchum are Management (335 | 14.6%), Community & Social Service (253 | 11.0%), Health Diagnosing & Treating (213 | 9.3%), Legal Services & Support (144 | 6.3%), and Health Technologists (113 | 4.9%).
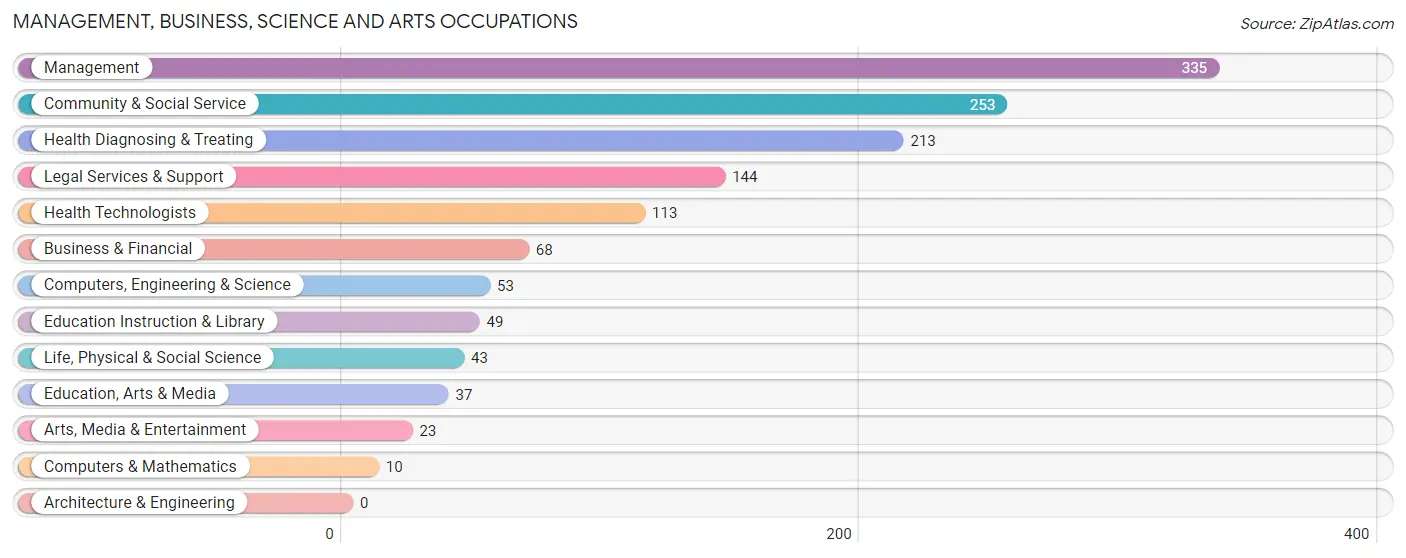
Management, Business, Science and Arts Occupations by Sex
Within the Management, Business, Science and Arts occupations in Ketchum, the most male-oriented occupations are Computers, Engineering & Science (100.0%), Computers & Mathematics (100.0%), and Life, Physical & Social Science (100.0%), while the most female-oriented occupations are Education, Arts & Media (100.0%), Arts, Media & Entertainment (100.0%), and Education Instruction & Library (77.5%).
| Occupation | Male | Female |
| Management | 142 (42.4%) | 193 (57.6%) |
| Business & Financial | 34 (50.0%) | 34 (50.0%) |
| Computers, Engineering & Science | 53 (100.0%) | 0 (0.0%) |
| Computers & Mathematics | 10 (100.0%) | 0 (0.0%) |
| Architecture & Engineering | 0 (0.0%) | 0 (0.0%) |
| Life, Physical & Social Science | 43 (100.0%) | 0 (0.0%) |
| Community & Social Service | 97 (38.3%) | 156 (61.7%) |
| Education, Arts & Media | 0 (0.0%) | 37 (100.0%) |
| Legal Services & Support | 86 (59.7%) | 58 (40.3%) |
| Education Instruction & Library | 11 (22.5%) | 38 (77.5%) |
| Arts, Media & Entertainment | 0 (0.0%) | 23 (100.0%) |
| Health Diagnosing & Treating | 113 (53.0%) | 100 (46.9%) |
| Health Technologists | 113 (100.0%) | 0 (0.0%) |
| Total (Category) | 439 (47.6%) | 483 (52.4%) |
| Total (Overall) | 1,188 (51.6%) | 1,112 (48.3%) |
Services Occupations
The most common Services occupations in Ketchum are Food Preparation & Serving (111 | 4.8%), Healthcare Support (92 | 4.0%), Personal Care & Service (28 | 1.2%), Security & Protection (23 | 1.0%), and Firefighting & Prevention (23 | 1.0%).
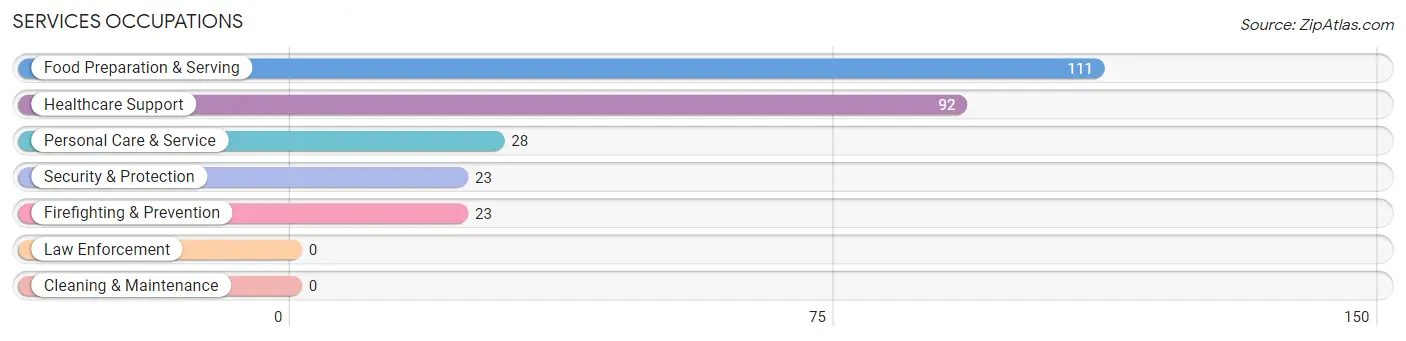
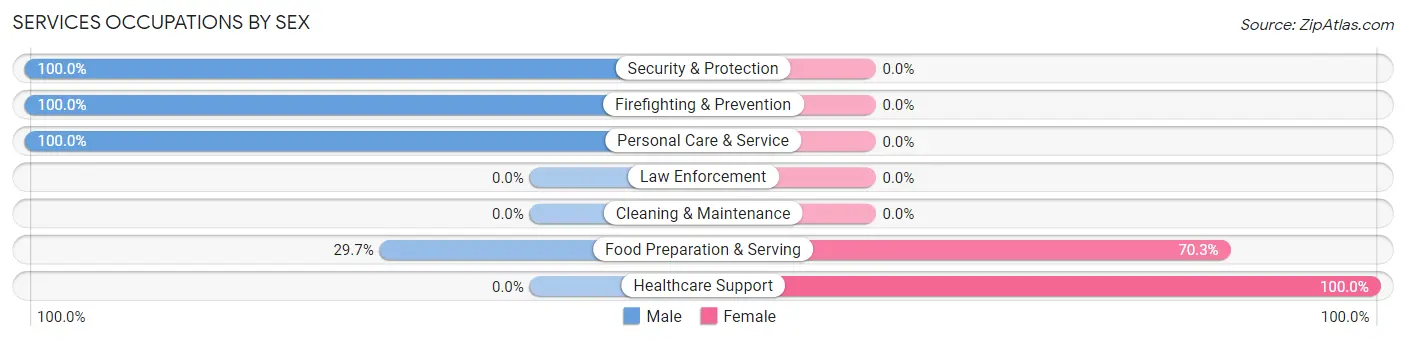
Services Occupations by Sex
Within the Services occupations in Ketchum, the most male-oriented occupations are Security & Protection (100.0%), Firefighting & Prevention (100.0%), and Personal Care & Service (100.0%), while the most female-oriented occupations are Healthcare Support (100.0%), and Food Preparation & Serving (70.3%).
| Occupation | Male | Female |
| Healthcare Support | 0 (0.0%) | 92 (100.0%) |
| Security & Protection | 23 (100.0%) | 0 (0.0%) |
| Firefighting & Prevention | 23 (100.0%) | 0 (0.0%) |
| Law Enforcement | 0 (0.0%) | 0 (0.0%) |
| Food Preparation & Serving | 33 (29.7%) | 78 (70.3%) |
| Cleaning & Maintenance | 0 (0.0%) | 0 (0.0%) |
| Personal Care & Service | 28 (100.0%) | 0 (0.0%) |
| Total (Category) | 84 (33.1%) | 170 (66.9%) |
| Total (Overall) | 1,188 (51.6%) | 1,112 (48.3%) |
Sales and Office Occupations
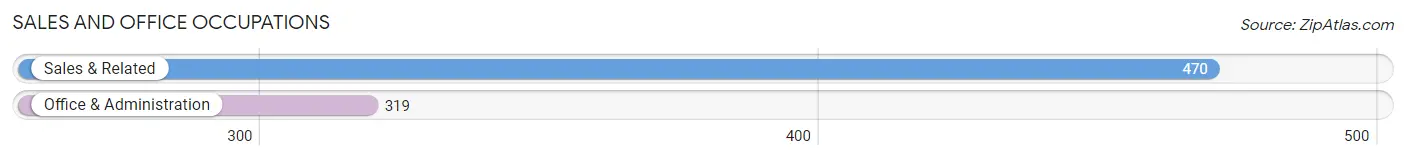
The most common Sales and Office occupations in Ketchum are Sales & Related (470 | 20.4%), and Office & Administration (319 | 13.9%).
Sales and Office Occupations by Sex
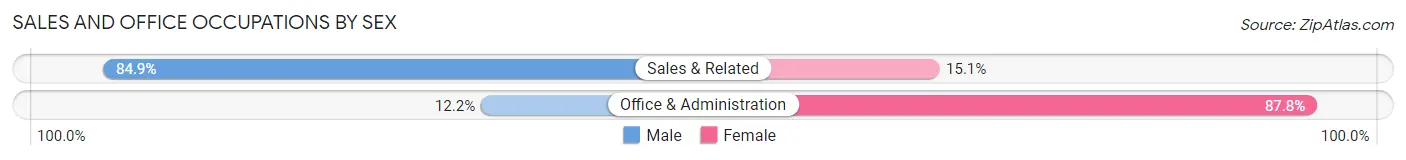
| Occupation | Male | Female |
| Sales & Related | 399 (84.9%) | 71 (15.1%) |
| Office & Administration | 39 (12.2%) | 280 (87.8%) |
| Total (Category) | 438 (55.5%) | 351 (44.5%) |
| Total (Overall) | 1,188 (51.6%) | 1,112 (48.3%) |
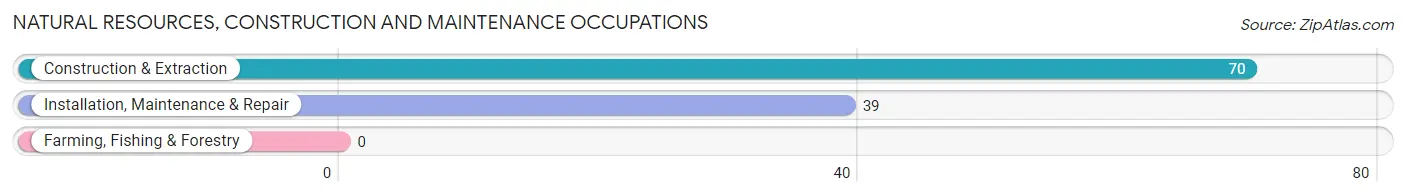
Natural Resources, Construction and Maintenance Occupations
The most common Natural Resources, Construction and Maintenance occupations in Ketchum are Construction & Extraction (70 | 3.0%), and Installation, Maintenance & Repair (39 | 1.7%).
Natural Resources, Construction and Maintenance Occupations by Sex
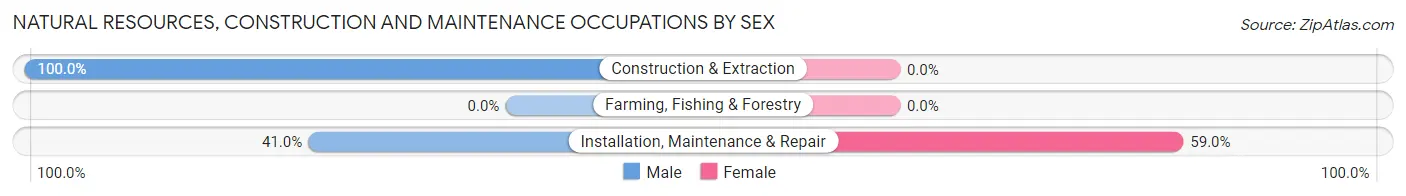
| Occupation | Male | Female |
| Farming, Fishing & Forestry | 0 (0.0%) | 0 (0.0%) |
| Construction & Extraction | 70 (100.0%) | 0 (0.0%) |
| Installation, Maintenance & Repair | 16 (41.0%) | 23 (59.0%) |
| Total (Category) | 86 (78.9%) | 23 (21.1%) |
| Total (Overall) | 1,188 (51.6%) | 1,112 (48.3%) |
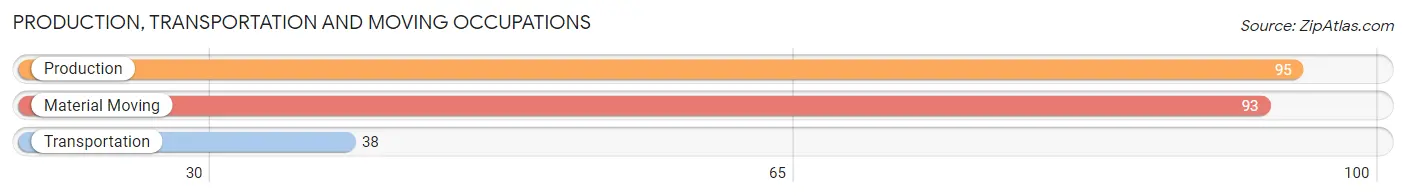
Production, Transportation and Moving Occupations
The most common Production, Transportation and Moving occupations in Ketchum are Production (95 | 4.1%), Material Moving (93 | 4.0%), and Transportation (38 | 1.7%).
Production, Transportation and Moving Occupations by Sex
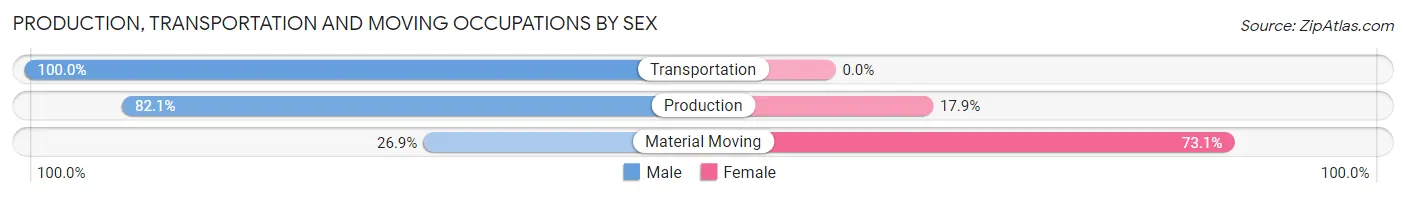
| Occupation | Male | Female |
| Production | 78 (82.1%) | 17 (17.9%) |
| Transportation | 38 (100.0%) | 0 (0.0%) |
| Material Moving | 25 (26.9%) | 68 (73.1%) |
| Total (Category) | 141 (62.4%) | 85 (37.6%) |
| Total (Overall) | 1,188 (51.6%) | 1,112 (48.3%) |
Employment Industries by Sex in Ketchum
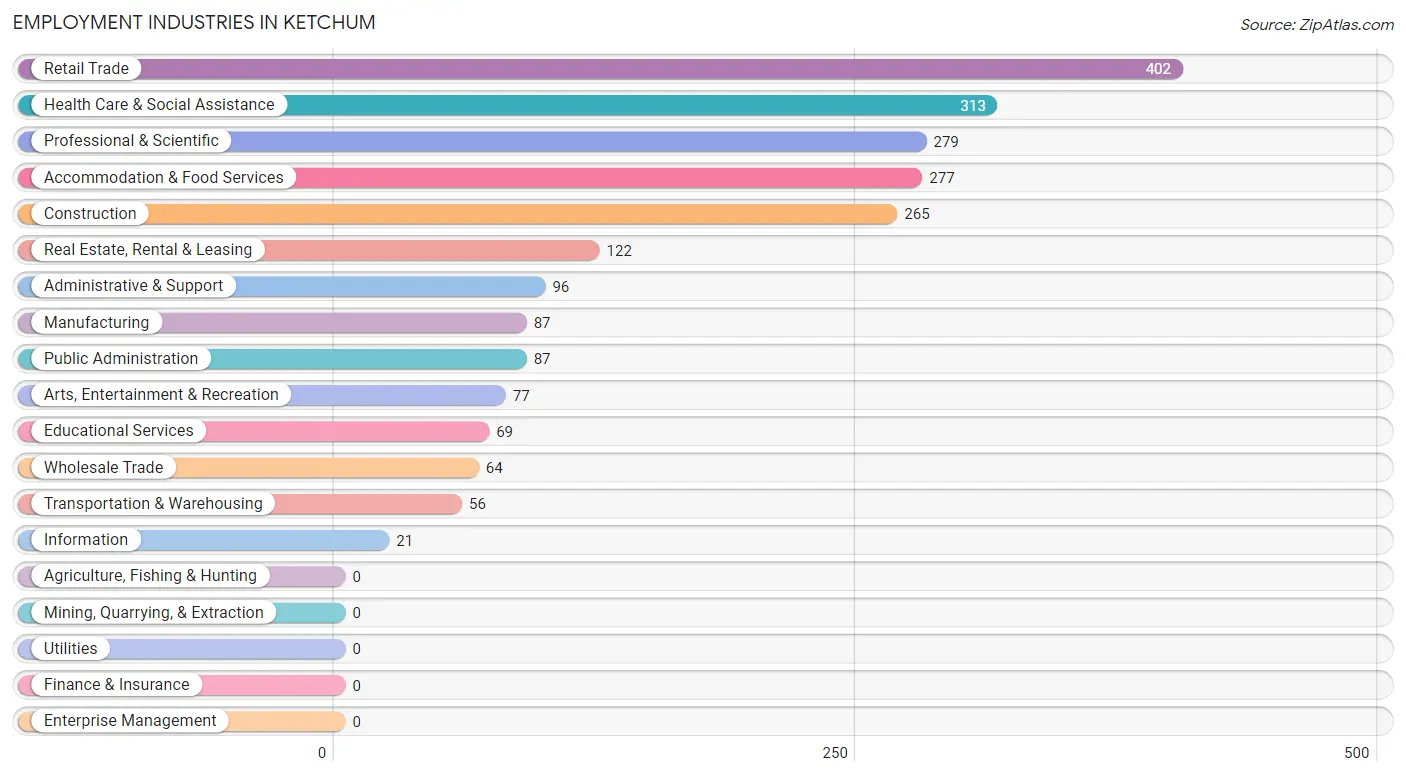
Employment Industries in Ketchum
The major employment industries in Ketchum include Retail Trade (402 | 17.5%), Health Care & Social Assistance (313 | 13.6%), Professional & Scientific (279 | 12.1%), Accommodation & Food Services (277 | 12.0%), and Construction (265 | 11.5%).
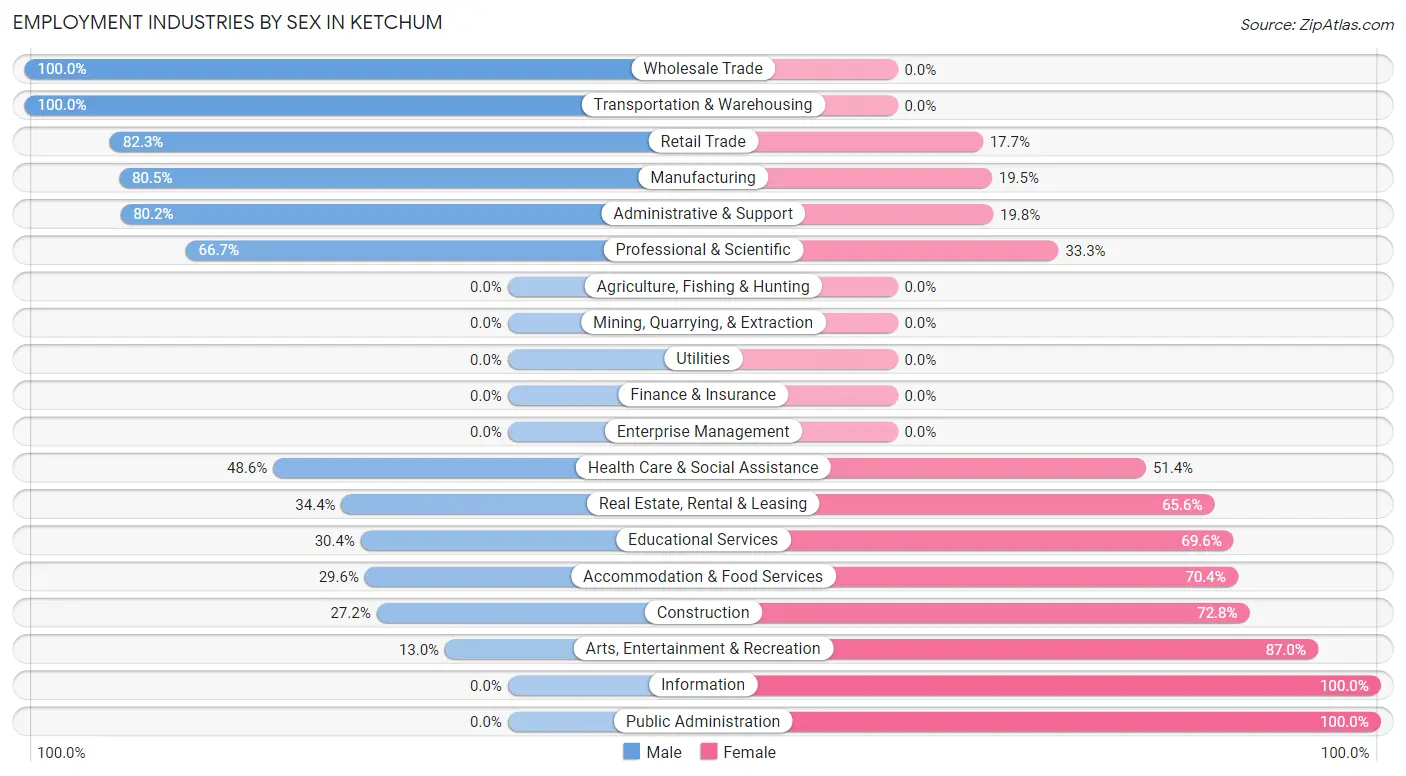
Employment Industries by Sex in Ketchum
The Ketchum industries that see more men than women are Wholesale Trade (100.0%), Transportation & Warehousing (100.0%), and Retail Trade (82.3%), whereas the industries that tend to have a higher number of women are Information (100.0%), Public Administration (100.0%), and Arts, Entertainment & Recreation (87.0%).
| Industry | Male | Female |
| Agriculture, Fishing & Hunting | 0 (0.0%) | 0 (0.0%) |
| Mining, Quarrying, & Extraction | 0 (0.0%) | 0 (0.0%) |
| Construction | 72 (27.2%) | 193 (72.8%) |
| Manufacturing | 70 (80.5%) | 17 (19.5%) |
| Wholesale Trade | 64 (100.0%) | 0 (0.0%) |
| Retail Trade | 331 (82.3%) | 71 (17.7%) |
| Transportation & Warehousing | 56 (100.0%) | 0 (0.0%) |
| Utilities | 0 (0.0%) | 0 (0.0%) |
| Information | 0 (0.0%) | 21 (100.0%) |
| Finance & Insurance | 0 (0.0%) | 0 (0.0%) |
| Real Estate, Rental & Leasing | 42 (34.4%) | 80 (65.6%) |
| Professional & Scientific | 186 (66.7%) | 93 (33.3%) |
| Enterprise Management | 0 (0.0%) | 0 (0.0%) |
| Administrative & Support | 77 (80.2%) | 19 (19.8%) |
| Educational Services | 21 (30.4%) | 48 (69.6%) |
| Health Care & Social Assistance | 152 (48.6%) | 161 (51.4%) |
| Arts, Entertainment & Recreation | 10 (13.0%) | 67 (87.0%) |
| Accommodation & Food Services | 82 (29.6%) | 195 (70.4%) |
| Public Administration | 0 (0.0%) | 87 (100.0%) |
| Total | 1,188 (51.6%) | 1,112 (48.3%) |
Education in Ketchum
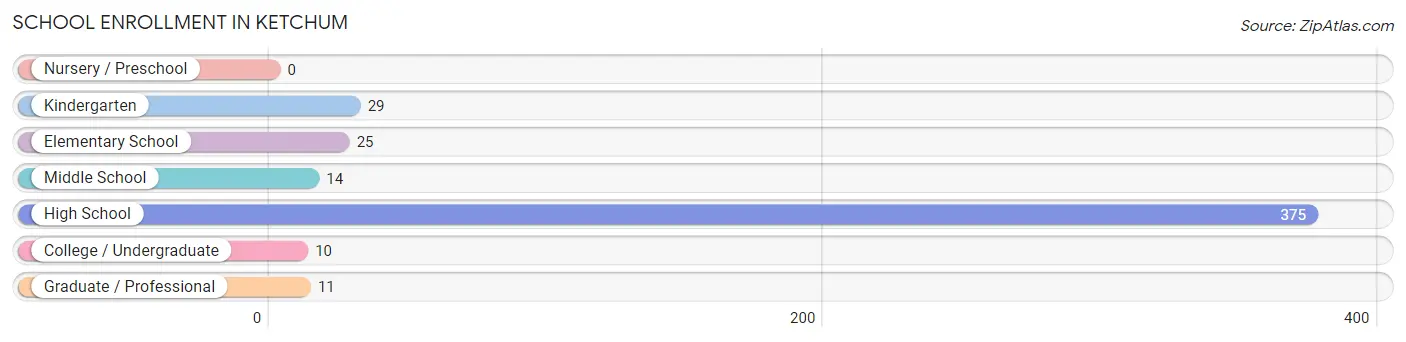
School Enrollment in Ketchum
The most common levels of schooling among the 464 students in Ketchum are high school (375 | 80.8%), kindergarten (29 | 6.2%), and elementary school (25 | 5.4%).
| School Level | # Students | % Students |
| Nursery / Preschool | 0 | 0.0% |
| Kindergarten | 29 | 6.2% |
| Elementary School | 25 | 5.4% |
| Middle School | 14 | 3.0% |
| High School | 375 | 80.8% |
| College / Undergraduate | 10 | 2.2% |
| Graduate / Professional | 11 | 2.4% |
| Total | 464 | 100.0% |
School Enrollment by Age by Funding Source in Ketchum
Out of a total of 464 students who are enrolled in schools in Ketchum, 305 (65.7%) attend a private institution, while the remaining 159 (34.3%) are enrolled in public schools. The age group of 25 to 34 year olds has the highest likelihood of being enrolled in private schools, with 11 (100.0% in the age bracket) enrolled. Conversely, the age group of 10 to 14 year olds has the lowest likelihood of being enrolled in a private school, with 35 (100.0% in the age bracket) attending a public institution.
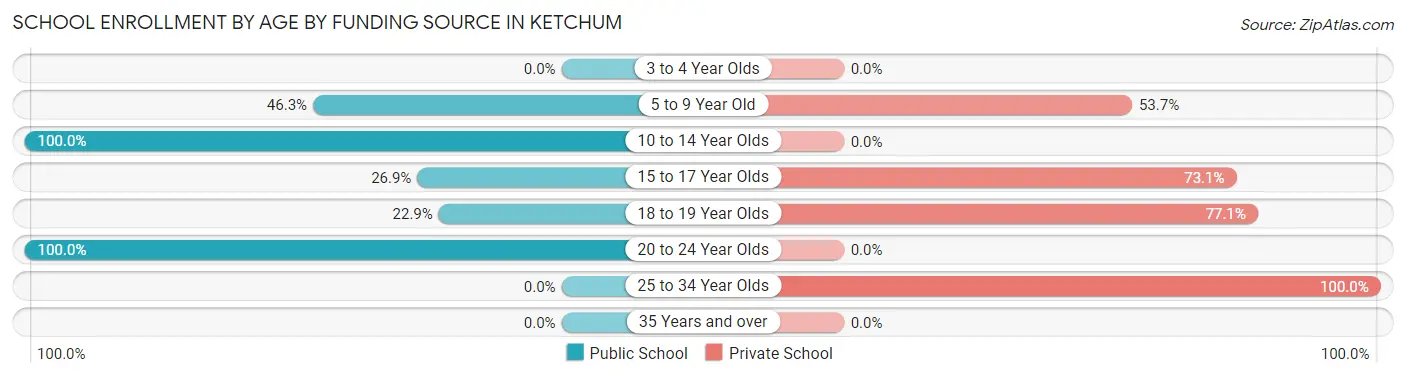
| Age Bracket | Public School | Private School |
| 3 to 4 Year Olds | 0 (0.0%) | 0 (0.0%) |
| 5 to 9 Year Old | 25 (46.3%) | 29 (53.7%) |
| 10 to 14 Year Olds | 35 (100.0%) | 0 (0.0%) |
| 15 to 17 Year Olds | 54 (26.9%) | 147 (73.1%) |
| 18 to 19 Year Olds | 35 (22.9%) | 118 (77.1%) |
| 20 to 24 Year Olds | 10 (100.0%) | 0 (0.0%) |
| 25 to 34 Year Olds | 0 (0.0%) | 11 (100.0%) |
| 35 Years and over | 0 (0.0%) | 0 (0.0%) |
| Total | 159 (34.3%) | 305 (65.7%) |
Educational Attainment by Field of Study in Ketchum
Visual & performing arts (299 | 16.2%), business (225 | 12.2%), bio, nature & agricultural (203 | 11.0%), liberal arts & history (179 | 9.7%), and education (162 | 8.8%) are the most common fields of study among 1,843 individuals in Ketchum who have obtained a bachelor's degree or higher.
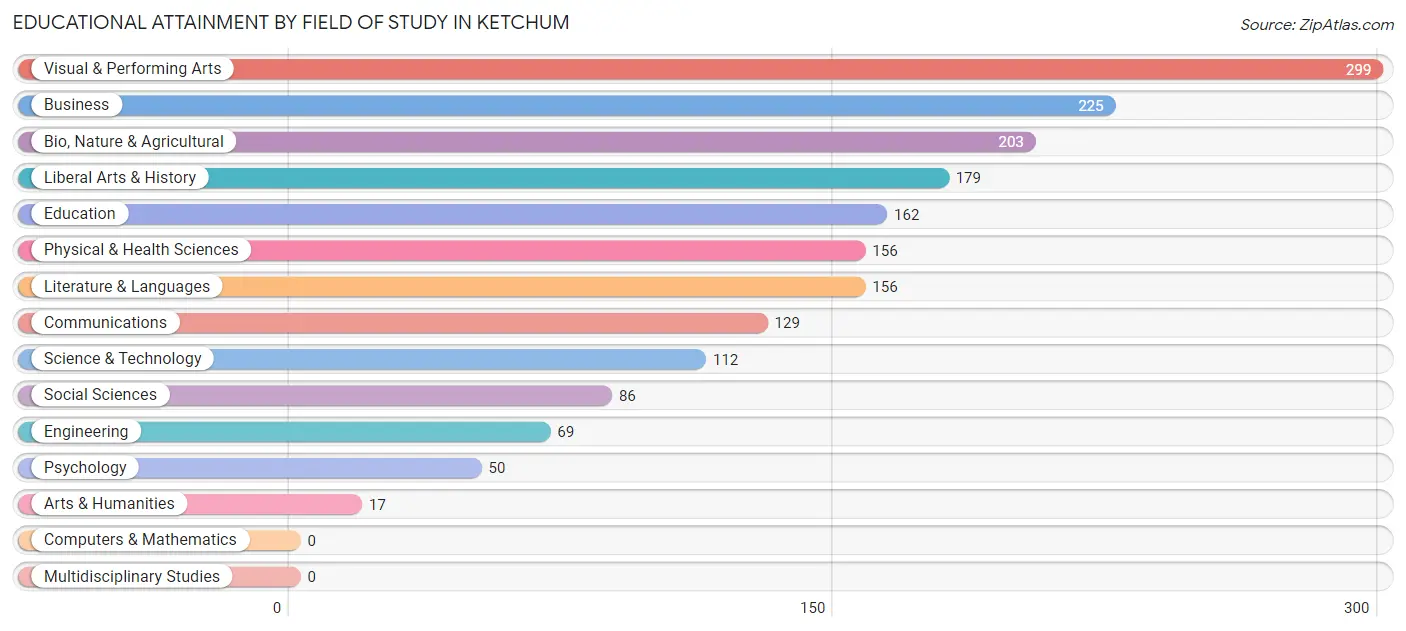
| Field of Study | # Graduates | % Graduates |
| Computers & Mathematics | 0 | 0.0% |
| Bio, Nature & Agricultural | 203 | 11.0% |
| Physical & Health Sciences | 156 | 8.5% |
| Psychology | 50 | 2.7% |
| Social Sciences | 86 | 4.7% |
| Engineering | 69 | 3.7% |
| Multidisciplinary Studies | 0 | 0.0% |
| Science & Technology | 112 | 6.1% |
| Business | 225 | 12.2% |
| Education | 162 | 8.8% |
| Literature & Languages | 156 | 8.5% |
| Liberal Arts & History | 179 | 9.7% |
| Visual & Performing Arts | 299 | 16.2% |
| Communications | 129 | 7.0% |
| Arts & Humanities | 17 | 0.9% |
| Total | 1,843 | 100.0% |
Transportation & Commute in Ketchum
Vehicle Availability by Sex in Ketchum
The most prevalent vehicle ownership categories in Ketchum are males with 2 vehicles (446, accounting for 38.6%) and females with 2 vehicles (549, making up 42.7%).
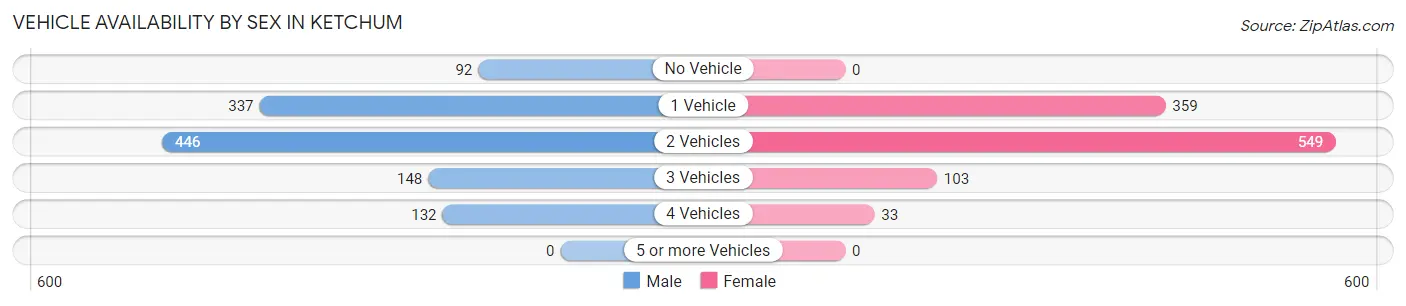
| Vehicles Available | Male | Female |
| No Vehicle | 92 (8.0%) | 0 (0.0%) |
| 1 Vehicle | 337 (29.2%) | 359 (34.4%) |
| 2 Vehicles | 446 (38.6%) | 549 (52.6%) |
| 3 Vehicles | 148 (12.8%) | 103 (9.9%) |
| 4 Vehicles | 132 (11.4%) | 33 (3.2%) |
| 5 or more Vehicles | 0 (0.0%) | 0 (0.0%) |
| Total | 1,155 (100.0%) | 1,044 (100.0%) |
Commute Time in Ketchum
The most frequently occuring commute durations in Ketchum are 5 to 9 minutes (710 commuters, 37.7%), 10 to 14 minutes (397 commuters, 21.1%), and less than 5 minutes (335 commuters, 17.8%).
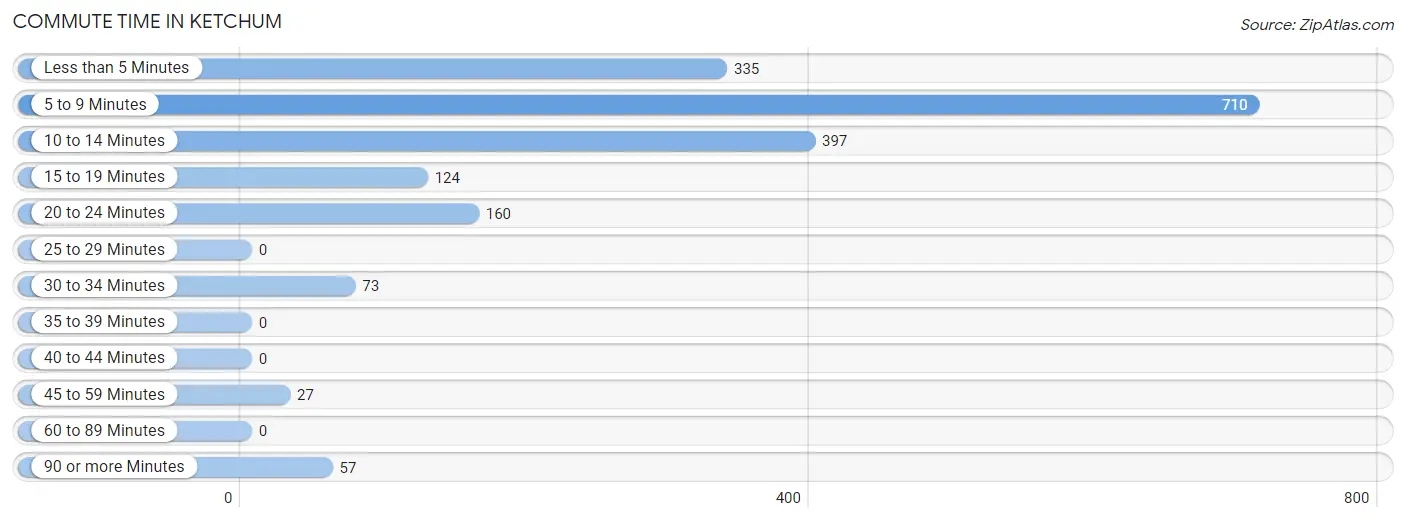
| Commute Time | # Commuters | % Commuters |
| Less than 5 Minutes | 335 | 17.8% |
| 5 to 9 Minutes | 710 | 37.7% |
| 10 to 14 Minutes | 397 | 21.1% |
| 15 to 19 Minutes | 124 | 6.6% |
| 20 to 24 Minutes | 160 | 8.5% |
| 25 to 29 Minutes | 0 | 0.0% |
| 30 to 34 Minutes | 73 | 3.9% |
| 35 to 39 Minutes | 0 | 0.0% |
| 40 to 44 Minutes | 0 | 0.0% |
| 45 to 59 Minutes | 27 | 1.4% |
| 60 to 89 Minutes | 0 | 0.0% |
| 90 or more Minutes | 57 | 3.0% |
Commute Time by Sex in Ketchum
The most common commute times in Ketchum are 5 to 9 minutes (385 commuters, 42.0%) for males and 5 to 9 minutes (325 commuters, 33.6%) for females.
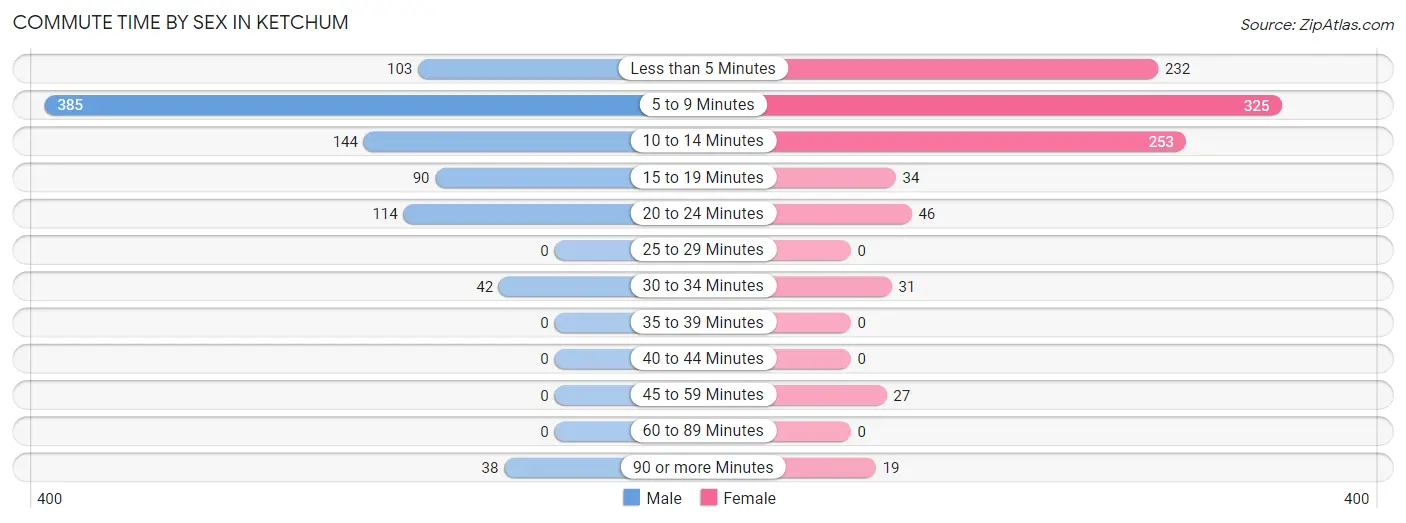
| Commute Time | Male | Female |
| Less than 5 Minutes | 103 (11.2%) | 232 (24.0%) |
| 5 to 9 Minutes | 385 (42.0%) | 325 (33.6%) |
| 10 to 14 Minutes | 144 (15.7%) | 253 (26.2%) |
| 15 to 19 Minutes | 90 (9.8%) | 34 (3.5%) |
| 20 to 24 Minutes | 114 (12.4%) | 46 (4.8%) |
| 25 to 29 Minutes | 0 (0.0%) | 0 (0.0%) |
| 30 to 34 Minutes | 42 (4.6%) | 31 (3.2%) |
| 35 to 39 Minutes | 0 (0.0%) | 0 (0.0%) |
| 40 to 44 Minutes | 0 (0.0%) | 0 (0.0%) |
| 45 to 59 Minutes | 0 (0.0%) | 27 (2.8%) |
| 60 to 89 Minutes | 0 (0.0%) | 0 (0.0%) |
| 90 or more Minutes | 38 (4.2%) | 19 (2.0%) |
Time of Departure to Work by Sex in Ketchum
The most frequent times of departure to work in Ketchum are 9:00 AM to 9:59 AM (211, 23.0%) for males and 7:00 AM to 7:29 AM (185, 19.1%) for females.
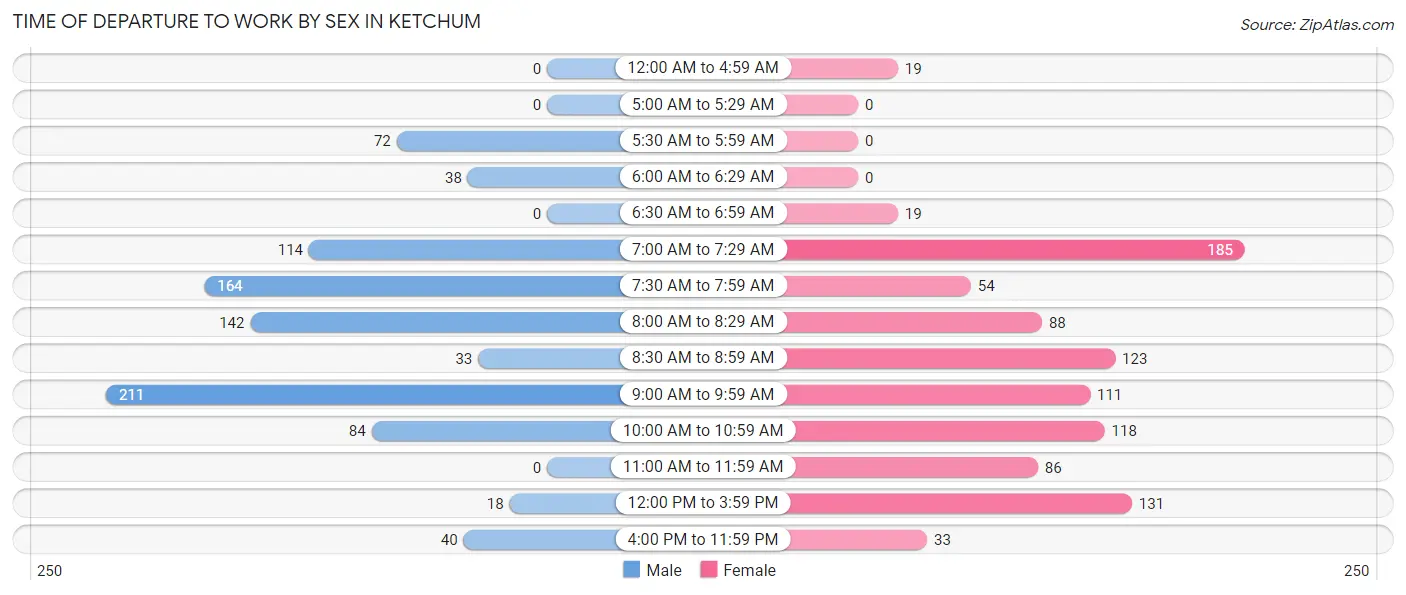
| Time of Departure | Male | Female |
| 12:00 AM to 4:59 AM | 0 (0.0%) | 19 (2.0%) |
| 5:00 AM to 5:29 AM | 0 (0.0%) | 0 (0.0%) |
| 5:30 AM to 5:59 AM | 72 (7.9%) | 0 (0.0%) |
| 6:00 AM to 6:29 AM | 38 (4.2%) | 0 (0.0%) |
| 6:30 AM to 6:59 AM | 0 (0.0%) | 19 (2.0%) |
| 7:00 AM to 7:29 AM | 114 (12.4%) | 185 (19.1%) |
| 7:30 AM to 7:59 AM | 164 (17.9%) | 54 (5.6%) |
| 8:00 AM to 8:29 AM | 142 (15.5%) | 88 (9.1%) |
| 8:30 AM to 8:59 AM | 33 (3.6%) | 123 (12.7%) |
| 9:00 AM to 9:59 AM | 211 (23.0%) | 111 (11.5%) |
| 10:00 AM to 10:59 AM | 84 (9.2%) | 118 (12.2%) |
| 11:00 AM to 11:59 AM | 0 (0.0%) | 86 (8.9%) |
| 12:00 PM to 3:59 PM | 18 (2.0%) | 131 (13.6%) |
| 4:00 PM to 11:59 PM | 40 (4.4%) | 33 (3.4%) |
| Total | 916 (100.0%) | 967 (100.0%) |
Housing Occupancy in Ketchum
Occupancy by Ownership in Ketchum
Of the total 1,828 dwellings in Ketchum, owner-occupied units account for 1,316 (72.0%), while renter-occupied units make up 512 (28.0%).
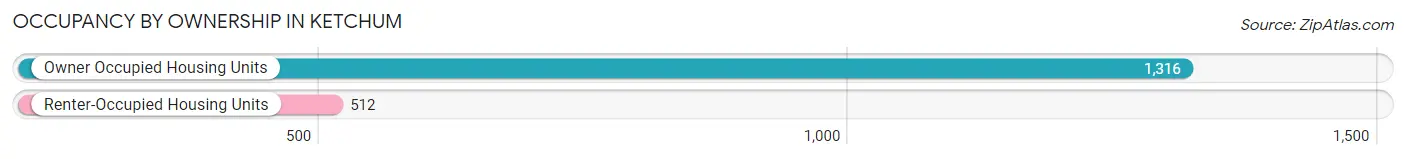
| Occupancy | # Housing Units | % Housing Units |
| Owner Occupied Housing Units | 1,316 | 72.0% |
| Renter-Occupied Housing Units | 512 | 28.0% |
| Total Occupied Housing Units | 1,828 | 100.0% |
Occupancy by Household Size in Ketchum
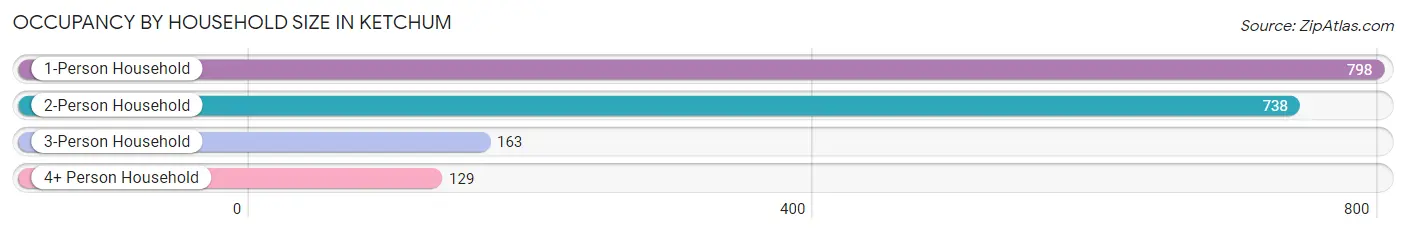
| Household Size | # Housing Units | % Housing Units |
| 1-Person Household | 798 | 43.6% |
| 2-Person Household | 738 | 40.4% |
| 3-Person Household | 163 | 8.9% |
| 4+ Person Household | 129 | 7.1% |
| Total Housing Units | 1,828 | 100.0% |
Occupancy by Ownership by Household Size in Ketchum
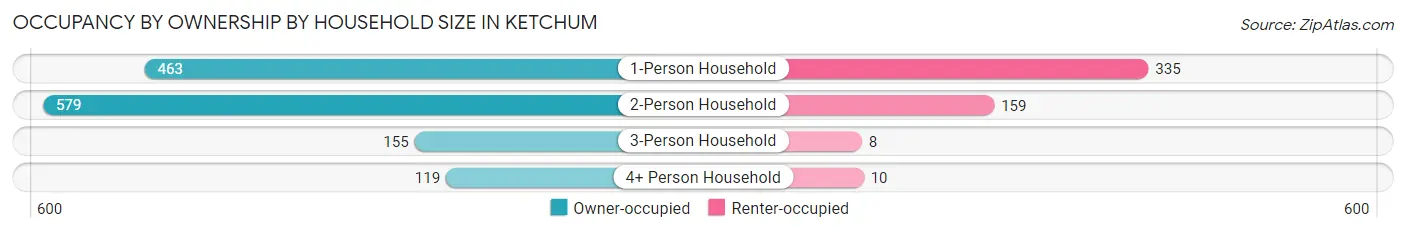
| Household Size | Owner-occupied | Renter-occupied |
| 1-Person Household | 463 (58.0%) | 335 (42.0%) |
| 2-Person Household | 579 (78.5%) | 159 (21.5%) |
| 3-Person Household | 155 (95.1%) | 8 (4.9%) |
| 4+ Person Household | 119 (92.2%) | 10 (7.7%) |
| Total Housing Units | 1,316 (72.0%) | 512 (28.0%) |
Occupancy by Educational Attainment in Ketchum
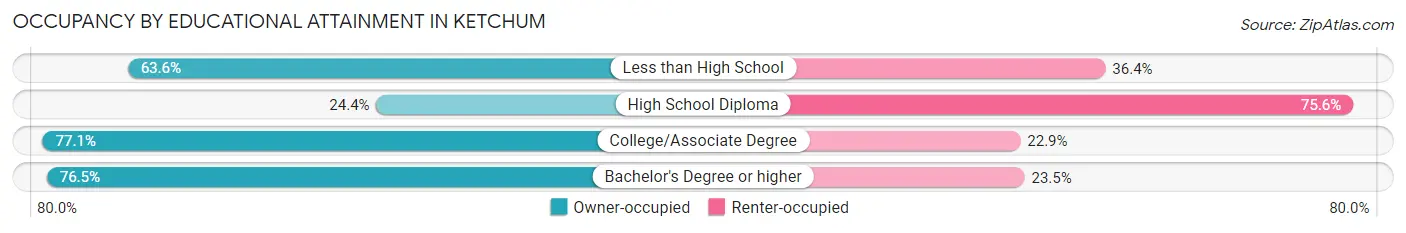
| Household Size | Owner-occupied | Renter-occupied |
| Less than High School | 21 (63.6%) | 12 (36.4%) |
| High School Diploma | 38 (24.4%) | 118 (75.6%) |
| College/Associate Degree | 425 (77.1%) | 126 (22.9%) |
| Bachelor's Degree or higher | 832 (76.5%) | 256 (23.5%) |
Occupancy by Age of Householder in Ketchum
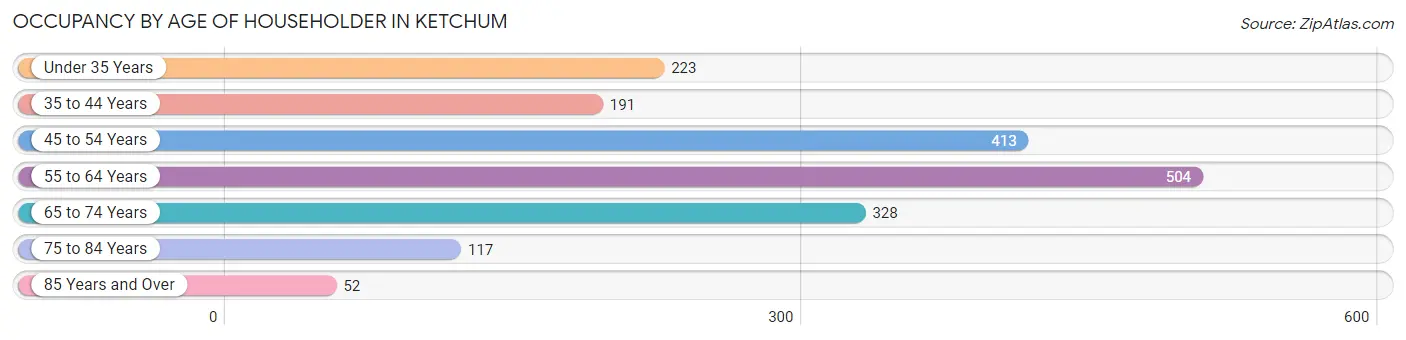
| Age Bracket | # Households | % Households |
| Under 35 Years | 223 | 12.2% |
| 35 to 44 Years | 191 | 10.4% |
| 45 to 54 Years | 413 | 22.6% |
| 55 to 64 Years | 504 | 27.6% |
| 65 to 74 Years | 328 | 17.9% |
| 75 to 84 Years | 117 | 6.4% |
| 85 Years and Over | 52 | 2.8% |
| Total | 1,828 | 100.0% |
Housing Finances in Ketchum
Median Income by Occupancy in Ketchum
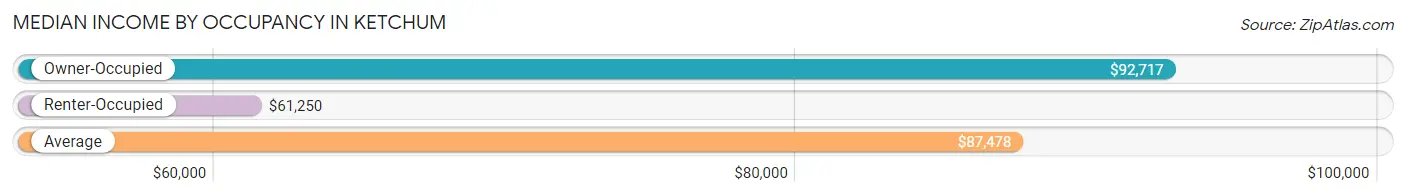
| Occupancy Type | # Households | Median Income |
| Owner-Occupied | 1,316 (72.0%) | $92,717 |
| Renter-Occupied | 512 (28.0%) | $61,250 |
| Average | 1,828 (100.0%) | $87,478 |
Occupancy by Householder Income Bracket in Ketchum
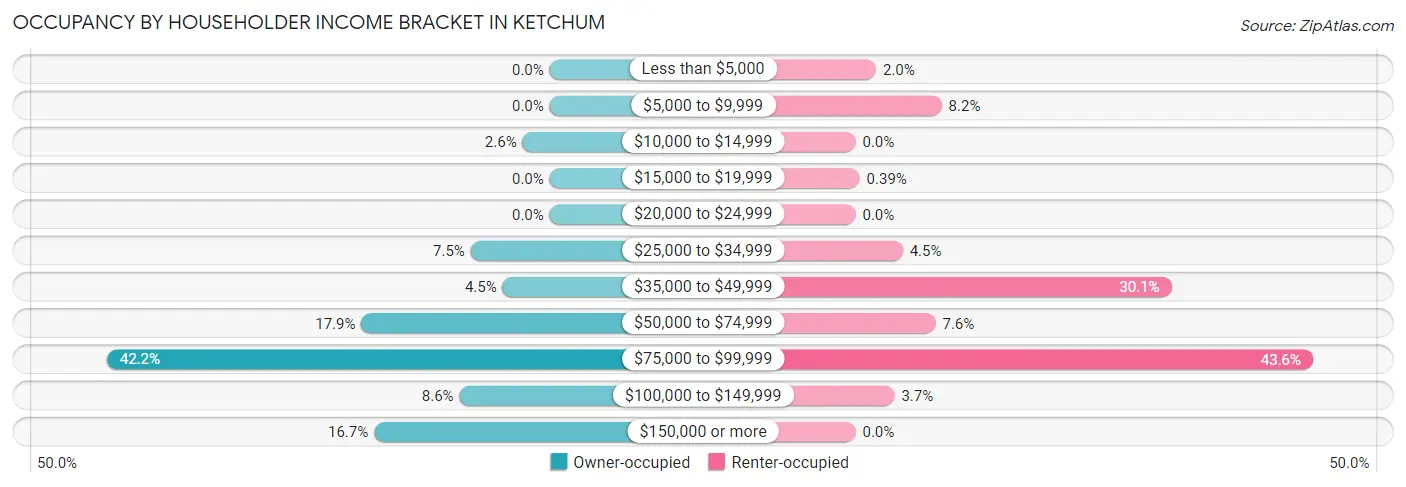
| Income Bracket | Owner-occupied | Renter-occupied |
| Less than $5,000 | 0 (0.0%) | 10 (1.9%) |
| $5,000 to $9,999 | 0 (0.0%) | 42 (8.2%) |
| $10,000 to $14,999 | 34 (2.6%) | 0 (0.0%) |
| $15,000 to $19,999 | 0 (0.0%) | 2 (0.4%) |
| $20,000 to $24,999 | 0 (0.0%) | 0 (0.0%) |
| $25,000 to $34,999 | 99 (7.5%) | 23 (4.5%) |
| $35,000 to $49,999 | 59 (4.5%) | 154 (30.1%) |
| $50,000 to $74,999 | 236 (17.9%) | 39 (7.6%) |
| $75,000 to $99,999 | 555 (42.2%) | 223 (43.5%) |
| $100,000 to $149,999 | 113 (8.6%) | 19 (3.7%) |
| $150,000 or more | 220 (16.7%) | 0 (0.0%) |
| Total | 1,316 (100.0%) | 512 (100.0%) |
Monthly Housing Cost Tiers in Ketchum
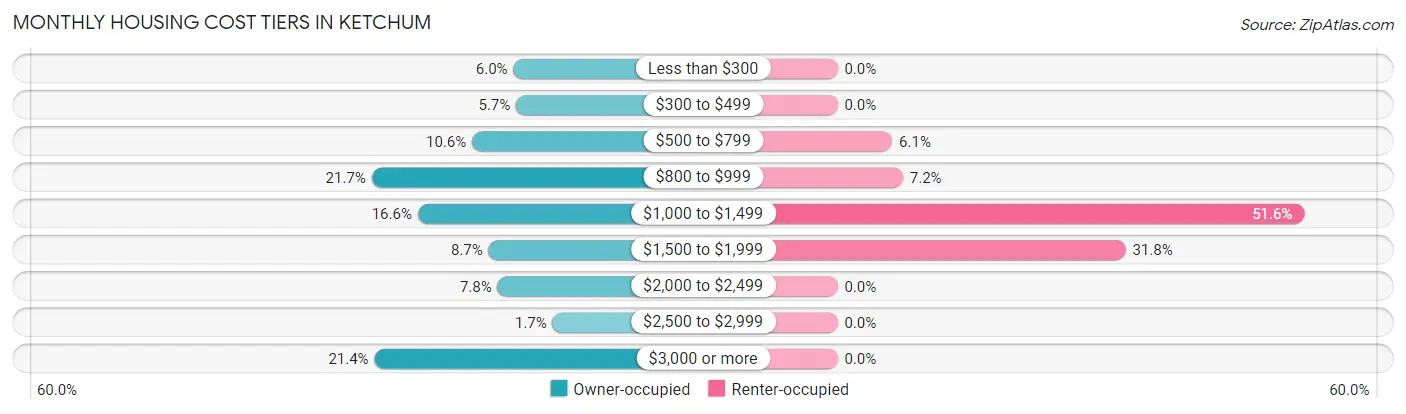
| Monthly Cost | Owner-occupied | Renter-occupied |
| Less than $300 | 79 (6.0%) | 0 (0.0%) |
| $300 to $499 | 75 (5.7%) | 0 (0.0%) |
| $500 to $799 | 139 (10.6%) | 31 (6.0%) |
| $800 to $999 | 285 (21.7%) | 37 (7.2%) |
| $1,000 to $1,499 | 218 (16.6%) | 264 (51.6%) |
| $1,500 to $1,999 | 115 (8.7%) | 163 (31.8%) |
| $2,000 to $2,499 | 102 (7.7%) | 0 (0.0%) |
| $2,500 to $2,999 | 22 (1.7%) | 0 (0.0%) |
| $3,000 or more | 281 (21.3%) | 0 (0.0%) |
| Total | 1,316 (100.0%) | 512 (100.0%) |
Physical Housing Characteristics in Ketchum
Housing Structures in Ketchum
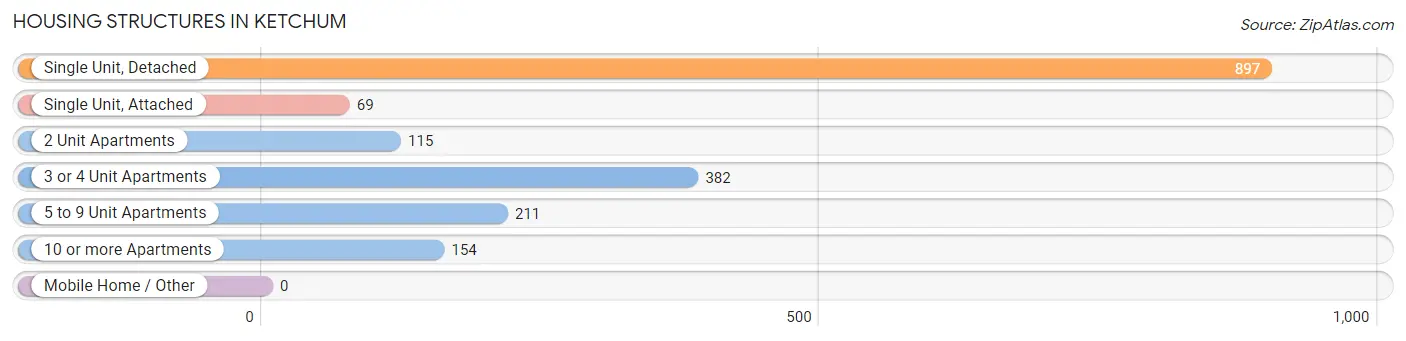
| Structure Type | # Housing Units | % Housing Units |
| Single Unit, Detached | 897 | 49.1% |
| Single Unit, Attached | 69 | 3.8% |
| 2 Unit Apartments | 115 | 6.3% |
| 3 or 4 Unit Apartments | 382 | 20.9% |
| 5 to 9 Unit Apartments | 211 | 11.5% |
| 10 or more Apartments | 154 | 8.4% |
| Mobile Home / Other | 0 | 0.0% |
| Total | 1,828 | 100.0% |
Housing Structures by Occupancy in Ketchum
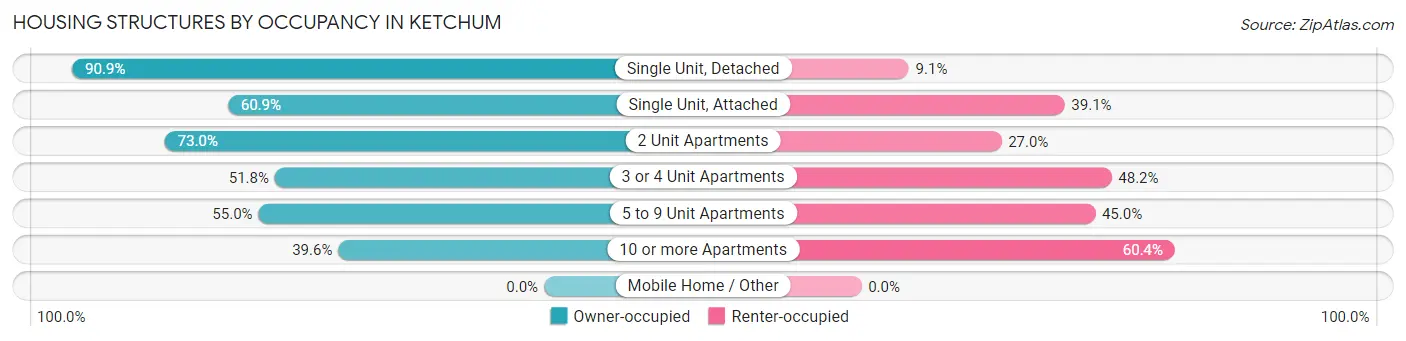
| Structure Type | Owner-occupied | Renter-occupied |
| Single Unit, Detached | 815 (90.9%) | 82 (9.1%) |
| Single Unit, Attached | 42 (60.9%) | 27 (39.1%) |
| 2 Unit Apartments | 84 (73.0%) | 31 (27.0%) |
| 3 or 4 Unit Apartments | 198 (51.8%) | 184 (48.2%) |
| 5 to 9 Unit Apartments | 116 (55.0%) | 95 (45.0%) |
| 10 or more Apartments | 61 (39.6%) | 93 (60.4%) |
| Mobile Home / Other | 0 (0.0%) | 0 (0.0%) |
| Total | 1,316 (72.0%) | 512 (28.0%) |
Housing Structures by Number of Rooms in Ketchum
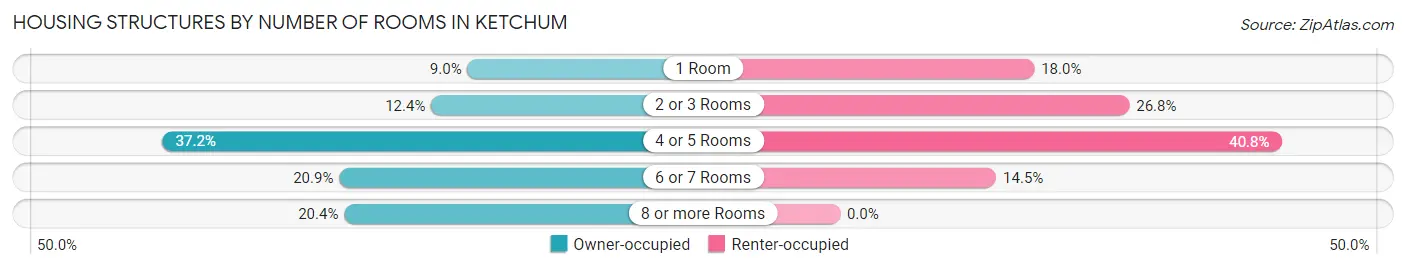
| Number of Rooms | Owner-occupied | Renter-occupied |
| 1 Room | 119 (9.0%) | 92 (18.0%) |
| 2 or 3 Rooms | 163 (12.4%) | 137 (26.8%) |
| 4 or 5 Rooms | 490 (37.2%) | 209 (40.8%) |
| 6 or 7 Rooms | 275 (20.9%) | 74 (14.4%) |
| 8 or more Rooms | 269 (20.4%) | 0 (0.0%) |
| Total | 1,316 (100.0%) | 512 (100.0%) |
Housing Structure by Heating Type in Ketchum
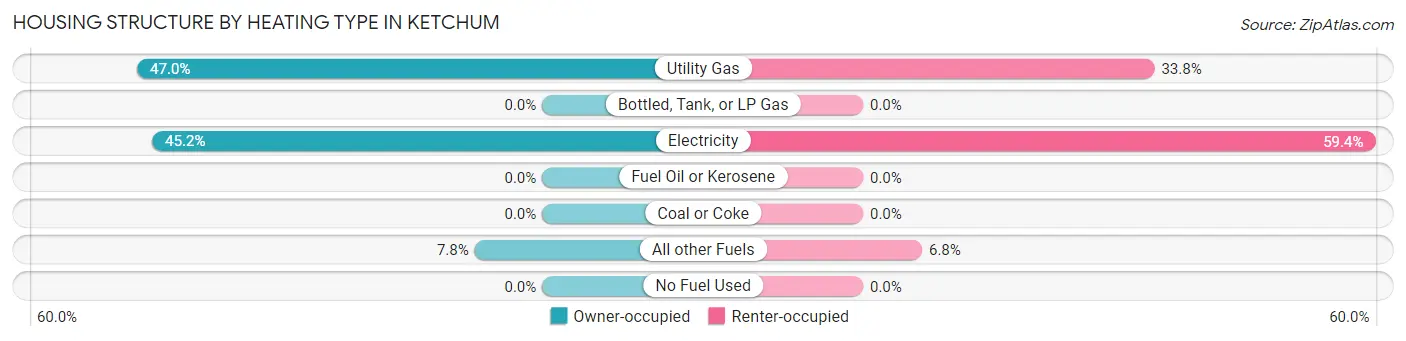
| Heating Type | Owner-occupied | Renter-occupied |
| Utility Gas | 618 (47.0%) | 173 (33.8%) |
| Bottled, Tank, or LP Gas | 0 (0.0%) | 0 (0.0%) |
| Electricity | 595 (45.2%) | 304 (59.4%) |
| Fuel Oil or Kerosene | 0 (0.0%) | 0 (0.0%) |
| Coal or Coke | 0 (0.0%) | 0 (0.0%) |
| All other Fuels | 103 (7.8%) | 35 (6.8%) |
| No Fuel Used | 0 (0.0%) | 0 (0.0%) |
| Total | 1,316 (100.0%) | 512 (100.0%) |
Household Vehicle Usage in Ketchum
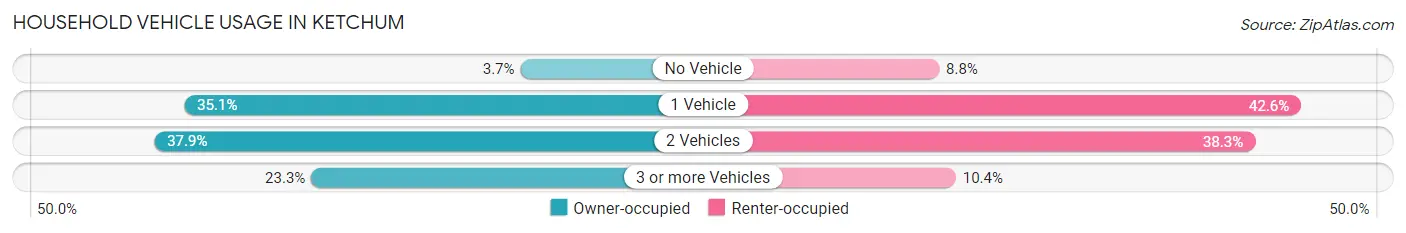
| Vehicles per Household | Owner-occupied | Renter-occupied |
| No Vehicle | 49 (3.7%) | 45 (8.8%) |
| 1 Vehicle | 462 (35.1%) | 218 (42.6%) |
| 2 Vehicles | 499 (37.9%) | 196 (38.3%) |
| 3 or more Vehicles | 306 (23.3%) | 53 (10.3%) |
| Total | 1,316 (100.0%) | 512 (100.0%) |
Real Estate & Mortgages in Ketchum
Real Estate and Mortgage Overview in Ketchum
| Characteristic | Without Mortgage | With Mortgage |
| Housing Units | 673 | 643 |
| Median Property Value | - | - |
| Median Household Income | $91,402 | $97 |
| Monthly Housing Costs | $915 | $249 |
| Real Estate Taxes | $3,835 | $0 |
Property Value by Mortgage Status in Ketchum
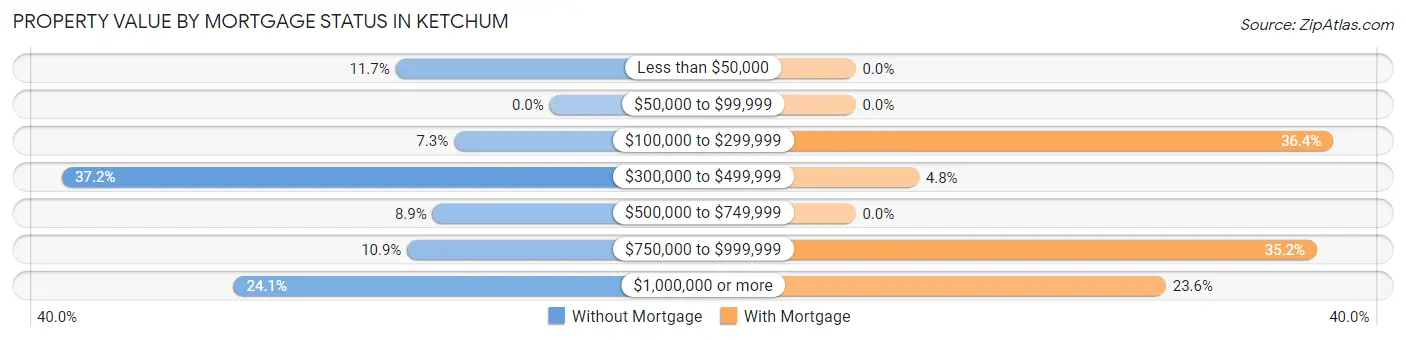
| Property Value | Without Mortgage | With Mortgage |
| Less than $50,000 | 79 (11.7%) | 0 (0.0%) |
| $50,000 to $99,999 | 0 (0.0%) | 0 (0.0%) |
| $100,000 to $299,999 | 49 (7.3%) | 234 (36.4%) |
| $300,000 to $499,999 | 250 (37.1%) | 31 (4.8%) |
| $500,000 to $749,999 | 60 (8.9%) | 0 (0.0%) |
| $750,000 to $999,999 | 73 (10.8%) | 226 (35.1%) |
| $1,000,000 or more | 162 (24.1%) | 152 (23.6%) |
| Total | 673 (100.0%) | 643 (100.0%) |
Household Income by Mortgage Status in Ketchum
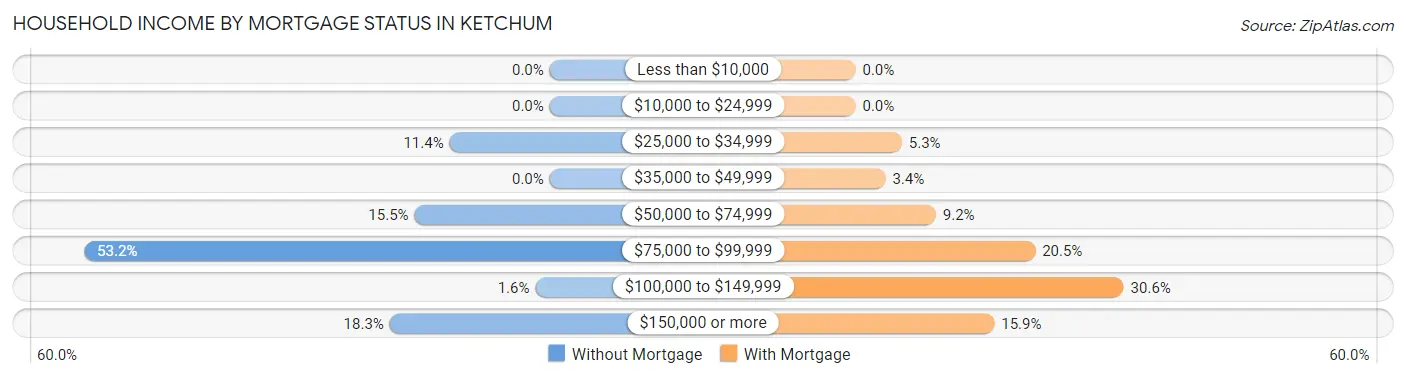
| Household Income | Without Mortgage | With Mortgage |
| Less than $10,000 | 0 (0.0%) | 0 (0.0%) |
| $10,000 to $24,999 | 0 (0.0%) | 0 (0.0%) |
| $25,000 to $34,999 | 77 (11.4%) | 34 (5.3%) |
| $35,000 to $49,999 | 0 (0.0%) | 22 (3.4%) |
| $50,000 to $74,999 | 104 (15.4%) | 59 (9.2%) |
| $75,000 to $99,999 | 358 (53.2%) | 132 (20.5%) |
| $100,000 to $149,999 | 11 (1.6%) | 197 (30.6%) |
| $150,000 or more | 123 (18.3%) | 102 (15.9%) |
| Total | 673 (100.0%) | 643 (100.0%) |
Property Value to Household Income Ratio in Ketchum
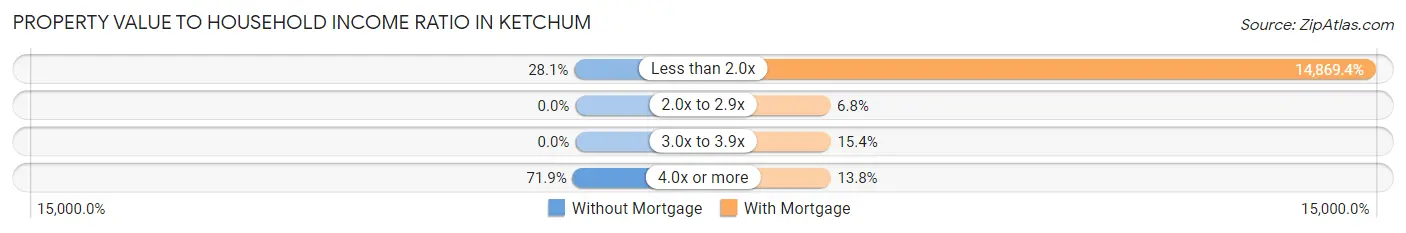
| Value-to-Income Ratio | Without Mortgage | With Mortgage |
| Less than 2.0x | 189 (28.1%) | 95,610 (14,869.4%) |
| 2.0x to 2.9x | 0 (0.0%) | 44 (6.8%) |
| 3.0x to 3.9x | 0 (0.0%) | 99 (15.4%) |
| 4.0x or more | 484 (71.9%) | 89 (13.8%) |
| Total | 673 (100.0%) | 643 (100.0%) |
Real Estate Taxes by Mortgage Status in Ketchum
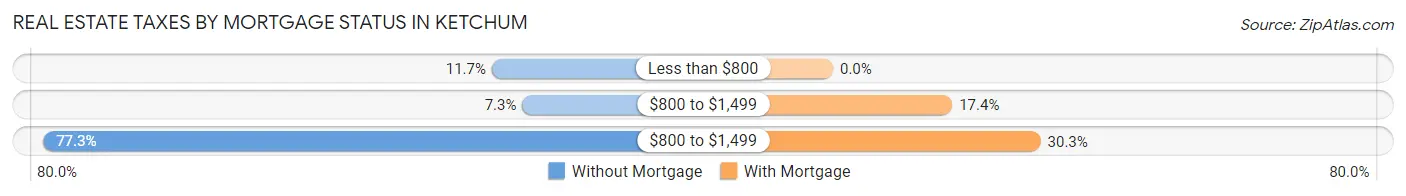
| Property Taxes | Without Mortgage | With Mortgage |
| Less than $800 | 79 (11.7%) | 0 (0.0%) |
| $800 to $1,499 | 49 (7.3%) | 112 (17.4%) |
| $800 to $1,499 | 520 (77.3%) | 195 (30.3%) |
| Total | 673 (100.0%) | 643 (100.0%) |
Health & Disability in Ketchum
Health Insurance Coverage by Age in Ketchum
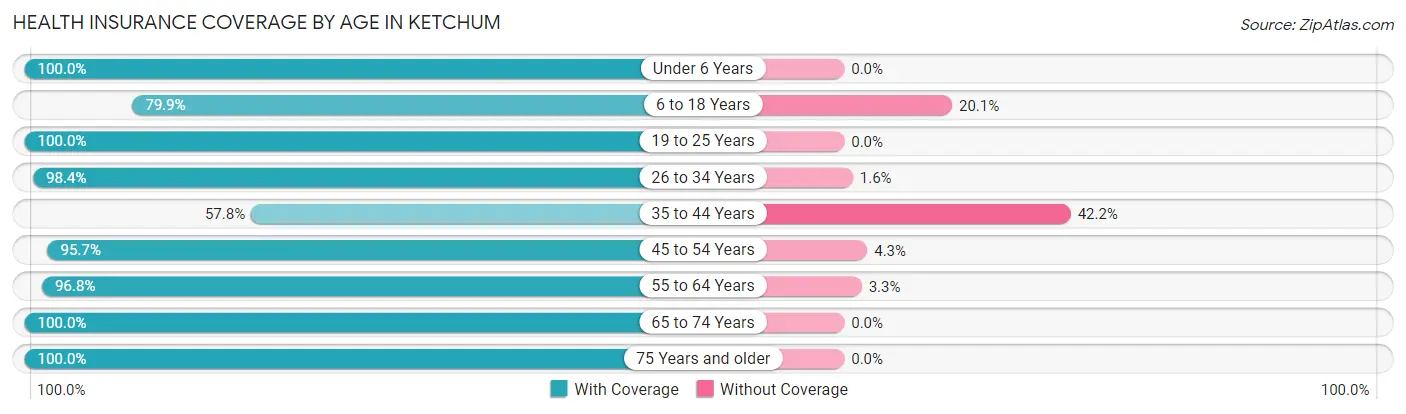
| Age Bracket | With Coverage | Without Coverage |
| Under 6 Years | 74 (100.0%) | 0 (0.0%) |
| 6 to 18 Years | 354 (79.9%) | 89 (20.1%) |
| 19 to 25 Years | 99 (100.0%) | 0 (0.0%) |
| 26 to 34 Years | 494 (98.4%) | 8 (1.6%) |
| 35 to 44 Years | 156 (57.8%) | 114 (42.2%) |
| 45 to 54 Years | 513 (95.7%) | 23 (4.3%) |
| 55 to 64 Years | 745 (96.8%) | 25 (3.3%) |
| 65 to 74 Years | 489 (100.0%) | 0 (0.0%) |
| 75 Years and older | 307 (100.0%) | 0 (0.0%) |
| Total | 3,231 (92.6%) | 259 (7.4%) |
Health Insurance Coverage by Citizenship Status in Ketchum
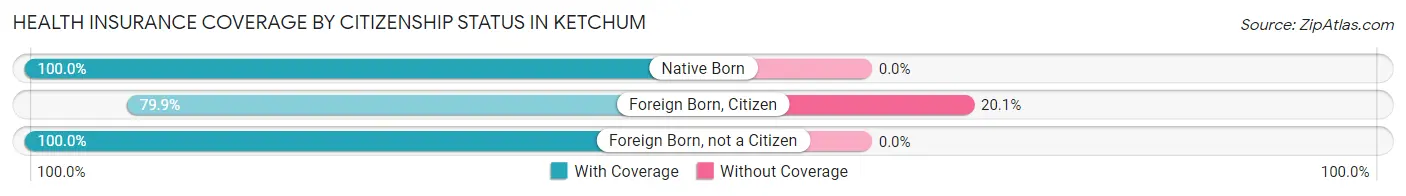
| Citizenship Status | With Coverage | Without Coverage |
| Native Born | 74 (100.0%) | 0 (0.0%) |
| Foreign Born, Citizen | 354 (79.9%) | 89 (20.1%) |
| Foreign Born, not a Citizen | 99 (100.0%) | 0 (0.0%) |
Health Insurance Coverage by Household Income in Ketchum
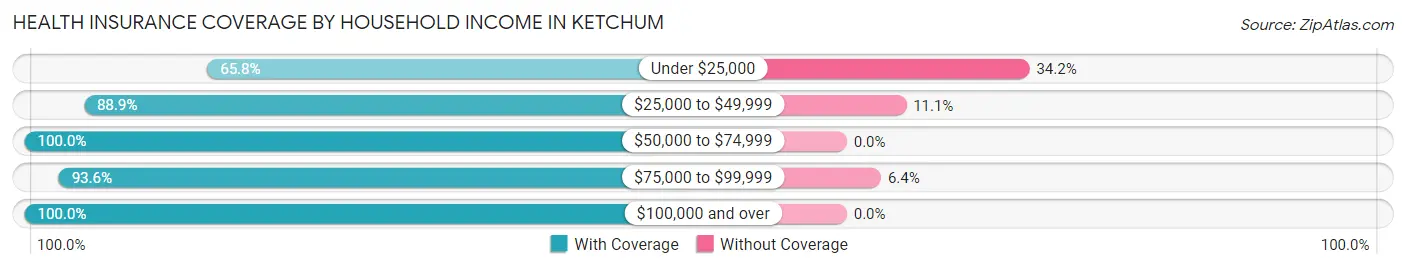
| Household Income | With Coverage | Without Coverage |
| Under $25,000 | 219 (65.8%) | 114 (34.2%) |
| $25,000 to $49,999 | 527 (88.9%) | 66 (11.1%) |
| $50,000 to $74,999 | 533 (100.0%) | 0 (0.0%) |
| $75,000 to $99,999 | 1,155 (93.6%) | 79 (6.4%) |
| $100,000 and over | 787 (100.0%) | 0 (0.0%) |
Public vs Private Health Insurance Coverage by Age in Ketchum
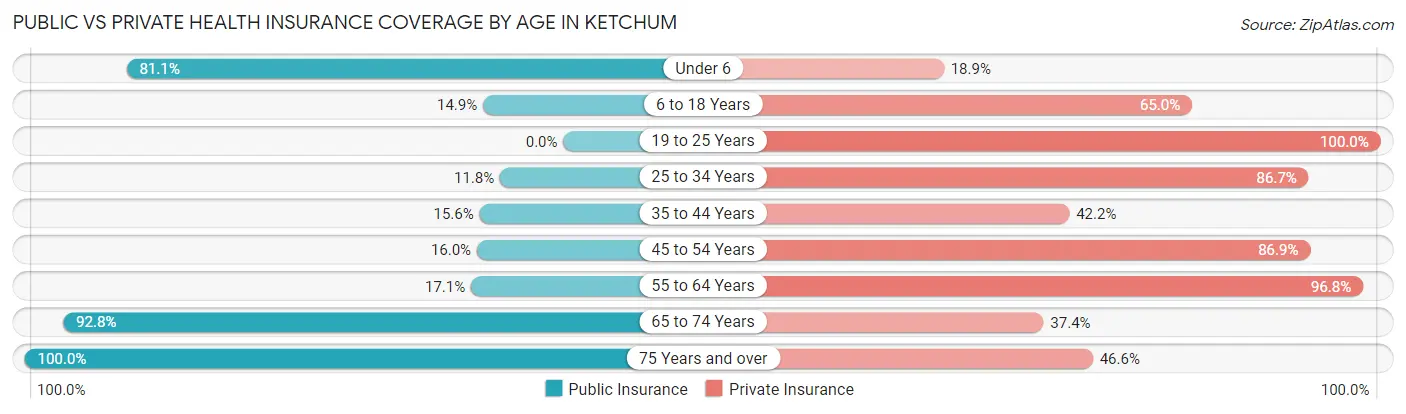
| Age Bracket | Public Insurance | Private Insurance |
| Under 6 | 60 (81.1%) | 14 (18.9%) |
| 6 to 18 Years | 66 (14.9%) | 288 (65.0%) |
| 19 to 25 Years | 0 (0.0%) | 99 (100.0%) |
| 25 to 34 Years | 59 (11.7%) | 435 (86.7%) |
| 35 to 44 Years | 42 (15.6%) | 114 (42.2%) |
| 45 to 54 Years | 86 (16.0%) | 466 (86.9%) |
| 55 to 64 Years | 132 (17.1%) | 745 (96.8%) |
| 65 to 74 Years | 454 (92.8%) | 183 (37.4%) |
| 75 Years and over | 307 (100.0%) | 143 (46.6%) |
| Total | 1,206 (34.6%) | 2,487 (71.3%) |
Disability Status by Sex by Age in Ketchum
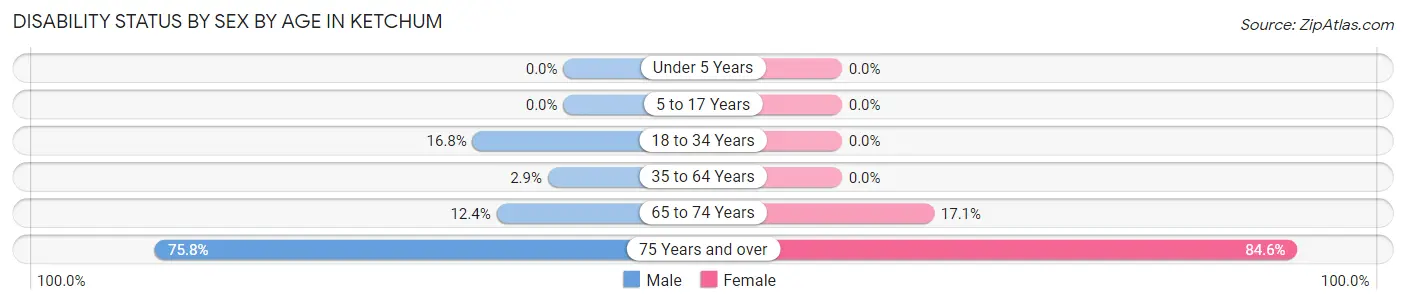
| Age Bracket | Male | Female |
| Under 5 Years | 0 (0.0%) | 0 (0.0%) |
| 5 to 17 Years | 0 (0.0%) | 0 (0.0%) |
| 18 to 34 Years | 49 (16.8%) | 0 (0.0%) |
| 35 to 64 Years | 24 (2.9%) | 0 (0.0%) |
| 65 to 74 Years | 36 (12.4%) | 34 (17.1%) |
| 75 Years and over | 100 (75.8%) | 148 (84.6%) |
Disability Class by Sex by Age in Ketchum
Disability Class: Hearing Difficulty
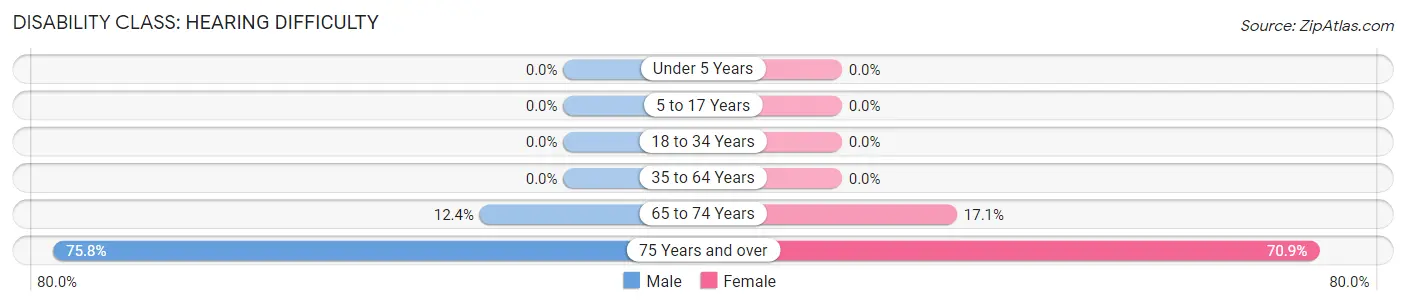
| Age Bracket | Male | Female |
| Under 5 Years | 0 (0.0%) | 0 (0.0%) |
| 5 to 17 Years | 0 (0.0%) | 0 (0.0%) |
| 18 to 34 Years | 0 (0.0%) | 0 (0.0%) |
| 35 to 64 Years | 0 (0.0%) | 0 (0.0%) |
| 65 to 74 Years | 36 (12.4%) | 34 (17.1%) |
| 75 Years and over | 100 (75.8%) | 124 (70.9%) |
Disability Class: Vision Difficulty
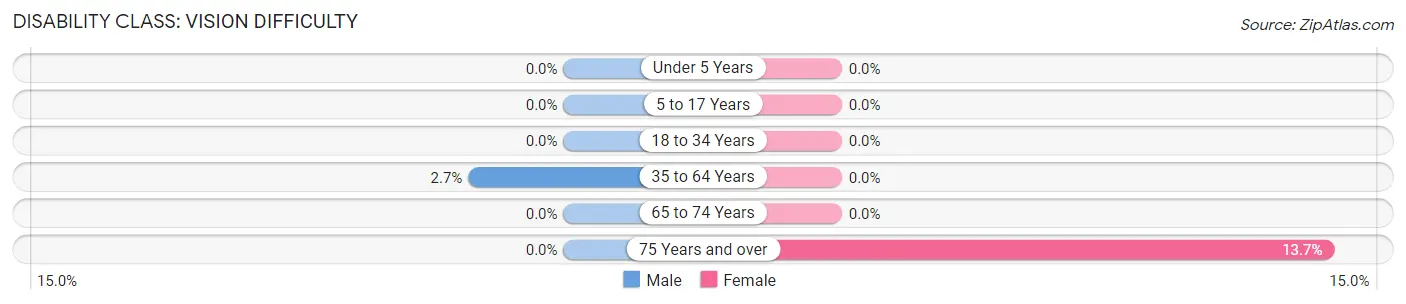
| Age Bracket | Male | Female |
| Under 5 Years | 0 (0.0%) | 0 (0.0%) |
| 5 to 17 Years | 0 (0.0%) | 0 (0.0%) |
| 18 to 34 Years | 0 (0.0%) | 0 (0.0%) |
| 35 to 64 Years | 22 (2.6%) | 0 (0.0%) |
| 65 to 74 Years | 0 (0.0%) | 0 (0.0%) |
| 75 Years and over | 0 (0.0%) | 24 (13.7%) |
Disability Class: Cognitive Difficulty
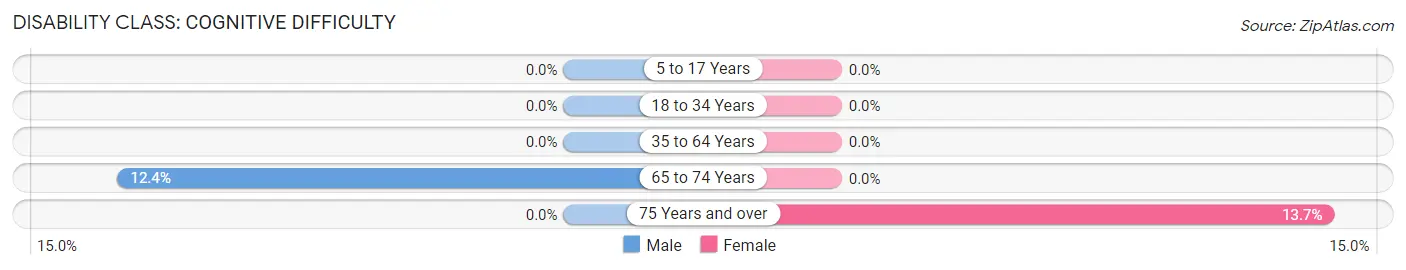
| Age Bracket | Male | Female |
| 5 to 17 Years | 0 (0.0%) | 0 (0.0%) |
| 18 to 34 Years | 0 (0.0%) | 0 (0.0%) |
| 35 to 64 Years | 0 (0.0%) | 0 (0.0%) |
| 65 to 74 Years | 36 (12.4%) | 0 (0.0%) |
| 75 Years and over | 0 (0.0%) | 24 (13.7%) |
Disability Class: Ambulatory Difficulty
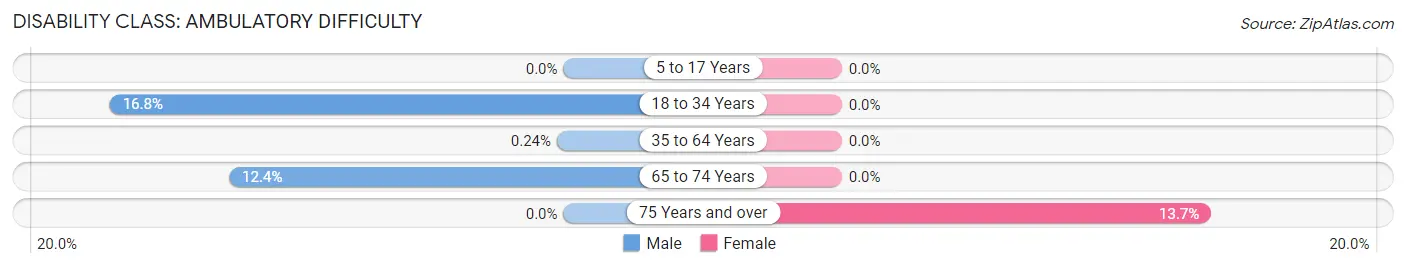
| Age Bracket | Male | Female |
| 5 to 17 Years | 0 (0.0%) | 0 (0.0%) |
| 18 to 34 Years | 49 (16.8%) | 0 (0.0%) |
| 35 to 64 Years | 2 (0.2%) | 0 (0.0%) |
| 65 to 74 Years | 36 (12.4%) | 0 (0.0%) |
| 75 Years and over | 0 (0.0%) | 24 (13.7%) |
Disability Class: Self-Care Difficulty
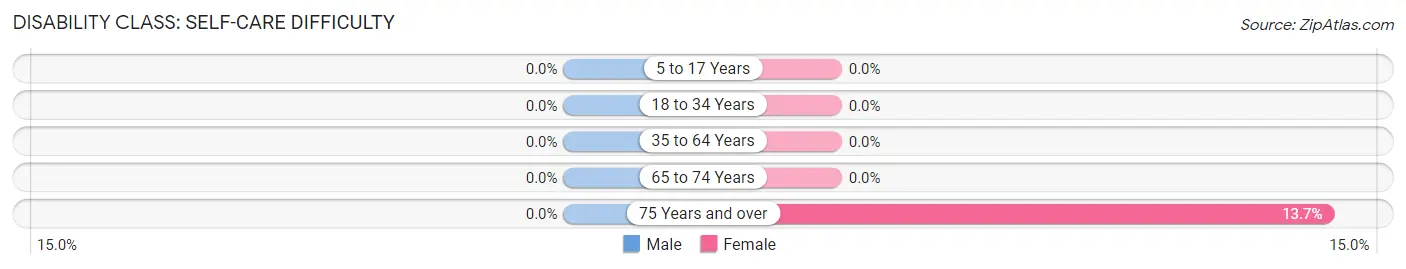
| Age Bracket | Male | Female |
| 5 to 17 Years | 0 (0.0%) | 0 (0.0%) |
| 18 to 34 Years | 0 (0.0%) | 0 (0.0%) |
| 35 to 64 Years | 0 (0.0%) | 0 (0.0%) |
| 65 to 74 Years | 0 (0.0%) | 0 (0.0%) |
| 75 Years and over | 0 (0.0%) | 24 (13.7%) |
Technology Access in Ketchum
Computing Device Access in Ketchum
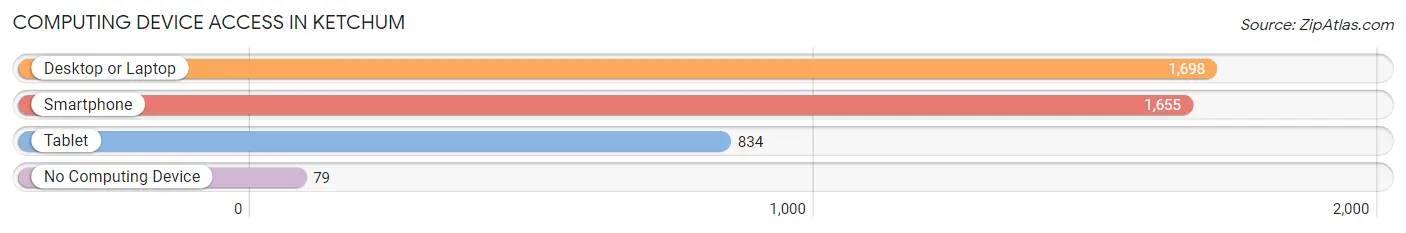
| Device Type | # Households | % Households |
| Desktop or Laptop | 1,698 | 92.9% |
| Smartphone | 1,655 | 90.5% |
| Tablet | 834 | 45.6% |
| No Computing Device | 79 | 4.3% |
| Total | 1,828 | 100.0% |
Internet Access in Ketchum
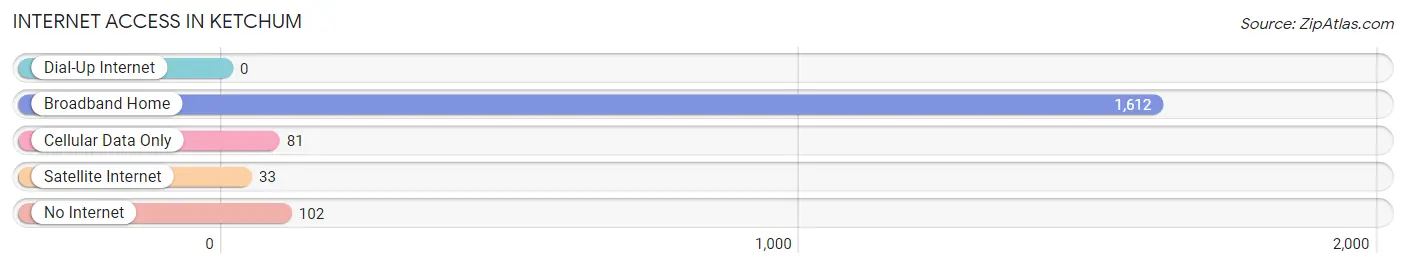
| Internet Type | # Households | % Households |
| Dial-Up Internet | 0 | 0.0% |
| Broadband Home | 1,612 | 88.2% |
| Cellular Data Only | 81 | 4.4% |
| Satellite Internet | 33 | 1.8% |
| No Internet | 102 | 5.6% |
| Total | 1,828 | 100.0% |
Ketchum Summary
Ketchum, Idaho is a small city located in the Wood River Valley of Blaine County, Idaho. It is situated at the base of the Sawtooth Mountains and is surrounded by the Sawtooth National Forest. The city is known for its outdoor recreation opportunities, including skiing, hiking, biking, and fishing. Ketchum is also home to the Sun Valley Resort, a popular ski resort.
Geography
Ketchum is located in the Wood River Valley of Blaine County, Idaho. The city is situated at the base of the Sawtooth Mountains and is surrounded by the Sawtooth National Forest. The city is located at an elevation of 5,845 feet and has a total area of 4.2 square miles. The city is located near the Big Wood River, which flows through the city.
Climate
Ketchum has a semi-arid climate with cold winters and warm summers. The average high temperature in the summer is around 80 degrees Fahrenheit, while the average low temperature in the winter is around 20 degrees Fahrenheit. The city receives an average of 18 inches of precipitation per year, with most of it falling in the form of snow.
Demographics
As of the 2010 census, Ketchum had a population of 2,689. The racial makeup of the city was 94.3% White, 0.3% African American, 0.3% Native American, 0.7% Asian, 0.1% Pacific Islander, 0.7% from other races, and 3.0% from two or more races. Hispanic or Latino of any race were 3.2% of the population.
Economy
Ketchum's economy is largely based on tourism, with the Sun Valley Resort being the main attraction. The resort offers skiing, snowboarding, and other outdoor activities. The city also has a number of restaurants, bars, and shops. Other industries in the city include construction, retail, and health care.
History
Ketchum was founded in 1880 by prospectors who were searching for gold in the area. The city was named after one of the prospectors, David Ketchum. The city grew slowly over the years, and by the early 1900s, it had become a popular destination for tourists. In 1936, the Sun Valley Resort was opened, and it quickly became one of the most popular ski resorts in the United States. The city has continued to grow since then, and today it is a popular destination for outdoor recreation and tourism.
Common Questions
What is Per Capita Income in Ketchum?
Per Capita income in Ketchum is $59,167.
What is the Median Family Income in Ketchum?
Median Family Income in Ketchum is $91,410.
What is the Median Household income in Ketchum?
Median Household Income in Ketchum is $87,478.
What is Income or Wage Gap in Ketchum?
Income or Wage Gap in Ketchum is 39.5%.
Women in Ketchum earn 60.5 cents for every dollar earned by a man.
What is Inequality or Gini Index in Ketchum?
Inequality or Gini Index in Ketchum is 0.42.
What is the Total Population of Ketchum?
Total Population of Ketchum is 3,490.
What is the Total Male Population of Ketchum?
Total Male Population of Ketchum is 1,705.
What is the Total Female Population of Ketchum?
Total Female Population of Ketchum is 1,785.
What is the Ratio of Males per 100 Females in Ketchum?
There are 95.52 Males per 100 Females in Ketchum.
What is the Ratio of Females per 100 Males in Ketchum?
There are 104.69 Females per 100 Males in Ketchum.
What is the Median Population Age in Ketchum?
Median Population Age in Ketchum is 51.3 Years.
What is the Average Family Size in Ketchum
Average Family Size in Ketchum is 2.5 People.
What is the Average Household Size in Ketchum
Average Household Size in Ketchum is 1.9 People.
How Large is the Labor Force in Ketchum?
There are 2,322 People in the Labor Forcein in Ketchum.
What is the Percentage of People in the Labor Force in Ketchum?
71.5% of People are in the Labor Force in Ketchum.
What is the Unemployment Rate in Ketchum?
Unemployment Rate in Ketchum is 0.9%.