Elk River, ID Map & Demographics
Elk River Map
Elk River Overview
$35,491
PER CAPITA INCOME
$61,250
AVG FAMILY INCOME
$51,250
AVG HOUSEHOLD INCOME
0.38
INEQUALITY / GINI INDEX
164
TOTAL POPULATION
98
MALE POPULATION
66
FEMALE POPULATION
148.48
MALES / 100 FEMALES
67.35
FEMALES / 100 MALES
58.0
MEDIAN AGE
3.0
AVG FAMILY SIZE
2.3
AVG HOUSEHOLD SIZE
65
LABOR FORCE [ PEOPLE ]
45.5%
PERCENT IN LABOR FORCE
Elk River Zip Codes
Elk River Area Codes
Income in Elk River
Income Overview in Elk River
Per Capita Income in Elk River is $35,491, while median incomes of families and households are $61,250 and $51,250 respectively.
| Characteristic | Number | Measure |
| Per Capita Income | 164 | $35,491 |
| Median Family Income | 43 | $61,250 |
| Mean Family Income | 43 | $85,735 |
| Median Household Income | 72 | $51,250 |
| Mean Household Income | 72 | $71,568 |
| Income Deficit | 43 | $0 |
| Wage / Income Gap (%) | 164 | 0.00% |
| Wage / Income Gap ($) | 164 | 100.00¢ per $1 |
| Gini / Inequality Index | 164 | 0.38 |
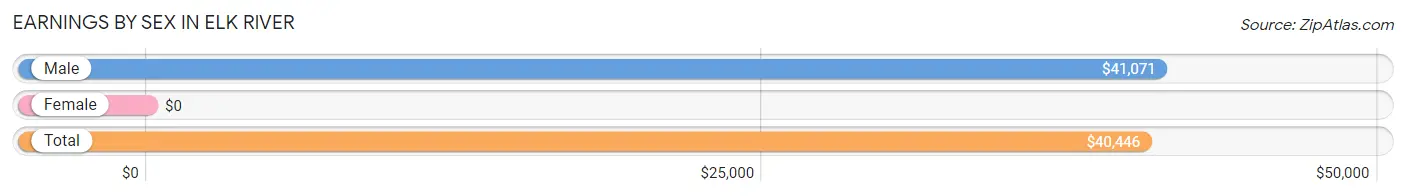
Earnings by Sex in Elk River
| Sex | Number | Average Earnings |
| Male | 52 (57.1%) | $41,071 |
| Female | 39 (42.9%) | $0 |
| Total | 91 (100.0%) | $40,446 |
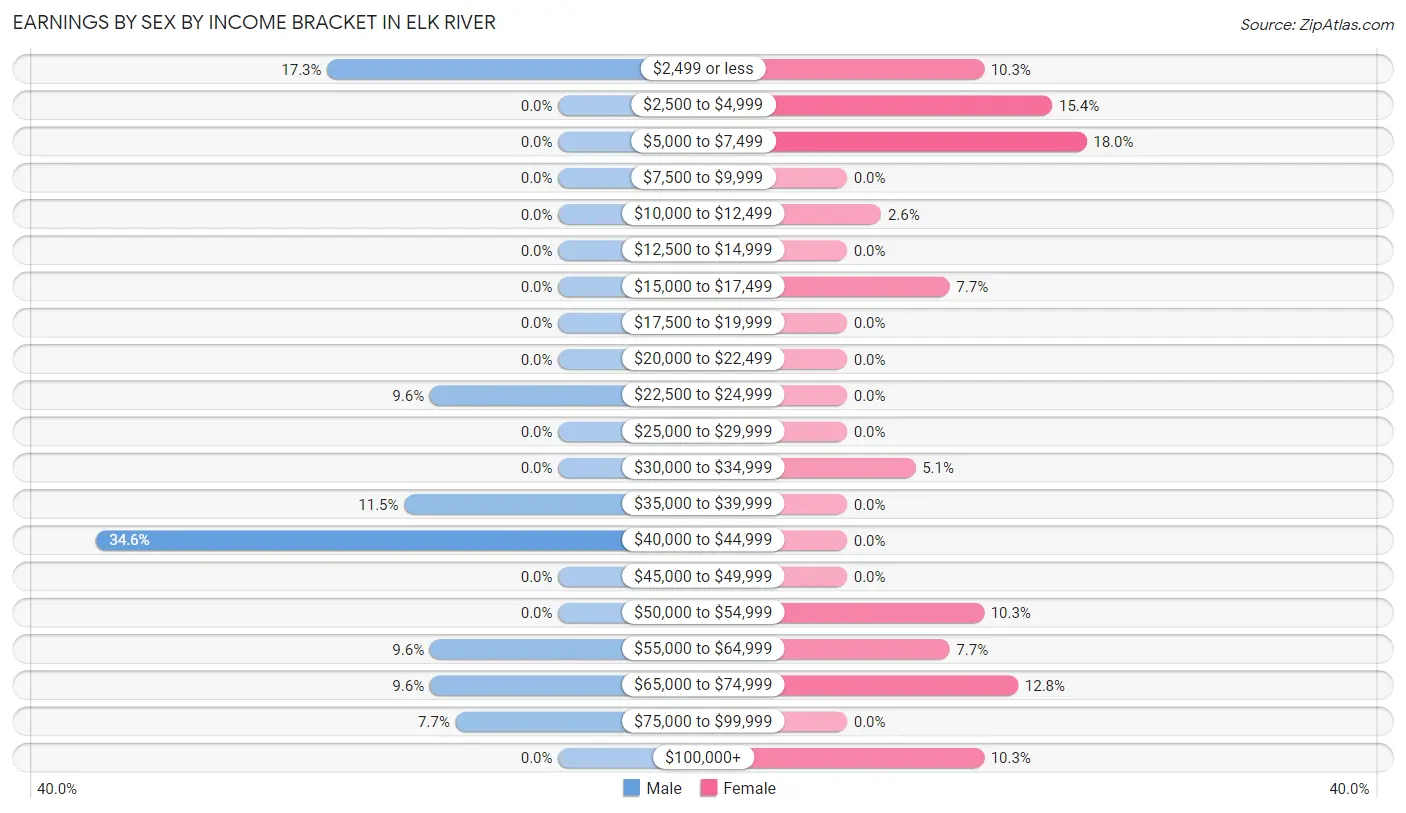
Earnings by Sex by Income Bracket in Elk River
The most common earnings brackets in Elk River are $40,000 to $44,999 for men (18 | 34.6%) and $5,000 to $7,499 for women (7 | 17.9%).
| Income | Male | Female |
| $2,499 or less | 9 (17.3%) | 4 (10.3%) |
| $2,500 to $4,999 | 0 (0.0%) | 6 (15.4%) |
| $5,000 to $7,499 | 0 (0.0%) | 7 (17.9%) |
| $7,500 to $9,999 | 0 (0.0%) | 0 (0.0%) |
| $10,000 to $12,499 | 0 (0.0%) | 1 (2.6%) |
| $12,500 to $14,999 | 0 (0.0%) | 0 (0.0%) |
| $15,000 to $17,499 | 0 (0.0%) | 3 (7.7%) |
| $17,500 to $19,999 | 0 (0.0%) | 0 (0.0%) |
| $20,000 to $22,499 | 0 (0.0%) | 0 (0.0%) |
| $22,500 to $24,999 | 5 (9.6%) | 0 (0.0%) |
| $25,000 to $29,999 | 0 (0.0%) | 0 (0.0%) |
| $30,000 to $34,999 | 0 (0.0%) | 2 (5.1%) |
| $35,000 to $39,999 | 6 (11.5%) | 0 (0.0%) |
| $40,000 to $44,999 | 18 (34.6%) | 0 (0.0%) |
| $45,000 to $49,999 | 0 (0.0%) | 0 (0.0%) |
| $50,000 to $54,999 | 0 (0.0%) | 4 (10.3%) |
| $55,000 to $64,999 | 5 (9.6%) | 3 (7.7%) |
| $65,000 to $74,999 | 5 (9.6%) | 5 (12.8%) |
| $75,000 to $99,999 | 4 (7.7%) | 0 (0.0%) |
| $100,000+ | 0 (0.0%) | 4 (10.3%) |
| Total | 52 (100.0%) | 39 (100.0%) |
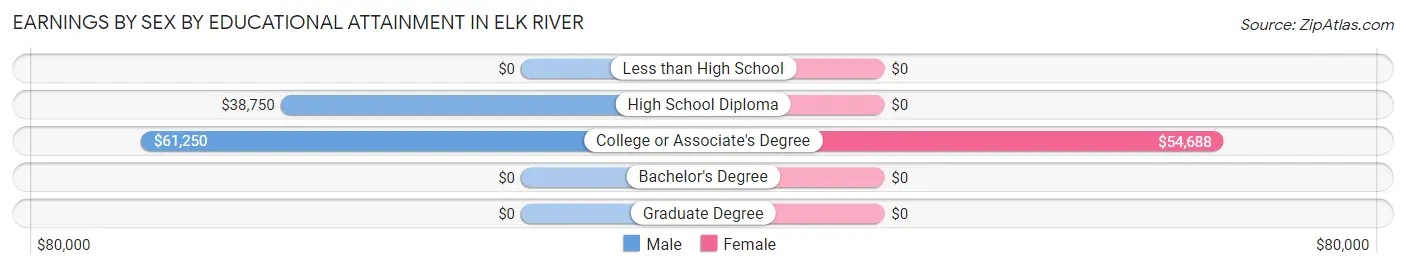
Earnings by Sex by Educational Attainment in Elk River
| Educational Attainment | Male Income | Female Income |
| Less than High School | - | - |
| High School Diploma | $38,750 | $0 |
| College or Associate's Degree | $61,250 | $54,688 |
| Bachelor's Degree | - | - |
| Graduate Degree | - | - |
| Total | $41,071 | $0 |
Family Income in Elk River
Family Income Brackets in Elk River
According to the Elk River family income data, there are 10 families falling into the $35,000 to $49,999 income range, which is the most common income bracket and makes up 23.3% of all families.
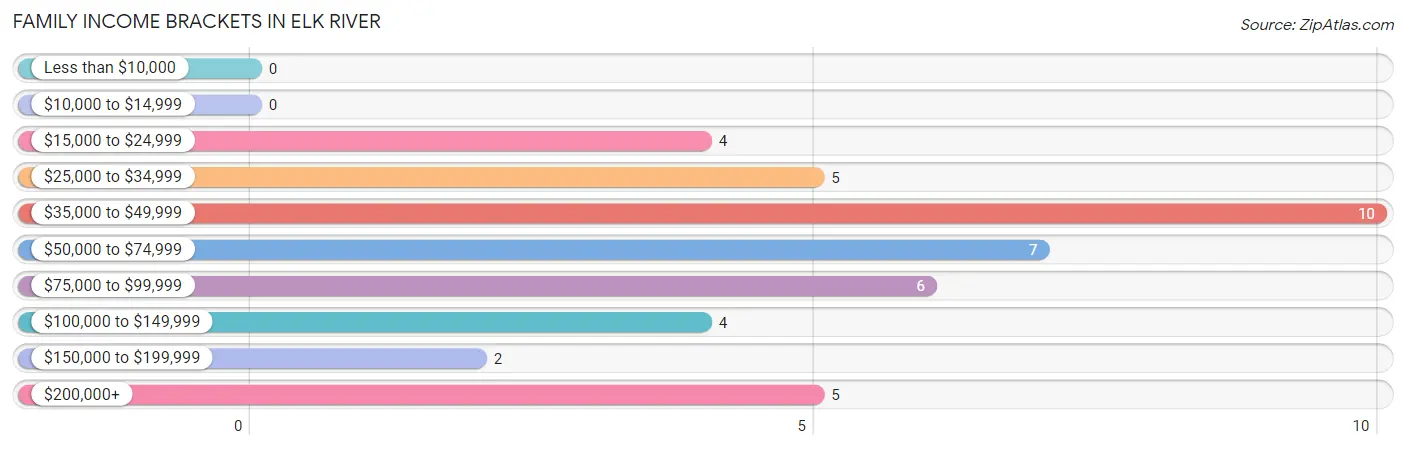
| Income Bracket | # Families | % Families |
| Less than $10,000 | 0 | 0.0% |
| $10,000 to $14,999 | 0 | 0.0% |
| $15,000 to $24,999 | 4 | 9.3% |
| $25,000 to $34,999 | 5 | 11.6% |
| $35,000 to $49,999 | 10 | 23.3% |
| $50,000 to $74,999 | 7 | 16.3% |
| $75,000 to $99,999 | 6 | 14.0% |
| $100,000 to $149,999 | 4 | 9.3% |
| $150,000 to $199,999 | 2 | 4.7% |
| $200,000+ | 5 | 11.6% |
Family Income by Famaliy Size in Elk River
4-person families (7 | 16.3%) account for the highest median family income in Elk River with $159,375 per family, while 4-person families (7 | 16.3%) have the highest median income of $39,844 per family member.
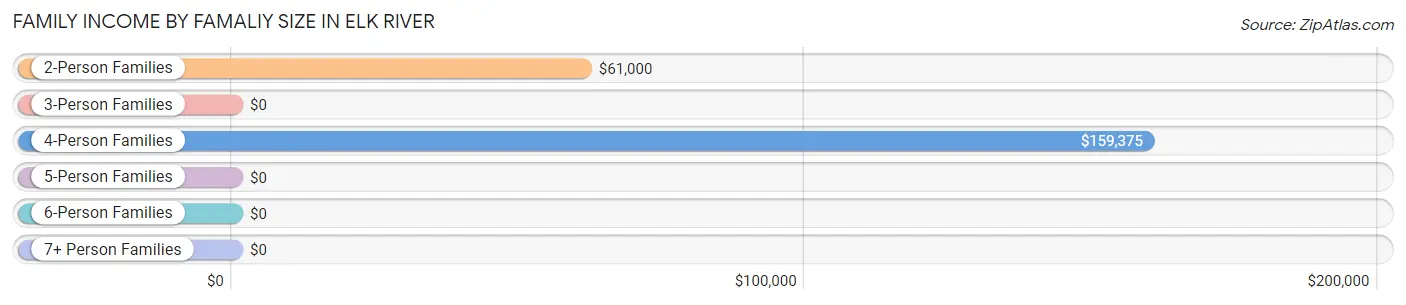
| Income Bracket | # Families | Median Income |
| 2-Person Families | 30 (69.8%) | $61,000 |
| 3-Person Families | 4 (9.3%) | $0 |
| 4-Person Families | 7 (16.3%) | $159,375 |
| 5-Person Families | 0 (0.0%) | $0 |
| 6-Person Families | 0 (0.0%) | $0 |
| 7+ Person Families | 2 (4.6%) | $0 |
| Total | 43 (100.0%) | $61,250 |
Family Income by Number of Earners in Elk River
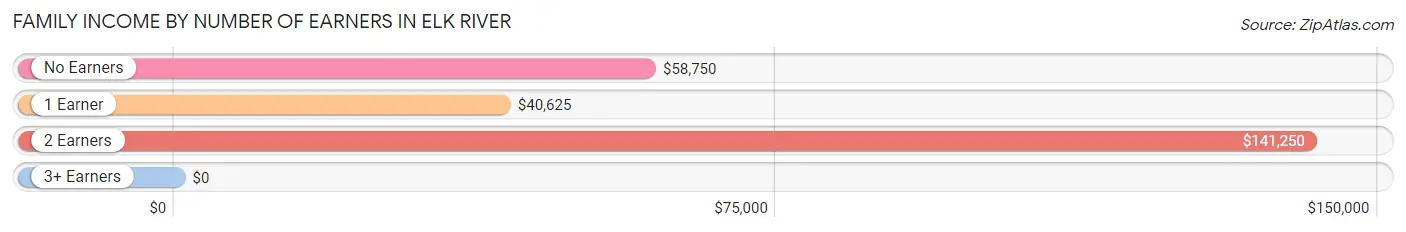
| Number of Earners | # Families | Median Income |
| No Earners | 6 (14.0%) | $58,750 |
| 1 Earner | 23 (53.5%) | $40,625 |
| 2 Earners | 14 (32.6%) | $141,250 |
| 3+ Earners | 0 (0.0%) | $0 |
| Total | 43 (100.0%) | $61,250 |
Household Income in Elk River
Household Income Brackets in Elk River
With 23 households falling in the category, the $50,000 to $74,999 income range is the most frequent in Elk River, accounting for 31.9% of all households.
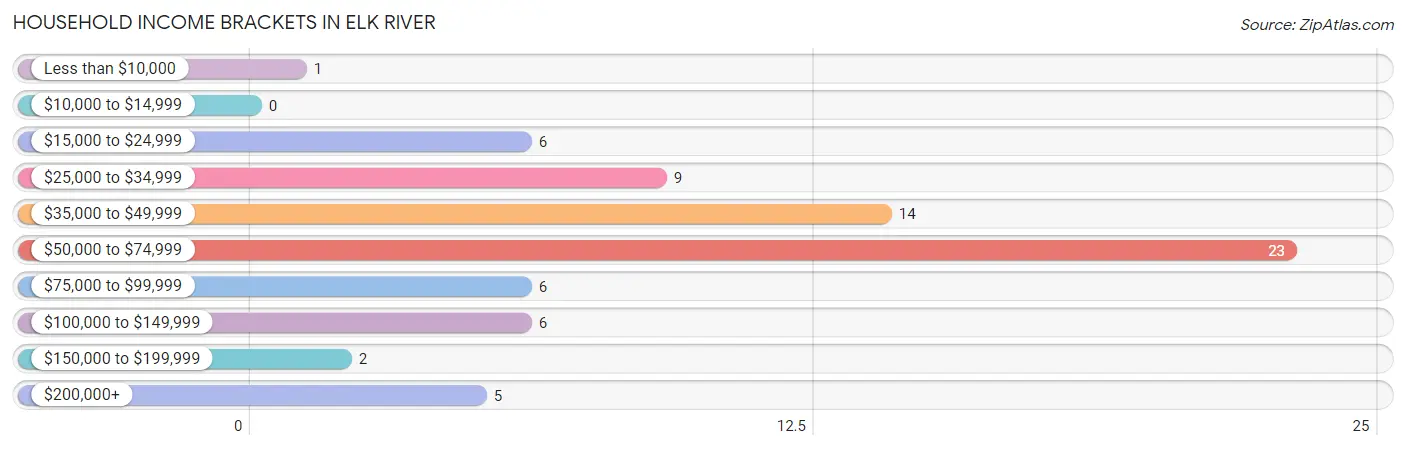
| Income Bracket | # Households | % Households |
| Less than $10,000 | 1 | 1.4% |
| $10,000 to $14,999 | 0 | 0.0% |
| $15,000 to $24,999 | 6 | 8.3% |
| $25,000 to $34,999 | 9 | 12.5% |
| $35,000 to $49,999 | 14 | 19.4% |
| $50,000 to $74,999 | 23 | 31.9% |
| $75,000 to $99,999 | 6 | 8.3% |
| $100,000 to $149,999 | 6 | 8.3% |
| $150,000 to $199,999 | 2 | 2.8% |
| $200,000+ | 5 | 6.9% |
Household Income by Householder Age in Elk River
The median household income in Elk River is $51,250, with the highest median household income of $91,250 found in the 25 to 44 years age bracket for the primary householder. A total of 6 households (8.3%) fall into this category.
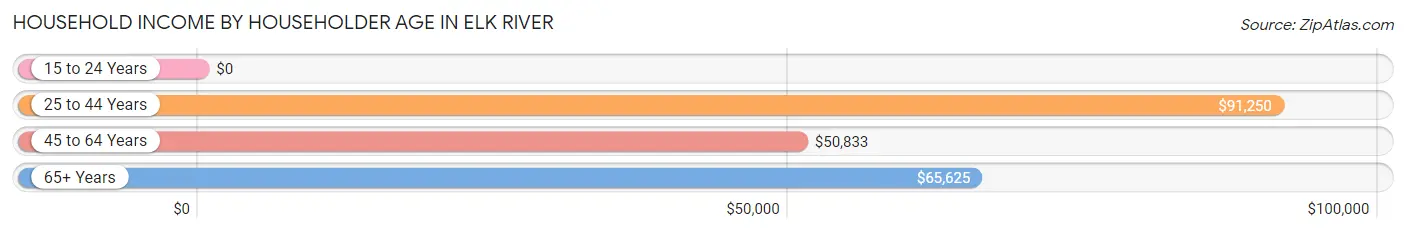
| Income Bracket | # Households | Median Income |
| 15 to 24 Years | 0 (0.0%) | $0 |
| 25 to 44 Years | 6 (8.3%) | $91,250 |
| 45 to 64 Years | 40 (55.6%) | $50,833 |
| 65+ Years | 26 (36.1%) | $65,625 |
| Total | 72 (100.0%) | $51,250 |
Poverty in Elk River
Income Below Poverty by Sex and Age in Elk River
With 28.6% poverty level for males and 18.2% for females among the residents of Elk River, under 5 year old males and 12 to 14 year old females are the most vulnerable to poverty, with 2 males (100.0%) and 3 females (100.0%) in their respective age groups living below the poverty level.
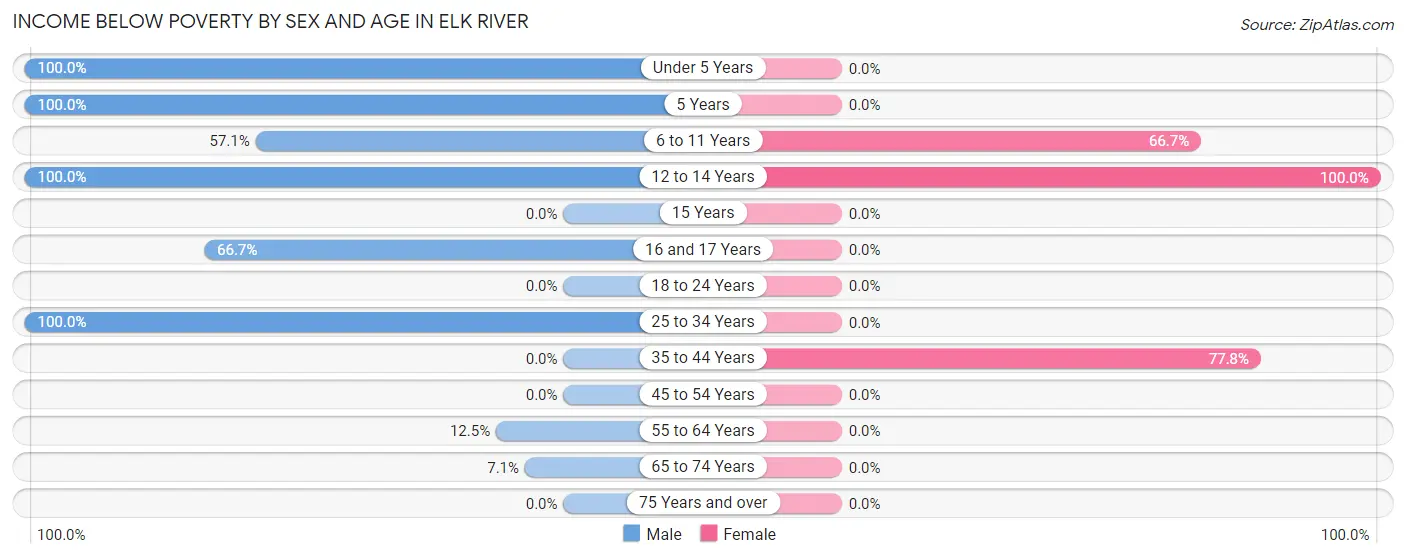
| Age Bracket | Male | Female |
| Under 5 Years | 2 (100.0%) | 0 (0.0%) |
| 5 Years | 2 (100.0%) | 0 (0.0%) |
| 6 to 11 Years | 4 (57.1%) | 2 (66.7%) |
| 12 to 14 Years | 4 (100.0%) | 3 (100.0%) |
| 15 Years | 0 (0.0%) | 0 (0.0%) |
| 16 and 17 Years | 2 (66.7%) | 0 (0.0%) |
| 18 to 24 Years | 0 (0.0%) | 0 (0.0%) |
| 25 to 34 Years | 9 (100.0%) | 0 (0.0%) |
| 35 to 44 Years | 0 (0.0%) | 7 (77.8%) |
| 45 to 54 Years | 0 (0.0%) | 0 (0.0%) |
| 55 to 64 Years | 4 (12.5%) | 0 (0.0%) |
| 65 to 74 Years | 1 (7.1%) | 0 (0.0%) |
| 75 Years and over | 0 (0.0%) | 0 (0.0%) |
| Total | 28 (28.6%) | 12 (18.2%) |
Income Above Poverty by Sex and Age in Elk River
According to the poverty statistics in Elk River, males aged 35 to 44 years and females aged 45 to 54 years are the age groups that are most secure financially, with 100.0% of males and 100.0% of females in these age groups living above the poverty line.
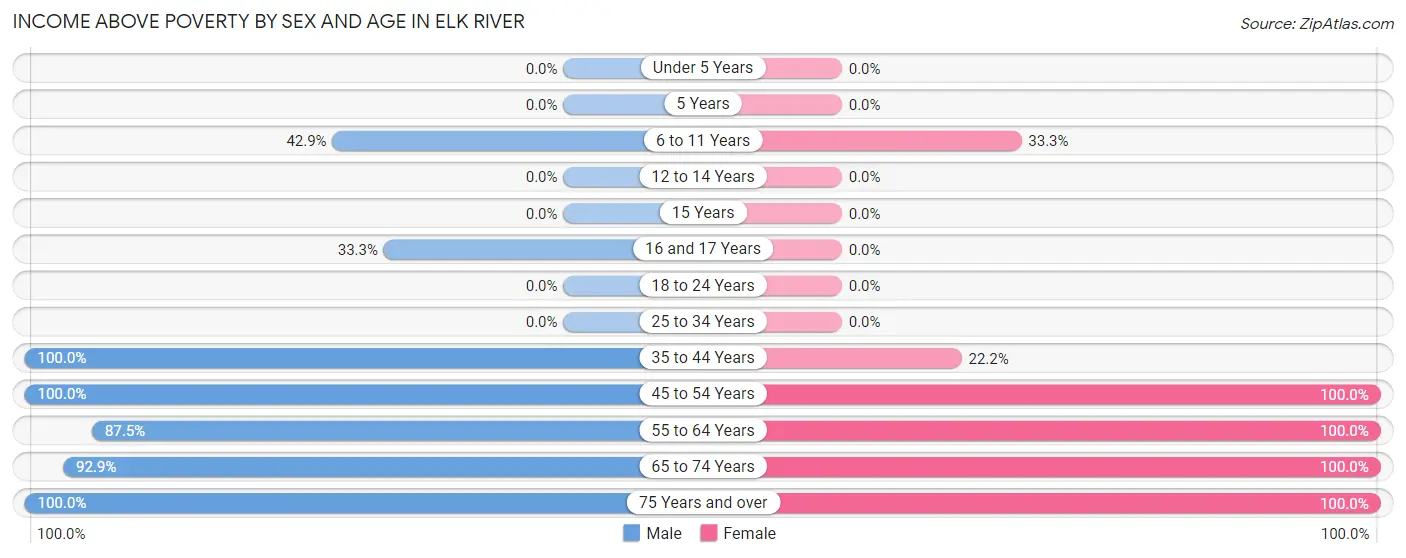
| Age Bracket | Male | Female |
| Under 5 Years | 0 (0.0%) | 0 (0.0%) |
| 5 Years | 0 (0.0%) | 0 (0.0%) |
| 6 to 11 Years | 3 (42.9%) | 1 (33.3%) |
| 12 to 14 Years | 0 (0.0%) | 0 (0.0%) |
| 15 Years | 0 (0.0%) | 0 (0.0%) |
| 16 and 17 Years | 1 (33.3%) | 0 (0.0%) |
| 18 to 24 Years | 0 (0.0%) | 0 (0.0%) |
| 25 to 34 Years | 0 (0.0%) | 0 (0.0%) |
| 35 to 44 Years | 2 (100.0%) | 2 (22.2%) |
| 45 to 54 Years | 11 (100.0%) | 6 (100.0%) |
| 55 to 64 Years | 28 (87.5%) | 25 (100.0%) |
| 65 to 74 Years | 13 (92.9%) | 12 (100.0%) |
| 75 Years and over | 12 (100.0%) | 8 (100.0%) |
| Total | 70 (71.4%) | 54 (81.8%) |
Income Below Poverty Among Married-Couple Families in Elk River
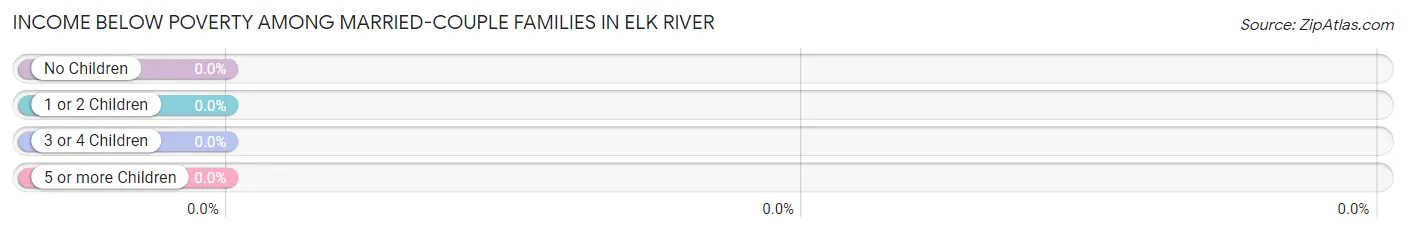
| Children | Above Poverty | Below Poverty |
| No Children | 33 (100.0%) | 0 (0.0%) |
| 1 or 2 Children | 2 (100.0%) | 0 (0.0%) |
| 3 or 4 Children | 0 (0.0%) | 0 (0.0%) |
| 5 or more Children | 0 (0.0%) | 0 (0.0%) |
| Total | 35 (100.0%) | 0 (0.0%) |
Income Below Poverty Among Single-Parent Households in Elk River
According to the poverty data in Elk River, 100.0% or 4 single-father households and 50.0% or 2 single-mother households are living below the poverty line. Among single-father households, those with 1 or 2 children have the highest poverty rate, with 4 households (100.0%) experiencing poverty. Likewise, among single-mother households, those with 5 or more children have the highest poverty rate, with 2 households (100.0%) falling below the poverty line.
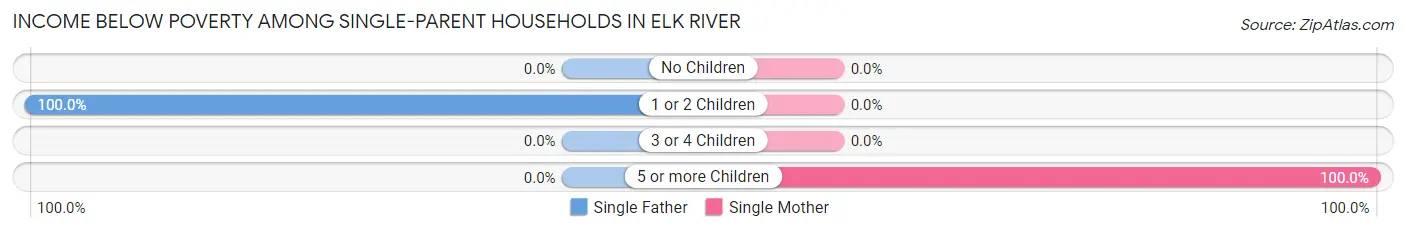
| Children | Single Father | Single Mother |
| No Children | 0 (0.0%) | 0 (0.0%) |
| 1 or 2 Children | 4 (100.0%) | 0 (0.0%) |
| 3 or 4 Children | 0 (0.0%) | 0 (0.0%) |
| 5 or more Children | 0 (0.0%) | 2 (100.0%) |
| Total | 4 (100.0%) | 2 (50.0%) |
Income Below Poverty Among Married-Couple vs Single-Parent Households in Elk River
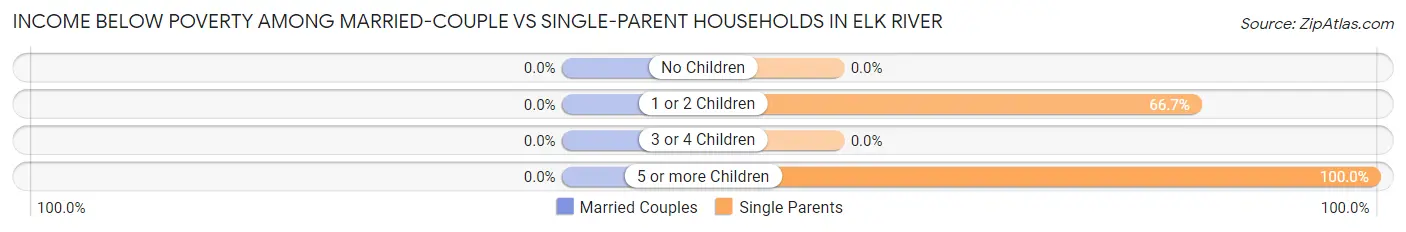
| Children | Married-Couple Families | Single-Parent Households |
| No Children | 0 (0.0%) | 0 (0.0%) |
| 1 or 2 Children | 0 (0.0%) | 4 (66.7%) |
| 3 or 4 Children | 0 (0.0%) | 0 (0.0%) |
| 5 or more Children | 0 (0.0%) | 2 (100.0%) |
| Total | 0 (0.0%) | 6 (75.0%) |
Race in Elk River
The most populous races in Elk River are White / Caucasian (162 | 98.8%), and Two or more Races (2 | 1.2%).
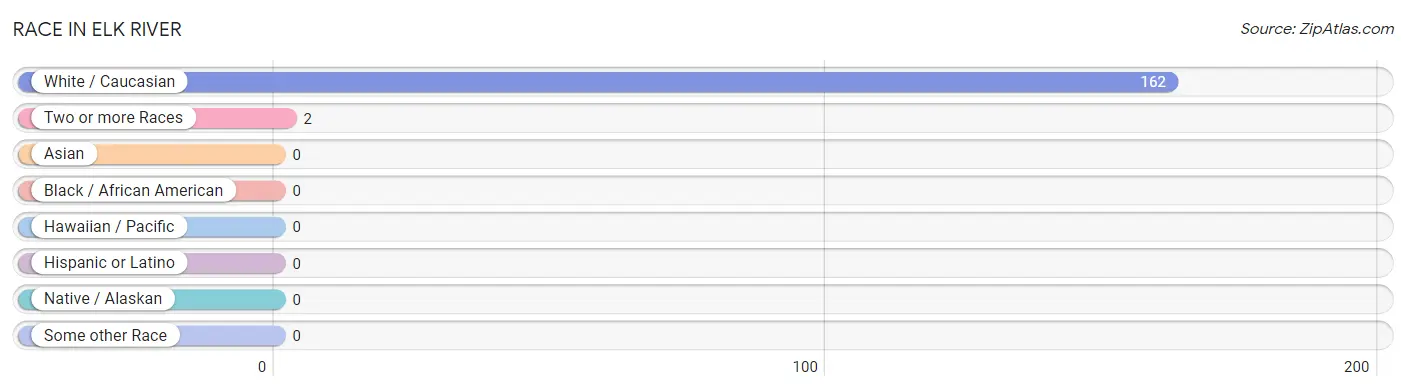
| Race | # Population | % Population |
| Asian | 0 | 0.0% |
| Black / African American | 0 | 0.0% |
| Hawaiian / Pacific | 0 | 0.0% |
| Hispanic or Latino | 0 | 0.0% |
| Native / Alaskan | 0 | 0.0% |
| White / Caucasian | 162 | 98.8% |
| Two or more Races | 2 | 1.2% |
| Some other Race | 0 | 0.0% |
| Total | 164 | 100.0% |
Ancestry in Elk River
The most populous ancestries reported in Elk River are American (33 | 20.1%), English (30 | 18.3%), Irish (16 | 9.8%), German (14 | 8.5%), and Swedish (9 | 5.5%), together accounting for 62.2% of all Elk River residents.
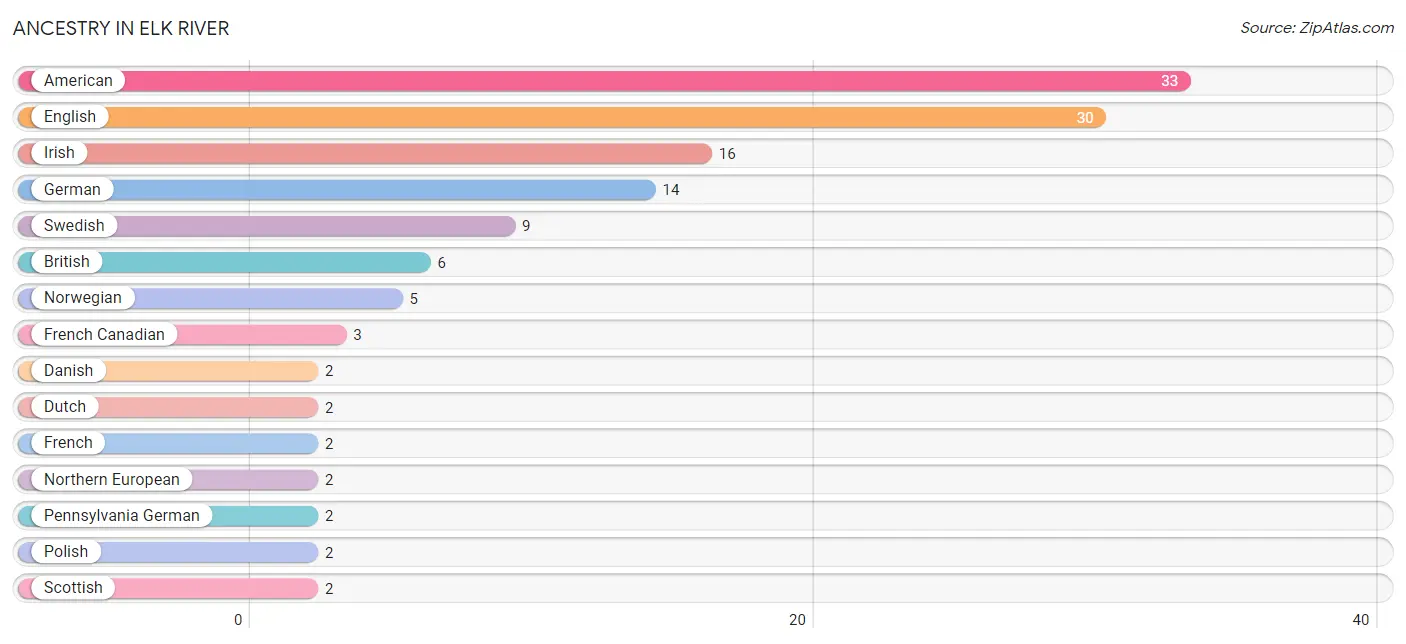
| Ancestry | # Population | % Population |
| American | 33 | 20.1% |
| British | 6 | 3.7% |
| Danish | 2 | 1.2% |
| Dutch | 2 | 1.2% |
| English | 30 | 18.3% |
| French | 2 | 1.2% |
| French Canadian | 3 | 1.8% |
| German | 14 | 8.5% |
| Irish | 16 | 9.8% |
| Northern European | 2 | 1.2% |
| Norwegian | 5 | 3.0% |
| Pennsylvania German | 2 | 1.2% |
| Polish | 2 | 1.2% |
| Scottish | 2 | 1.2% |
| Swedish | 9 | 5.5% | View All 15 Rows |
Immigrants in Elk River

| Immigration Origin | # Population | % Population | View All 0 Rows |
Sex and Age in Elk River
Sex and Age in Elk River
The most populous age groups in Elk River are 60 to 64 Years (19 | 19.4%) for men and 55 to 59 Years (17 | 25.8%) for women.
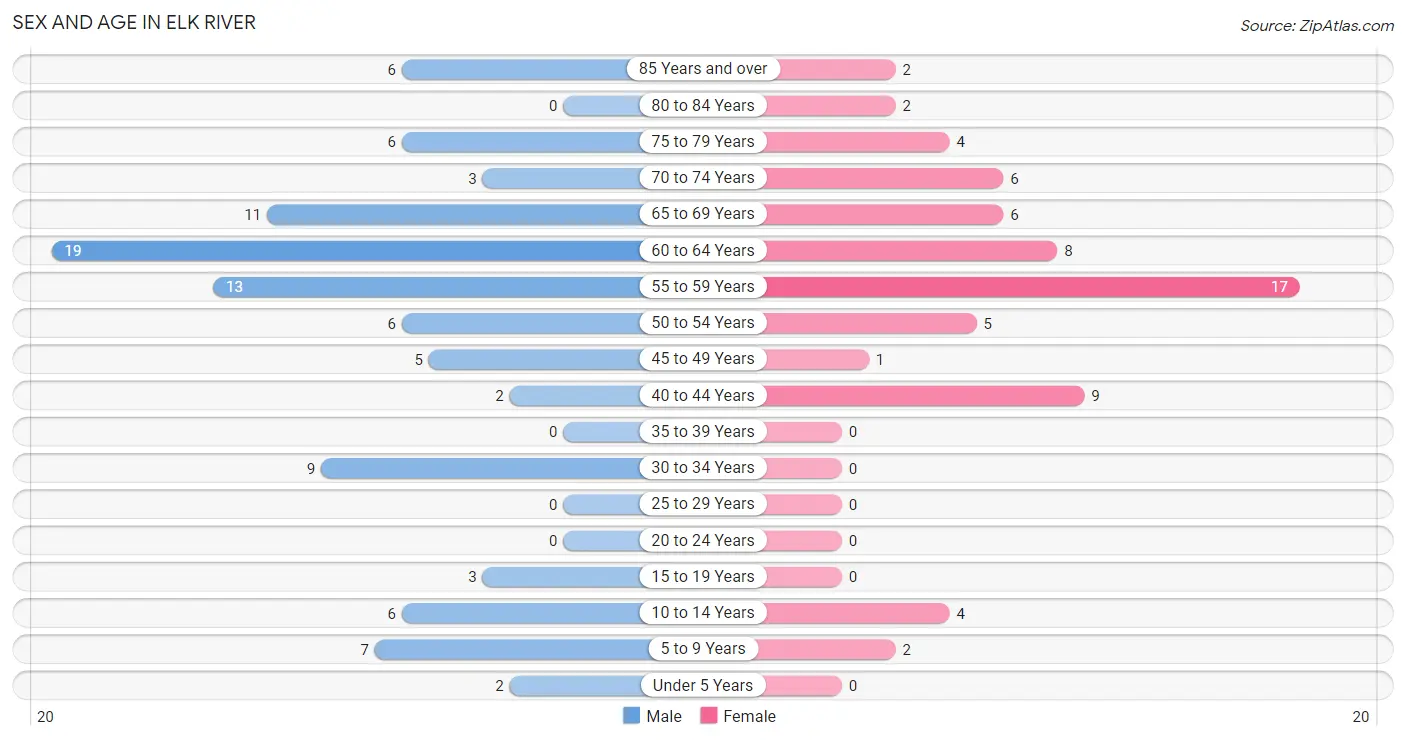
| Age Bracket | Male | Female |
| Under 5 Years | 2 (2.0%) | 0 (0.0%) |
| 5 to 9 Years | 7 (7.1%) | 2 (3.0%) |
| 10 to 14 Years | 6 (6.1%) | 4 (6.1%) |
| 15 to 19 Years | 3 (3.1%) | 0 (0.0%) |
| 20 to 24 Years | 0 (0.0%) | 0 (0.0%) |
| 25 to 29 Years | 0 (0.0%) | 0 (0.0%) |
| 30 to 34 Years | 9 (9.2%) | 0 (0.0%) |
| 35 to 39 Years | 0 (0.0%) | 0 (0.0%) |
| 40 to 44 Years | 2 (2.0%) | 9 (13.6%) |
| 45 to 49 Years | 5 (5.1%) | 1 (1.5%) |
| 50 to 54 Years | 6 (6.1%) | 5 (7.6%) |
| 55 to 59 Years | 13 (13.3%) | 17 (25.8%) |
| 60 to 64 Years | 19 (19.4%) | 8 (12.1%) |
| 65 to 69 Years | 11 (11.2%) | 6 (9.1%) |
| 70 to 74 Years | 3 (3.1%) | 6 (9.1%) |
| 75 to 79 Years | 6 (6.1%) | 4 (6.1%) |
| 80 to 84 Years | 0 (0.0%) | 2 (3.0%) |
| 85 Years and over | 6 (6.1%) | 2 (3.0%) |
| Total | 98 (100.0%) | 66 (100.0%) |
Families and Households in Elk River
Median Family Size in Elk River
The median family size in Elk River is 3.02 persons per family, with single female/mother families (4 | 9.3%) accounting for the largest median family size of 7.25 persons per family. On the other hand, married-couple families (35 | 81.4%) represent the smallest median family size with 2.43 persons per family.
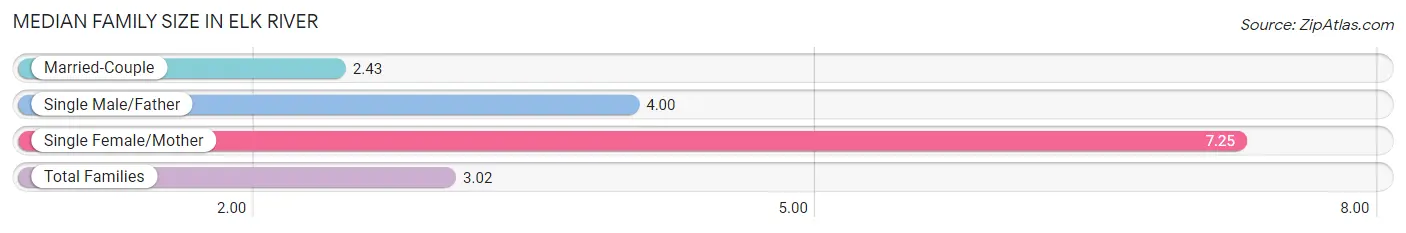
| Family Type | # Families | Family Size |
| Married-Couple | 35 (81.4%) | 2.43 |
| Single Male/Father | 4 (9.3%) | 4.00 |
| Single Female/Mother | 4 (9.3%) | 7.25 |
| Total Families | 43 (100.0%) | 3.02 |
Median Household Size in Elk River
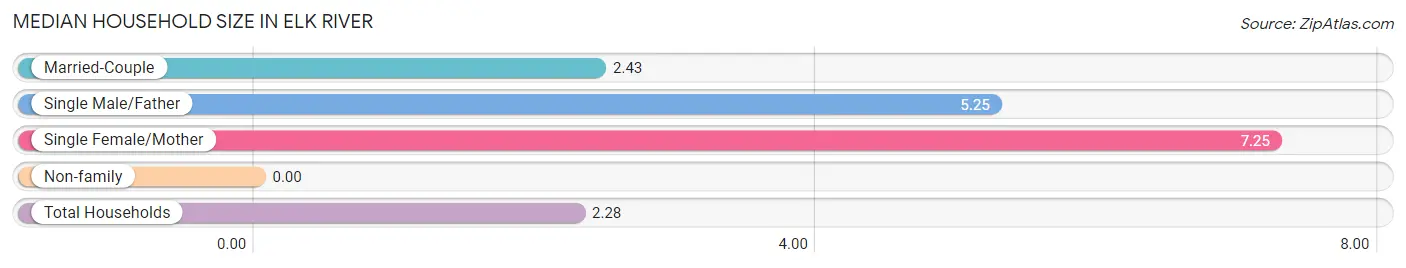
| Household Type | # Households | Household Size |
| Married-Couple | 35 (48.6%) | 2.43 |
| Single Male/Father | 4 (5.6%) | 5.25 |
| Single Female/Mother | 4 (5.6%) | 7.25 |
| Non-family | 29 (40.3%) | - |
| Total Households | 72 (100.0%) | 2.28 |
Household Size by Marriage Status in Elk River
Out of a total of 72 households in Elk River, 43 (59.7%) are family households, while 29 (40.3%) are nonfamily households. The most numerous type of family households are 2-person households, comprising 30, and the most common type of nonfamily households are 1-person households, comprising 29.
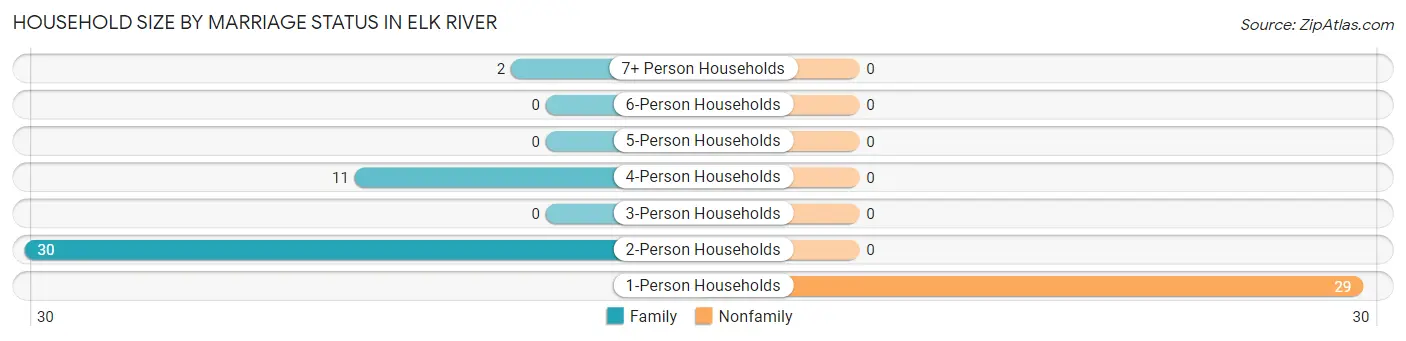
| Household Size | Family Households | Nonfamily Households |
| 1-Person Households | - | 29 (40.3%) |
| 2-Person Households | 30 (41.7%) | 0 (0.0%) |
| 3-Person Households | 0 (0.0%) | 0 (0.0%) |
| 4-Person Households | 11 (15.3%) | 0 (0.0%) |
| 5-Person Households | 0 (0.0%) | 0 (0.0%) |
| 6-Person Households | 0 (0.0%) | 0 (0.0%) |
| 7+ Person Households | 2 (2.8%) | 0 (0.0%) |
| Total | 43 (59.7%) | 29 (40.3%) |
Female Fertility in Elk River
Fertility by Age in Elk River
| Age Bracket | Women with Births | Births / 1,000 Women |
| 15 to 19 years | 0 (0.0%) | 0.0 |
| 20 to 34 years | 0 (0.0%) | 0.0 |
| 35 to 50 years | 0 (0.0%) | 0.0 |
| Total | 0 (0.0%) | 0.0 |
Fertility by Age by Marriage Status in Elk River
| Age Bracket | Married | Unmarried |
| 15 to 19 years | 0 (0.0%) | 0 (0.0%) |
| 20 to 34 years | 0 (0.0%) | 0 (0.0%) |
| 35 to 50 years | 0 (0.0%) | 0 (0.0%) |
| Total | 0 (0.0%) | 0 (0.0%) |
Fertility by Education in Elk River
| Educational Attainment | Women with Births | Births / 1,000 Women |
| Less than High School | 0 (0.0%) | 0.0 |
| High School Diploma | 0 (0.0%) | 0.0 |
| College or Associate's Degree | 0 (0.0%) | 0.0 |
| Bachelor's Degree | 0 (0.0%) | 0.0 |
| Graduate Degree | 0 (0.0%) | 0.0 |
| Total | 0 (0.0%) | 0.0 |
Fertility by Education by Marriage Status in Elk River
| Educational Attainment | Married | Unmarried |
| Less than High School | 0 (0.0%) | 0 (0.0%) |
| High School Diploma | 0 (0.0%) | 0 (0.0%) |
| College or Associate's Degree | 0 (0.0%) | 0 (0.0%) |
| Bachelor's Degree | 0 (0.0%) | 0 (0.0%) |
| Graduate Degree | 0 (0.0%) | 0 (0.0%) |
| Total | 0 (0.0%) | 0 (0.0%) |
Employment Characteristics in Elk River
Employment by Class of Employer in Elk River
Among the 62 employed individuals in Elk River, private company employees (34 | 54.8%), state government employees (12 | 19.4%), and local government employees (11 | 17.7%) make up the most common classes of employment.
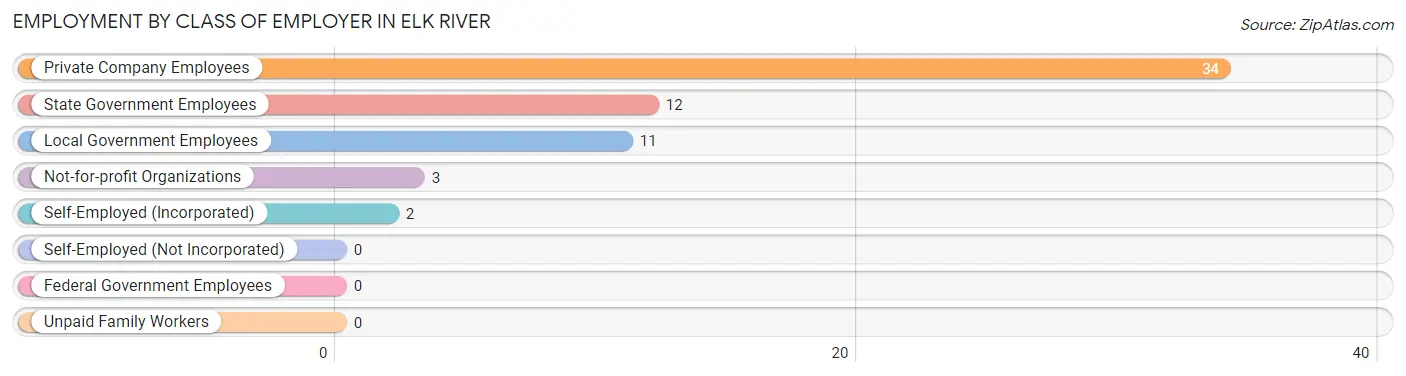
| Employer Class | # Employees | % Employees |
| Private Company Employees | 34 | 54.8% |
| Self-Employed (Incorporated) | 2 | 3.2% |
| Self-Employed (Not Incorporated) | 0 | 0.0% |
| Not-for-profit Organizations | 3 | 4.8% |
| Local Government Employees | 11 | 17.7% |
| State Government Employees | 12 | 19.4% |
| Federal Government Employees | 0 | 0.0% |
| Unpaid Family Workers | 0 | 0.0% |
| Total | 62 | 100.0% |
Employment Status by Age in Elk River
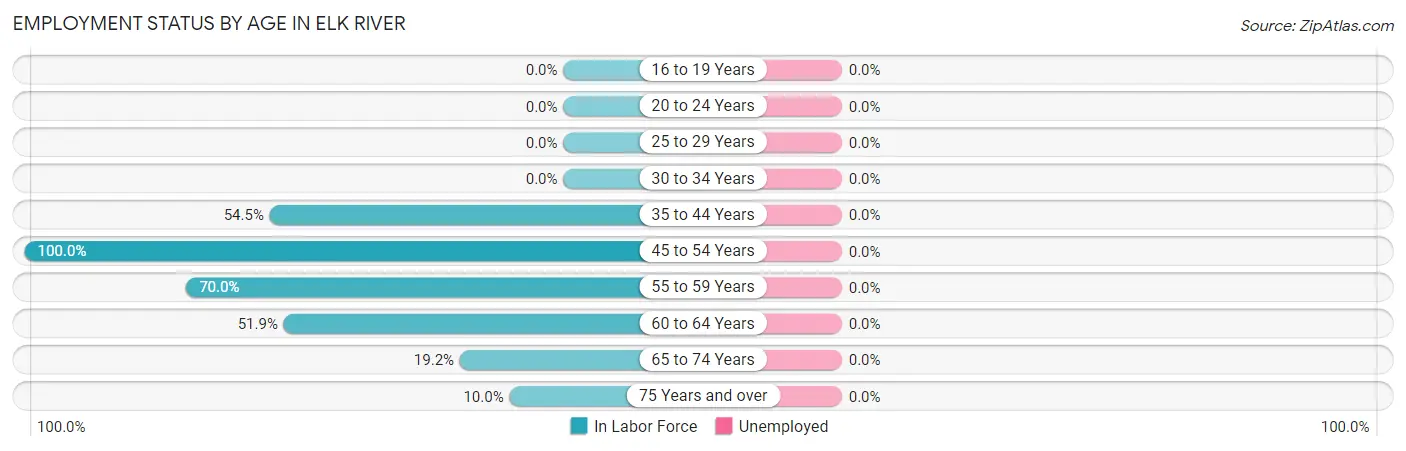
| Age Bracket | In Labor Force | Unemployed |
| 16 to 19 Years | 0 (0.0%) | 0 (0.0%) |
| 20 to 24 Years | 0 (0.0%) | 0 (0.0%) |
| 25 to 29 Years | 0 (0.0%) | 0 (0.0%) |
| 30 to 34 Years | 0 (0.0%) | 0 (0.0%) |
| 35 to 44 Years | 6 (54.5%) | 0 (0.0%) |
| 45 to 54 Years | 17 (100.0%) | 0 (0.0%) |
| 55 to 59 Years | 21 (70.0%) | 0 (0.0%) |
| 60 to 64 Years | 14 (51.9%) | 0 (0.0%) |
| 65 to 74 Years | 5 (19.2%) | 0 (0.0%) |
| 75 Years and over | 2 (10.0%) | 0 (0.0%) |
| Total | 65 (45.5%) | 0 (0.0%) |
Employment Status by Educational Attainment in Elk River
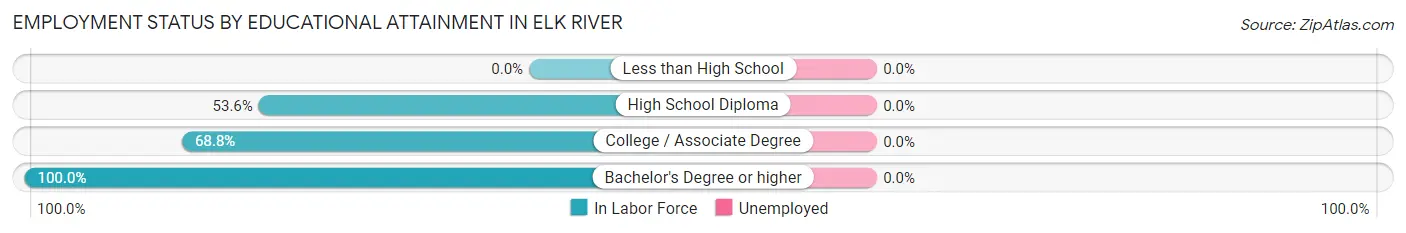
| Educational Attainment | In Labor Force | Unemployed |
| Less than High School | 0 (0.0%) | 0 (0.0%) |
| High School Diploma | 30 (53.6%) | 0 (0.0%) |
| College / Associate Degree | 22 (68.8%) | 0 (0.0%) |
| Bachelor's Degree or higher | 6 (100.0%) | 0 (0.0%) |
| Total | 58 (61.7%) | 0 (0.0%) |
Employment Occupations by Sex in Elk River
Management, Business, Science and Arts Occupations
The most common Management, Business, Science and Arts occupations in Elk River are Management (13 | 20.0%), Community & Social Service (2 | 3.1%), and Legal Services & Support (2 | 3.1%).
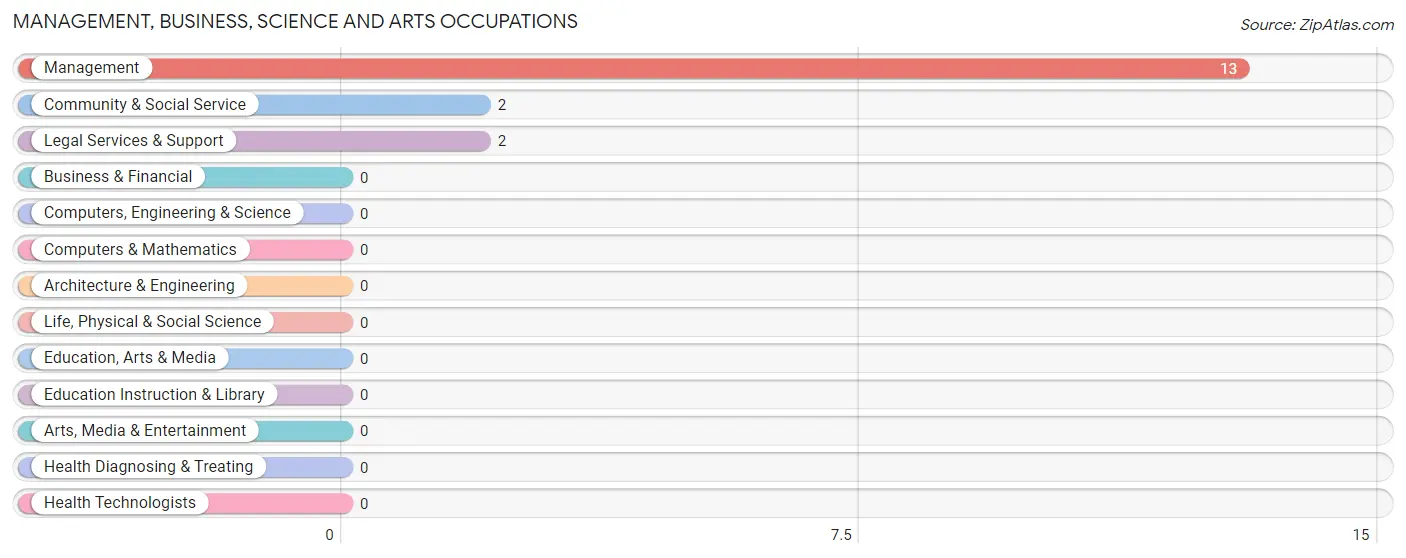
Management, Business, Science and Arts Occupations by Sex
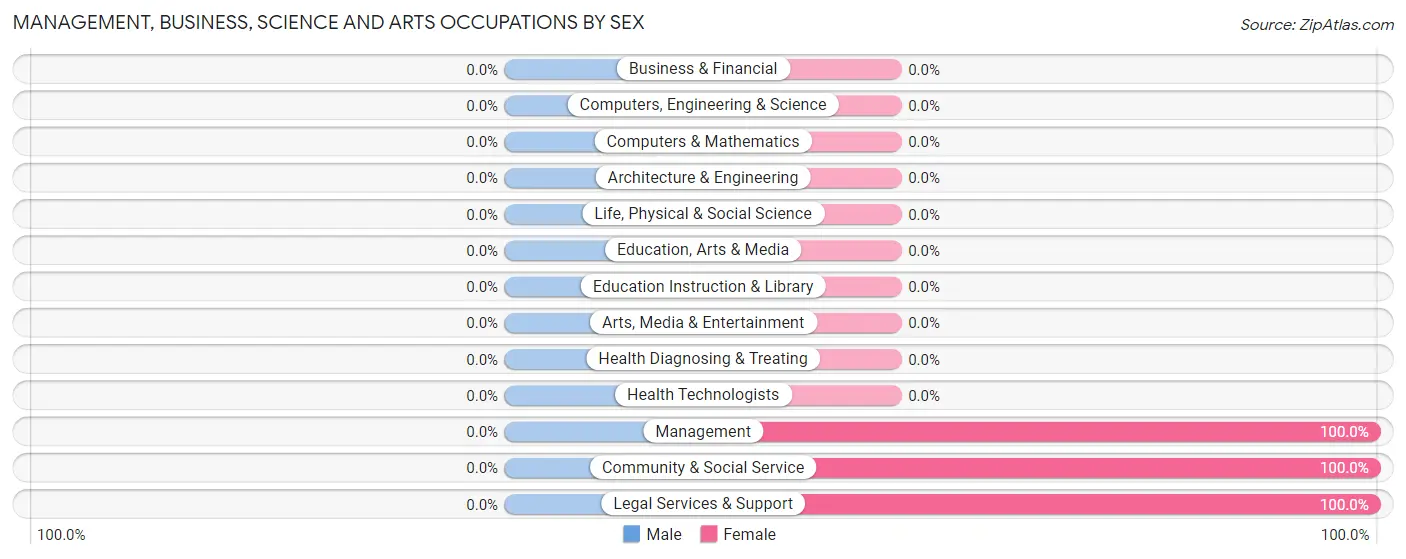
| Occupation | Male | Female |
| Management | 0 (0.0%) | 13 (100.0%) |
| Business & Financial | 0 (0.0%) | 0 (0.0%) |
| Computers, Engineering & Science | 0 (0.0%) | 0 (0.0%) |
| Computers & Mathematics | 0 (0.0%) | 0 (0.0%) |
| Architecture & Engineering | 0 (0.0%) | 0 (0.0%) |
| Life, Physical & Social Science | 0 (0.0%) | 0 (0.0%) |
| Community & Social Service | 0 (0.0%) | 2 (100.0%) |
| Education, Arts & Media | 0 (0.0%) | 0 (0.0%) |
| Legal Services & Support | 0 (0.0%) | 2 (100.0%) |
| Education Instruction & Library | 0 (0.0%) | 0 (0.0%) |
| Arts, Media & Entertainment | 0 (0.0%) | 0 (0.0%) |
| Health Diagnosing & Treating | 0 (0.0%) | 0 (0.0%) |
| Health Technologists | 0 (0.0%) | 0 (0.0%) |
| Total (Category) | 0 (0.0%) | 15 (100.0%) |
| Total (Overall) | 39 (60.0%) | 26 (40.0%) |
Services Occupations
The most common Services occupations in Elk River are Cleaning & Maintenance (4 | 6.1%), and Food Preparation & Serving (1 | 1.5%).
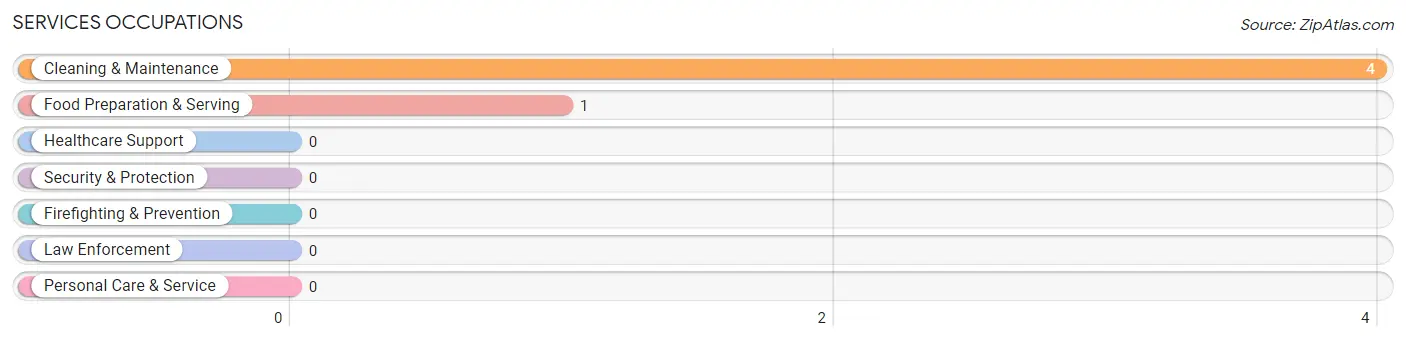
Services Occupations by Sex
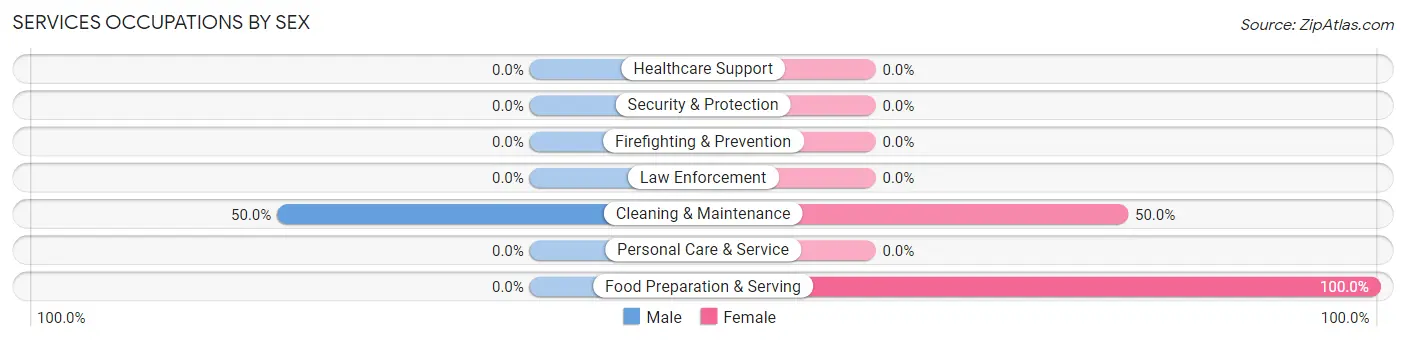
| Occupation | Male | Female |
| Healthcare Support | 0 (0.0%) | 0 (0.0%) |
| Security & Protection | 0 (0.0%) | 0 (0.0%) |
| Firefighting & Prevention | 0 (0.0%) | 0 (0.0%) |
| Law Enforcement | 0 (0.0%) | 0 (0.0%) |
| Food Preparation & Serving | 0 (0.0%) | 1 (100.0%) |
| Cleaning & Maintenance | 2 (50.0%) | 2 (50.0%) |
| Personal Care & Service | 0 (0.0%) | 0 (0.0%) |
| Total (Category) | 2 (40.0%) | 3 (60.0%) |
| Total (Overall) | 39 (60.0%) | 26 (40.0%) |
Sales and Office Occupations
The most common Sales and Office occupations in Elk River are , and Office & Administration (6 | 9.2%).

Sales and Office Occupations by Sex

| Occupation | Male | Female |
| Sales & Related | 0 (0.0%) | 0 (0.0%) |
| Office & Administration | 0 (0.0%) | 6 (100.0%) |
| Total (Category) | 0 (0.0%) | 6 (100.0%) |
| Total (Overall) | 39 (60.0%) | 26 (40.0%) |
Natural Resources, Construction and Maintenance Occupations
The most common Natural Resources, Construction and Maintenance occupations in Elk River are Installation, Maintenance & Repair (19 | 29.2%), and Construction & Extraction (3 | 4.6%).
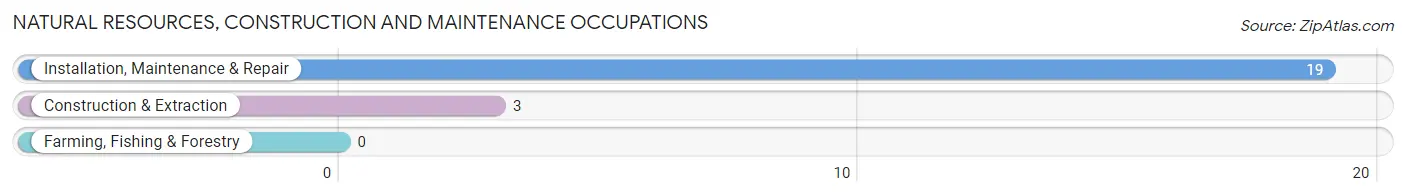
Natural Resources, Construction and Maintenance Occupations by Sex

| Occupation | Male | Female |
| Farming, Fishing & Forestry | 0 (0.0%) | 0 (0.0%) |
| Construction & Extraction | 3 (100.0%) | 0 (0.0%) |
| Installation, Maintenance & Repair | 19 (100.0%) | 0 (0.0%) |
| Total (Category) | 22 (100.0%) | 0 (0.0%) |
| Total (Overall) | 39 (60.0%) | 26 (40.0%) |
Production, Transportation and Moving Occupations
The most common Production, Transportation and Moving occupations in Elk River are Production (10 | 15.4%), Transportation (5 | 7.7%), and Material Moving (2 | 3.1%).
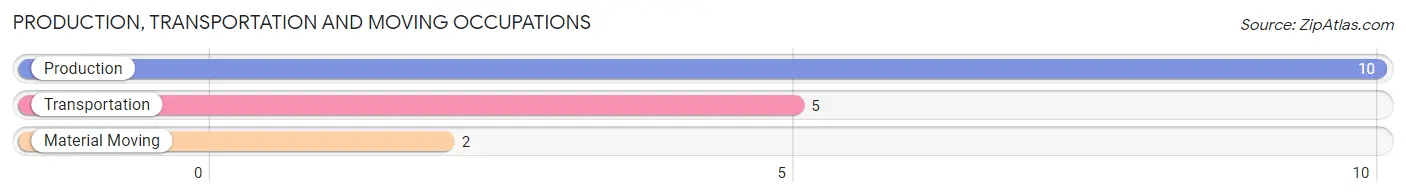
Production, Transportation and Moving Occupations by Sex
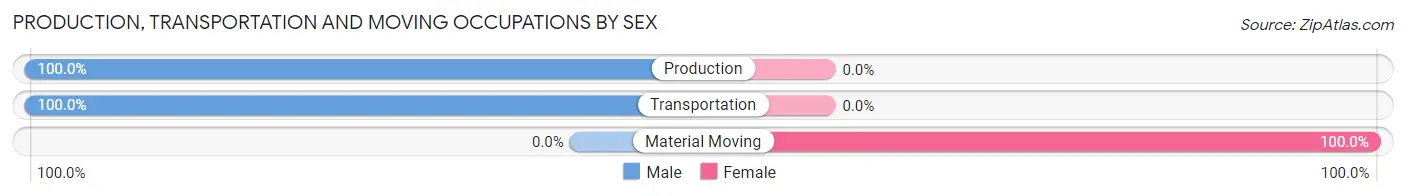
| Occupation | Male | Female |
| Production | 10 (100.0%) | 0 (0.0%) |
| Transportation | 5 (100.0%) | 0 (0.0%) |
| Material Moving | 0 (0.0%) | 2 (100.0%) |
| Total (Category) | 15 (88.2%) | 2 (11.8%) |
| Total (Overall) | 39 (60.0%) | 26 (40.0%) |
Employment Industries by Sex in Elk River
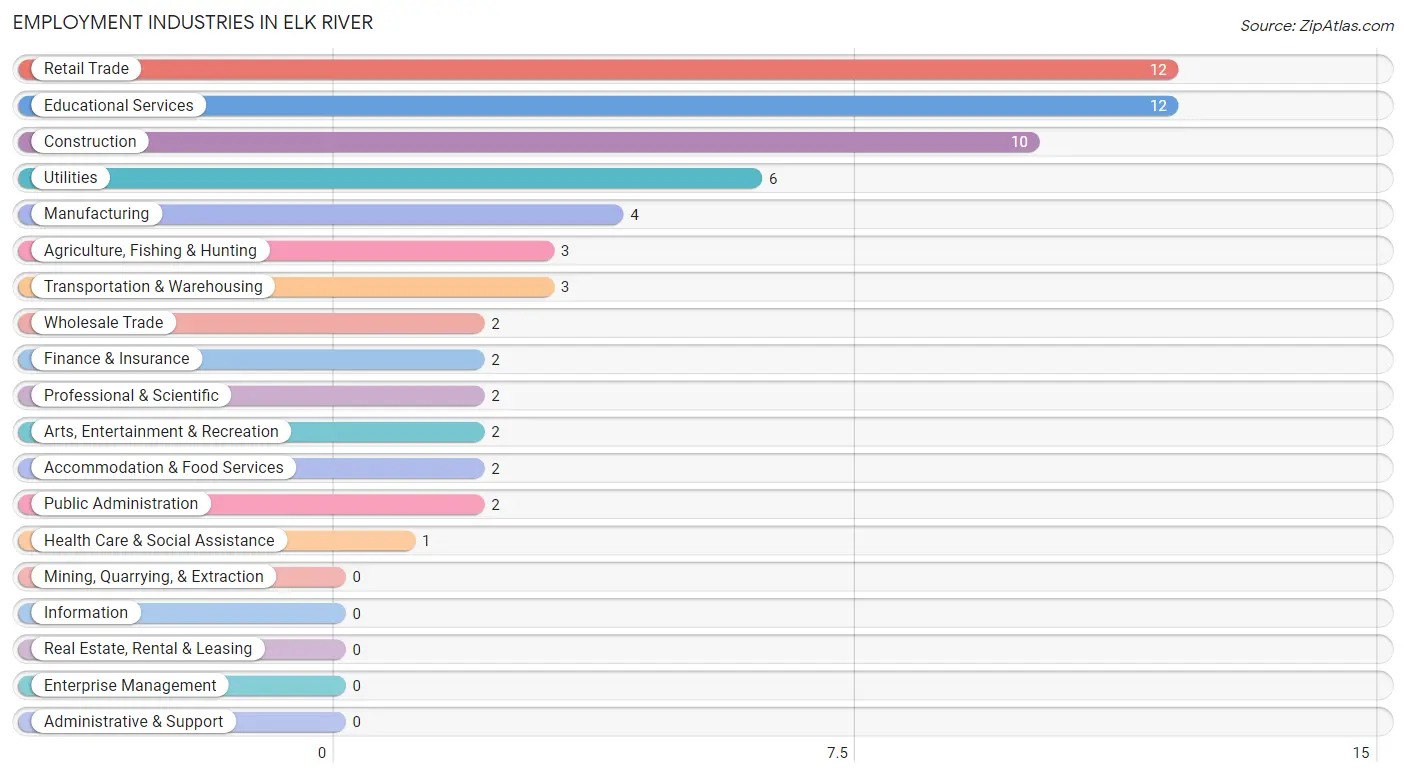
Employment Industries in Elk River
The major employment industries in Elk River include Retail Trade (12 | 18.5%), Educational Services (12 | 18.5%), Construction (10 | 15.4%), Utilities (6 | 9.2%), and Manufacturing (4 | 6.1%).
Employment Industries by Sex in Elk River
The Elk River industries that see more men than women are Construction (100.0%), Manufacturing (100.0%), and Wholesale Trade (100.0%), whereas the industries that tend to have a higher number of women are Agriculture, Fishing & Hunting (100.0%), Finance & Insurance (100.0%), and Professional & Scientific (100.0%).
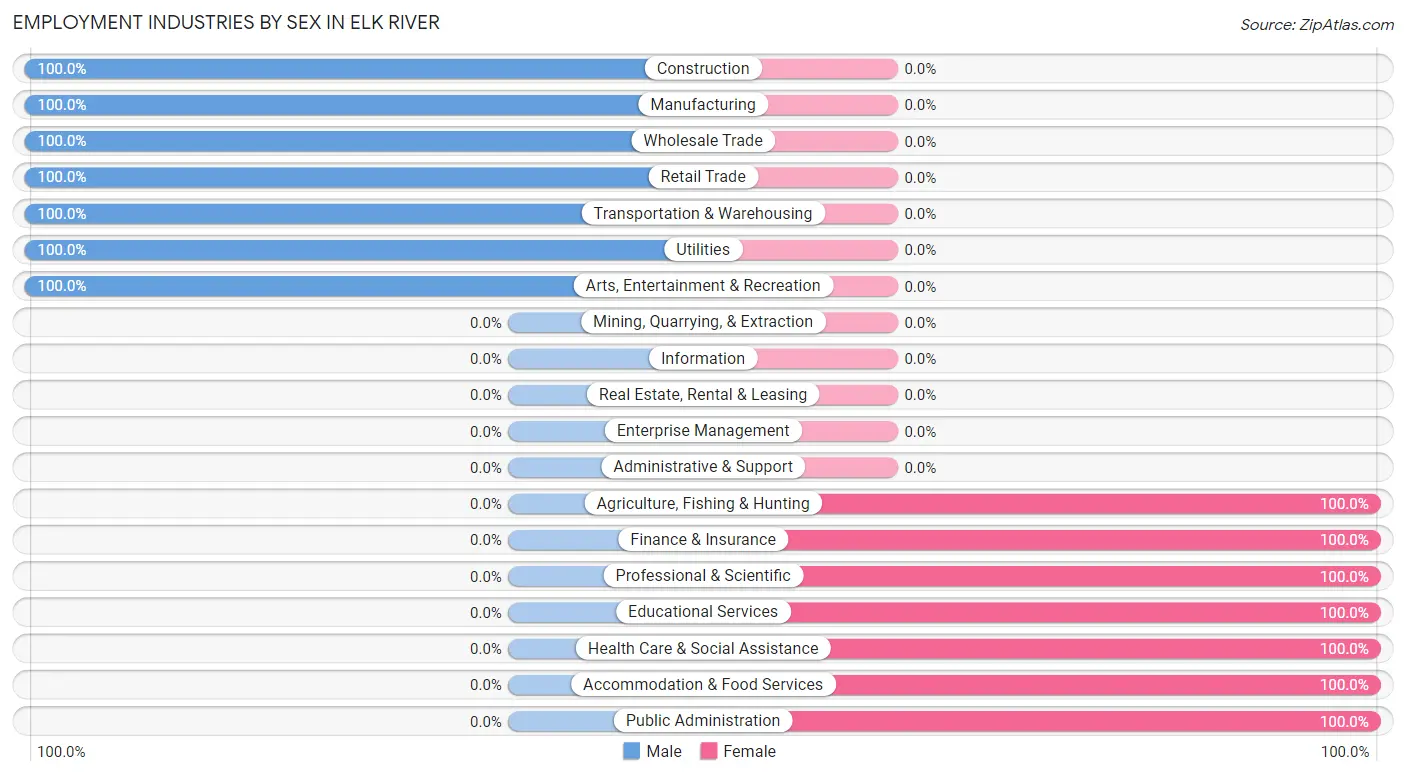
| Industry | Male | Female |
| Agriculture, Fishing & Hunting | 0 (0.0%) | 3 (100.0%) |
| Mining, Quarrying, & Extraction | 0 (0.0%) | 0 (0.0%) |
| Construction | 10 (100.0%) | 0 (0.0%) |
| Manufacturing | 4 (100.0%) | 0 (0.0%) |
| Wholesale Trade | 2 (100.0%) | 0 (0.0%) |
| Retail Trade | 12 (100.0%) | 0 (0.0%) |
| Transportation & Warehousing | 3 (100.0%) | 0 (0.0%) |
| Utilities | 6 (100.0%) | 0 (0.0%) |
| Information | 0 (0.0%) | 0 (0.0%) |
| Finance & Insurance | 0 (0.0%) | 2 (100.0%) |
| Real Estate, Rental & Leasing | 0 (0.0%) | 0 (0.0%) |
| Professional & Scientific | 0 (0.0%) | 2 (100.0%) |
| Enterprise Management | 0 (0.0%) | 0 (0.0%) |
| Administrative & Support | 0 (0.0%) | 0 (0.0%) |
| Educational Services | 0 (0.0%) | 12 (100.0%) |
| Health Care & Social Assistance | 0 (0.0%) | 1 (100.0%) |
| Arts, Entertainment & Recreation | 2 (100.0%) | 0 (0.0%) |
| Accommodation & Food Services | 0 (0.0%) | 2 (100.0%) |
| Public Administration | 0 (0.0%) | 2 (100.0%) |
| Total | 39 (60.0%) | 26 (40.0%) |
Education in Elk River
School Enrollment in Elk River
The most common levels of schooling among the 23 students in Elk River are middle school (8 | 34.8%), elementary school (5 | 21.7%), and college / undergraduate (3 | 13.0%).
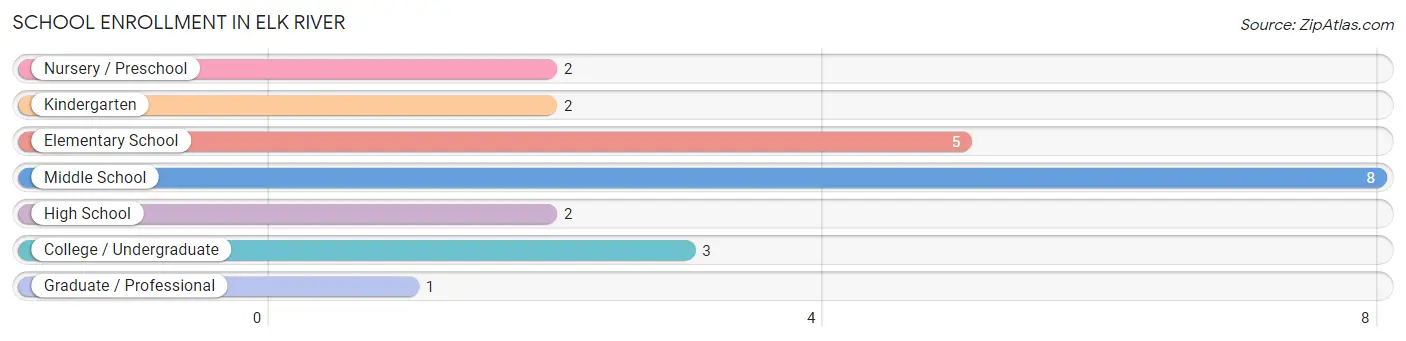
| School Level | # Students | % Students |
| Nursery / Preschool | 2 | 8.7% |
| Kindergarten | 2 | 8.7% |
| Elementary School | 5 | 21.7% |
| Middle School | 8 | 34.8% |
| High School | 2 | 8.7% |
| College / Undergraduate | 3 | 13.0% |
| Graduate / Professional | 1 | 4.3% |
| Total | 23 | 100.0% |
School Enrollment by Age by Funding Source in Elk River
Out of a total of 23 students who are enrolled in schools in Elk River, 4 (17.4%) attend a private institution, while the remaining 19 (82.6%) are enrolled in public schools. The age group of 5 to 9 year old has the highest likelihood of being enrolled in private schools, with 3 (33.3% in the age bracket) enrolled. Conversely, the age group of 10 to 14 year olds has the lowest likelihood of being enrolled in a private school, with 8 (100.0% in the age bracket) attending a public institution.
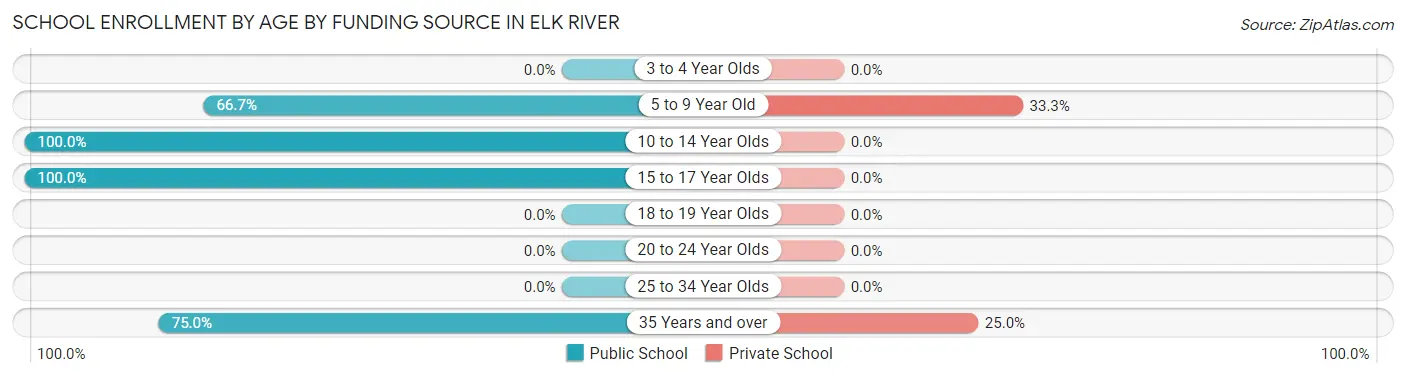
| Age Bracket | Public School | Private School |
| 3 to 4 Year Olds | 0 (0.0%) | 0 (0.0%) |
| 5 to 9 Year Old | 6 (66.7%) | 3 (33.3%) |
| 10 to 14 Year Olds | 8 (100.0%) | 0 (0.0%) |
| 15 to 17 Year Olds | 2 (100.0%) | 0 (0.0%) |
| 18 to 19 Year Olds | 0 (0.0%) | 0 (0.0%) |
| 20 to 24 Year Olds | 0 (0.0%) | 0 (0.0%) |
| 25 to 34 Year Olds | 0 (0.0%) | 0 (0.0%) |
| 35 Years and over | 3 (75.0%) | 1 (25.0%) |
| Total | 19 (82.6%) | 4 (17.4%) |
Educational Attainment by Field of Study in Elk River
Science & technology (4 | 36.4%), social sciences (3 | 27.3%), business (2 | 18.2%), bio, nature & agricultural (1 | 9.1%), and education (1 | 9.1%) are the most common fields of study among 11 individuals in Elk River who have obtained a bachelor's degree or higher.
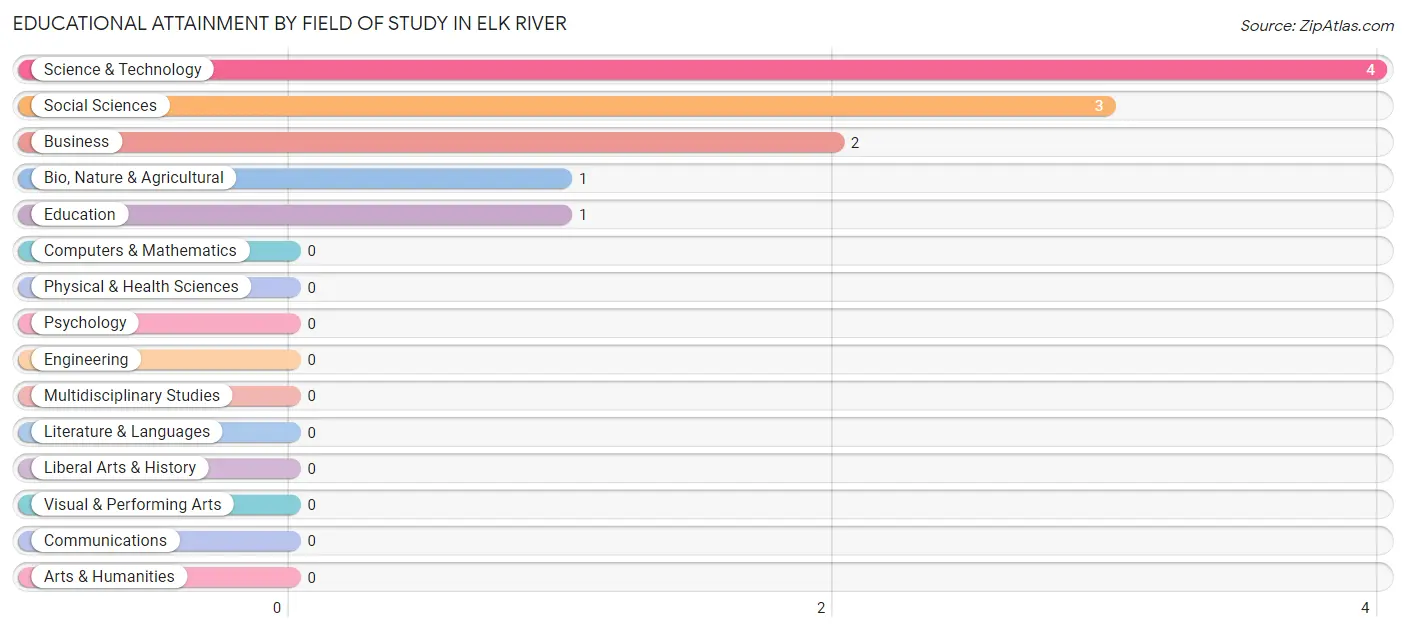
| Field of Study | # Graduates | % Graduates |
| Computers & Mathematics | 0 | 0.0% |
| Bio, Nature & Agricultural | 1 | 9.1% |
| Physical & Health Sciences | 0 | 0.0% |
| Psychology | 0 | 0.0% |
| Social Sciences | 3 | 27.3% |
| Engineering | 0 | 0.0% |
| Multidisciplinary Studies | 0 | 0.0% |
| Science & Technology | 4 | 36.4% |
| Business | 2 | 18.2% |
| Education | 1 | 9.1% |
| Literature & Languages | 0 | 0.0% |
| Liberal Arts & History | 0 | 0.0% |
| Visual & Performing Arts | 0 | 0.0% |
| Communications | 0 | 0.0% |
| Arts & Humanities | 0 | 0.0% |
| Total | 11 | 100.0% |
Transportation & Commute in Elk River
Vehicle Availability by Sex in Elk River
The most prevalent vehicle ownership categories in Elk River are males with 2 vehicles (25, accounting for 64.1%) and females with 2 vehicles (9, making up 108.7%).
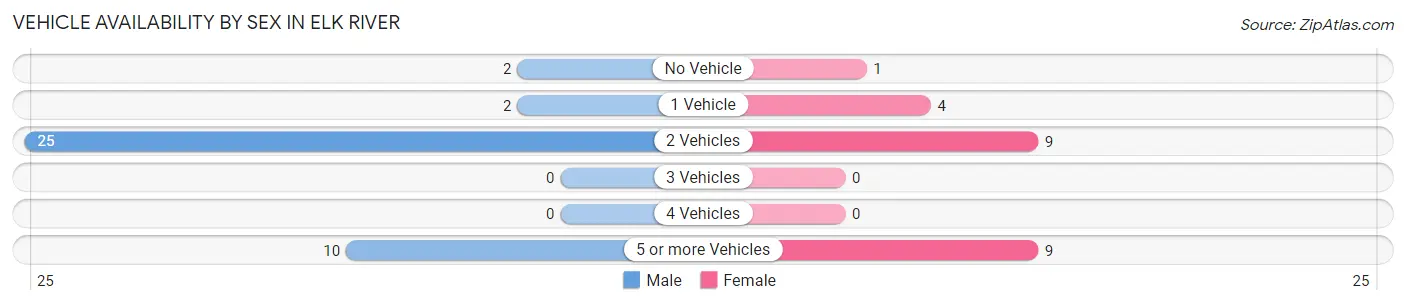
| Vehicles Available | Male | Female |
| No Vehicle | 2 (5.1%) | 1 (4.3%) |
| 1 Vehicle | 2 (5.1%) | 4 (17.4%) |
| 2 Vehicles | 25 (64.1%) | 9 (39.1%) |
| 3 Vehicles | 0 (0.0%) | 0 (0.0%) |
| 4 Vehicles | 0 (0.0%) | 0 (0.0%) |
| 5 or more Vehicles | 10 (25.6%) | 9 (39.1%) |
| Total | 39 (100.0%) | 23 (100.0%) |
Commute Time in Elk River
The most frequently occuring commute durations in Elk River are less than 5 minutes (19 commuters, 34.5%), 90 or more minutes (14 commuters, 25.5%), and 15 to 19 minutes (6 commuters, 10.9%).
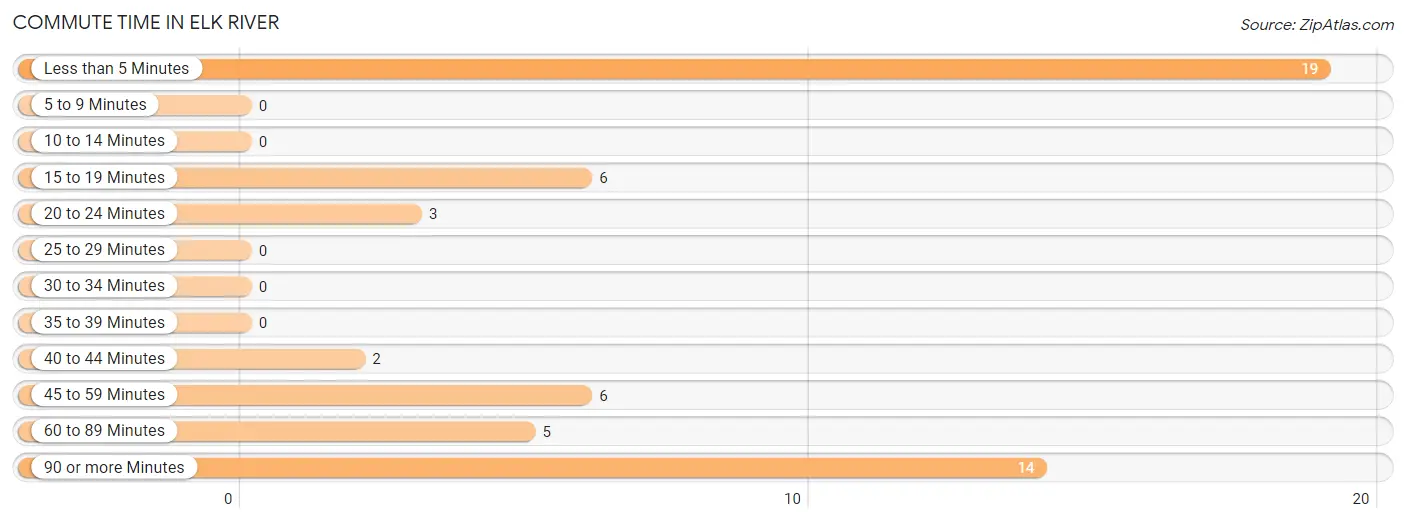
| Commute Time | # Commuters | % Commuters |
| Less than 5 Minutes | 19 | 34.5% |
| 5 to 9 Minutes | 0 | 0.0% |
| 10 to 14 Minutes | 0 | 0.0% |
| 15 to 19 Minutes | 6 | 10.9% |
| 20 to 24 Minutes | 3 | 5.4% |
| 25 to 29 Minutes | 0 | 0.0% |
| 30 to 34 Minutes | 0 | 0.0% |
| 35 to 39 Minutes | 0 | 0.0% |
| 40 to 44 Minutes | 2 | 3.6% |
| 45 to 59 Minutes | 6 | 10.9% |
| 60 to 89 Minutes | 5 | 9.1% |
| 90 or more Minutes | 14 | 25.5% |
Commute Time by Sex in Elk River
The most common commute times in Elk River are less than 5 minutes (15 commuters, 38.5%) for males and 90 or more minutes (9 commuters, 56.2%) for females.
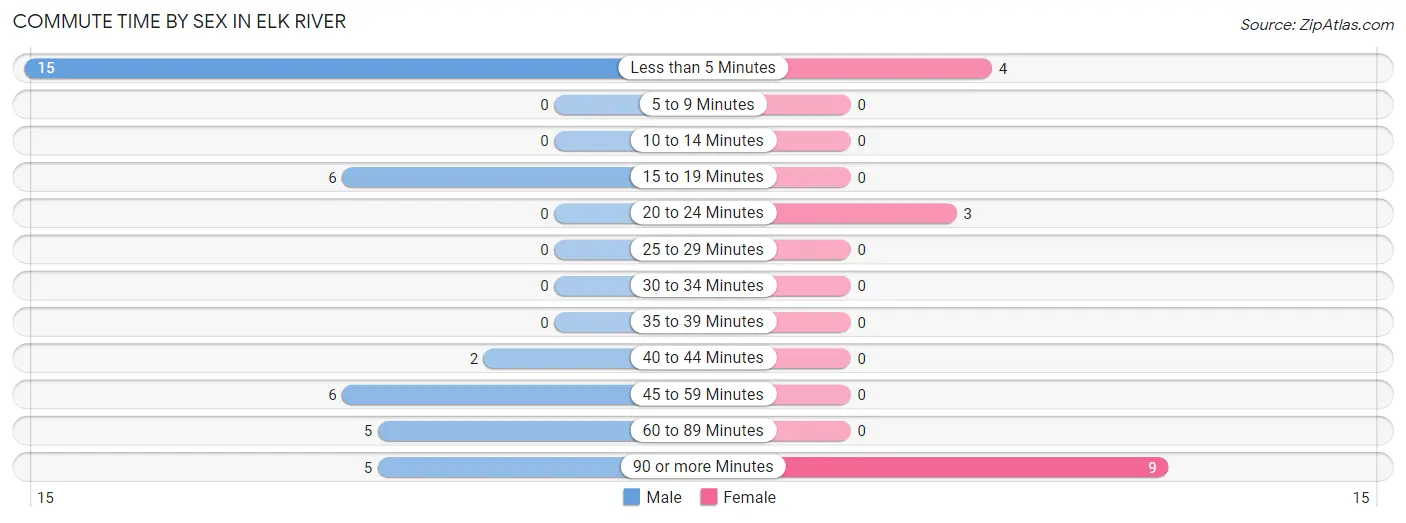
| Commute Time | Male | Female |
| Less than 5 Minutes | 15 (38.5%) | 4 (25.0%) |
| 5 to 9 Minutes | 0 (0.0%) | 0 (0.0%) |
| 10 to 14 Minutes | 0 (0.0%) | 0 (0.0%) |
| 15 to 19 Minutes | 6 (15.4%) | 0 (0.0%) |
| 20 to 24 Minutes | 0 (0.0%) | 3 (18.8%) |
| 25 to 29 Minutes | 0 (0.0%) | 0 (0.0%) |
| 30 to 34 Minutes | 0 (0.0%) | 0 (0.0%) |
| 35 to 39 Minutes | 0 (0.0%) | 0 (0.0%) |
| 40 to 44 Minutes | 2 (5.1%) | 0 (0.0%) |
| 45 to 59 Minutes | 6 (15.4%) | 0 (0.0%) |
| 60 to 89 Minutes | 5 (12.8%) | 0 (0.0%) |
| 90 or more Minutes | 5 (12.8%) | 9 (56.2%) |
Time of Departure to Work by Sex in Elk River
The most frequent times of departure to work in Elk River are 6:00 AM to 6:29 AM (16, 41.0%) for males and 6:00 AM to 6:29 AM (5, 31.2%) for females.
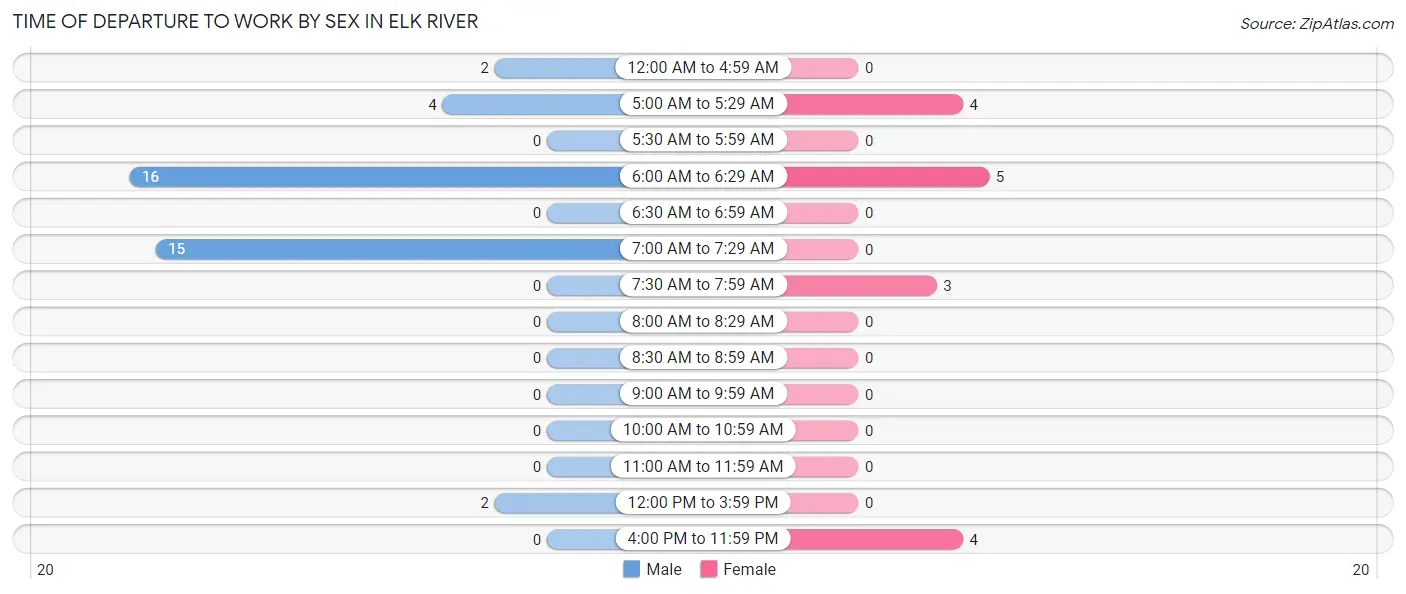
| Time of Departure | Male | Female |
| 12:00 AM to 4:59 AM | 2 (5.1%) | 0 (0.0%) |
| 5:00 AM to 5:29 AM | 4 (10.3%) | 4 (25.0%) |
| 5:30 AM to 5:59 AM | 0 (0.0%) | 0 (0.0%) |
| 6:00 AM to 6:29 AM | 16 (41.0%) | 5 (31.2%) |
| 6:30 AM to 6:59 AM | 0 (0.0%) | 0 (0.0%) |
| 7:00 AM to 7:29 AM | 15 (38.5%) | 0 (0.0%) |
| 7:30 AM to 7:59 AM | 0 (0.0%) | 3 (18.8%) |
| 8:00 AM to 8:29 AM | 0 (0.0%) | 0 (0.0%) |
| 8:30 AM to 8:59 AM | 0 (0.0%) | 0 (0.0%) |
| 9:00 AM to 9:59 AM | 0 (0.0%) | 0 (0.0%) |
| 10:00 AM to 10:59 AM | 0 (0.0%) | 0 (0.0%) |
| 11:00 AM to 11:59 AM | 0 (0.0%) | 0 (0.0%) |
| 12:00 PM to 3:59 PM | 2 (5.1%) | 0 (0.0%) |
| 4:00 PM to 11:59 PM | 0 (0.0%) | 4 (25.0%) |
| Total | 39 (100.0%) | 16 (100.0%) |
Housing Occupancy in Elk River
Occupancy by Ownership in Elk River
Of the total 72 dwellings in Elk River, owner-occupied units account for 67 (93.1%), while renter-occupied units make up 5 (6.9%).
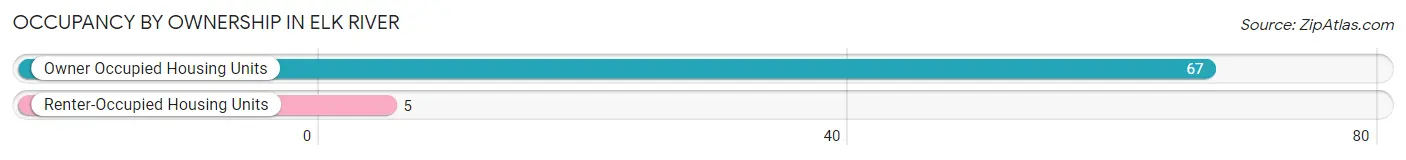
| Occupancy | # Housing Units | % Housing Units |
| Owner Occupied Housing Units | 67 | 93.1% |
| Renter-Occupied Housing Units | 5 | 6.9% |
| Total Occupied Housing Units | 72 | 100.0% |
Occupancy by Household Size in Elk River
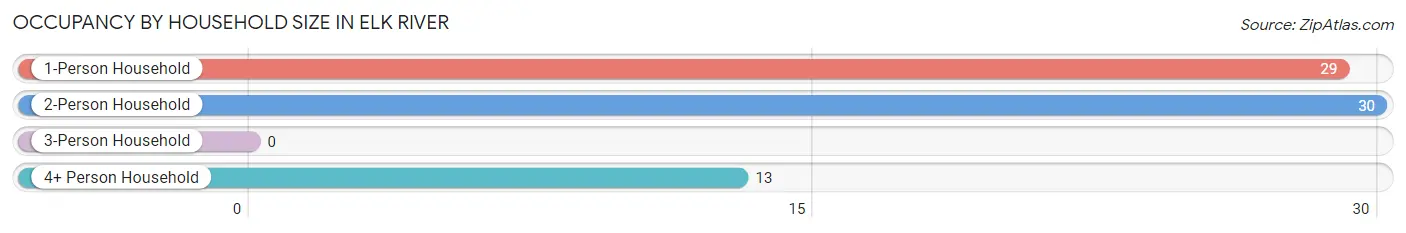
| Household Size | # Housing Units | % Housing Units |
| 1-Person Household | 29 | 40.3% |
| 2-Person Household | 30 | 41.7% |
| 3-Person Household | 0 | 0.0% |
| 4+ Person Household | 13 | 18.1% |
| Total Housing Units | 72 | 100.0% |
Occupancy by Ownership by Household Size in Elk River
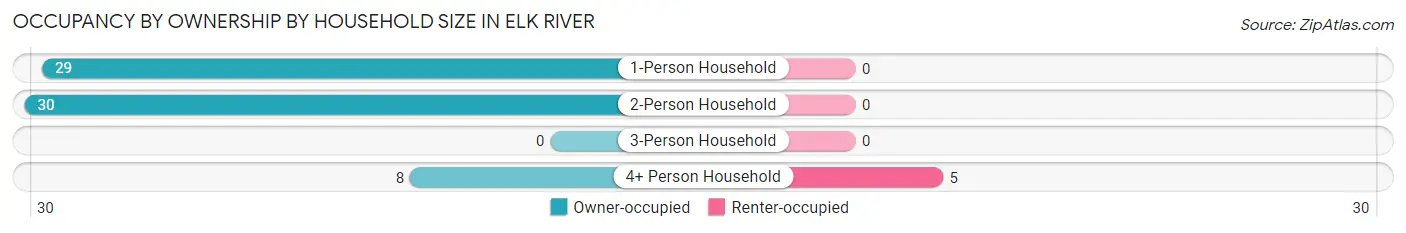
| Household Size | Owner-occupied | Renter-occupied |
| 1-Person Household | 29 (100.0%) | 0 (0.0%) |
| 2-Person Household | 30 (100.0%) | 0 (0.0%) |
| 3-Person Household | 0 (0.0%) | 0 (0.0%) |
| 4+ Person Household | 8 (61.5%) | 5 (38.5%) |
| Total Housing Units | 67 (93.1%) | 5 (6.9%) |
Occupancy by Educational Attainment in Elk River
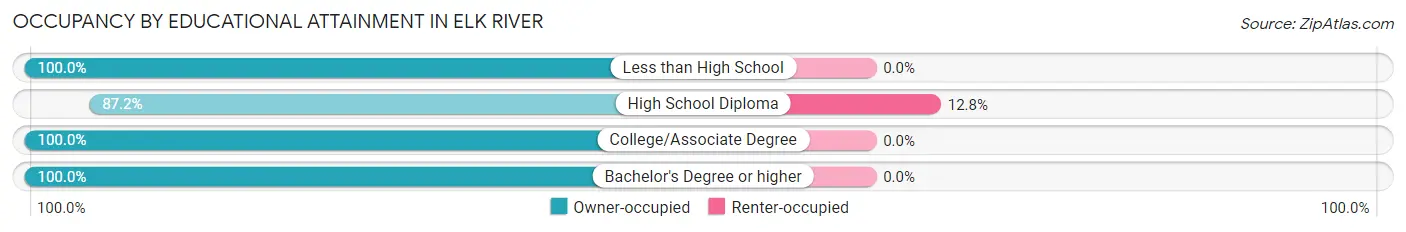
| Household Size | Owner-occupied | Renter-occupied |
| Less than High School | 5 (100.0%) | 0 (0.0%) |
| High School Diploma | 34 (87.2%) | 5 (12.8%) |
| College/Associate Degree | 22 (100.0%) | 0 (0.0%) |
| Bachelor's Degree or higher | 6 (100.0%) | 0 (0.0%) |
Occupancy by Age of Householder in Elk River
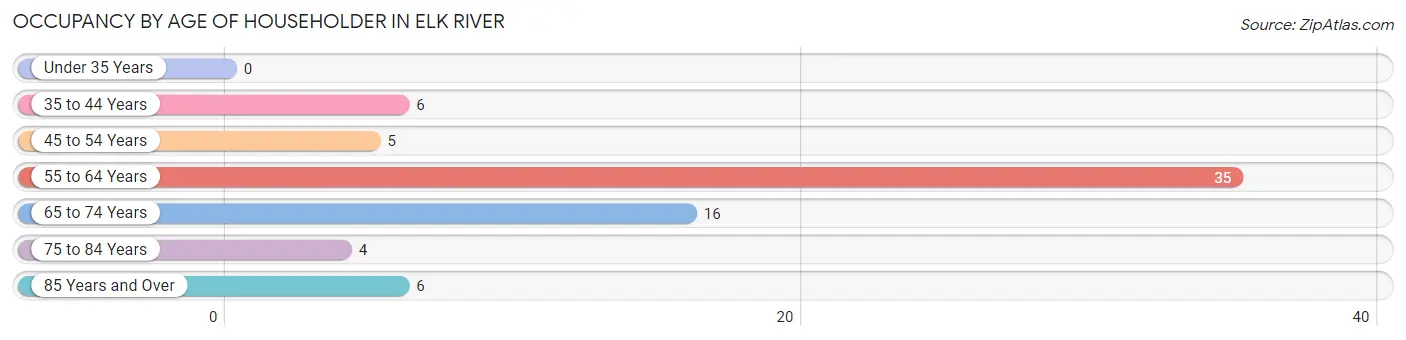
| Age Bracket | # Households | % Households |
| Under 35 Years | 0 | 0.0% |
| 35 to 44 Years | 6 | 8.3% |
| 45 to 54 Years | 5 | 6.9% |
| 55 to 64 Years | 35 | 48.6% |
| 65 to 74 Years | 16 | 22.2% |
| 75 to 84 Years | 4 | 5.6% |
| 85 Years and Over | 6 | 8.3% |
| Total | 72 | 100.0% |
Housing Finances in Elk River
Median Income by Occupancy in Elk River
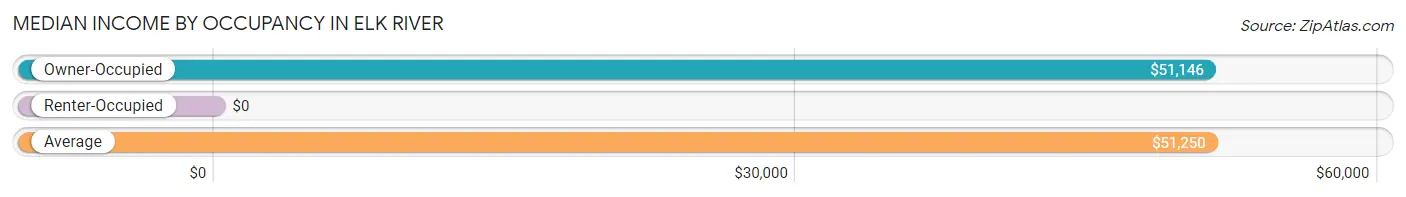
| Occupancy Type | # Households | Median Income |
| Owner-Occupied | 67 (93.1%) | $51,146 |
| Renter-Occupied | 5 (6.9%) | $0 |
| Average | 72 (100.0%) | $51,250 |
Occupancy by Householder Income Bracket in Elk River
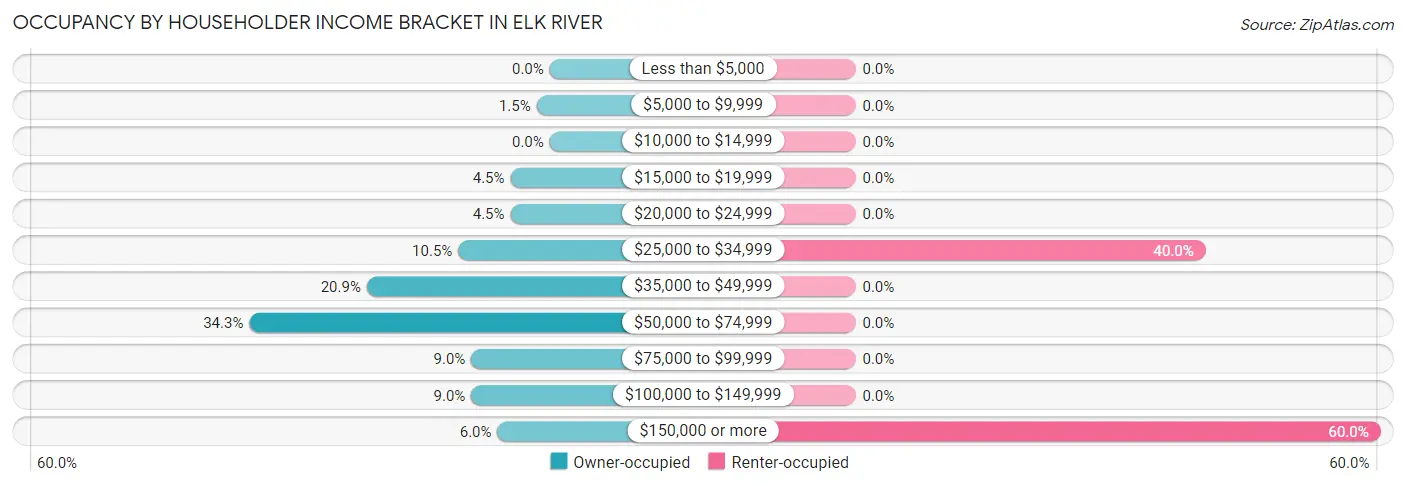
| Income Bracket | Owner-occupied | Renter-occupied |
| Less than $5,000 | 0 (0.0%) | 0 (0.0%) |
| $5,000 to $9,999 | 1 (1.5%) | 0 (0.0%) |
| $10,000 to $14,999 | 0 (0.0%) | 0 (0.0%) |
| $15,000 to $19,999 | 3 (4.5%) | 0 (0.0%) |
| $20,000 to $24,999 | 3 (4.5%) | 0 (0.0%) |
| $25,000 to $34,999 | 7 (10.4%) | 2 (40.0%) |
| $35,000 to $49,999 | 14 (20.9%) | 0 (0.0%) |
| $50,000 to $74,999 | 23 (34.3%) | 0 (0.0%) |
| $75,000 to $99,999 | 6 (9.0%) | 0 (0.0%) |
| $100,000 to $149,999 | 6 (9.0%) | 0 (0.0%) |
| $150,000 or more | 4 (6.0%) | 3 (60.0%) |
| Total | 67 (100.0%) | 5 (100.0%) |
Monthly Housing Cost Tiers in Elk River
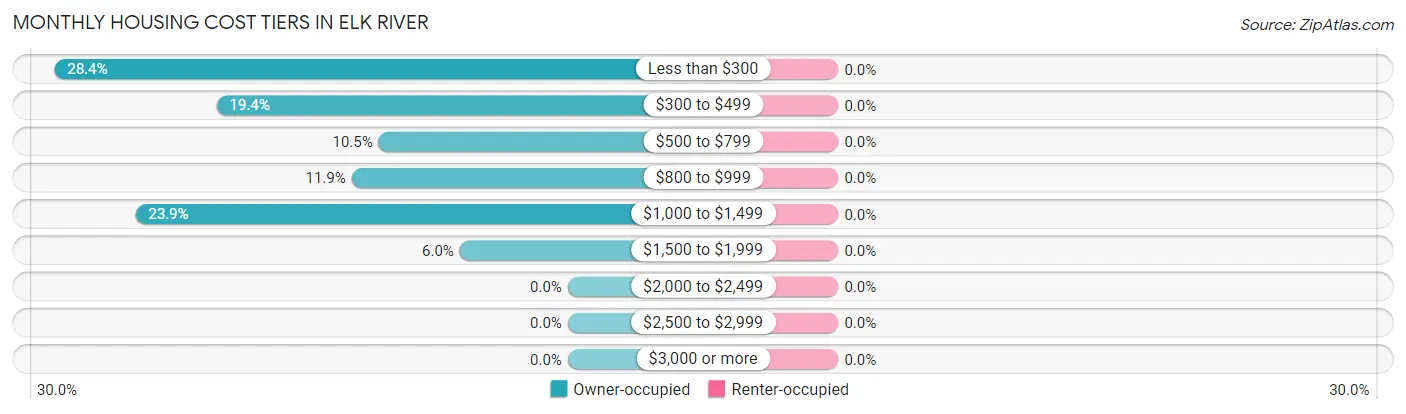
| Monthly Cost | Owner-occupied | Renter-occupied |
| Less than $300 | 19 (28.4%) | 0 (0.0%) |
| $300 to $499 | 13 (19.4%) | 0 (0.0%) |
| $500 to $799 | 7 (10.4%) | 0 (0.0%) |
| $800 to $999 | 8 (11.9%) | 0 (0.0%) |
| $1,000 to $1,499 | 16 (23.9%) | 0 (0.0%) |
| $1,500 to $1,999 | 4 (6.0%) | 0 (0.0%) |
| $2,000 to $2,499 | 0 (0.0%) | 0 (0.0%) |
| $2,500 to $2,999 | 0 (0.0%) | 0 (0.0%) |
| $3,000 or more | 0 (0.0%) | 0 (0.0%) |
| Total | 67 (100.0%) | 5 (100.0%) |
Physical Housing Characteristics in Elk River
Housing Structures in Elk River
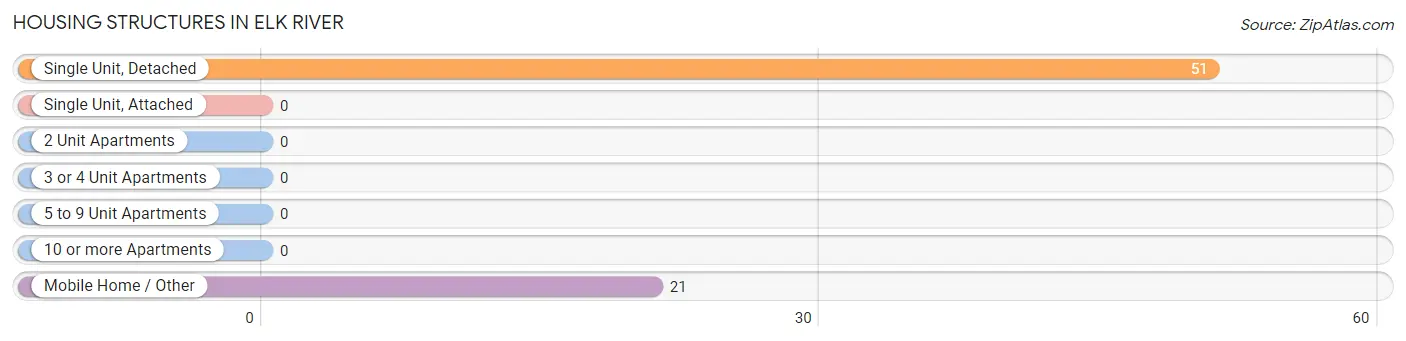
| Structure Type | # Housing Units | % Housing Units |
| Single Unit, Detached | 51 | 70.8% |
| Single Unit, Attached | 0 | 0.0% |
| 2 Unit Apartments | 0 | 0.0% |
| 3 or 4 Unit Apartments | 0 | 0.0% |
| 5 to 9 Unit Apartments | 0 | 0.0% |
| 10 or more Apartments | 0 | 0.0% |
| Mobile Home / Other | 21 | 29.2% |
| Total | 72 | 100.0% |
Housing Structures by Occupancy in Elk River
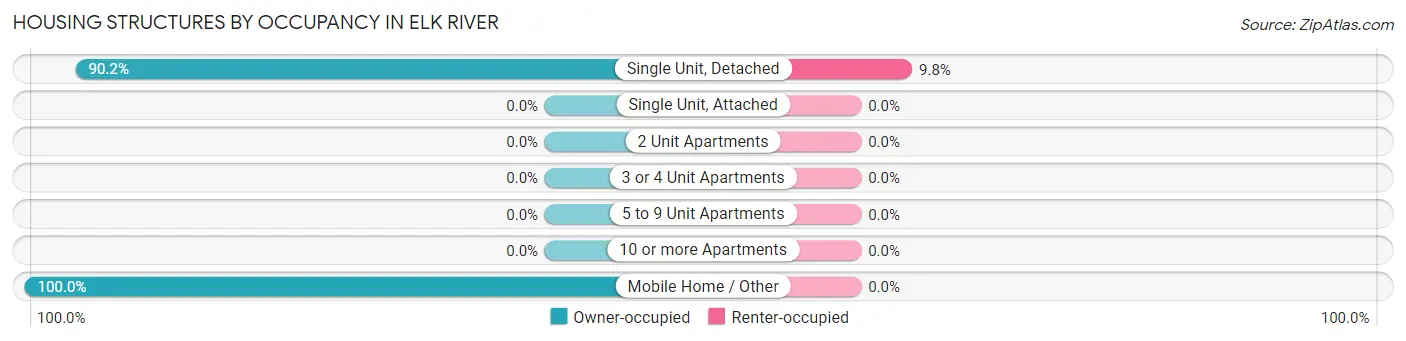
| Structure Type | Owner-occupied | Renter-occupied |
| Single Unit, Detached | 46 (90.2%) | 5 (9.8%) |
| Single Unit, Attached | 0 (0.0%) | 0 (0.0%) |
| 2 Unit Apartments | 0 (0.0%) | 0 (0.0%) |
| 3 or 4 Unit Apartments | 0 (0.0%) | 0 (0.0%) |
| 5 to 9 Unit Apartments | 0 (0.0%) | 0 (0.0%) |
| 10 or more Apartments | 0 (0.0%) | 0 (0.0%) |
| Mobile Home / Other | 21 (100.0%) | 0 (0.0%) |
| Total | 67 (93.1%) | 5 (6.9%) |
Housing Structures by Number of Rooms in Elk River
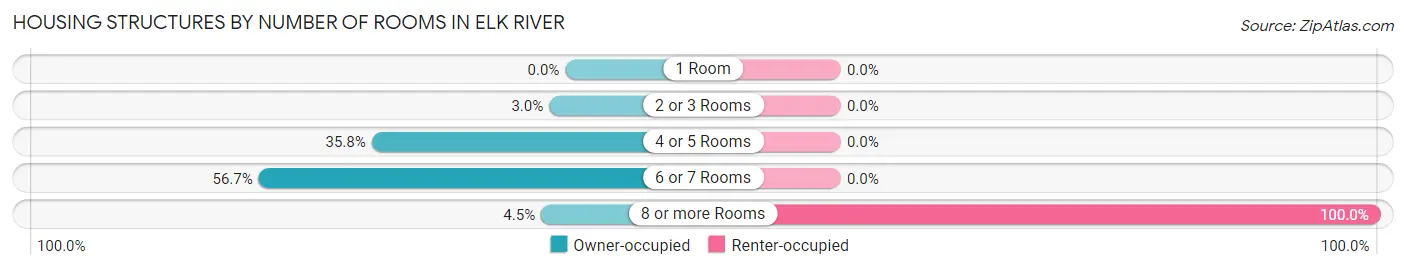
| Number of Rooms | Owner-occupied | Renter-occupied |
| 1 Room | 0 (0.0%) | 0 (0.0%) |
| 2 or 3 Rooms | 2 (3.0%) | 0 (0.0%) |
| 4 or 5 Rooms | 24 (35.8%) | 0 (0.0%) |
| 6 or 7 Rooms | 38 (56.7%) | 0 (0.0%) |
| 8 or more Rooms | 3 (4.5%) | 5 (100.0%) |
| Total | 67 (100.0%) | 5 (100.0%) |
Housing Structure by Heating Type in Elk River
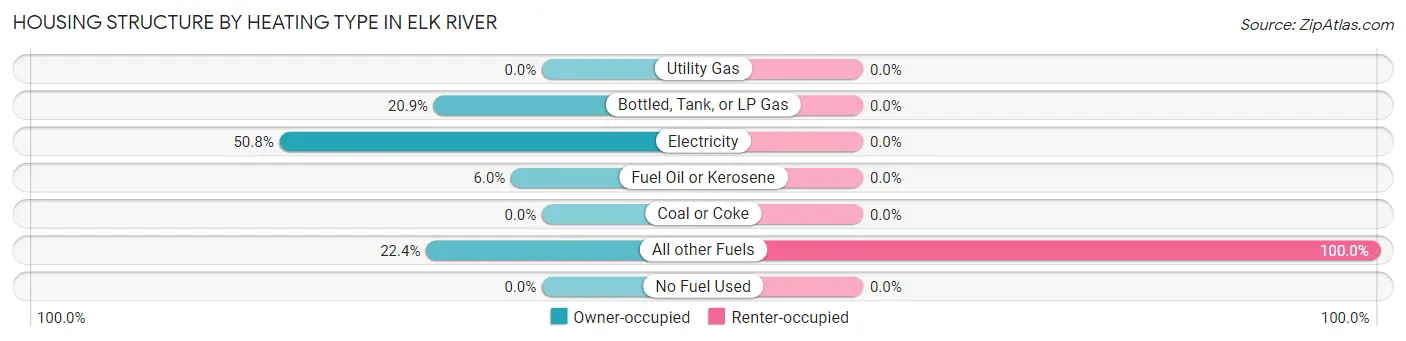
| Heating Type | Owner-occupied | Renter-occupied |
| Utility Gas | 0 (0.0%) | 0 (0.0%) |
| Bottled, Tank, or LP Gas | 14 (20.9%) | 0 (0.0%) |
| Electricity | 34 (50.7%) | 0 (0.0%) |
| Fuel Oil or Kerosene | 4 (6.0%) | 0 (0.0%) |
| Coal or Coke | 0 (0.0%) | 0 (0.0%) |
| All other Fuels | 15 (22.4%) | 5 (100.0%) |
| No Fuel Used | 0 (0.0%) | 0 (0.0%) |
| Total | 67 (100.0%) | 5 (100.0%) |
Household Vehicle Usage in Elk River
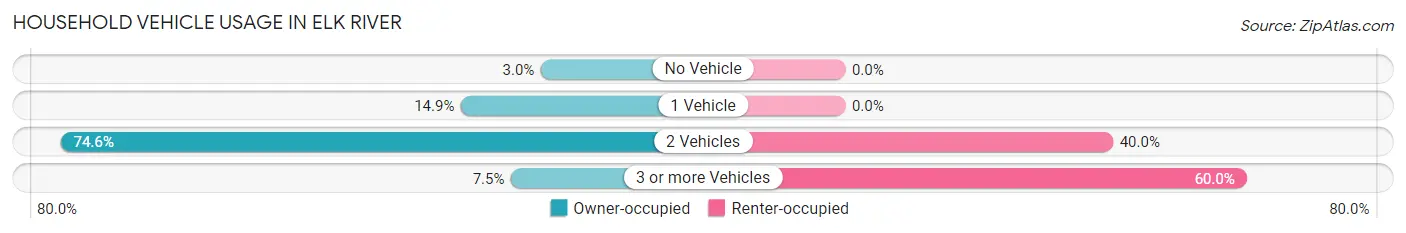
| Vehicles per Household | Owner-occupied | Renter-occupied |
| No Vehicle | 2 (3.0%) | 0 (0.0%) |
| 1 Vehicle | 10 (14.9%) | 0 (0.0%) |
| 2 Vehicles | 50 (74.6%) | 2 (40.0%) |
| 3 or more Vehicles | 5 (7.5%) | 3 (60.0%) |
| Total | 67 (100.0%) | 5 (100.0%) |
Real Estate & Mortgages in Elk River
Real Estate and Mortgage Overview in Elk River
| Characteristic | Without Mortgage | With Mortgage |
| Housing Units | 45 | 22 |
| Median Property Value | $159,400 | $162,500 |
| Median Household Income | $50,313 | $0 |
| Monthly Housing Costs | $375 | $0 |
| Real Estate Taxes | $919 | $0 |
Property Value by Mortgage Status in Elk River
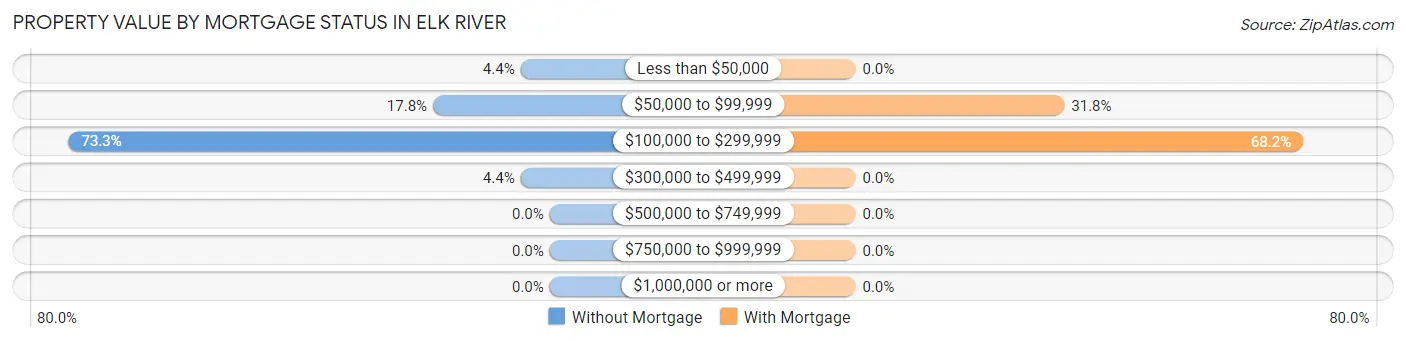
| Property Value | Without Mortgage | With Mortgage |
| Less than $50,000 | 2 (4.4%) | 0 (0.0%) |
| $50,000 to $99,999 | 8 (17.8%) | 7 (31.8%) |
| $100,000 to $299,999 | 33 (73.3%) | 15 (68.2%) |
| $300,000 to $499,999 | 2 (4.4%) | 0 (0.0%) |
| $500,000 to $749,999 | 0 (0.0%) | 0 (0.0%) |
| $750,000 to $999,999 | 0 (0.0%) | 0 (0.0%) |
| $1,000,000 or more | 0 (0.0%) | 0 (0.0%) |
| Total | 45 (100.0%) | 22 (100.0%) |
Household Income by Mortgage Status in Elk River
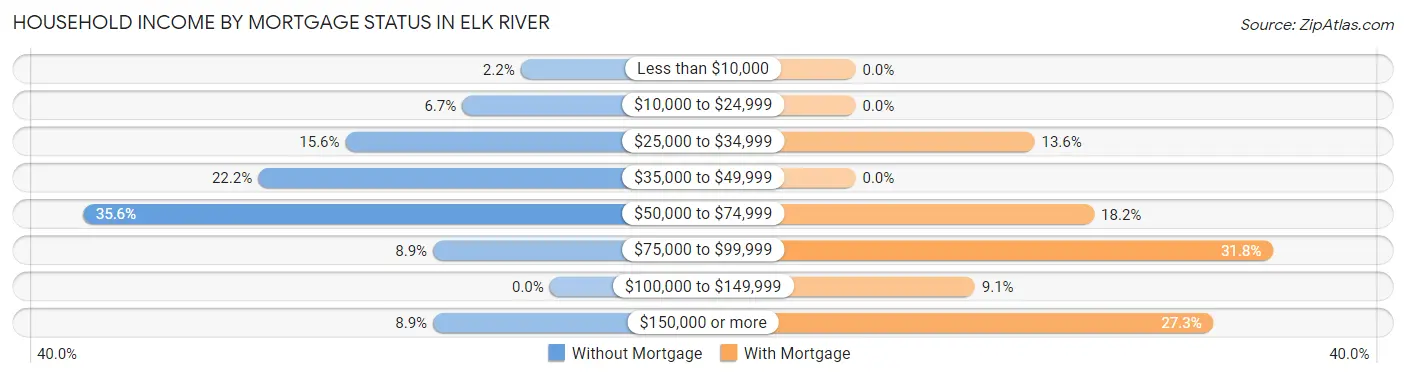
| Household Income | Without Mortgage | With Mortgage |
| Less than $10,000 | 1 (2.2%) | 0 (0.0%) |
| $10,000 to $24,999 | 3 (6.7%) | 0 (0.0%) |
| $25,000 to $34,999 | 7 (15.6%) | 3 (13.6%) |
| $35,000 to $49,999 | 10 (22.2%) | 0 (0.0%) |
| $50,000 to $74,999 | 16 (35.6%) | 4 (18.2%) |
| $75,000 to $99,999 | 4 (8.9%) | 7 (31.8%) |
| $100,000 to $149,999 | 0 (0.0%) | 2 (9.1%) |
| $150,000 or more | 4 (8.9%) | 6 (27.3%) |
| Total | 45 (100.0%) | 22 (100.0%) |
Property Value to Household Income Ratio in Elk River
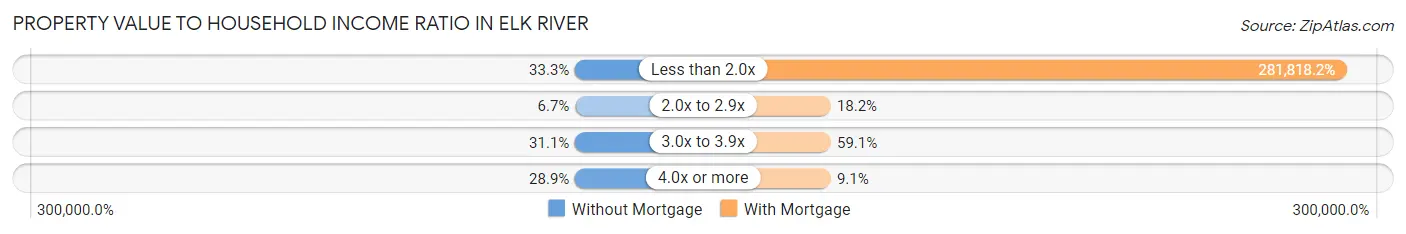
| Value-to-Income Ratio | Without Mortgage | With Mortgage |
| Less than 2.0x | 15 (33.3%) | 62,000 (281,818.2%) |
| 2.0x to 2.9x | 3 (6.7%) | 4 (18.2%) |
| 3.0x to 3.9x | 14 (31.1%) | 13 (59.1%) |
| 4.0x or more | 13 (28.9%) | 2 (9.1%) |
| Total | 45 (100.0%) | 22 (100.0%) |
Real Estate Taxes by Mortgage Status in Elk River
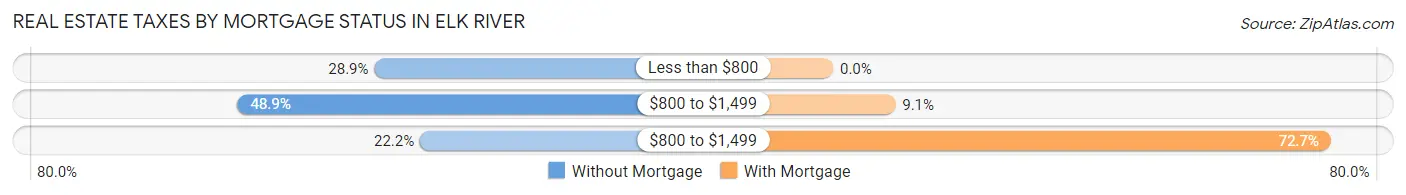
| Property Taxes | Without Mortgage | With Mortgage |
| Less than $800 | 13 (28.9%) | 0 (0.0%) |
| $800 to $1,499 | 22 (48.9%) | 2 (9.1%) |
| $800 to $1,499 | 10 (22.2%) | 16 (72.7%) |
| Total | 45 (100.0%) | 22 (100.0%) |
Health & Disability in Elk River
Health Insurance Coverage by Age in Elk River
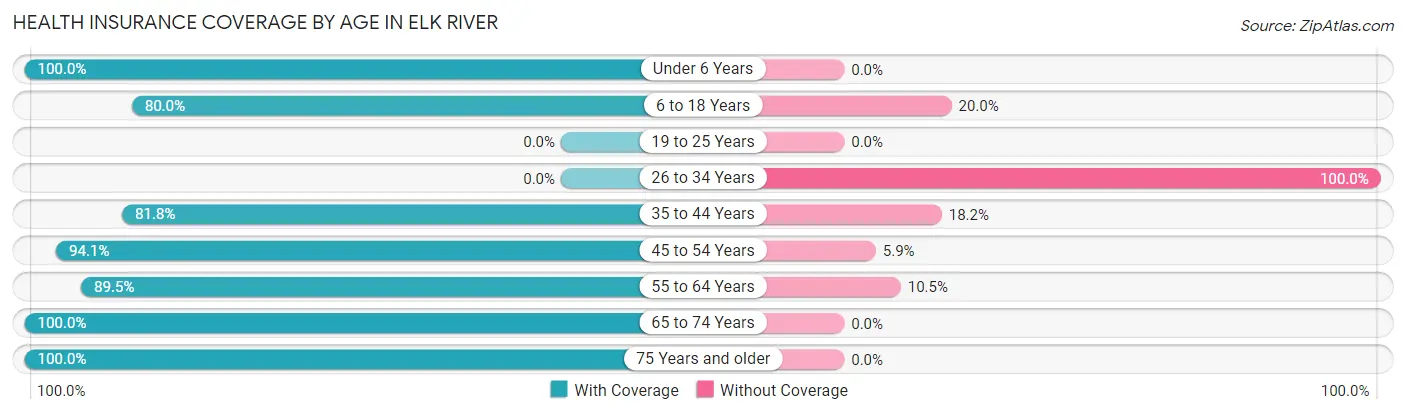
| Age Bracket | With Coverage | Without Coverage |
| Under 6 Years | 4 (100.0%) | 0 (0.0%) |
| 6 to 18 Years | 16 (80.0%) | 4 (20.0%) |
| 19 to 25 Years | 0 (0.0%) | 0 (0.0%) |
| 26 to 34 Years | 0 (0.0%) | 9 (100.0%) |
| 35 to 44 Years | 9 (81.8%) | 2 (18.2%) |
| 45 to 54 Years | 16 (94.1%) | 1 (5.9%) |
| 55 to 64 Years | 51 (89.5%) | 6 (10.5%) |
| 65 to 74 Years | 26 (100.0%) | 0 (0.0%) |
| 75 Years and older | 20 (100.0%) | 0 (0.0%) |
| Total | 142 (86.6%) | 22 (13.4%) |
Health Insurance Coverage by Citizenship Status in Elk River

| Citizenship Status | With Coverage | Without Coverage |
| Native Born | 4 (100.0%) | 0 (0.0%) |
| Foreign Born, Citizen | 16 (80.0%) | 4 (20.0%) |
| Foreign Born, not a Citizen | 0 (0.0%) | 0 (0.0%) |
Health Insurance Coverage by Household Income in Elk River
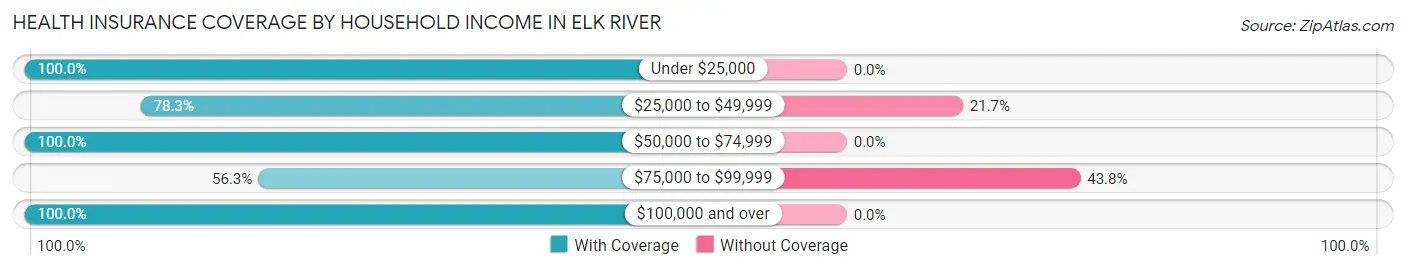
| Household Income | With Coverage | Without Coverage |
| Under $25,000 | 7 (100.0%) | 0 (0.0%) |
| $25,000 to $49,999 | 54 (78.3%) | 15 (21.7%) |
| $50,000 to $74,999 | 29 (100.0%) | 0 (0.0%) |
| $75,000 to $99,999 | 9 (56.2%) | 7 (43.8%) |
| $100,000 and over | 43 (100.0%) | 0 (0.0%) |
Public vs Private Health Insurance Coverage by Age in Elk River
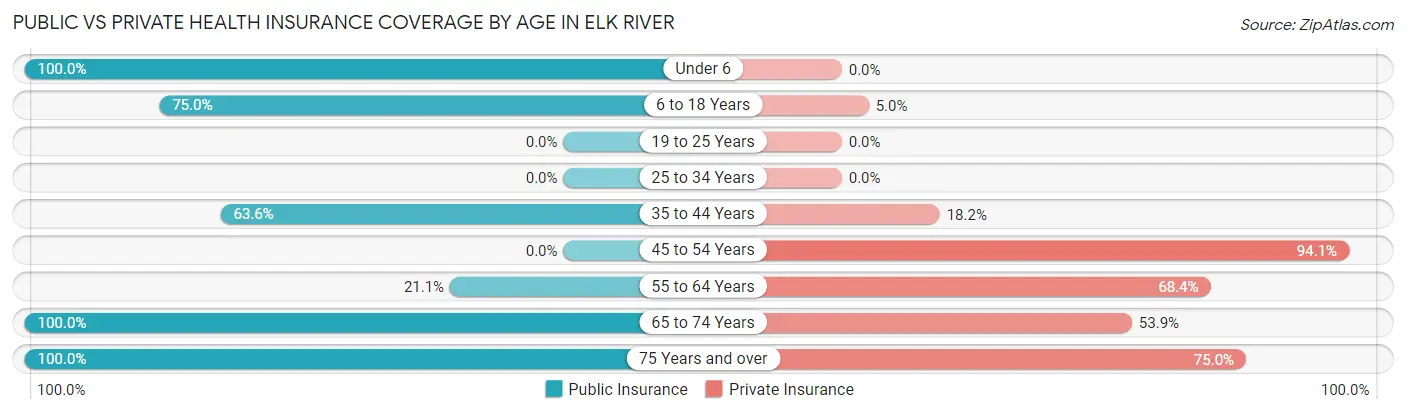
| Age Bracket | Public Insurance | Private Insurance |
| Under 6 | 4 (100.0%) | 0 (0.0%) |
| 6 to 18 Years | 15 (75.0%) | 1 (5.0%) |
| 19 to 25 Years | 0 (0.0%) | 0 (0.0%) |
| 25 to 34 Years | 0 (0.0%) | 0 (0.0%) |
| 35 to 44 Years | 7 (63.6%) | 2 (18.2%) |
| 45 to 54 Years | 0 (0.0%) | 16 (94.1%) |
| 55 to 64 Years | 12 (21.0%) | 39 (68.4%) |
| 65 to 74 Years | 26 (100.0%) | 14 (53.8%) |
| 75 Years and over | 20 (100.0%) | 15 (75.0%) |
| Total | 84 (51.2%) | 87 (53.0%) |
Disability Status by Sex by Age in Elk River
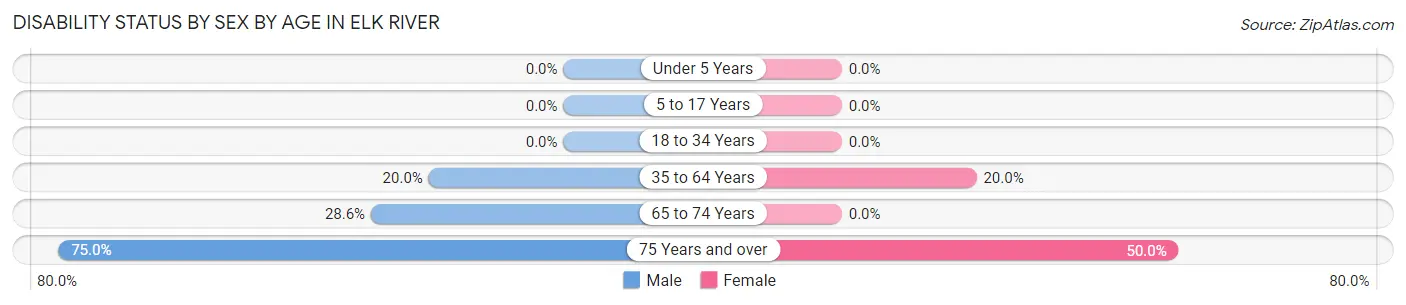
| Age Bracket | Male | Female |
| Under 5 Years | 0 (0.0%) | 0 (0.0%) |
| 5 to 17 Years | 0 (0.0%) | 0 (0.0%) |
| 18 to 34 Years | 0 (0.0%) | 0 (0.0%) |
| 35 to 64 Years | 9 (20.0%) | 8 (20.0%) |
| 65 to 74 Years | 4 (28.6%) | 0 (0.0%) |
| 75 Years and over | 9 (75.0%) | 4 (50.0%) |
Disability Class by Sex by Age in Elk River
Disability Class: Hearing Difficulty
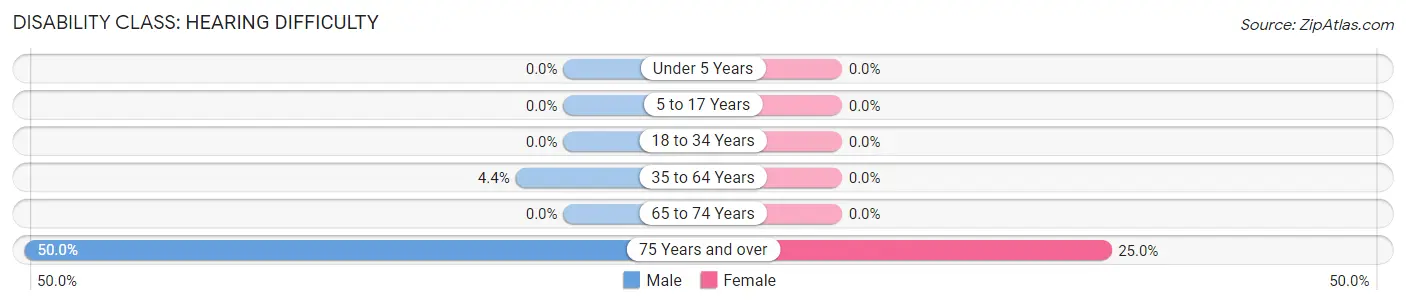
| Age Bracket | Male | Female |
| Under 5 Years | 0 (0.0%) | 0 (0.0%) |
| 5 to 17 Years | 0 (0.0%) | 0 (0.0%) |
| 18 to 34 Years | 0 (0.0%) | 0 (0.0%) |
| 35 to 64 Years | 2 (4.4%) | 0 (0.0%) |
| 65 to 74 Years | 0 (0.0%) | 0 (0.0%) |
| 75 Years and over | 6 (50.0%) | 2 (25.0%) |
Disability Class: Vision Difficulty
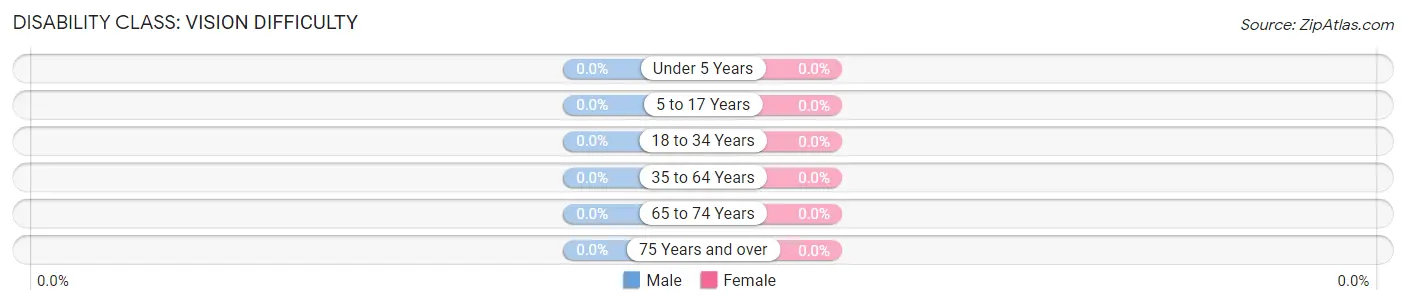
| Age Bracket | Male | Female |
| Under 5 Years | 0 (0.0%) | 0 (0.0%) |
| 5 to 17 Years | 0 (0.0%) | 0 (0.0%) |
| 18 to 34 Years | 0 (0.0%) | 0 (0.0%) |
| 35 to 64 Years | 0 (0.0%) | 0 (0.0%) |
| 65 to 74 Years | 0 (0.0%) | 0 (0.0%) |
| 75 Years and over | 0 (0.0%) | 0 (0.0%) |
Disability Class: Cognitive Difficulty
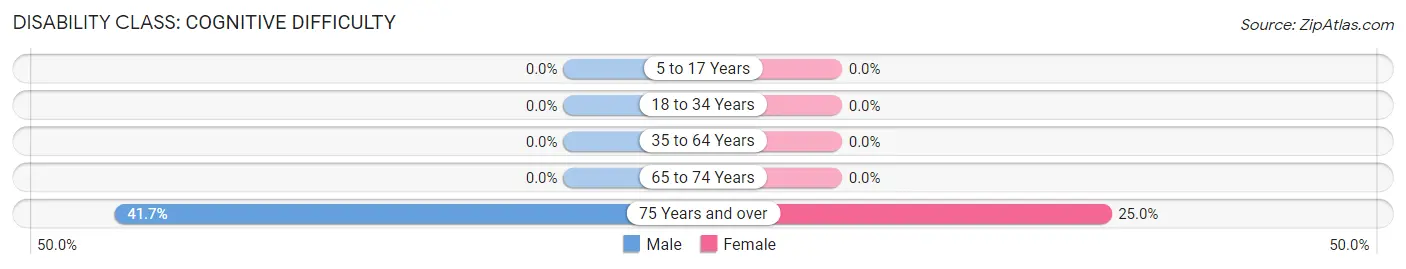
| Age Bracket | Male | Female |
| 5 to 17 Years | 0 (0.0%) | 0 (0.0%) |
| 18 to 34 Years | 0 (0.0%) | 0 (0.0%) |
| 35 to 64 Years | 0 (0.0%) | 0 (0.0%) |
| 65 to 74 Years | 0 (0.0%) | 0 (0.0%) |
| 75 Years and over | 5 (41.7%) | 2 (25.0%) |
Disability Class: Ambulatory Difficulty
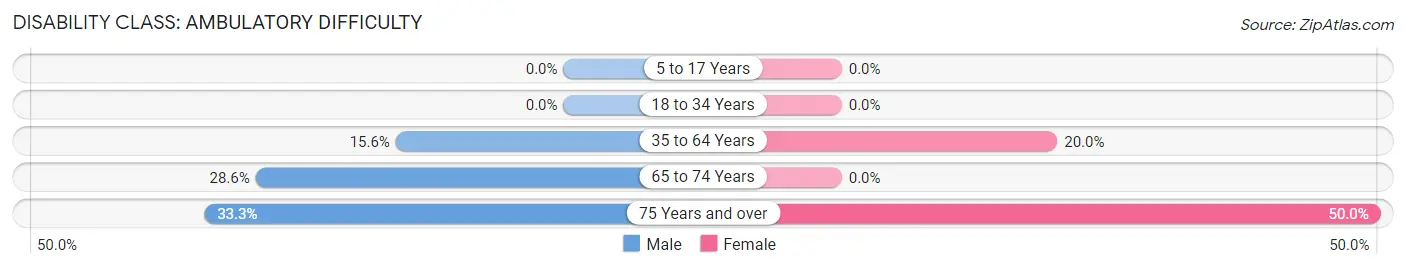
| Age Bracket | Male | Female |
| 5 to 17 Years | 0 (0.0%) | 0 (0.0%) |
| 18 to 34 Years | 0 (0.0%) | 0 (0.0%) |
| 35 to 64 Years | 7 (15.6%) | 8 (20.0%) |
| 65 to 74 Years | 4 (28.6%) | 0 (0.0%) |
| 75 Years and over | 4 (33.3%) | 4 (50.0%) |
Disability Class: Self-Care Difficulty
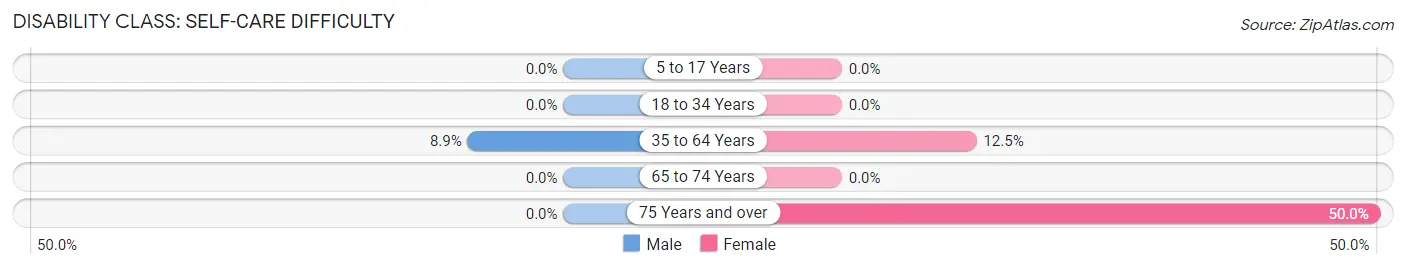
| Age Bracket | Male | Female |
| 5 to 17 Years | 0 (0.0%) | 0 (0.0%) |
| 18 to 34 Years | 0 (0.0%) | 0 (0.0%) |
| 35 to 64 Years | 4 (8.9%) | 5 (12.5%) |
| 65 to 74 Years | 0 (0.0%) | 0 (0.0%) |
| 75 Years and over | 0 (0.0%) | 4 (50.0%) |
Technology Access in Elk River
Computing Device Access in Elk River
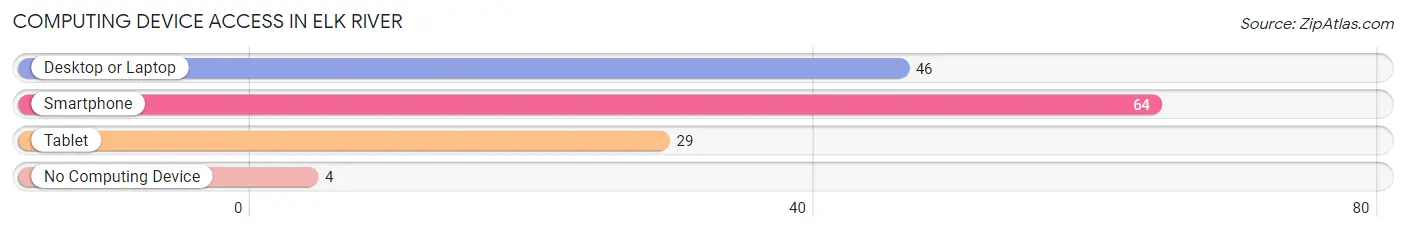
| Device Type | # Households | % Households |
| Desktop or Laptop | 46 | 63.9% |
| Smartphone | 64 | 88.9% |
| Tablet | 29 | 40.3% |
| No Computing Device | 4 | 5.6% |
| Total | 72 | 100.0% |
Internet Access in Elk River
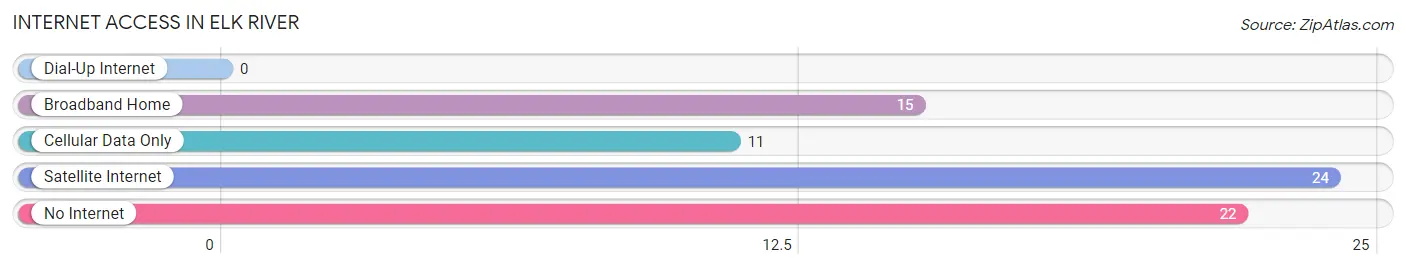
| Internet Type | # Households | % Households |
| Dial-Up Internet | 0 | 0.0% |
| Broadband Home | 15 | 20.8% |
| Cellular Data Only | 11 | 15.3% |
| Satellite Internet | 24 | 33.3% |
| No Internet | 22 | 30.6% |
| Total | 72 | 100.0% |
Elk River Summary
Elk River, Idaho is a small town located in the northern part of the state, near the border of Montana. It is situated in the Clearwater River Valley, and is surrounded by the Bitterroot Mountains. The town has a population of just over 1,000 people, and is the county seat of Clearwater County.
Geography
Elk River is located in the Clearwater River Valley, which is part of the larger Bitterroot Mountains. The town is situated at an elevation of 2,890 feet, and is surrounded by mountains and forests. The Clearwater River runs through the town, and is a popular destination for fishing and rafting. The town is also home to several lakes, including Lake Pend Oreille, which is the largest lake in Idaho.
The climate in Elk River is generally mild, with warm summers and cold winters. The average high temperature in the summer is around 80 degrees Fahrenheit, and the average low temperature in the winter is around 20 degrees Fahrenheit. The town receives an average of 20 inches of precipitation per year, with most of it falling in the form of snow.
Economy
The economy of Elk River is largely based on tourism and agriculture. The town is home to several tourist attractions, including the Clearwater River, Lake Pend Oreille, and the Bitterroot Mountains. The town also has several small businesses, including restaurants, shops, and lodging.
Agriculture is also an important part of the economy in Elk River. The town is home to several farms, which produce a variety of crops, including potatoes, wheat, and hay. The town also has several cattle ranches, which produce beef and dairy products.
Demographics
As of the 2010 census, the population of Elk River was 1,072. The town is predominantly white, with 92.3% of the population identifying as such. The remaining population is made up of Native Americans (2.2%), African Americans (1.2%), Asians (0.7%), and other races (3.6%).
The median household income in Elk River is $37,917, and the median age is 44. The town has a higher than average poverty rate, with 17.3% of the population living below the poverty line.
Elk River is a small town with a rich history and a unique culture. The town is home to a variety of attractions, and is a popular destination for tourists and outdoor enthusiasts. The town is also home to several small businesses, and is an important part of the local economy.
Common Questions
What is Per Capita Income in Elk River?
Per Capita income in Elk River is $35,491.
What is the Median Family Income in Elk River?
Median Family Income in Elk River is $61,250.
What is the Median Household income in Elk River?
Median Household Income in Elk River is $51,250.
What is Inequality or Gini Index in Elk River?
Inequality or Gini Index in Elk River is 0.38.
What is the Total Population of Elk River?
Total Population of Elk River is 164.
What is the Total Male Population of Elk River?
Total Male Population of Elk River is 98.
What is the Total Female Population of Elk River?
Total Female Population of Elk River is 66.
What is the Ratio of Males per 100 Females in Elk River?
There are 148.48 Males per 100 Females in Elk River.
What is the Ratio of Females per 100 Males in Elk River?
There are 67.35 Females per 100 Males in Elk River.
What is the Median Population Age in Elk River?
Median Population Age in Elk River is 58.0 Years.
What is the Average Family Size in Elk River
Average Family Size in Elk River is 3.0 People.
What is the Average Household Size in Elk River
Average Household Size in Elk River is 2.3 People.
How Large is the Labor Force in Elk River?
There are 65 People in the Labor Forcein in Elk River.
What is the Percentage of People in the Labor Force in Elk River?
45.5% of People are in the Labor Force in Elk River.