Malta, ID Map & Demographics
Malta Map
Malta Overview
$21,327
PER CAPITA INCOME
$17,803
FAMILY INCOME DEFICIT
0.52
INEQUALITY / GINI INDEX
294
TOTAL POPULATION
125
MALE POPULATION
169
FEMALE POPULATION
73.96
MALES / 100 FEMALES
135.20
FEMALES / 100 MALES
41.5
MEDIAN AGE
3.9
AVG FAMILY SIZE
3.8
AVG HOUSEHOLD SIZE
88
LABOR FORCE [ PEOPLE ]
51.8%
PERCENT IN LABOR FORCE
Malta Zip Codes
Malta Area Codes
Income in Malta
Income Overview in Malta
| Characteristic | Number | Measure |
| Per Capita Income | 294 | $21,327 |
| Median Family Income | 73 | $0 |
| Mean Family Income | 73 | $76,349 |
| Median Household Income | 77 | $0 |
| Mean Household Income | 77 | $75,078 |
| Income Deficit | 73 | $17,803 |
| Wage / Income Gap (%) | 294 | 0.00% |
| Wage / Income Gap ($) | 294 | 100.00¢ per $1 |
| Gini / Inequality Index | 294 | 0.52 |
Earnings by Sex in Malta
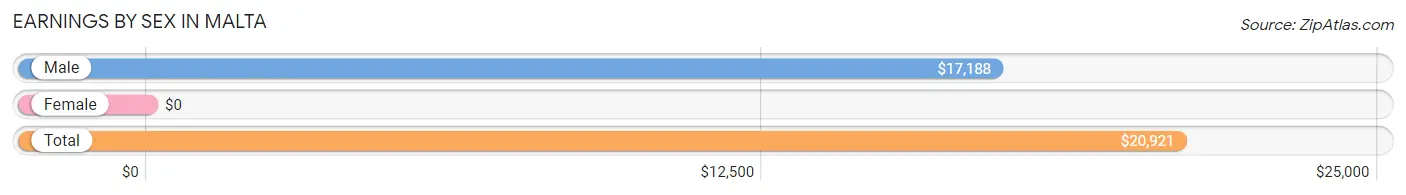
| Sex | Number | Average Earnings |
| Male | 69 (67.6%) | $17,188 |
| Female | 33 (32.4%) | $0 |
| Total | 102 (100.0%) | $20,921 |
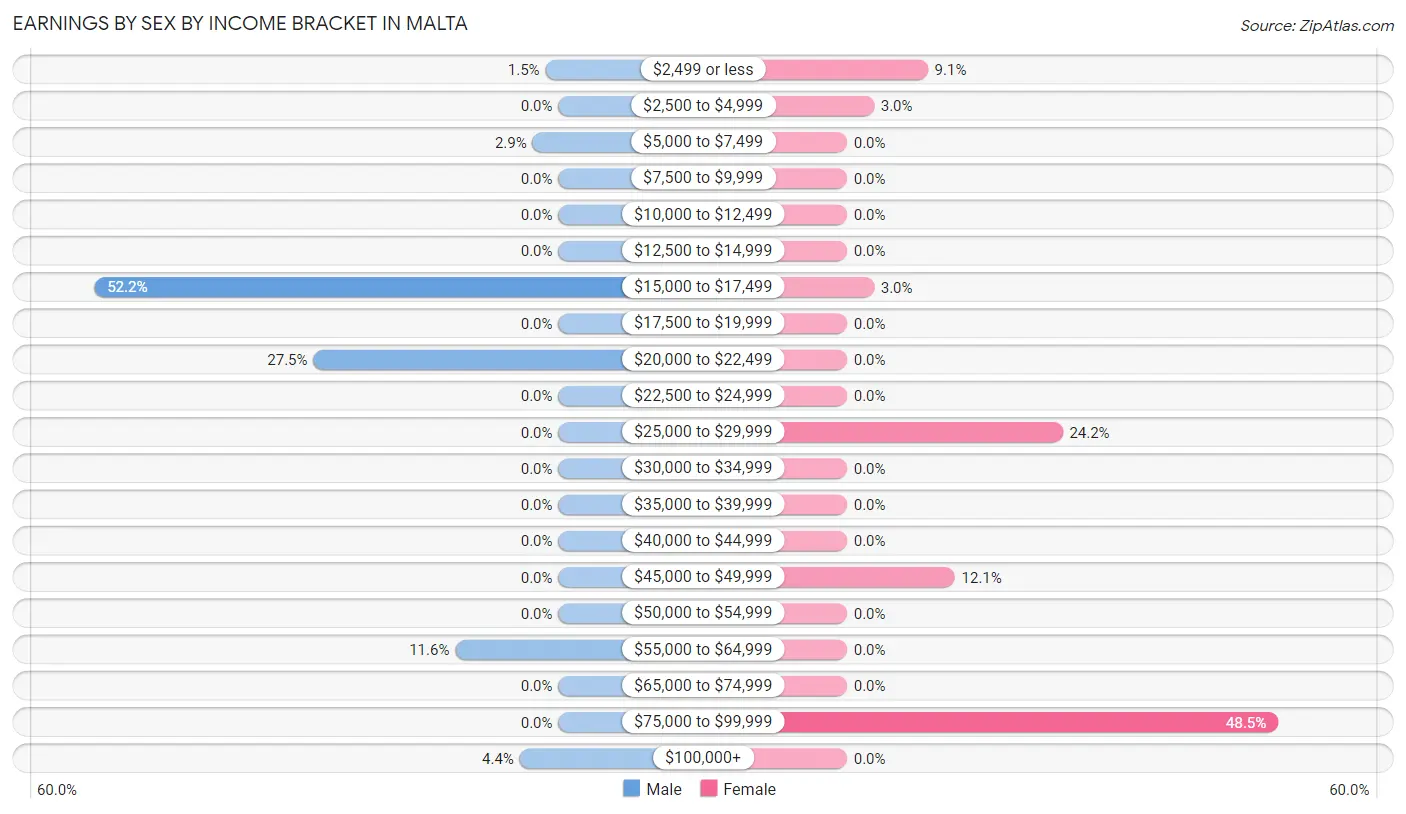
Earnings by Sex by Income Bracket in Malta
The most common earnings brackets in Malta are $15,000 to $17,499 for men (36 | 52.2%) and $75,000 to $99,999 for women (16 | 48.5%).
| Income | Male | Female |
| $2,499 or less | 1 (1.5%) | 3 (9.1%) |
| $2,500 to $4,999 | 0 (0.0%) | 1 (3.0%) |
| $5,000 to $7,499 | 2 (2.9%) | 0 (0.0%) |
| $7,500 to $9,999 | 0 (0.0%) | 0 (0.0%) |
| $10,000 to $12,499 | 0 (0.0%) | 0 (0.0%) |
| $12,500 to $14,999 | 0 (0.0%) | 0 (0.0%) |
| $15,000 to $17,499 | 36 (52.2%) | 1 (3.0%) |
| $17,500 to $19,999 | 0 (0.0%) | 0 (0.0%) |
| $20,000 to $22,499 | 19 (27.5%) | 0 (0.0%) |
| $22,500 to $24,999 | 0 (0.0%) | 0 (0.0%) |
| $25,000 to $29,999 | 0 (0.0%) | 8 (24.2%) |
| $30,000 to $34,999 | 0 (0.0%) | 0 (0.0%) |
| $35,000 to $39,999 | 0 (0.0%) | 0 (0.0%) |
| $40,000 to $44,999 | 0 (0.0%) | 0 (0.0%) |
| $45,000 to $49,999 | 0 (0.0%) | 4 (12.1%) |
| $50,000 to $54,999 | 0 (0.0%) | 0 (0.0%) |
| $55,000 to $64,999 | 8 (11.6%) | 0 (0.0%) |
| $65,000 to $74,999 | 0 (0.0%) | 0 (0.0%) |
| $75,000 to $99,999 | 0 (0.0%) | 16 (48.5%) |
| $100,000+ | 3 (4.3%) | 0 (0.0%) |
| Total | 69 (100.0%) | 33 (100.0%) |
Earnings by Sex by Educational Attainment in Malta
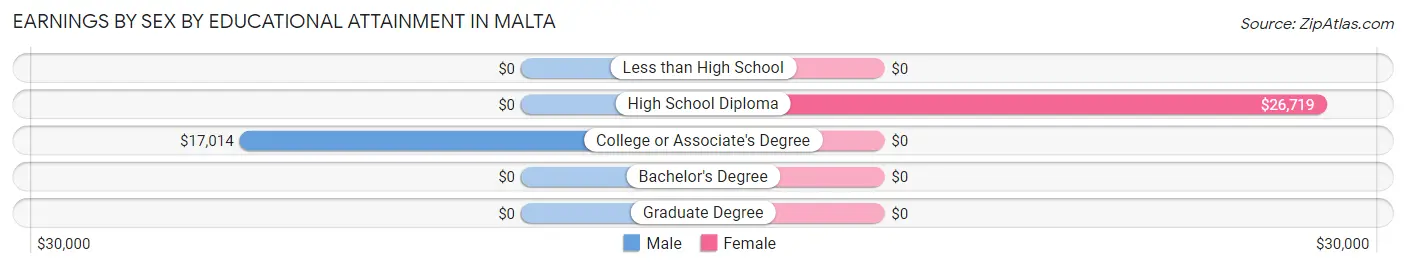
| Educational Attainment | Male Income | Female Income |
| Less than High School | - | - |
| High School Diploma | - | - |
| College or Associate's Degree | $17,014 | $0 |
| Bachelor's Degree | - | - |
| Graduate Degree | - | - |
| Total | $17,222 | $0 |
Family Income in Malta
Family Income Brackets in Malta
According to the Malta family income data, there are 19 families falling into the $25,000 to $34,999 income range, which is the most common income bracket and makes up 26.0% of all families.
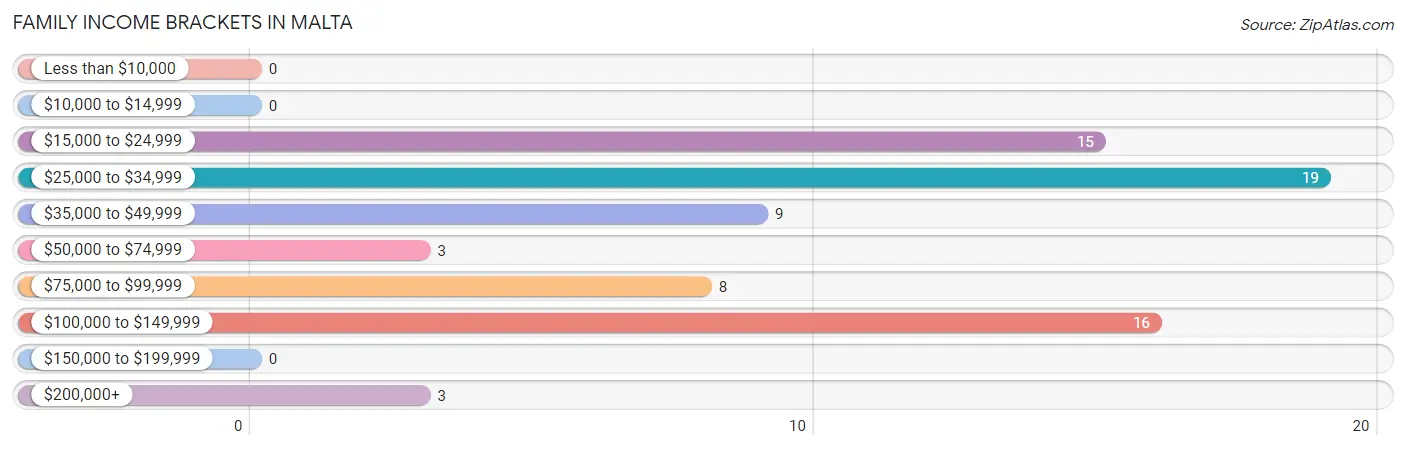
| Income Bracket | # Families | % Families |
| Less than $10,000 | 0 | 0.0% |
| $10,000 to $14,999 | 0 | 0.0% |
| $15,000 to $24,999 | 15 | 20.5% |
| $25,000 to $34,999 | 19 | 26.0% |
| $35,000 to $49,999 | 9 | 12.3% |
| $50,000 to $74,999 | 3 | 4.1% |
| $75,000 to $99,999 | 8 | 11.0% |
| $100,000 to $149,999 | 16 | 21.9% |
| $150,000 to $199,999 | 0 | 0.0% |
| $200,000+ | 3 | 4.1% |
Family Income by Famaliy Size in Malta
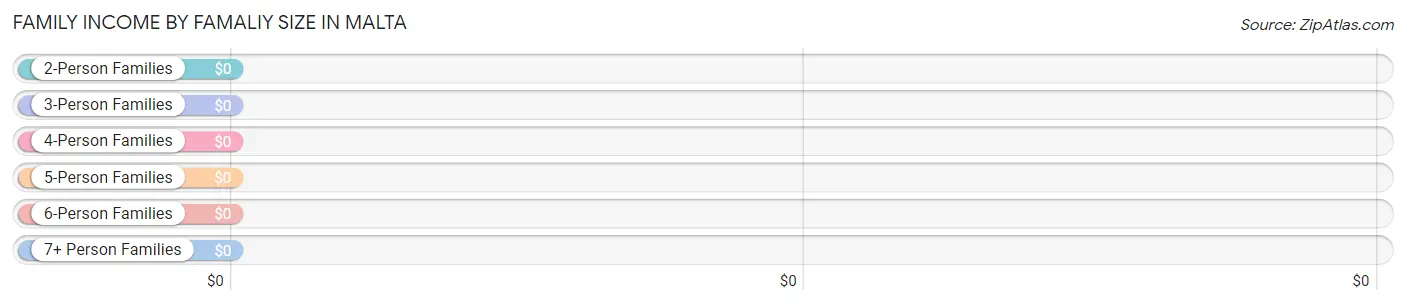
| Income Bracket | # Families | Median Income |
| 2-Person Families | 51 (69.9%) | $0 |
| 3-Person Families | 0 (0.0%) | $0 |
| 4-Person Families | 0 (0.0%) | $0 |
| 5-Person Families | 3 (4.1%) | $0 |
| 6-Person Families | 0 (0.0%) | $0 |
| 7+ Person Families | 19 (26.0%) | $0 |
| Total | 73 (100.0%) | $0 |
Family Income by Number of Earners in Malta
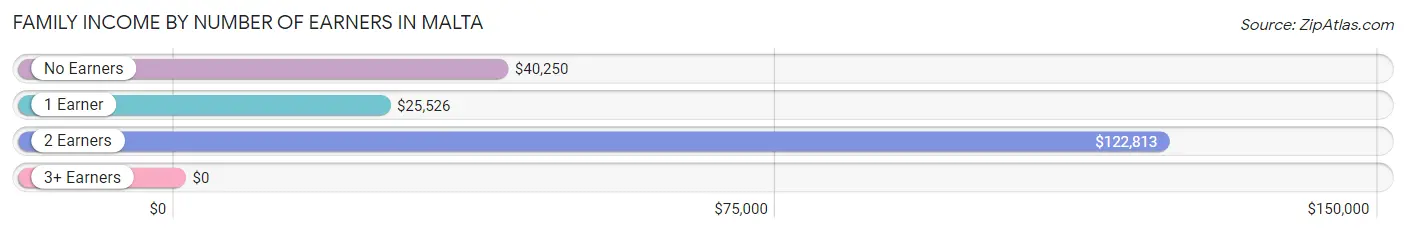
| Number of Earners | # Families | Median Income |
| No Earners | 9 (12.3%) | $40,250 |
| 1 Earner | 36 (49.3%) | $25,526 |
| 2 Earners | 28 (38.4%) | $122,813 |
| 3+ Earners | 0 (0.0%) | $0 |
| Total | 73 (100.0%) | $0 |
Household Income in Malta
Household Income Brackets in Malta
With 19 households falling in the category, the $25,000 to $34,999 income range is the most frequent in Malta, accounting for 24.7% of all households.
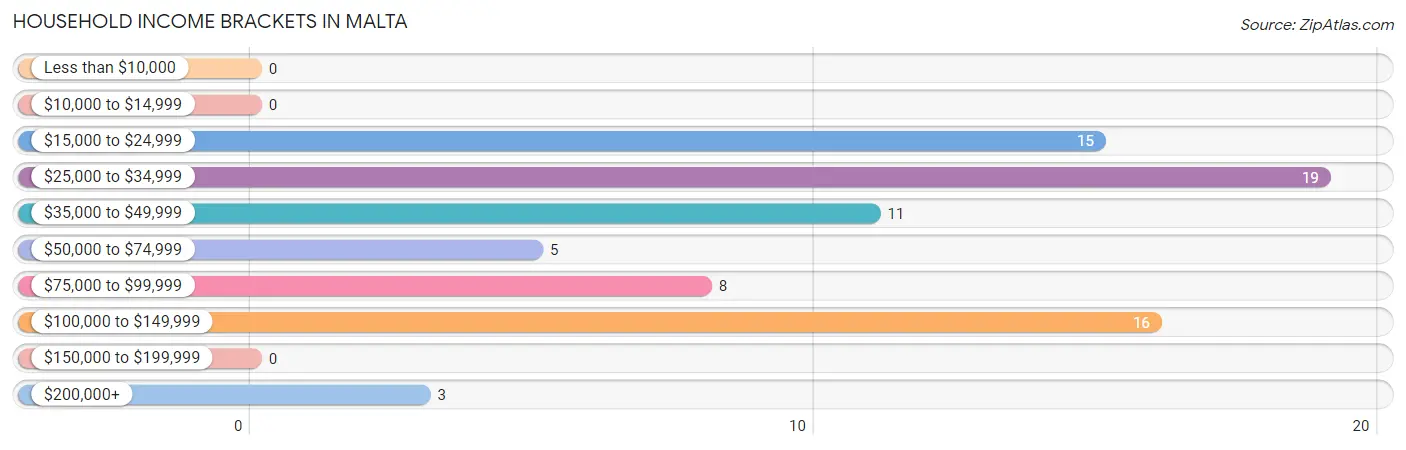
| Income Bracket | # Households | % Households |
| Less than $10,000 | 0 | 0.0% |
| $10,000 to $14,999 | 0 | 0.0% |
| $15,000 to $24,999 | 15 | 19.5% |
| $25,000 to $34,999 | 19 | 24.7% |
| $35,000 to $49,999 | 11 | 14.3% |
| $50,000 to $74,999 | 5 | 6.5% |
| $75,000 to $99,999 | 8 | 10.4% |
| $100,000 to $149,999 | 16 | 20.8% |
| $150,000 to $199,999 | 0 | 0.0% |
| $200,000+ | 3 | 3.9% |
Household Income by Householder Age in Malta
The median household income in Malta is $0, with the highest median household income of $122,813 found in the 45 to 64 years age bracket for the primary householder. A total of 28 households (36.4%) fall into this category. Meanwhile, the 15 to 24 years age bracket for the primary householder has the lowest median household income of $0, with 1 households (1.3%) in this group.
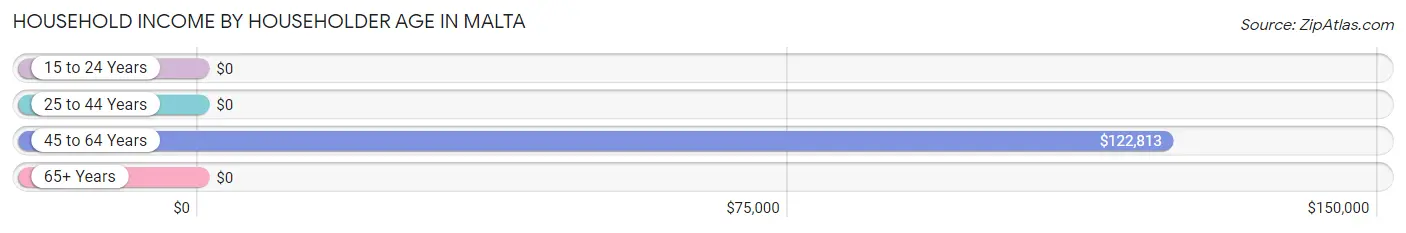
| Income Bracket | # Households | Median Income |
| 15 to 24 Years | 1 (1.3%) | $0 |
| 25 to 44 Years | 22 (28.6%) | $0 |
| 45 to 64 Years | 28 (36.4%) | $122,813 |
| 65+ Years | 26 (33.8%) | $0 |
| Total | 77 (100.0%) | $0 |
Poverty in Malta
Income Below Poverty by Sex and Age in Malta
With 54.4% poverty level for males and 72.8% for females among the residents of Malta, under 5 year old males and 6 to 11 year old females are the most vulnerable to poverty, with 21 males (100.0%) and 33 females (100.0%) in their respective age groups living below the poverty level.
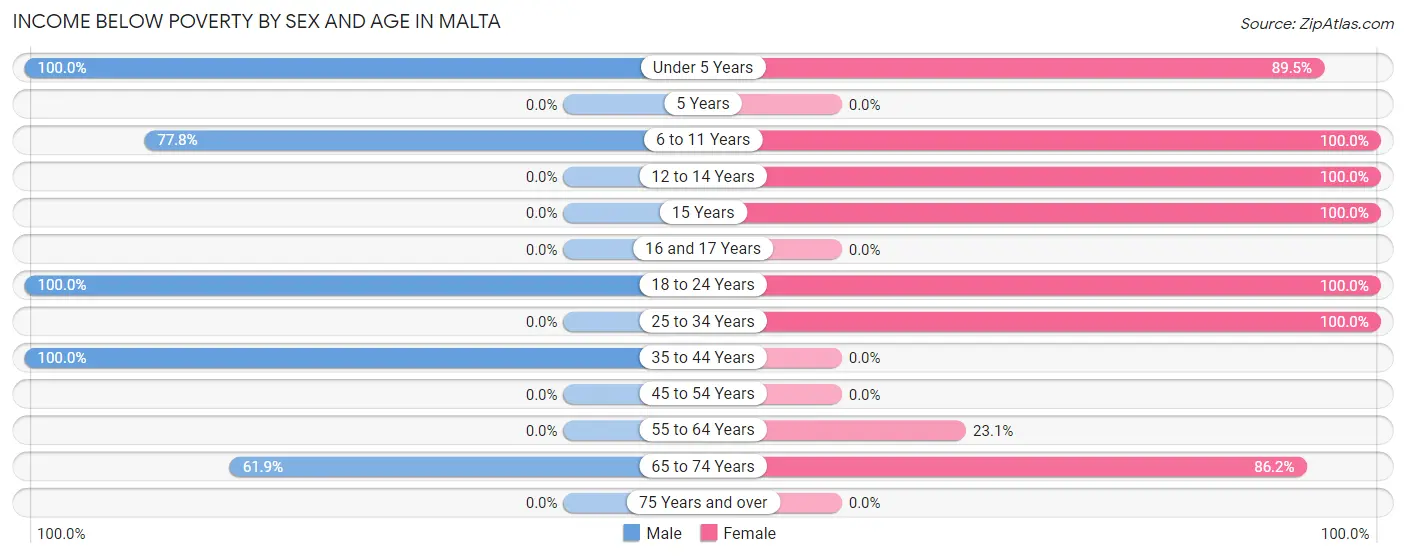
| Age Bracket | Male | Female |
| Under 5 Years | 21 (100.0%) | 17 (89.5%) |
| 5 Years | 0 (0.0%) | 0 (0.0%) |
| 6 to 11 Years | 14 (77.8%) | 33 (100.0%) |
| 12 to 14 Years | 0 (0.0%) | 14 (100.0%) |
| 15 Years | 0 (0.0%) | 19 (100.0%) |
| 16 and 17 Years | 0 (0.0%) | 0 (0.0%) |
| 18 to 24 Years | 1 (100.0%) | 1 (100.0%) |
| 25 to 34 Years | 0 (0.0%) | 8 (100.0%) |
| 35 to 44 Years | 19 (100.0%) | 0 (0.0%) |
| 45 to 54 Years | 0 (0.0%) | 0 (0.0%) |
| 55 to 64 Years | 0 (0.0%) | 6 (23.1%) |
| 65 to 74 Years | 13 (61.9%) | 25 (86.2%) |
| 75 Years and over | 0 (0.0%) | 0 (0.0%) |
| Total | 68 (54.4%) | 123 (72.8%) |
Income Above Poverty by Sex and Age in Malta
According to the poverty statistics in Malta, males aged 45 to 54 years and females aged 35 to 44 years are the age groups that are most secure financially, with 100.0% of males and 100.0% of females in these age groups living above the poverty line.
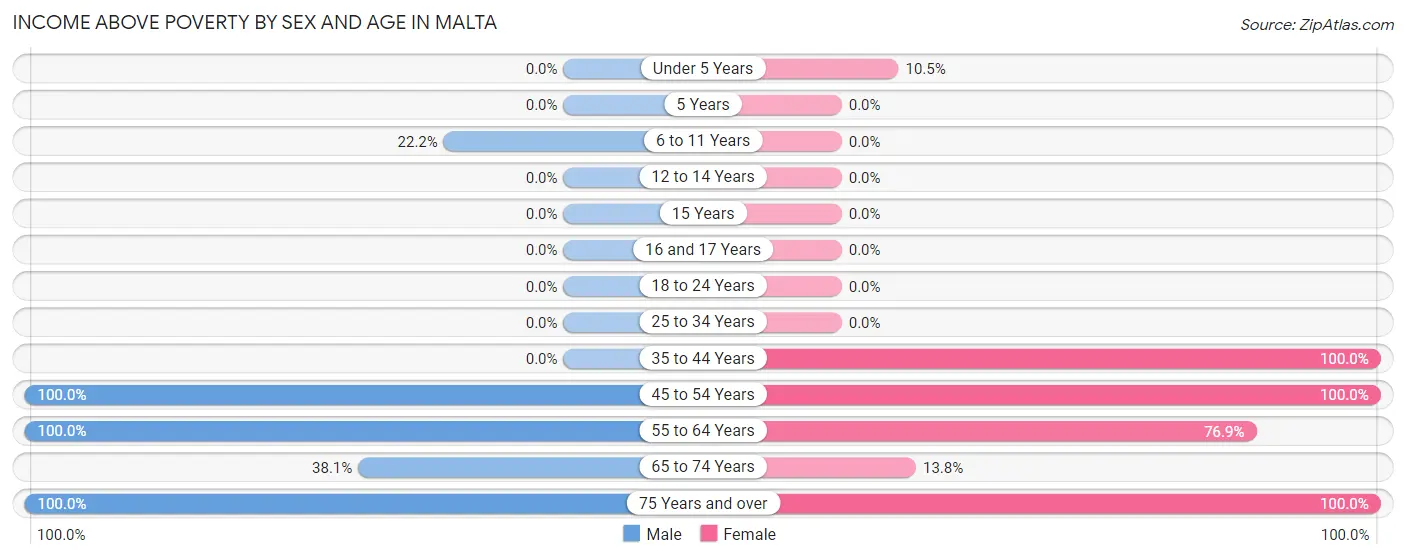
| Age Bracket | Male | Female |
| Under 5 Years | 0 (0.0%) | 2 (10.5%) |
| 5 Years | 0 (0.0%) | 0 (0.0%) |
| 6 to 11 Years | 4 (22.2%) | 0 (0.0%) |
| 12 to 14 Years | 0 (0.0%) | 0 (0.0%) |
| 15 Years | 0 (0.0%) | 0 (0.0%) |
| 16 and 17 Years | 0 (0.0%) | 0 (0.0%) |
| 18 to 24 Years | 0 (0.0%) | 0 (0.0%) |
| 25 to 34 Years | 0 (0.0%) | 0 (0.0%) |
| 35 to 44 Years | 0 (0.0%) | 3 (100.0%) |
| 45 to 54 Years | 11 (100.0%) | 8 (100.0%) |
| 55 to 64 Years | 23 (100.0%) | 20 (76.9%) |
| 65 to 74 Years | 8 (38.1%) | 4 (13.8%) |
| 75 Years and over | 11 (100.0%) | 9 (100.0%) |
| Total | 57 (45.6%) | 46 (27.2%) |
Income Below Poverty Among Married-Couple Families in Malta
The poverty statistics for married-couple families in Malta show that 45.2% or 33 of the total 73 families live below the poverty line. Families with 5 or more children have the highest poverty rate of 100.0%, comprising of 19 families. On the other hand, families with 3 or 4 children have the lowest poverty rate of 0.0%, which includes 0 families.
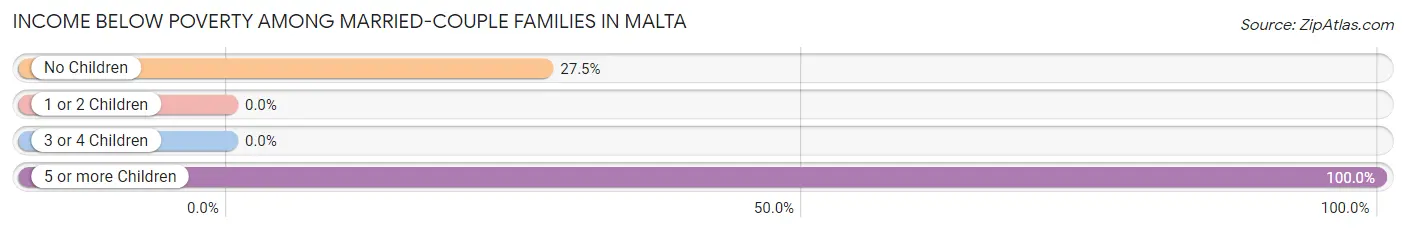
| Children | Above Poverty | Below Poverty |
| No Children | 37 (72.6%) | 14 (27.5%) |
| 1 or 2 Children | 0 (0.0%) | 0 (0.0%) |
| 3 or 4 Children | 3 (100.0%) | 0 (0.0%) |
| 5 or more Children | 0 (0.0%) | 19 (100.0%) |
| Total | 40 (54.8%) | 33 (45.2%) |
Income Below Poverty Among Single-Parent Households in Malta
| Children | Single Father | Single Mother |
| No Children | 0 (0.0%) | 0 (0.0%) |
| 1 or 2 Children | 0 (0.0%) | 0 (0.0%) |
| 3 or 4 Children | 0 (0.0%) | 0 (0.0%) |
| 5 or more Children | 0 (0.0%) | 0 (0.0%) |
| Total | 0 (0.0%) | 0 (0.0%) |
Income Below Poverty Among Married-Couple vs Single-Parent Households in Malta
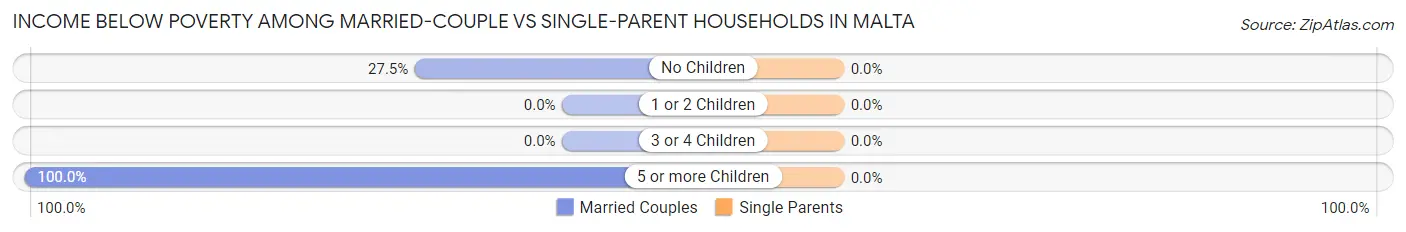
| Children | Married-Couple Families | Single-Parent Households |
| No Children | 14 (27.5%) | 0 (0.0%) |
| 1 or 2 Children | 0 (0.0%) | 0 (0.0%) |
| 3 or 4 Children | 0 (0.0%) | 0 (0.0%) |
| 5 or more Children | 19 (100.0%) | 0 (0.0%) |
| Total | 33 (45.2%) | 0 (0.0%) |
Race in Malta
The most populous races in Malta are White / Caucasian (291 | 99.0%), and Two or more Races (3 | 1.0%).
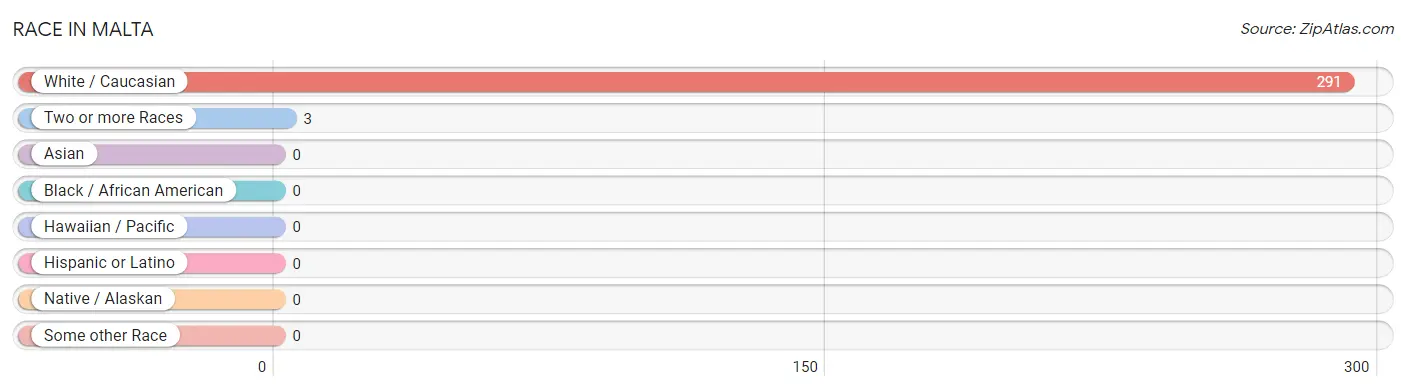
| Race | # Population | % Population |
| Asian | 0 | 0.0% |
| Black / African American | 0 | 0.0% |
| Hawaiian / Pacific | 0 | 0.0% |
| Hispanic or Latino | 0 | 0.0% |
| Native / Alaskan | 0 | 0.0% |
| White / Caucasian | 291 | 99.0% |
| Two or more Races | 3 | 1.0% |
| Some other Race | 0 | 0.0% |
| Total | 294 | 100.0% |
Ancestry in Malta
The most populous ancestries reported in Malta are English (190 | 64.6%), German (26 | 8.8%), Scottish (23 | 7.8%), Scotch-Irish (15 | 5.1%), and Welsh (13 | 4.4%), together accounting for 90.8% of all Malta residents.
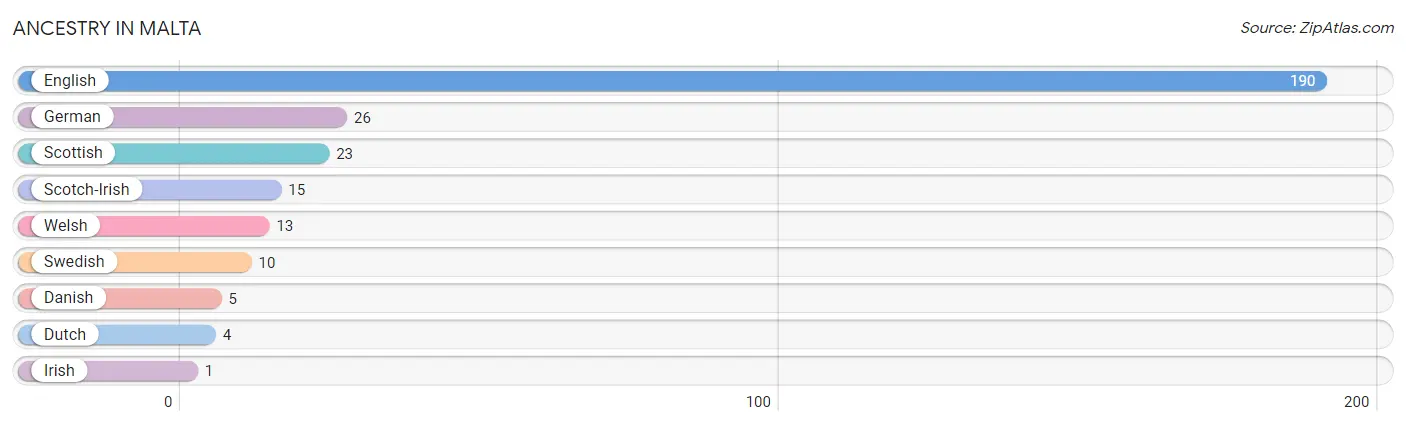
| Ancestry | # Population | % Population |
| Danish | 5 | 1.7% |
| Dutch | 4 | 1.4% |
| English | 190 | 64.6% |
| German | 26 | 8.8% |
| Irish | 1 | 0.3% |
| Scotch-Irish | 15 | 5.1% |
| Scottish | 23 | 7.8% |
| Swedish | 10 | 3.4% |
| Welsh | 13 | 4.4% | View All 9 Rows |
Immigrants in Malta

| Immigration Origin | # Population | % Population | View All 0 Rows |
Sex and Age in Malta
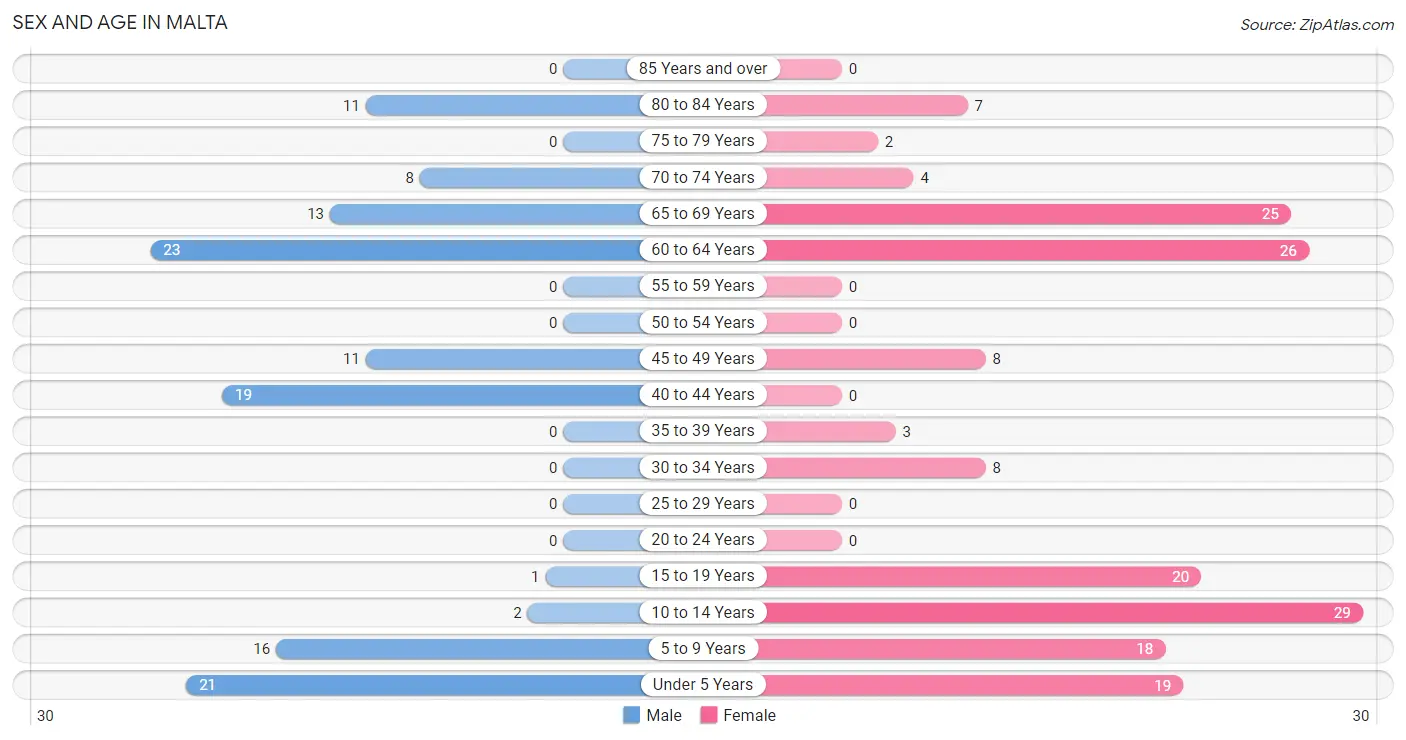
Sex and Age in Malta
The most populous age groups in Malta are 60 to 64 Years (23 | 18.4%) for men and 10 to 14 Years (29 | 17.2%) for women.
| Age Bracket | Male | Female |
| Under 5 Years | 21 (16.8%) | 19 (11.2%) |
| 5 to 9 Years | 16 (12.8%) | 18 (10.6%) |
| 10 to 14 Years | 2 (1.6%) | 29 (17.2%) |
| 15 to 19 Years | 1 (0.8%) | 20 (11.8%) |
| 20 to 24 Years | 0 (0.0%) | 0 (0.0%) |
| 25 to 29 Years | 0 (0.0%) | 0 (0.0%) |
| 30 to 34 Years | 0 (0.0%) | 8 (4.7%) |
| 35 to 39 Years | 0 (0.0%) | 3 (1.8%) |
| 40 to 44 Years | 19 (15.2%) | 0 (0.0%) |
| 45 to 49 Years | 11 (8.8%) | 8 (4.7%) |
| 50 to 54 Years | 0 (0.0%) | 0 (0.0%) |
| 55 to 59 Years | 0 (0.0%) | 0 (0.0%) |
| 60 to 64 Years | 23 (18.4%) | 26 (15.4%) |
| 65 to 69 Years | 13 (10.4%) | 25 (14.8%) |
| 70 to 74 Years | 8 (6.4%) | 4 (2.4%) |
| 75 to 79 Years | 0 (0.0%) | 2 (1.2%) |
| 80 to 84 Years | 11 (8.8%) | 7 (4.1%) |
| 85 Years and over | 0 (0.0%) | 0 (0.0%) |
| Total | 125 (100.0%) | 169 (100.0%) |
Families and Households in Malta
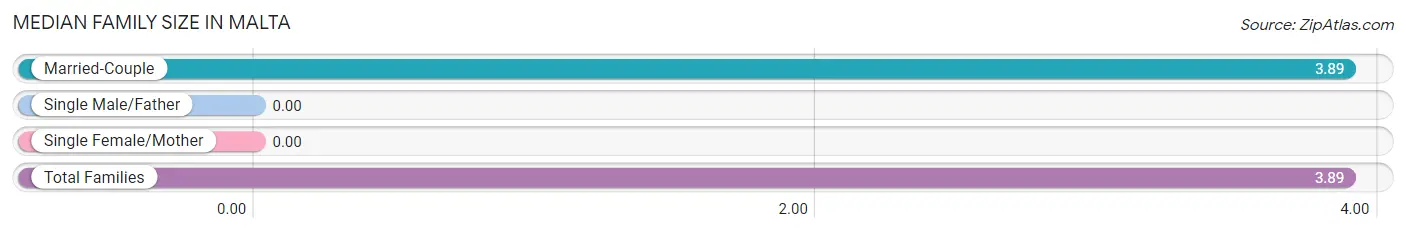
Median Family Size in Malta
| Family Type | # Families | Family Size |
| Married-Couple | 73 (100.0%) | 3.89 |
| Single Male/Father | 0 (0.0%) | - |
| Single Female/Mother | 0 (0.0%) | - |
| Total Families | 73 (100.0%) | 3.89 |
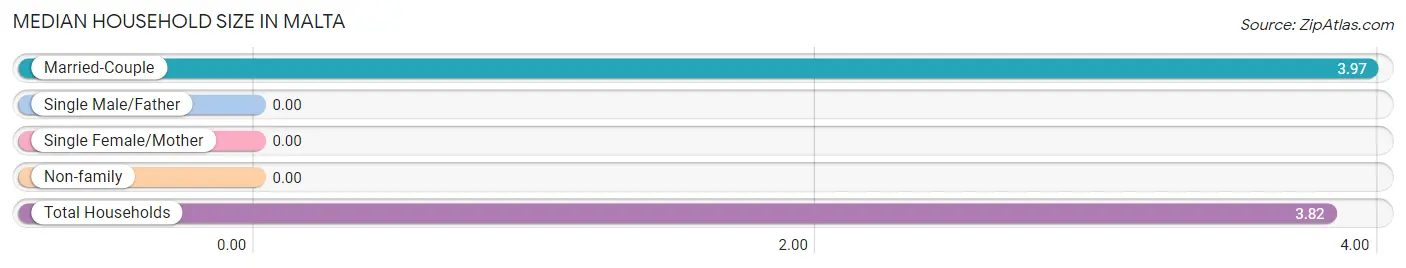
Median Household Size in Malta
| Household Type | # Households | Household Size |
| Married-Couple | 73 (94.8%) | 3.97 |
| Single Male/Father | 0 (0.0%) | - |
| Single Female/Mother | 0 (0.0%) | - |
| Non-family | 4 (5.2%) | - |
| Total Households | 77 (100.0%) | 3.82 |
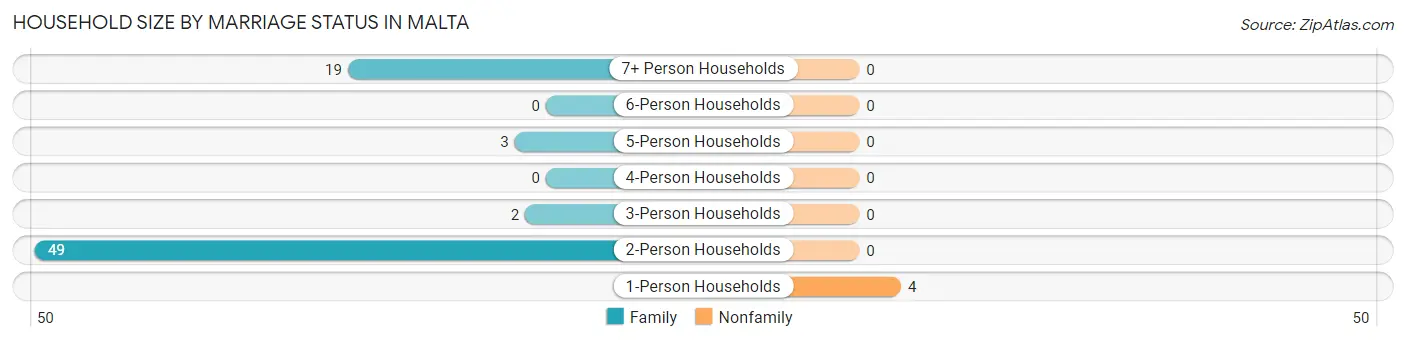
Household Size by Marriage Status in Malta
Out of a total of 77 households in Malta, 73 (94.8%) are family households, while 4 (5.2%) are nonfamily households. The most numerous type of family households are 2-person households, comprising 49, and the most common type of nonfamily households are 1-person households, comprising 4.
| Household Size | Family Households | Nonfamily Households |
| 1-Person Households | - | 4 (5.2%) |
| 2-Person Households | 49 (63.6%) | 0 (0.0%) |
| 3-Person Households | 2 (2.6%) | 0 (0.0%) |
| 4-Person Households | 0 (0.0%) | 0 (0.0%) |
| 5-Person Households | 3 (3.9%) | 0 (0.0%) |
| 6-Person Households | 0 (0.0%) | 0 (0.0%) |
| 7+ Person Households | 19 (24.7%) | 0 (0.0%) |
| Total | 73 (94.8%) | 4 (5.2%) |
Female Fertility in Malta
Fertility by Age in Malta
| Age Bracket | Women with Births | Births / 1,000 Women |
| 15 to 19 years | 0 (0.0%) | 0.0 |
| 20 to 34 years | 0 (0.0%) | 0.0 |
| 35 to 50 years | 0 (0.0%) | 0.0 |
| Total | 0 (0.0%) | 0.0 |
Fertility by Age by Marriage Status in Malta
| Age Bracket | Married | Unmarried |
| 15 to 19 years | 0 (0.0%) | 0 (0.0%) |
| 20 to 34 years | 0 (0.0%) | 0 (0.0%) |
| 35 to 50 years | 0 (0.0%) | 0 (0.0%) |
| Total | 0 (0.0%) | 0 (0.0%) |
Fertility by Education in Malta
| Educational Attainment | Women with Births | Births / 1,000 Women |
| Less than High School | 0 (0.0%) | 0.0 |
| High School Diploma | 0 (0.0%) | 0.0 |
| College or Associate's Degree | 0 (0.0%) | 0.0 |
| Bachelor's Degree | 0 (0.0%) | 0.0 |
| Graduate Degree | 0 (0.0%) | 0.0 |
| Total | 0 (0.0%) | 0.0 |
Fertility by Education by Marriage Status in Malta
| Educational Attainment | Married | Unmarried |
| Less than High School | 0 (0.0%) | 0 (0.0%) |
| High School Diploma | 0 (0.0%) | 0 (0.0%) |
| College or Associate's Degree | 0 (0.0%) | 0 (0.0%) |
| Bachelor's Degree | 0 (0.0%) | 0 (0.0%) |
| Graduate Degree | 0 (0.0%) | 0 (0.0%) |
| Total | 0 (0.0%) | 0 (0.0%) |
Employment Characteristics in Malta
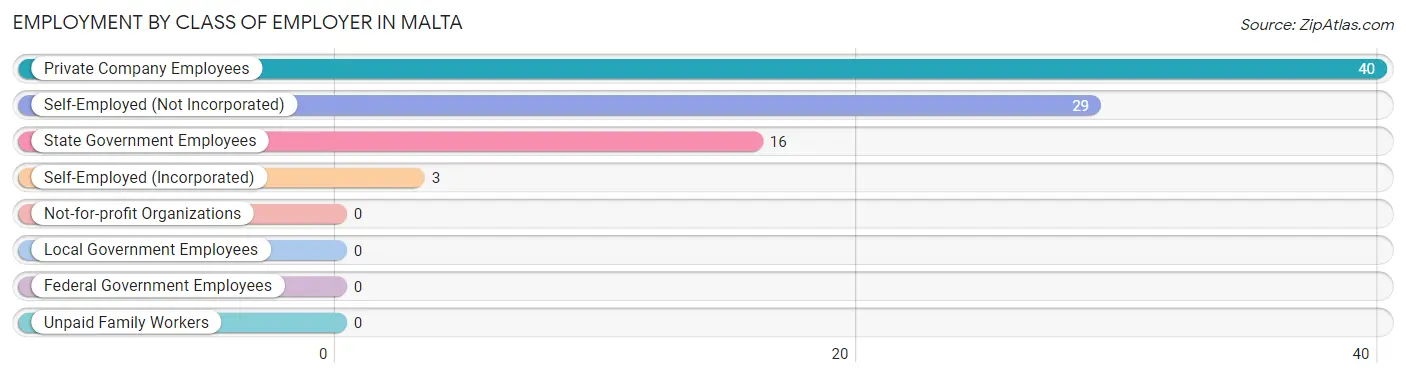
Employment by Class of Employer in Malta
Among the 88 employed individuals in Malta, private company employees (40 | 45.5%), self-employed (not incorporated) (29 | 33.0%), and state government employees (16 | 18.2%) make up the most common classes of employment.
| Employer Class | # Employees | % Employees |
| Private Company Employees | 40 | 45.5% |
| Self-Employed (Incorporated) | 3 | 3.4% |
| Self-Employed (Not Incorporated) | 29 | 33.0% |
| Not-for-profit Organizations | 0 | 0.0% |
| Local Government Employees | 0 | 0.0% |
| State Government Employees | 16 | 18.2% |
| Federal Government Employees | 0 | 0.0% |
| Unpaid Family Workers | 0 | 0.0% |
| Total | 88 | 100.0% |
Employment Status by Age in Malta
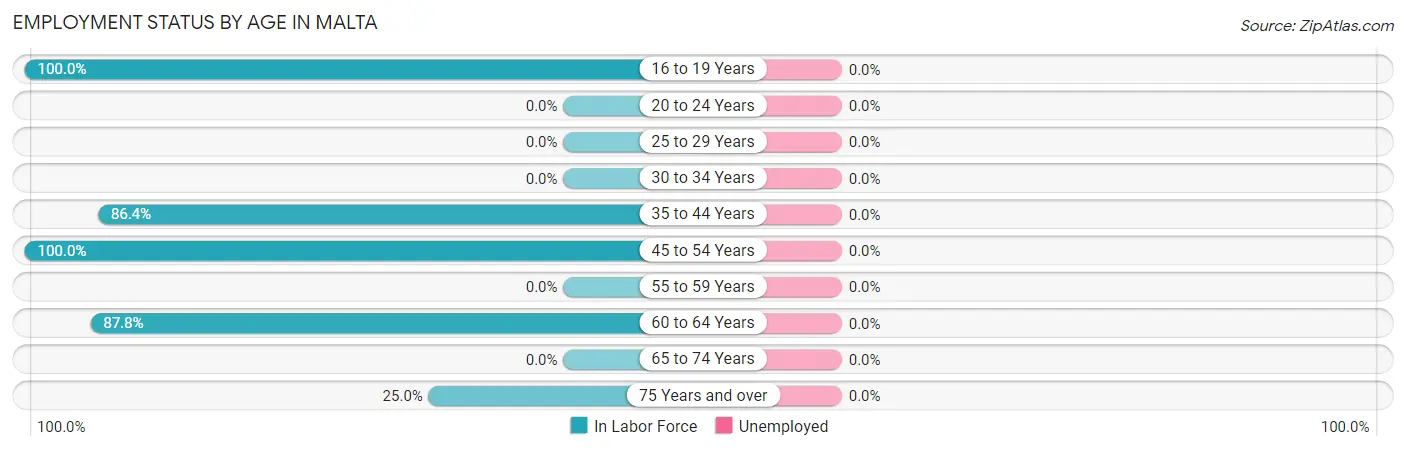
| Age Bracket | In Labor Force | Unemployed |
| 16 to 19 Years | 2 (100.0%) | 0 (0.0%) |
| 20 to 24 Years | 0 (0.0%) | 0 (0.0%) |
| 25 to 29 Years | 0 (0.0%) | 0 (0.0%) |
| 30 to 34 Years | 0 (0.0%) | 0 (0.0%) |
| 35 to 44 Years | 19 (86.4%) | 0 (0.0%) |
| 45 to 54 Years | 19 (100.0%) | 0 (0.0%) |
| 55 to 59 Years | 0 (0.0%) | 0 (0.0%) |
| 60 to 64 Years | 43 (87.8%) | 0 (0.0%) |
| 65 to 74 Years | 0 (0.0%) | 0 (0.0%) |
| 75 Years and over | 5 (25.0%) | 0 (0.0%) |
| Total | 88 (51.8%) | 0 (0.0%) |
Employment Status by Educational Attainment in Malta
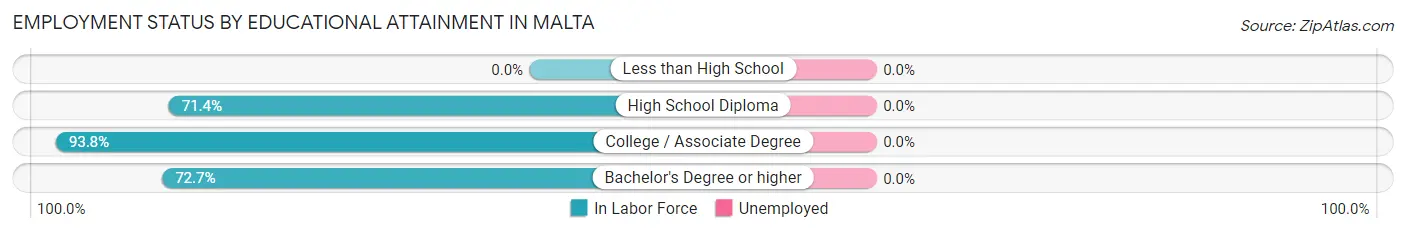
| Educational Attainment | In Labor Force | Unemployed |
| Less than High School | 0 (0.0%) | 0 (0.0%) |
| High School Diploma | 20 (71.4%) | 0 (0.0%) |
| College / Associate Degree | 45 (93.8%) | 0 (0.0%) |
| Bachelor's Degree or higher | 16 (72.7%) | 0 (0.0%) |
| Total | 81 (82.7%) | 0 (0.0%) |
Employment Occupations by Sex in Malta
Management, Business, Science and Arts Occupations
The most common Management, Business, Science and Arts occupations in Malta are , and Management (44 | 50.0%).
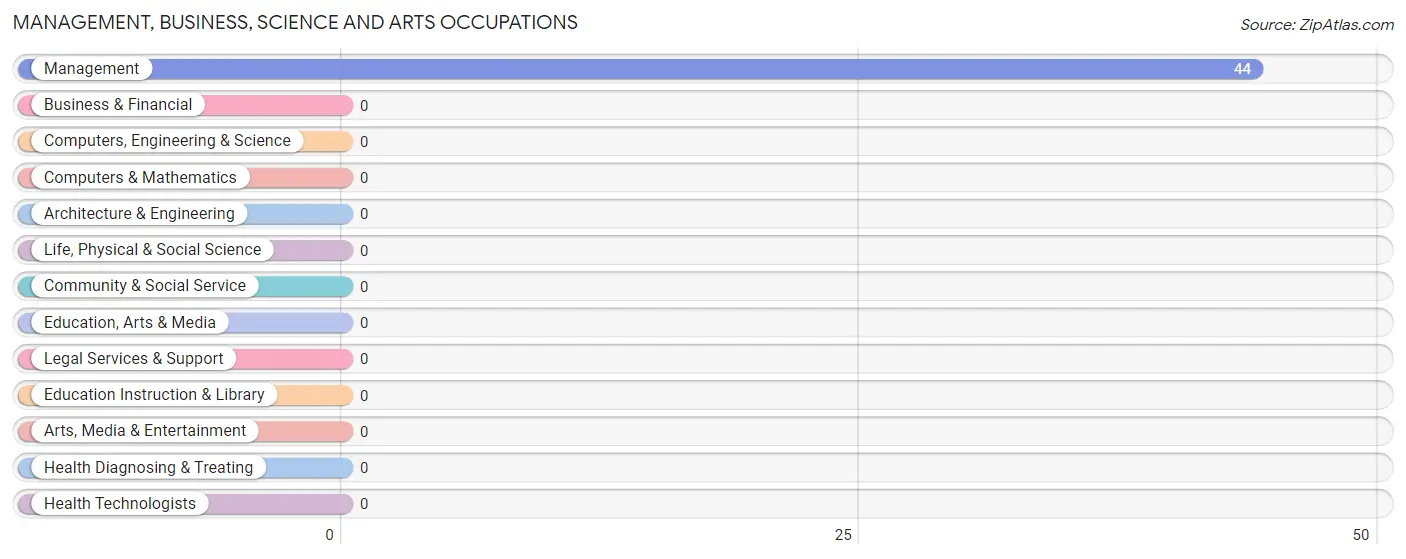
Management, Business, Science and Arts Occupations by Sex
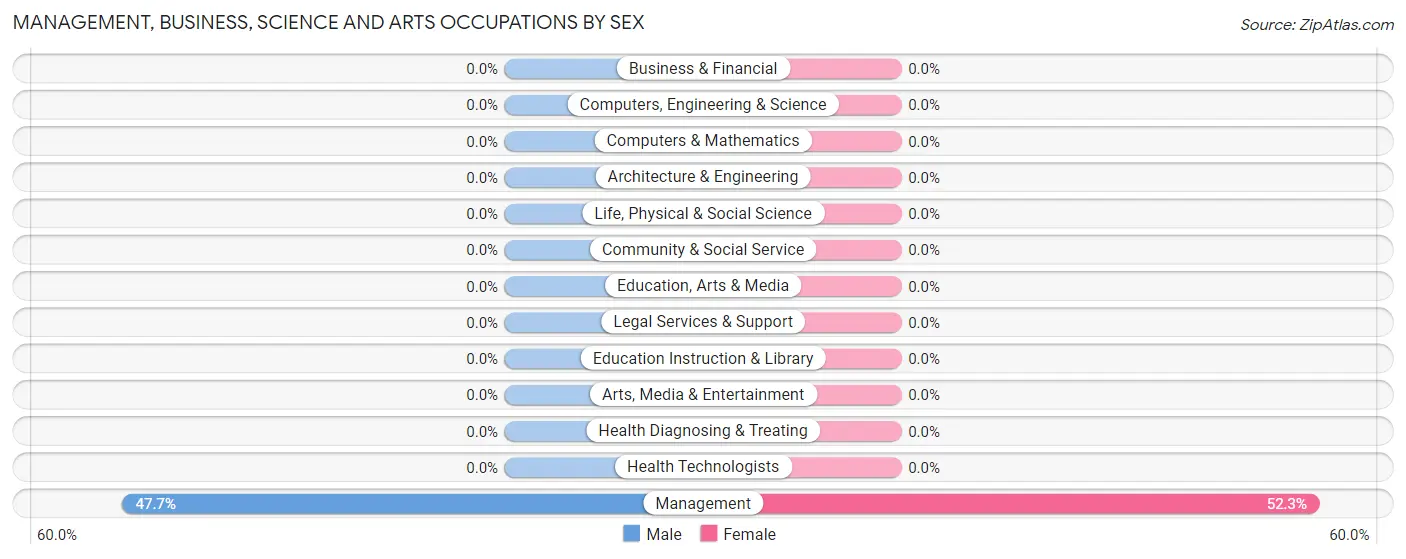
| Occupation | Male | Female |
| Management | 21 (47.7%) | 23 (52.3%) |
| Business & Financial | 0 (0.0%) | 0 (0.0%) |
| Computers, Engineering & Science | 0 (0.0%) | 0 (0.0%) |
| Computers & Mathematics | 0 (0.0%) | 0 (0.0%) |
| Architecture & Engineering | 0 (0.0%) | 0 (0.0%) |
| Life, Physical & Social Science | 0 (0.0%) | 0 (0.0%) |
| Community & Social Service | 0 (0.0%) | 0 (0.0%) |
| Education, Arts & Media | 0 (0.0%) | 0 (0.0%) |
| Legal Services & Support | 0 (0.0%) | 0 (0.0%) |
| Education Instruction & Library | 0 (0.0%) | 0 (0.0%) |
| Arts, Media & Entertainment | 0 (0.0%) | 0 (0.0%) |
| Health Diagnosing & Treating | 0 (0.0%) | 0 (0.0%) |
| Health Technologists | 0 (0.0%) | 0 (0.0%) |
| Total (Category) | 21 (47.7%) | 23 (52.3%) |
| Total (Overall) | 56 (63.6%) | 32 (36.4%) |
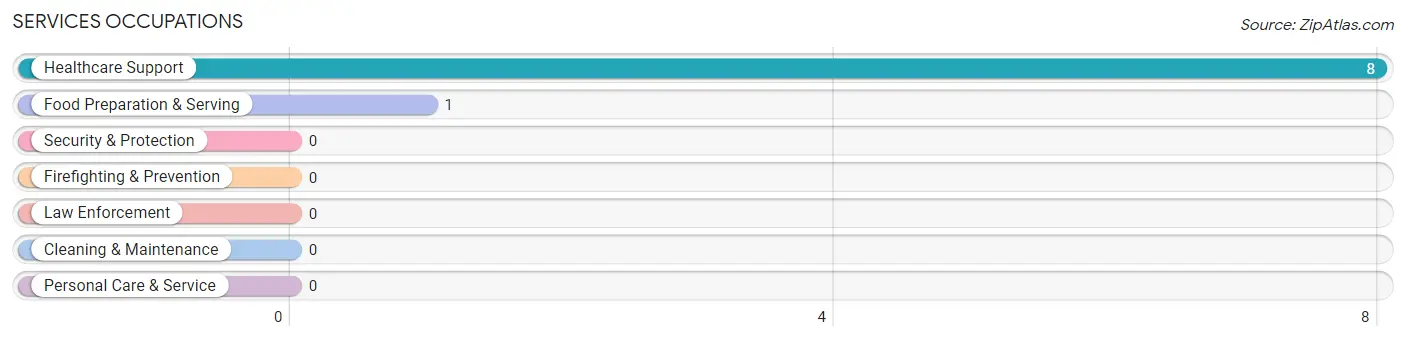
Services Occupations
The most common Services occupations in Malta are Healthcare Support (8 | 9.1%), and Food Preparation & Serving (1 | 1.1%).
Services Occupations by Sex
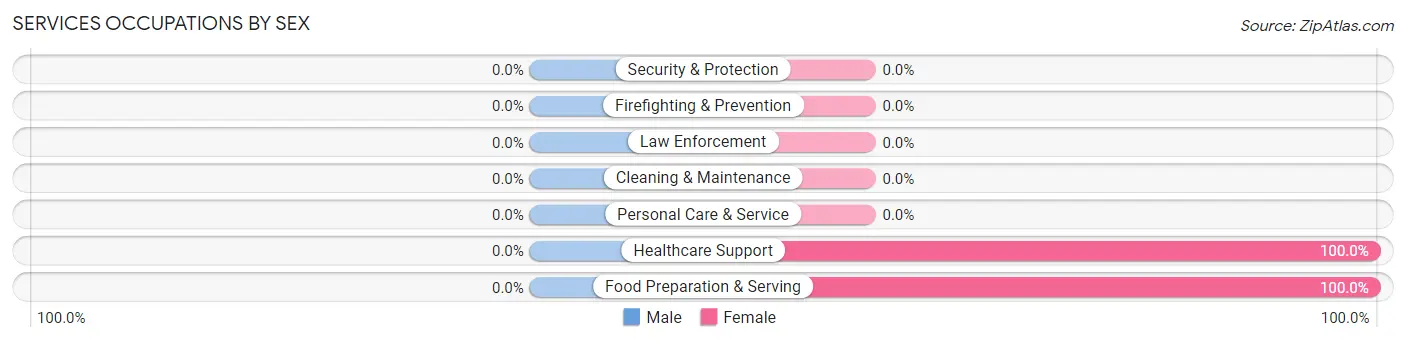
| Occupation | Male | Female |
| Healthcare Support | 0 (0.0%) | 8 (100.0%) |
| Security & Protection | 0 (0.0%) | 0 (0.0%) |
| Firefighting & Prevention | 0 (0.0%) | 0 (0.0%) |
| Law Enforcement | 0 (0.0%) | 0 (0.0%) |
| Food Preparation & Serving | 0 (0.0%) | 1 (100.0%) |
| Cleaning & Maintenance | 0 (0.0%) | 0 (0.0%) |
| Personal Care & Service | 0 (0.0%) | 0 (0.0%) |
| Total (Category) | 0 (0.0%) | 9 (100.0%) |
| Total (Overall) | 56 (63.6%) | 32 (36.4%) |
Sales and Office Occupations

Sales and Office Occupations by Sex
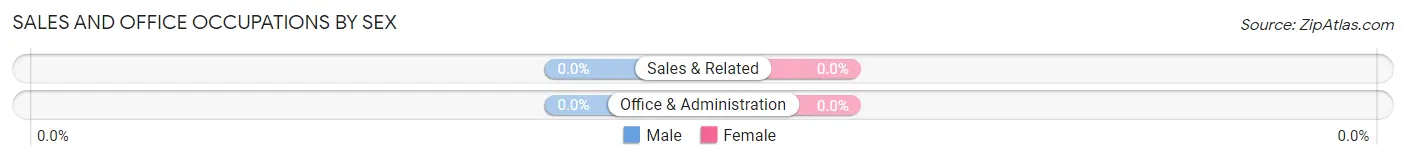
| Occupation | Male | Female |
| Sales & Related | 0 (0.0%) | 0 (0.0%) |
| Office & Administration | 0 (0.0%) | 0 (0.0%) |
| Total (Category) | 0 (0.0%) | 0 (0.0%) |
| Total (Overall) | 56 (63.6%) | 32 (36.4%) |
Natural Resources, Construction and Maintenance Occupations
Natural Resources, Construction and Maintenance Occupations by Sex
| Occupation | Male | Female |
| Farming, Fishing & Forestry | 0 (0.0%) | 0 (0.0%) |
| Construction & Extraction | 0 (0.0%) | 0 (0.0%) |
| Installation, Maintenance & Repair | 0 (0.0%) | 0 (0.0%) |
| Total (Category) | 0 (0.0%) | 0 (0.0%) |
| Total (Overall) | 56 (63.6%) | 32 (36.4%) |
Production, Transportation and Moving Occupations
The most common Production, Transportation and Moving occupations in Malta are Production (24 | 27.3%), and Transportation (11 | 12.5%).
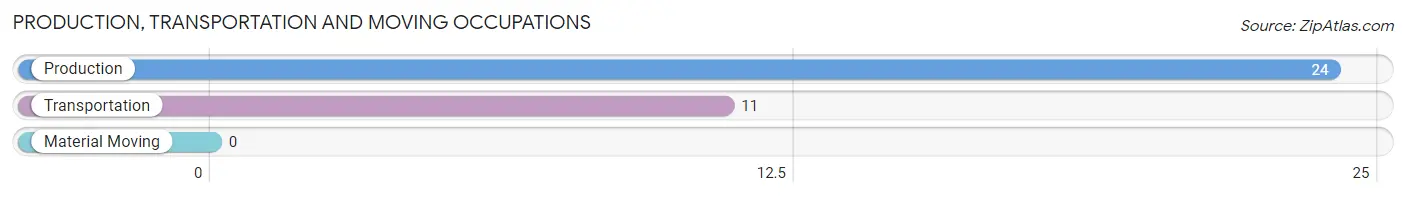
Production, Transportation and Moving Occupations by Sex
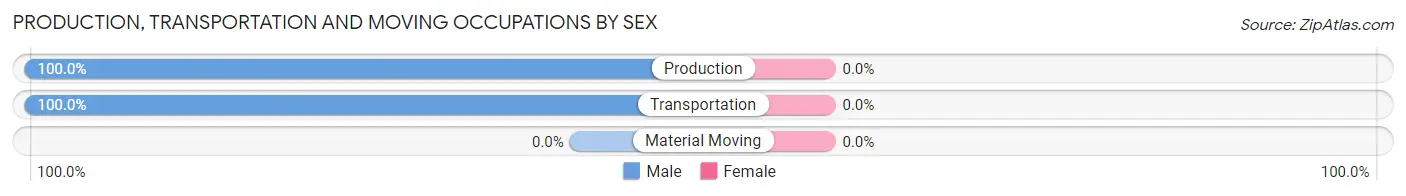
| Occupation | Male | Female |
| Production | 24 (100.0%) | 0 (0.0%) |
| Transportation | 11 (100.0%) | 0 (0.0%) |
| Material Moving | 0 (0.0%) | 0 (0.0%) |
| Total (Category) | 35 (100.0%) | 0 (0.0%) |
| Total (Overall) | 56 (63.6%) | 32 (36.4%) |
Employment Industries by Sex in Malta
Employment Industries in Malta
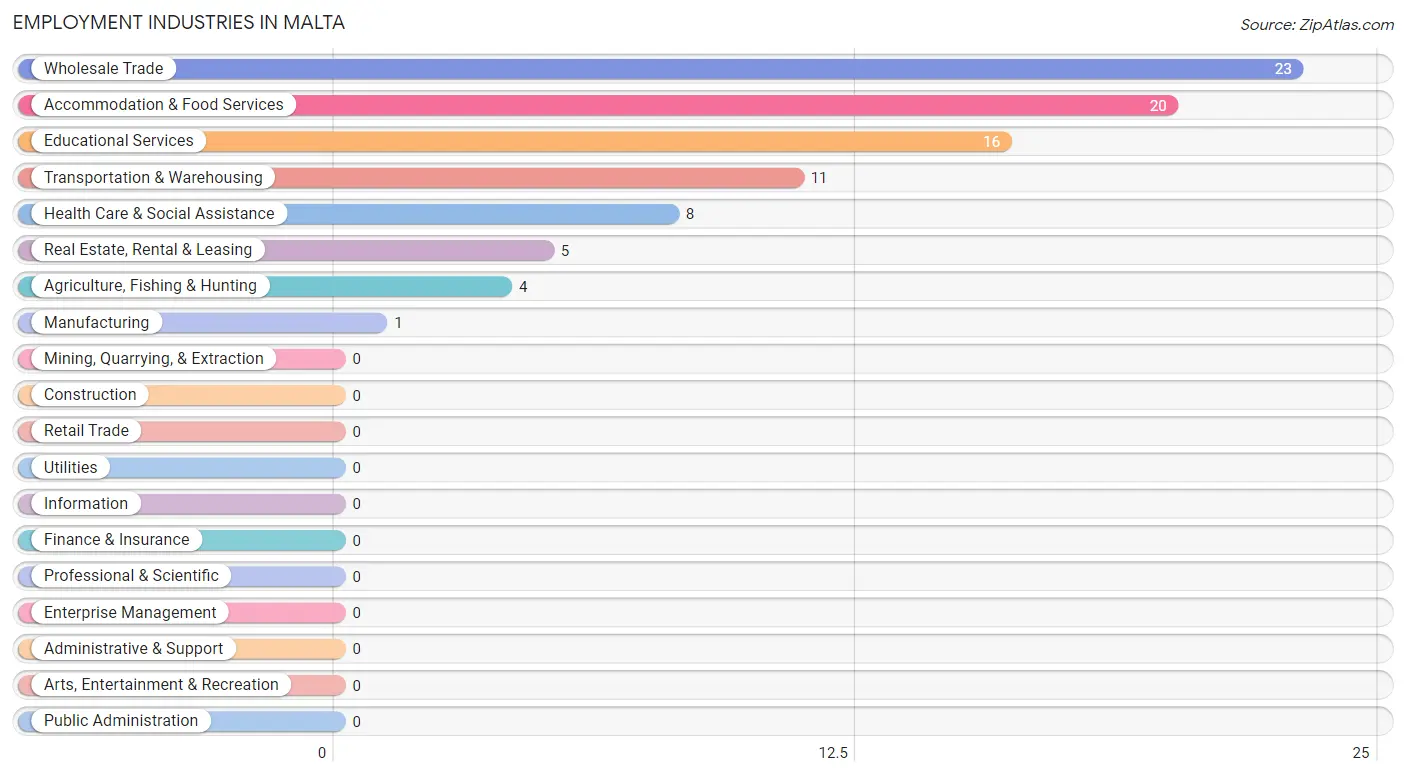
The major employment industries in Malta include Wholesale Trade (23 | 26.1%), Accommodation & Food Services (20 | 22.7%), Educational Services (16 | 18.2%), Transportation & Warehousing (11 | 12.5%), and Health Care & Social Assistance (8 | 9.1%).
Employment Industries by Sex in Malta
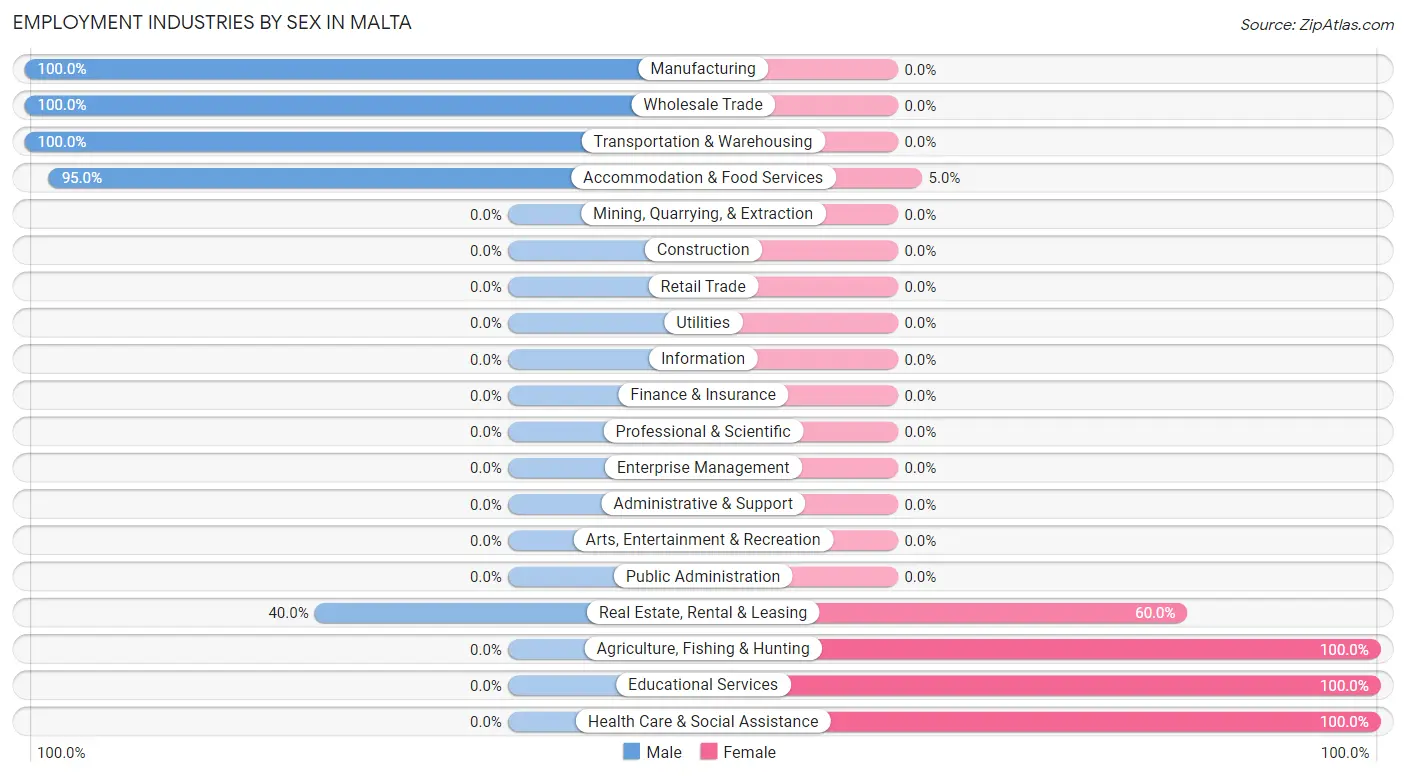
The Malta industries that see more men than women are Manufacturing (100.0%), Wholesale Trade (100.0%), and Transportation & Warehousing (100.0%), whereas the industries that tend to have a higher number of women are Agriculture, Fishing & Hunting (100.0%), Educational Services (100.0%), and Health Care & Social Assistance (100.0%).
| Industry | Male | Female |
| Agriculture, Fishing & Hunting | 0 (0.0%) | 4 (100.0%) |
| Mining, Quarrying, & Extraction | 0 (0.0%) | 0 (0.0%) |
| Construction | 0 (0.0%) | 0 (0.0%) |
| Manufacturing | 1 (100.0%) | 0 (0.0%) |
| Wholesale Trade | 23 (100.0%) | 0 (0.0%) |
| Retail Trade | 0 (0.0%) | 0 (0.0%) |
| Transportation & Warehousing | 11 (100.0%) | 0 (0.0%) |
| Utilities | 0 (0.0%) | 0 (0.0%) |
| Information | 0 (0.0%) | 0 (0.0%) |
| Finance & Insurance | 0 (0.0%) | 0 (0.0%) |
| Real Estate, Rental & Leasing | 2 (40.0%) | 3 (60.0%) |
| Professional & Scientific | 0 (0.0%) | 0 (0.0%) |
| Enterprise Management | 0 (0.0%) | 0 (0.0%) |
| Administrative & Support | 0 (0.0%) | 0 (0.0%) |
| Educational Services | 0 (0.0%) | 16 (100.0%) |
| Health Care & Social Assistance | 0 (0.0%) | 8 (100.0%) |
| Arts, Entertainment & Recreation | 0 (0.0%) | 0 (0.0%) |
| Accommodation & Food Services | 19 (95.0%) | 1 (5.0%) |
| Public Administration | 0 (0.0%) | 0 (0.0%) |
| Total | 56 (63.6%) | 32 (36.4%) |
Education in Malta
School Enrollment in Malta
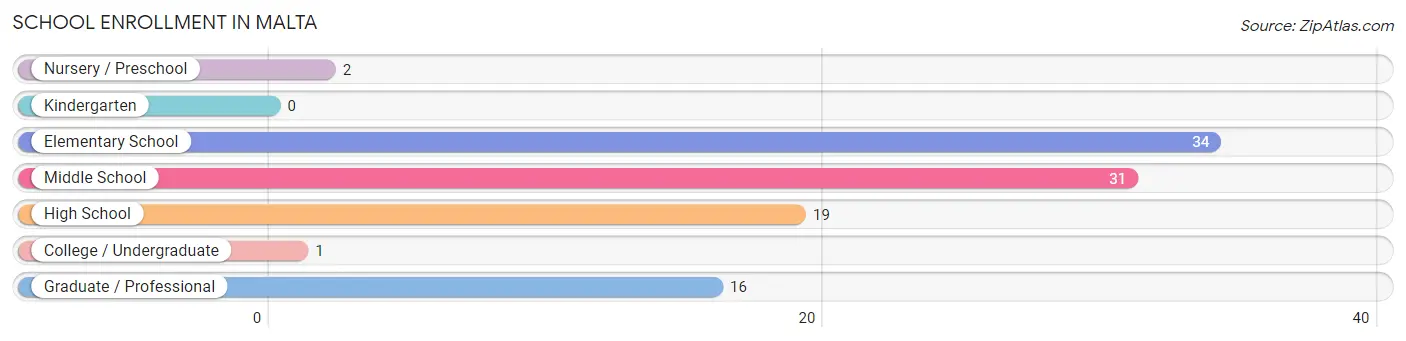
The most common levels of schooling among the 103 students in Malta are elementary school (34 | 33.0%), middle school (31 | 30.1%), and high school (19 | 18.4%).
| School Level | # Students | % Students |
| Nursery / Preschool | 2 | 1.9% |
| Kindergarten | 0 | 0.0% |
| Elementary School | 34 | 33.0% |
| Middle School | 31 | 30.1% |
| High School | 19 | 18.4% |
| College / Undergraduate | 1 | 1.0% |
| Graduate / Professional | 16 | 15.5% |
| Total | 103 | 100.0% |
School Enrollment by Age by Funding Source in Malta
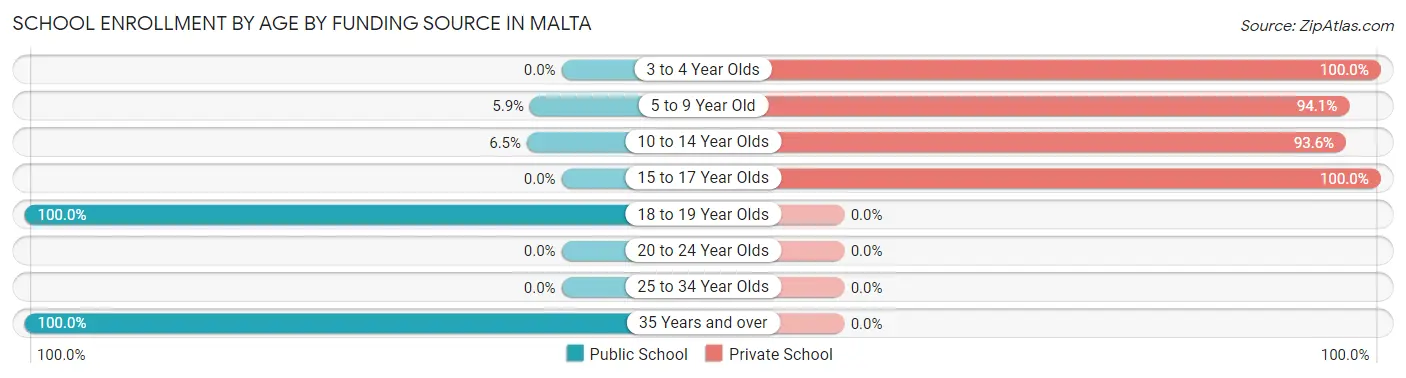
Out of a total of 103 students who are enrolled in schools in Malta, 82 (79.6%) attend a private institution, while the remaining 21 (20.4%) are enrolled in public schools. The age group of 3 to 4 year olds has the highest likelihood of being enrolled in private schools, with 2 (100.0% in the age bracket) enrolled. Conversely, the age group of 18 to 19 year olds has the lowest likelihood of being enrolled in a private school, with 1 (100.0% in the age bracket) attending a public institution.
| Age Bracket | Public School | Private School |
| 3 to 4 Year Olds | 0 (0.0%) | 2 (100.0%) |
| 5 to 9 Year Old | 2 (5.9%) | 32 (94.1%) |
| 10 to 14 Year Olds | 2 (6.5%) | 29 (93.5%) |
| 15 to 17 Year Olds | 0 (0.0%) | 19 (100.0%) |
| 18 to 19 Year Olds | 1 (100.0%) | 0 (0.0%) |
| 20 to 24 Year Olds | 0 (0.0%) | 0 (0.0%) |
| 25 to 34 Year Olds | 0 (0.0%) | 0 (0.0%) |
| 35 Years and over | 16 (100.0%) | 0 (0.0%) |
| Total | 21 (20.4%) | 82 (79.6%) |
Educational Attainment by Field of Study in Malta
Education (16 | 47.1%), science & technology (11 | 32.4%), social sciences (3 | 8.8%), bio, nature & agricultural (2 | 5.9%), and business (2 | 5.9%) are the most common fields of study among 34 individuals in Malta who have obtained a bachelor's degree or higher.
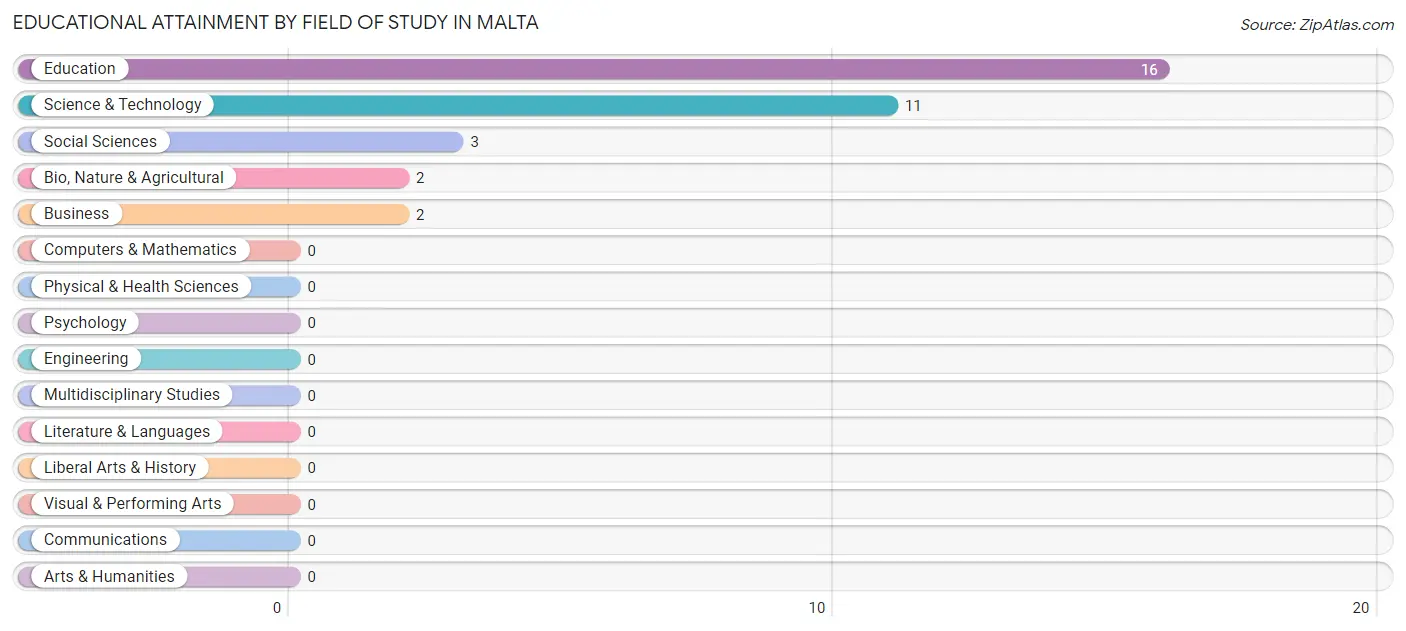
| Field of Study | # Graduates | % Graduates |
| Computers & Mathematics | 0 | 0.0% |
| Bio, Nature & Agricultural | 2 | 5.9% |
| Physical & Health Sciences | 0 | 0.0% |
| Psychology | 0 | 0.0% |
| Social Sciences | 3 | 8.8% |
| Engineering | 0 | 0.0% |
| Multidisciplinary Studies | 0 | 0.0% |
| Science & Technology | 11 | 32.4% |
| Business | 2 | 5.9% |
| Education | 16 | 47.1% |
| Literature & Languages | 0 | 0.0% |
| Liberal Arts & History | 0 | 0.0% |
| Visual & Performing Arts | 0 | 0.0% |
| Communications | 0 | 0.0% |
| Arts & Humanities | 0 | 0.0% |
| Total | 34 | 100.0% |
Transportation & Commute in Malta
Vehicle Availability by Sex in Malta
The most prevalent vehicle ownership categories in Malta are males with 3 vehicles (42, accounting for 75.0%) and females with 3 vehicles (16, making up 131.2%).
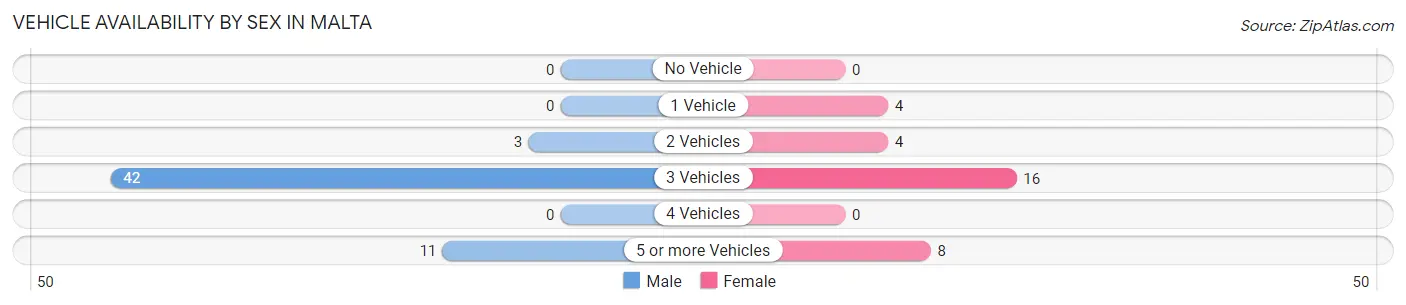
| Vehicles Available | Male | Female |
| No Vehicle | 0 (0.0%) | 0 (0.0%) |
| 1 Vehicle | 0 (0.0%) | 4 (12.5%) |
| 2 Vehicles | 3 (5.4%) | 4 (12.5%) |
| 3 Vehicles | 42 (75.0%) | 16 (50.0%) |
| 4 Vehicles | 0 (0.0%) | 0 (0.0%) |
| 5 or more Vehicles | 11 (19.6%) | 8 (25.0%) |
| Total | 56 (100.0%) | 32 (100.0%) |
Commute Time in Malta
The most frequently occuring commute durations in Malta are 5 to 9 minutes (28 commuters, 36.8%), 10 to 14 minutes (23 commuters, 30.3%), and less than 5 minutes (16 commuters, 21.0%).
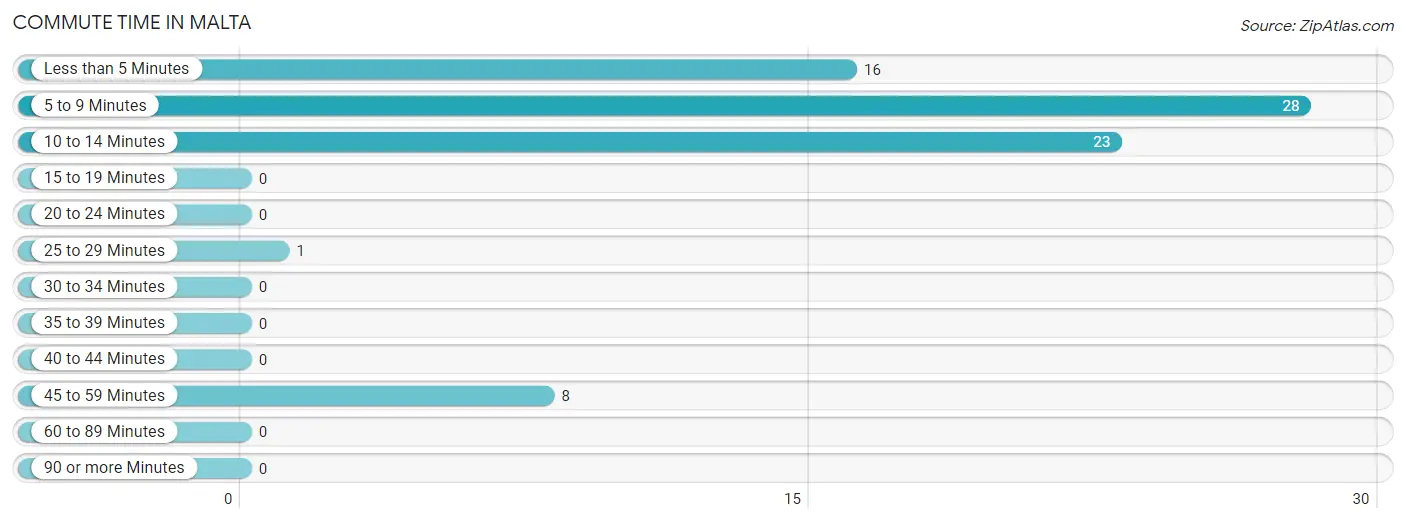
| Commute Time | # Commuters | % Commuters |
| Less than 5 Minutes | 16 | 21.0% |
| 5 to 9 Minutes | 28 | 36.8% |
| 10 to 14 Minutes | 23 | 30.3% |
| 15 to 19 Minutes | 0 | 0.0% |
| 20 to 24 Minutes | 0 | 0.0% |
| 25 to 29 Minutes | 1 | 1.3% |
| 30 to 34 Minutes | 0 | 0.0% |
| 35 to 39 Minutes | 0 | 0.0% |
| 40 to 44 Minutes | 0 | 0.0% |
| 45 to 59 Minutes | 8 | 10.5% |
| 60 to 89 Minutes | 0 | 0.0% |
| 90 or more Minutes | 0 | 0.0% |
Commute Time by Sex in Malta
The most common commute times in Malta are 10 to 14 minutes (23 commuters, 45.1%) for males and less than 5 minutes (16 commuters, 64.0%) for females.
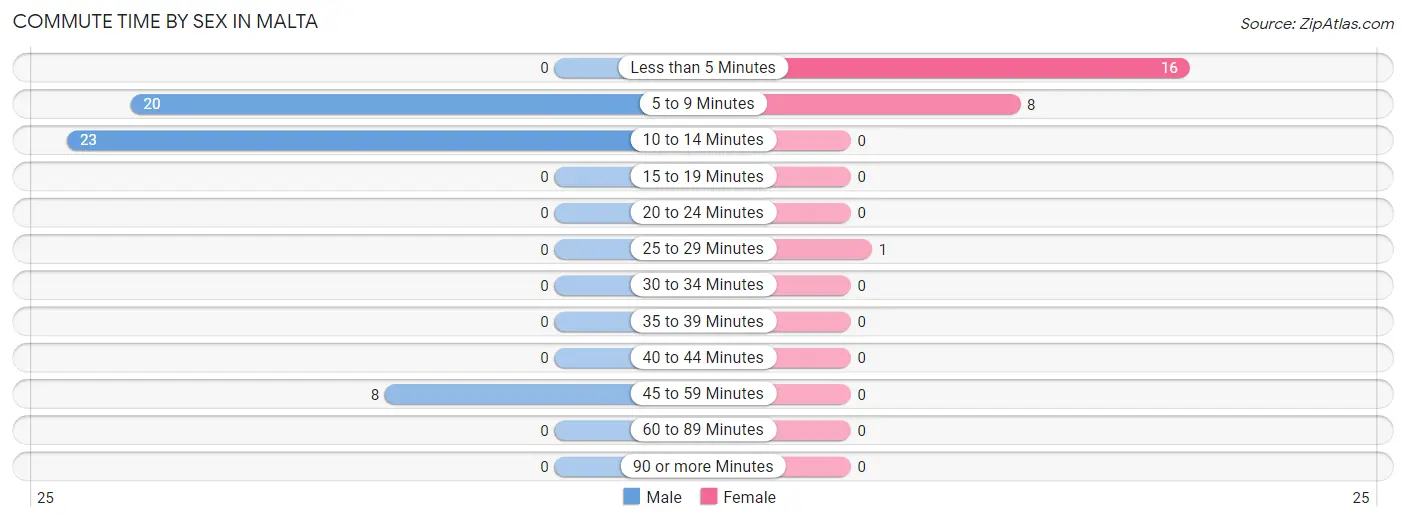
| Commute Time | Male | Female |
| Less than 5 Minutes | 0 (0.0%) | 16 (64.0%) |
| 5 to 9 Minutes | 20 (39.2%) | 8 (32.0%) |
| 10 to 14 Minutes | 23 (45.1%) | 0 (0.0%) |
| 15 to 19 Minutes | 0 (0.0%) | 0 (0.0%) |
| 20 to 24 Minutes | 0 (0.0%) | 0 (0.0%) |
| 25 to 29 Minutes | 0 (0.0%) | 1 (4.0%) |
| 30 to 34 Minutes | 0 (0.0%) | 0 (0.0%) |
| 35 to 39 Minutes | 0 (0.0%) | 0 (0.0%) |
| 40 to 44 Minutes | 0 (0.0%) | 0 (0.0%) |
| 45 to 59 Minutes | 8 (15.7%) | 0 (0.0%) |
| 60 to 89 Minutes | 0 (0.0%) | 0 (0.0%) |
| 90 or more Minutes | 0 (0.0%) | 0 (0.0%) |
Time of Departure to Work by Sex in Malta
The most frequent times of departure to work in Malta are 8:00 AM to 8:29 AM (23, 45.1%) for males and 7:00 AM to 7:29 AM (16, 64.0%) for females.
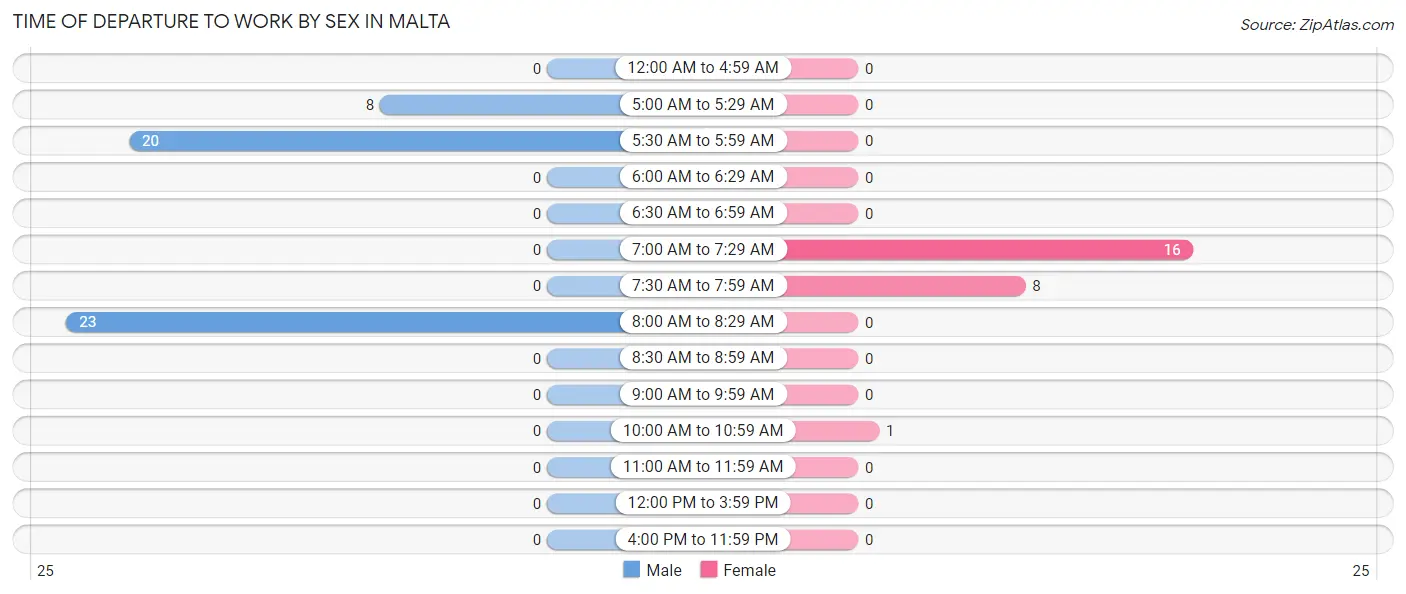
| Time of Departure | Male | Female |
| 12:00 AM to 4:59 AM | 0 (0.0%) | 0 (0.0%) |
| 5:00 AM to 5:29 AM | 8 (15.7%) | 0 (0.0%) |
| 5:30 AM to 5:59 AM | 20 (39.2%) | 0 (0.0%) |
| 6:00 AM to 6:29 AM | 0 (0.0%) | 0 (0.0%) |
| 6:30 AM to 6:59 AM | 0 (0.0%) | 0 (0.0%) |
| 7:00 AM to 7:29 AM | 0 (0.0%) | 16 (64.0%) |
| 7:30 AM to 7:59 AM | 0 (0.0%) | 8 (32.0%) |
| 8:00 AM to 8:29 AM | 23 (45.1%) | 0 (0.0%) |
| 8:30 AM to 8:59 AM | 0 (0.0%) | 0 (0.0%) |
| 9:00 AM to 9:59 AM | 0 (0.0%) | 0 (0.0%) |
| 10:00 AM to 10:59 AM | 0 (0.0%) | 1 (4.0%) |
| 11:00 AM to 11:59 AM | 0 (0.0%) | 0 (0.0%) |
| 12:00 PM to 3:59 PM | 0 (0.0%) | 0 (0.0%) |
| 4:00 PM to 11:59 PM | 0 (0.0%) | 0 (0.0%) |
| Total | 51 (100.0%) | 25 (100.0%) |
Housing Occupancy in Malta
Occupancy by Ownership in Malta
Of the total 77 dwellings in Malta, owner-occupied units account for 73 (94.8%), while renter-occupied units make up 4 (5.2%).
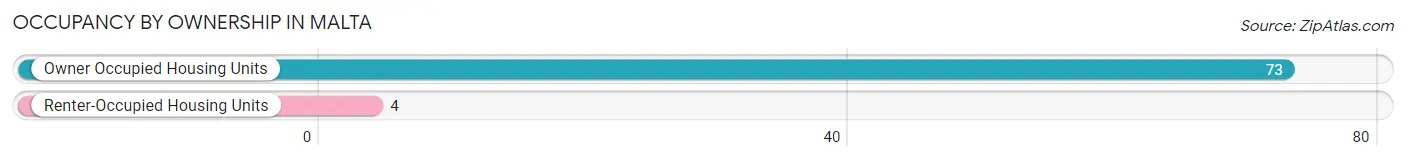
| Occupancy | # Housing Units | % Housing Units |
| Owner Occupied Housing Units | 73 | 94.8% |
| Renter-Occupied Housing Units | 4 | 5.2% |
| Total Occupied Housing Units | 77 | 100.0% |
Occupancy by Household Size in Malta
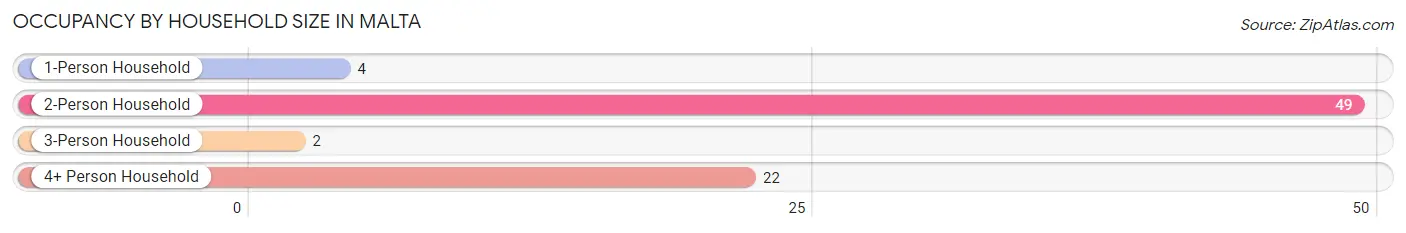
| Household Size | # Housing Units | % Housing Units |
| 1-Person Household | 4 | 5.2% |
| 2-Person Household | 49 | 63.6% |
| 3-Person Household | 2 | 2.6% |
| 4+ Person Household | 22 | 28.6% |
| Total Housing Units | 77 | 100.0% |
Occupancy by Ownership by Household Size in Malta
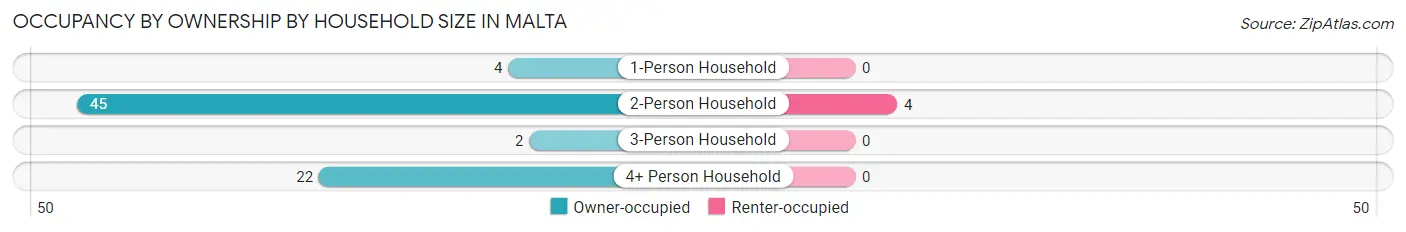
| Household Size | Owner-occupied | Renter-occupied |
| 1-Person Household | 4 (100.0%) | 0 (0.0%) |
| 2-Person Household | 45 (91.8%) | 4 (8.2%) |
| 3-Person Household | 2 (100.0%) | 0 (0.0%) |
| 4+ Person Household | 22 (100.0%) | 0 (0.0%) |
| Total Housing Units | 73 (94.8%) | 4 (5.2%) |
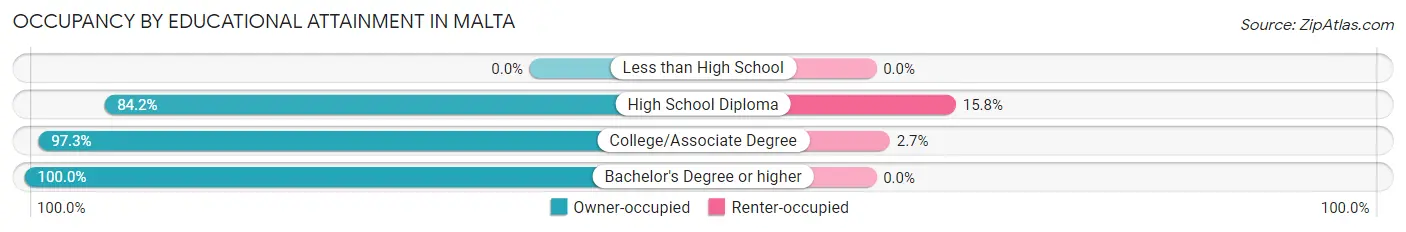
Occupancy by Educational Attainment in Malta
| Household Size | Owner-occupied | Renter-occupied |
| Less than High School | 0 (0.0%) | 0 (0.0%) |
| High School Diploma | 16 (84.2%) | 3 (15.8%) |
| College/Associate Degree | 36 (97.3%) | 1 (2.7%) |
| Bachelor's Degree or higher | 21 (100.0%) | 0 (0.0%) |
Occupancy by Age of Householder in Malta
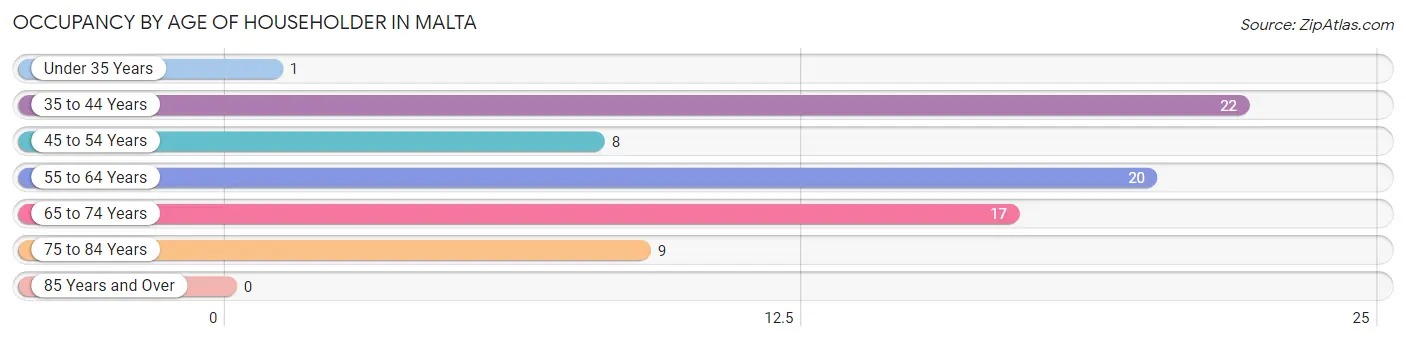
| Age Bracket | # Households | % Households |
| Under 35 Years | 1 | 1.3% |
| 35 to 44 Years | 22 | 28.6% |
| 45 to 54 Years | 8 | 10.4% |
| 55 to 64 Years | 20 | 26.0% |
| 65 to 74 Years | 17 | 22.1% |
| 75 to 84 Years | 9 | 11.7% |
| 85 Years and Over | 0 | 0.0% |
| Total | 77 | 100.0% |
Housing Finances in Malta
Median Income by Occupancy in Malta
| Occupancy Type | # Households | Median Income |
| Owner-Occupied | 73 (94.8%) | $0 |
| Renter-Occupied | 4 (5.2%) | $0 |
| Average | 77 (100.0%) | $0 |
Occupancy by Householder Income Bracket in Malta
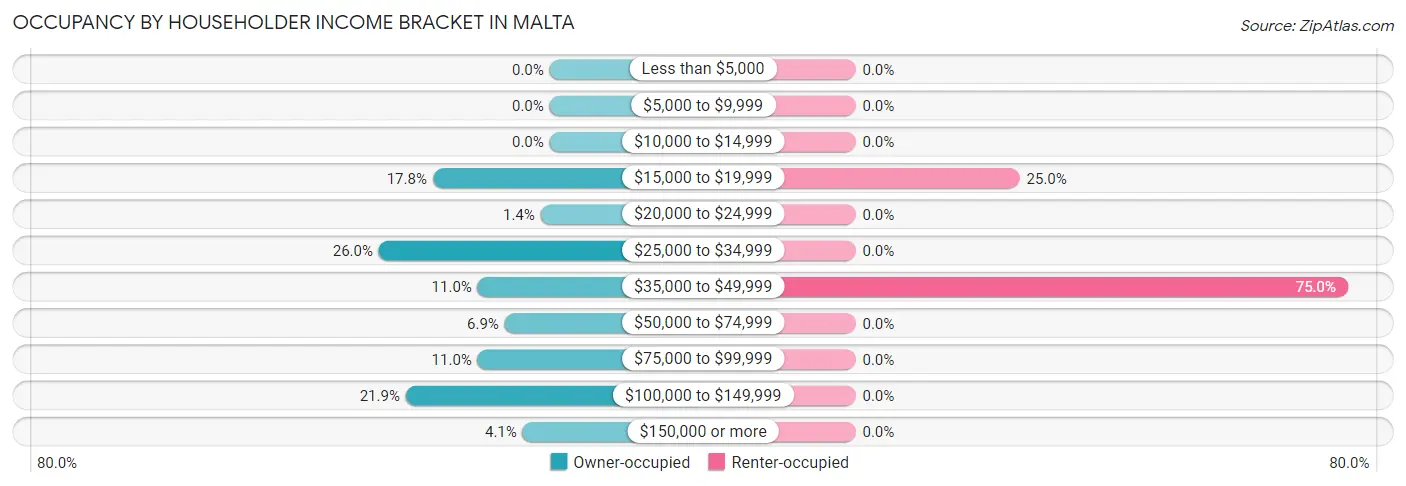
| Income Bracket | Owner-occupied | Renter-occupied |
| Less than $5,000 | 0 (0.0%) | 0 (0.0%) |
| $5,000 to $9,999 | 0 (0.0%) | 0 (0.0%) |
| $10,000 to $14,999 | 0 (0.0%) | 0 (0.0%) |
| $15,000 to $19,999 | 13 (17.8%) | 1 (25.0%) |
| $20,000 to $24,999 | 1 (1.4%) | 0 (0.0%) |
| $25,000 to $34,999 | 19 (26.0%) | 0 (0.0%) |
| $35,000 to $49,999 | 8 (11.0%) | 3 (75.0%) |
| $50,000 to $74,999 | 5 (6.9%) | 0 (0.0%) |
| $75,000 to $99,999 | 8 (11.0%) | 0 (0.0%) |
| $100,000 to $149,999 | 16 (21.9%) | 0 (0.0%) |
| $150,000 or more | 3 (4.1%) | 0 (0.0%) |
| Total | 73 (100.0%) | 4 (100.0%) |
Monthly Housing Cost Tiers in Malta
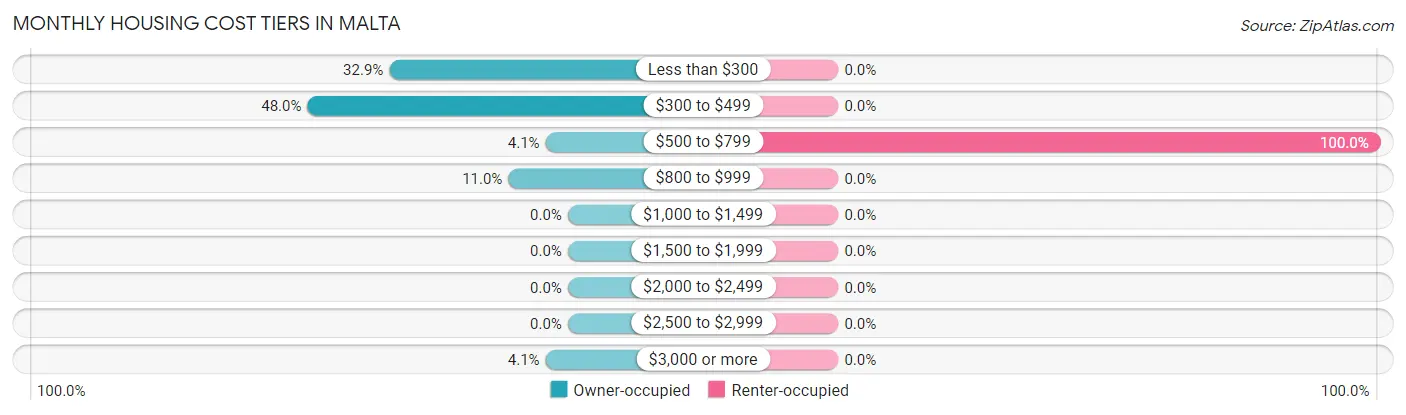
| Monthly Cost | Owner-occupied | Renter-occupied |
| Less than $300 | 24 (32.9%) | 0 (0.0%) |
| $300 to $499 | 35 (47.9%) | 0 (0.0%) |
| $500 to $799 | 3 (4.1%) | 4 (100.0%) |
| $800 to $999 | 8 (11.0%) | 0 (0.0%) |
| $1,000 to $1,499 | 0 (0.0%) | 0 (0.0%) |
| $1,500 to $1,999 | 0 (0.0%) | 0 (0.0%) |
| $2,000 to $2,499 | 0 (0.0%) | 0 (0.0%) |
| $2,500 to $2,999 | 0 (0.0%) | 0 (0.0%) |
| $3,000 or more | 3 (4.1%) | 0 (0.0%) |
| Total | 73 (100.0%) | 4 (100.0%) |
Physical Housing Characteristics in Malta
Housing Structures in Malta
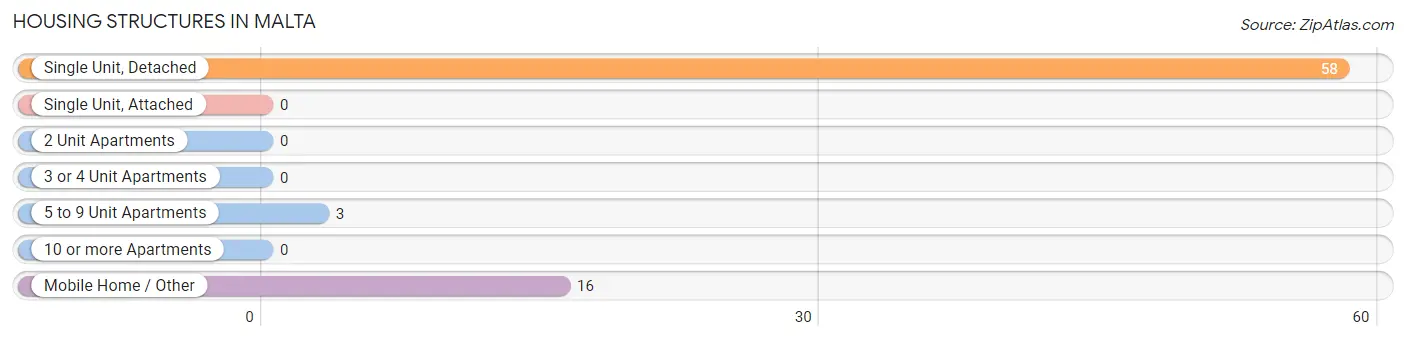
| Structure Type | # Housing Units | % Housing Units |
| Single Unit, Detached | 58 | 75.3% |
| Single Unit, Attached | 0 | 0.0% |
| 2 Unit Apartments | 0 | 0.0% |
| 3 or 4 Unit Apartments | 0 | 0.0% |
| 5 to 9 Unit Apartments | 3 | 3.9% |
| 10 or more Apartments | 0 | 0.0% |
| Mobile Home / Other | 16 | 20.8% |
| Total | 77 | 100.0% |
Housing Structures by Occupancy in Malta
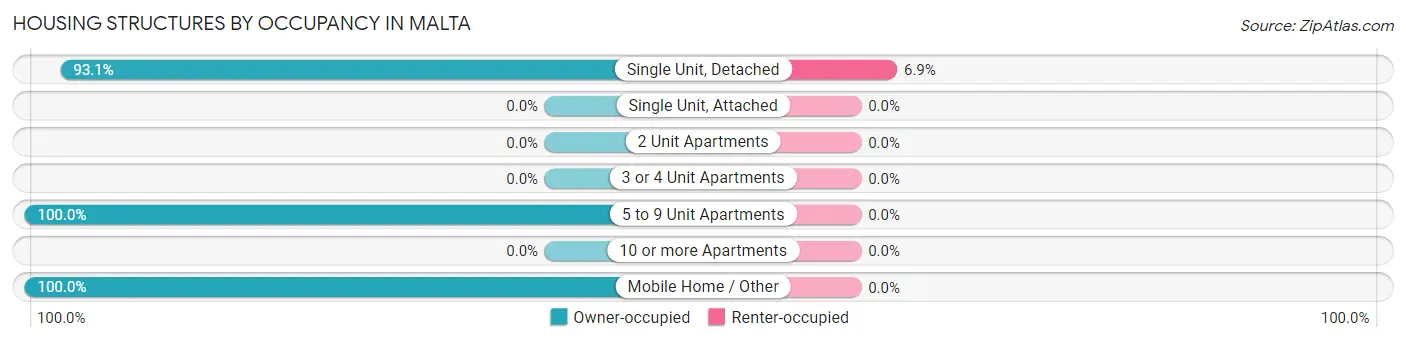
| Structure Type | Owner-occupied | Renter-occupied |
| Single Unit, Detached | 54 (93.1%) | 4 (6.9%) |
| Single Unit, Attached | 0 (0.0%) | 0 (0.0%) |
| 2 Unit Apartments | 0 (0.0%) | 0 (0.0%) |
| 3 or 4 Unit Apartments | 0 (0.0%) | 0 (0.0%) |
| 5 to 9 Unit Apartments | 3 (100.0%) | 0 (0.0%) |
| 10 or more Apartments | 0 (0.0%) | 0 (0.0%) |
| Mobile Home / Other | 16 (100.0%) | 0 (0.0%) |
| Total | 73 (94.8%) | 4 (5.2%) |
Housing Structures by Number of Rooms in Malta
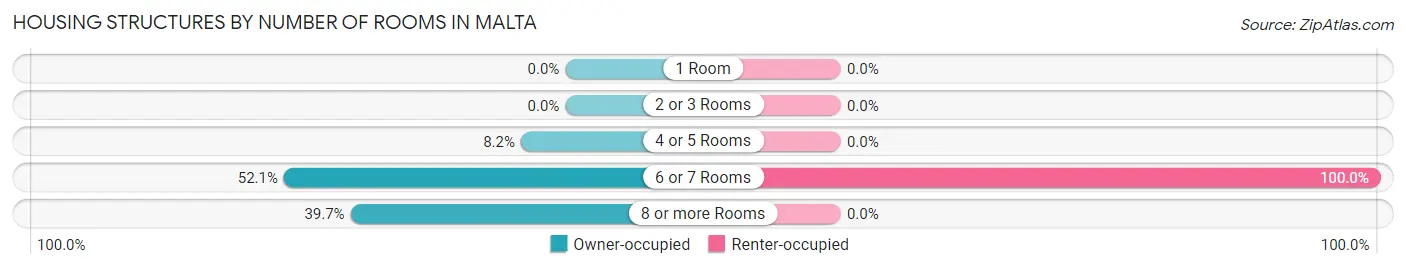
| Number of Rooms | Owner-occupied | Renter-occupied |
| 1 Room | 0 (0.0%) | 0 (0.0%) |
| 2 or 3 Rooms | 0 (0.0%) | 0 (0.0%) |
| 4 or 5 Rooms | 6 (8.2%) | 0 (0.0%) |
| 6 or 7 Rooms | 38 (52.0%) | 4 (100.0%) |
| 8 or more Rooms | 29 (39.7%) | 0 (0.0%) |
| Total | 73 (100.0%) | 4 (100.0%) |
Housing Structure by Heating Type in Malta
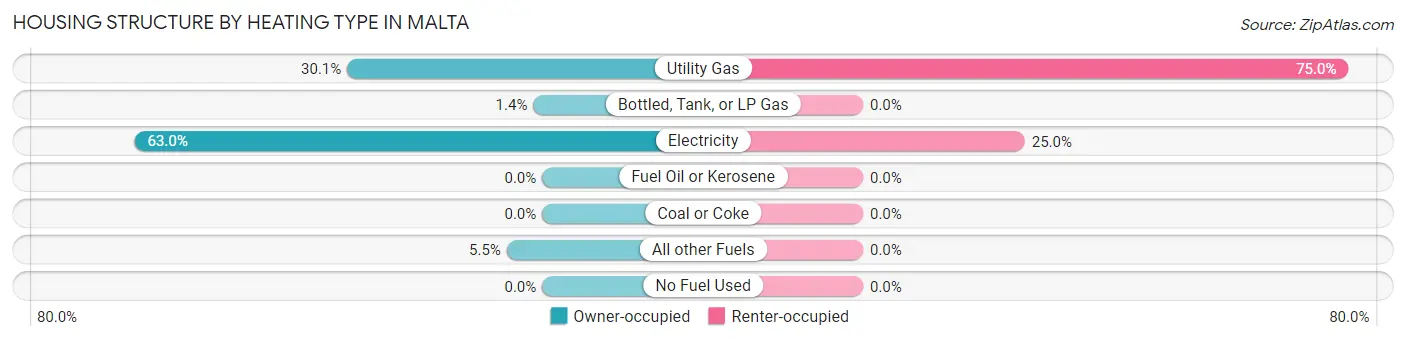
| Heating Type | Owner-occupied | Renter-occupied |
| Utility Gas | 22 (30.1%) | 3 (75.0%) |
| Bottled, Tank, or LP Gas | 1 (1.4%) | 0 (0.0%) |
| Electricity | 46 (63.0%) | 1 (25.0%) |
| Fuel Oil or Kerosene | 0 (0.0%) | 0 (0.0%) |
| Coal or Coke | 0 (0.0%) | 0 (0.0%) |
| All other Fuels | 4 (5.5%) | 0 (0.0%) |
| No Fuel Used | 0 (0.0%) | 0 (0.0%) |
| Total | 73 (100.0%) | 4 (100.0%) |
Household Vehicle Usage in Malta
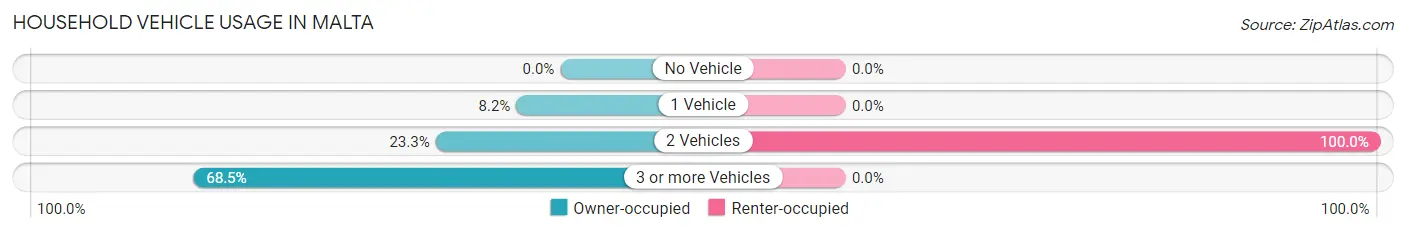
| Vehicles per Household | Owner-occupied | Renter-occupied |
| No Vehicle | 0 (0.0%) | 0 (0.0%) |
| 1 Vehicle | 6 (8.2%) | 0 (0.0%) |
| 2 Vehicles | 17 (23.3%) | 4 (100.0%) |
| 3 or more Vehicles | 50 (68.5%) | 0 (0.0%) |
| Total | 73 (100.0%) | 4 (100.0%) |
Real Estate & Mortgages in Malta
Real Estate and Mortgage Overview in Malta
| Characteristic | Without Mortgage | With Mortgage |
| Housing Units | 62 | 11 |
| Median Property Value | $132,900 | $0 |
| Median Household Income | - | - |
| Monthly Housing Costs | $377 | $3 |
| Real Estate Taxes | $1,103 | $0 |
Property Value by Mortgage Status in Malta
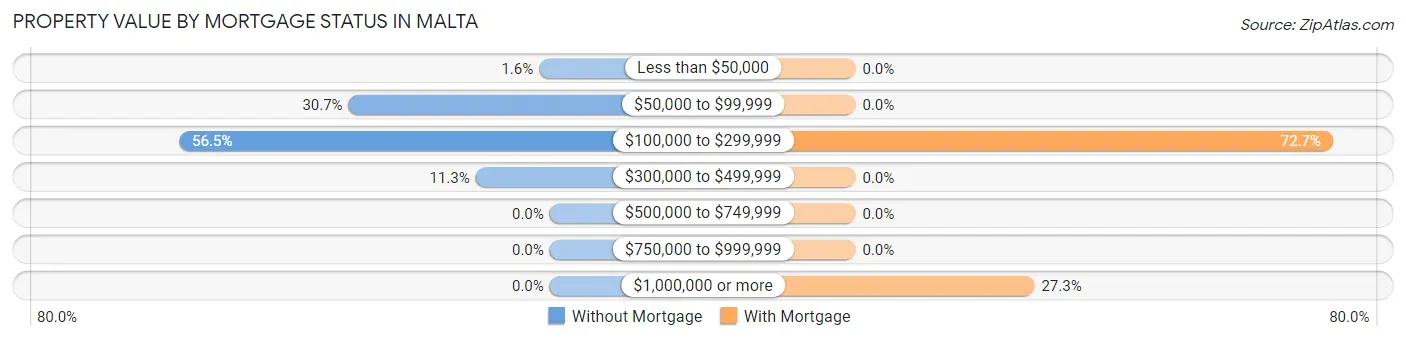
| Property Value | Without Mortgage | With Mortgage |
| Less than $50,000 | 1 (1.6%) | 0 (0.0%) |
| $50,000 to $99,999 | 19 (30.6%) | 0 (0.0%) |
| $100,000 to $299,999 | 35 (56.5%) | 8 (72.7%) |
| $300,000 to $499,999 | 7 (11.3%) | 0 (0.0%) |
| $500,000 to $749,999 | 0 (0.0%) | 0 (0.0%) |
| $750,000 to $999,999 | 0 (0.0%) | 0 (0.0%) |
| $1,000,000 or more | 0 (0.0%) | 3 (27.3%) |
| Total | 62 (100.0%) | 11 (100.0%) |
Household Income by Mortgage Status in Malta
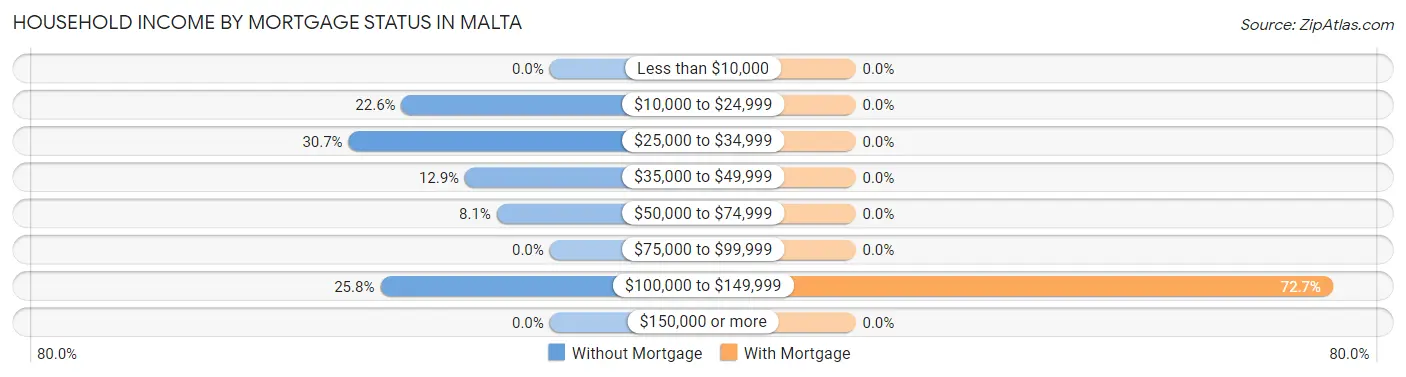
| Household Income | Without Mortgage | With Mortgage |
| Less than $10,000 | 0 (0.0%) | 0 (0.0%) |
| $10,000 to $24,999 | 14 (22.6%) | 0 (0.0%) |
| $25,000 to $34,999 | 19 (30.6%) | 0 (0.0%) |
| $35,000 to $49,999 | 8 (12.9%) | 0 (0.0%) |
| $50,000 to $74,999 | 5 (8.1%) | 0 (0.0%) |
| $75,000 to $99,999 | 0 (0.0%) | 0 (0.0%) |
| $100,000 to $149,999 | 16 (25.8%) | 8 (72.7%) |
| $150,000 or more | 0 (0.0%) | 0 (0.0%) |
| Total | 62 (100.0%) | 11 (100.0%) |
Property Value to Household Income Ratio in Malta
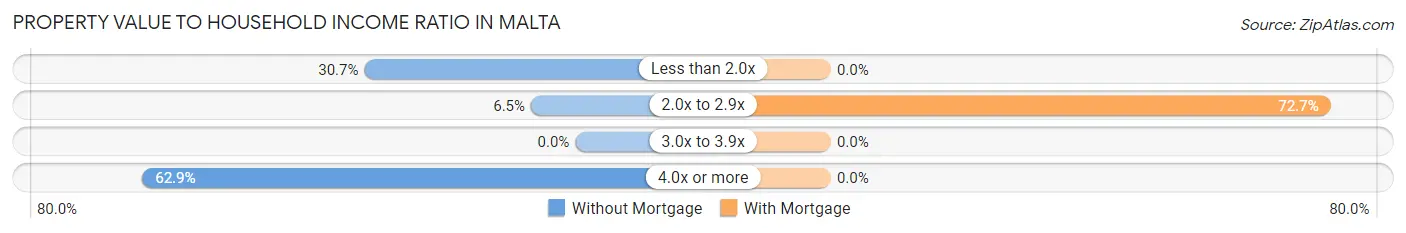
| Value-to-Income Ratio | Without Mortgage | With Mortgage |
| Less than 2.0x | 19 (30.6%) | 0 (0.0%) |
| 2.0x to 2.9x | 4 (6.5%) | 8 (72.7%) |
| 3.0x to 3.9x | 0 (0.0%) | 0 (0.0%) |
| 4.0x or more | 39 (62.9%) | 0 (0.0%) |
| Total | 62 (100.0%) | 11 (100.0%) |
Real Estate Taxes by Mortgage Status in Malta
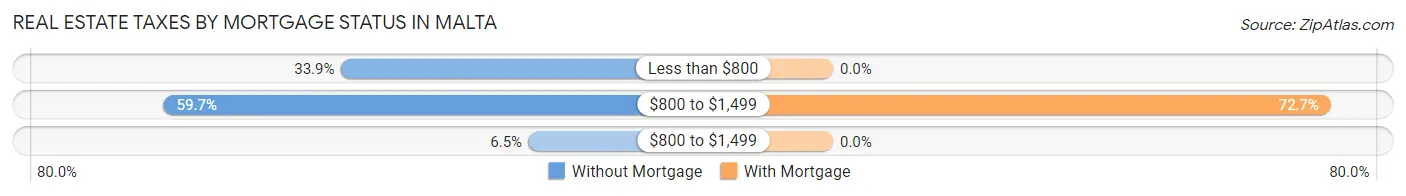
| Property Taxes | Without Mortgage | With Mortgage |
| Less than $800 | 21 (33.9%) | 0 (0.0%) |
| $800 to $1,499 | 37 (59.7%) | 8 (72.7%) |
| $800 to $1,499 | 4 (6.5%) | 0 (0.0%) |
| Total | 62 (100.0%) | 11 (100.0%) |
Health & Disability in Malta
Health Insurance Coverage by Age in Malta
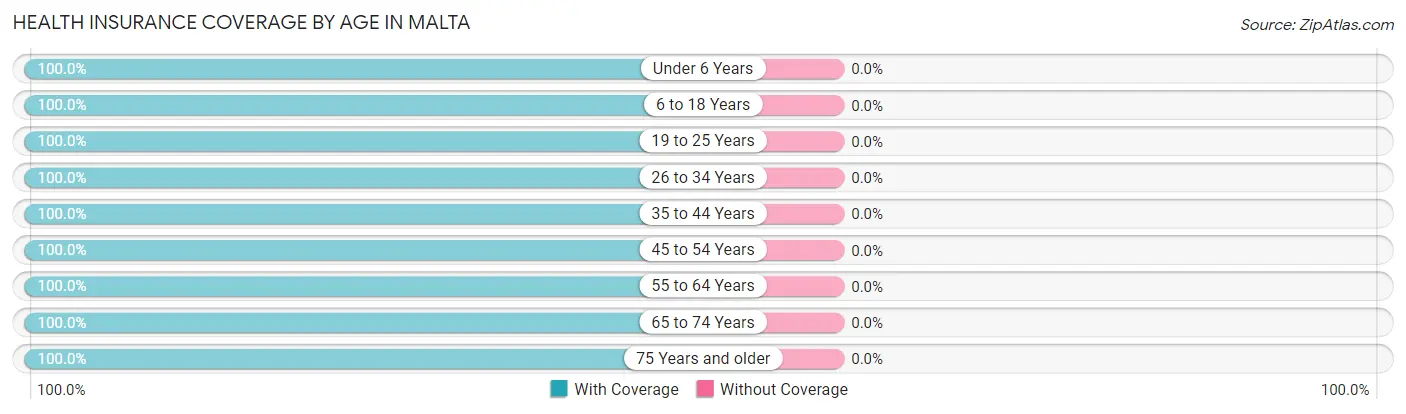
| Age Bracket | With Coverage | Without Coverage |
| Under 6 Years | 40 (100.0%) | 0 (0.0%) |
| 6 to 18 Years | 84 (100.0%) | 0 (0.0%) |
| 19 to 25 Years | 2 (100.0%) | 0 (0.0%) |
| 26 to 34 Years | 8 (100.0%) | 0 (0.0%) |
| 35 to 44 Years | 22 (100.0%) | 0 (0.0%) |
| 45 to 54 Years | 19 (100.0%) | 0 (0.0%) |
| 55 to 64 Years | 49 (100.0%) | 0 (0.0%) |
| 65 to 74 Years | 50 (100.0%) | 0 (0.0%) |
| 75 Years and older | 20 (100.0%) | 0 (0.0%) |
| Total | 294 (100.0%) | 0 (0.0%) |
Health Insurance Coverage by Citizenship Status in Malta
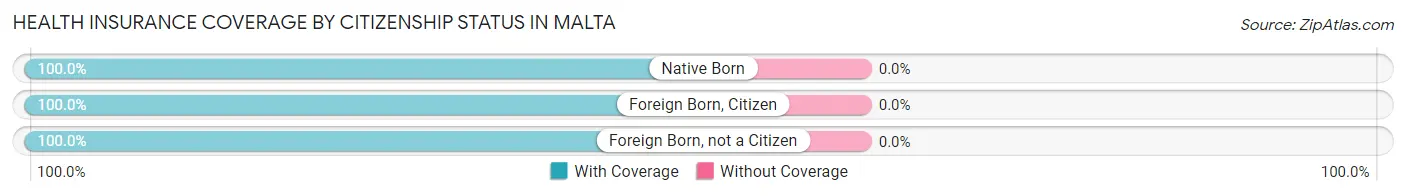
| Citizenship Status | With Coverage | Without Coverage |
| Native Born | 40 (100.0%) | 0 (0.0%) |
| Foreign Born, Citizen | 84 (100.0%) | 0 (0.0%) |
| Foreign Born, not a Citizen | 2 (100.0%) | 0 (0.0%) |
Health Insurance Coverage by Household Income in Malta
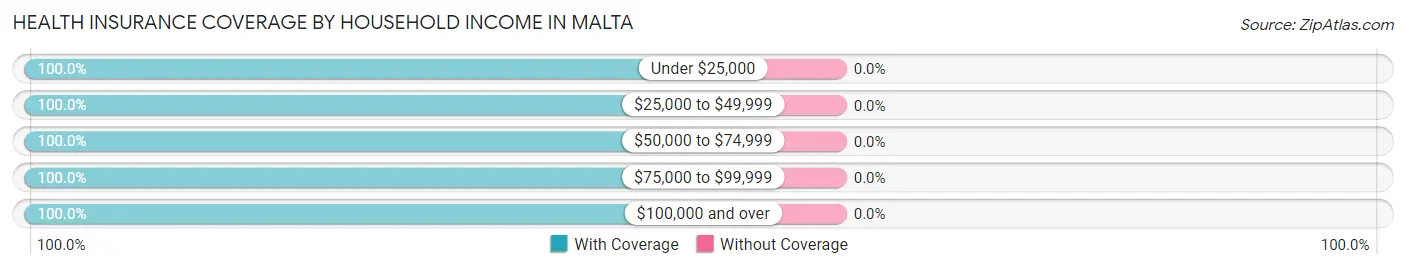
| Household Income | With Coverage | Without Coverage |
| Under $25,000 | 42 (100.0%) | 0 (0.0%) |
| $25,000 to $49,999 | 167 (100.0%) | 0 (0.0%) |
| $50,000 to $74,999 | 18 (100.0%) | 0 (0.0%) |
| $75,000 to $99,999 | 16 (100.0%) | 0 (0.0%) |
| $100,000 and over | 51 (100.0%) | 0 (0.0%) |
Public vs Private Health Insurance Coverage by Age in Malta
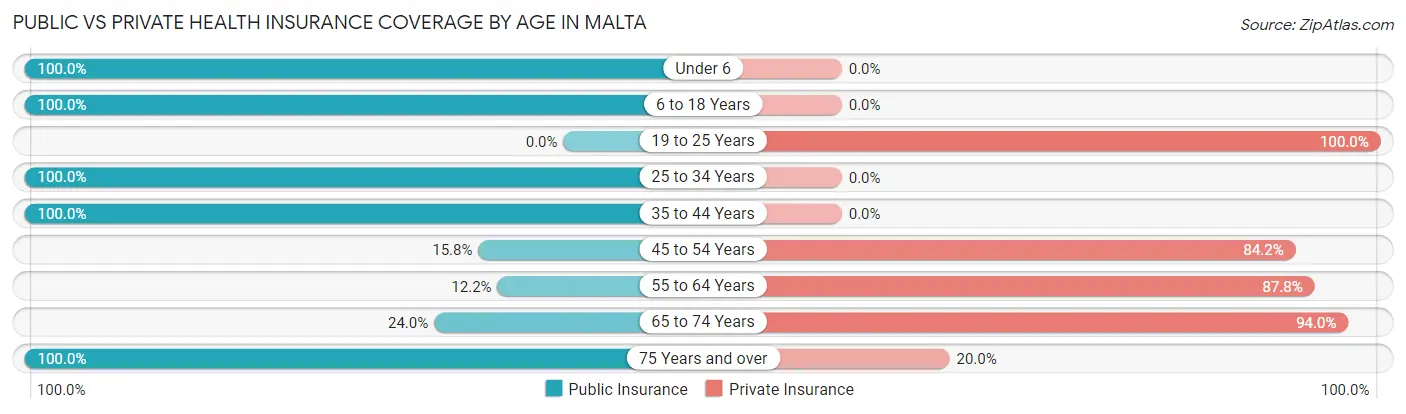
| Age Bracket | Public Insurance | Private Insurance |
| Under 6 | 40 (100.0%) | 0 (0.0%) |
| 6 to 18 Years | 84 (100.0%) | 0 (0.0%) |
| 19 to 25 Years | 0 (0.0%) | 2 (100.0%) |
| 25 to 34 Years | 8 (100.0%) | 0 (0.0%) |
| 35 to 44 Years | 22 (100.0%) | 0 (0.0%) |
| 45 to 54 Years | 3 (15.8%) | 16 (84.2%) |
| 55 to 64 Years | 6 (12.2%) | 43 (87.8%) |
| 65 to 74 Years | 12 (24.0%) | 47 (94.0%) |
| 75 Years and over | 20 (100.0%) | 4 (20.0%) |
| Total | 195 (66.3%) | 112 (38.1%) |
Disability Status by Sex by Age in Malta
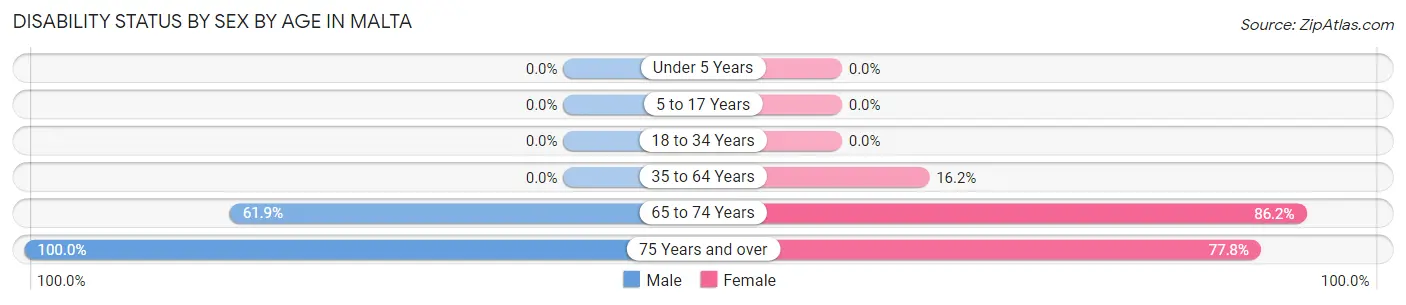
| Age Bracket | Male | Female |
| Under 5 Years | 0 (0.0%) | 0 (0.0%) |
| 5 to 17 Years | 0 (0.0%) | 0 (0.0%) |
| 18 to 34 Years | 0 (0.0%) | 0 (0.0%) |
| 35 to 64 Years | 0 (0.0%) | 6 (16.2%) |
| 65 to 74 Years | 13 (61.9%) | 25 (86.2%) |
| 75 Years and over | 11 (100.0%) | 7 (77.8%) |
Disability Class by Sex by Age in Malta
Disability Class: Hearing Difficulty
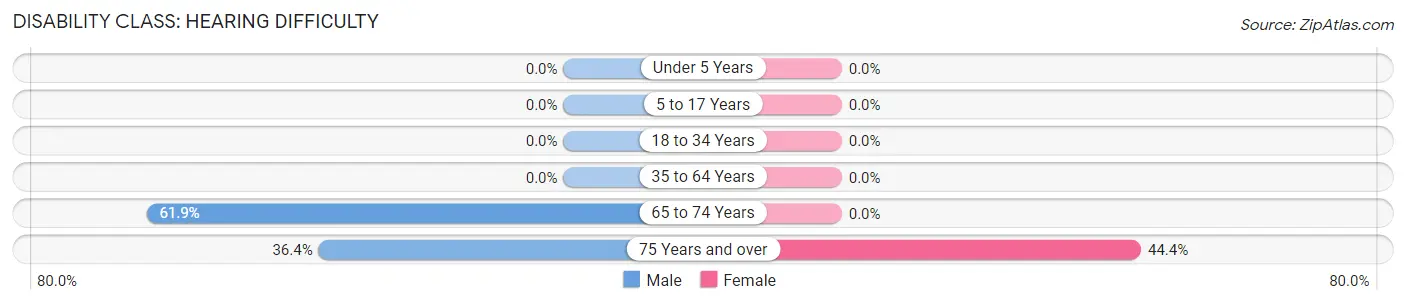
| Age Bracket | Male | Female |
| Under 5 Years | 0 (0.0%) | 0 (0.0%) |
| 5 to 17 Years | 0 (0.0%) | 0 (0.0%) |
| 18 to 34 Years | 0 (0.0%) | 0 (0.0%) |
| 35 to 64 Years | 0 (0.0%) | 0 (0.0%) |
| 65 to 74 Years | 13 (61.9%) | 0 (0.0%) |
| 75 Years and over | 4 (36.4%) | 4 (44.4%) |
Disability Class: Vision Difficulty
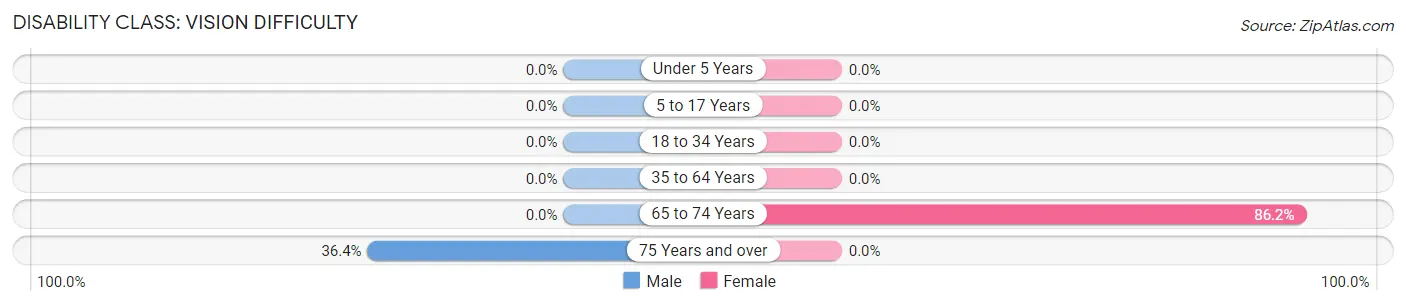
| Age Bracket | Male | Female |
| Under 5 Years | 0 (0.0%) | 0 (0.0%) |
| 5 to 17 Years | 0 (0.0%) | 0 (0.0%) |
| 18 to 34 Years | 0 (0.0%) | 0 (0.0%) |
| 35 to 64 Years | 0 (0.0%) | 0 (0.0%) |
| 65 to 74 Years | 0 (0.0%) | 25 (86.2%) |
| 75 Years and over | 4 (36.4%) | 0 (0.0%) |
Disability Class: Cognitive Difficulty
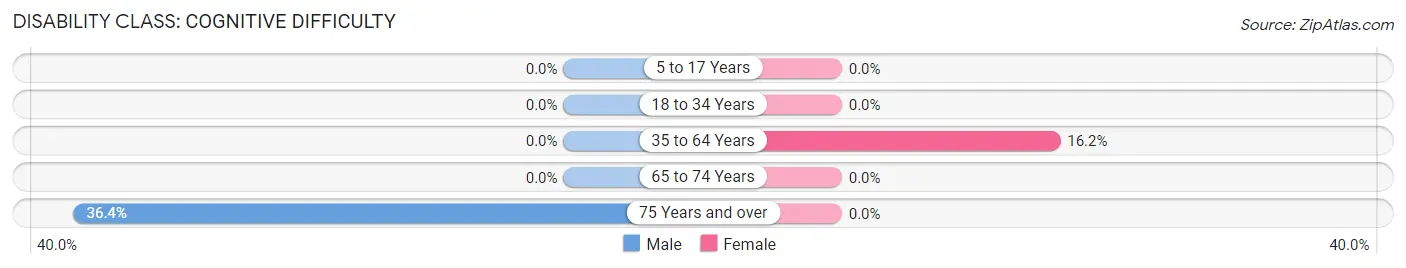
| Age Bracket | Male | Female |
| 5 to 17 Years | 0 (0.0%) | 0 (0.0%) |
| 18 to 34 Years | 0 (0.0%) | 0 (0.0%) |
| 35 to 64 Years | 0 (0.0%) | 6 (16.2%) |
| 65 to 74 Years | 0 (0.0%) | 0 (0.0%) |
| 75 Years and over | 4 (36.4%) | 0 (0.0%) |
Disability Class: Ambulatory Difficulty
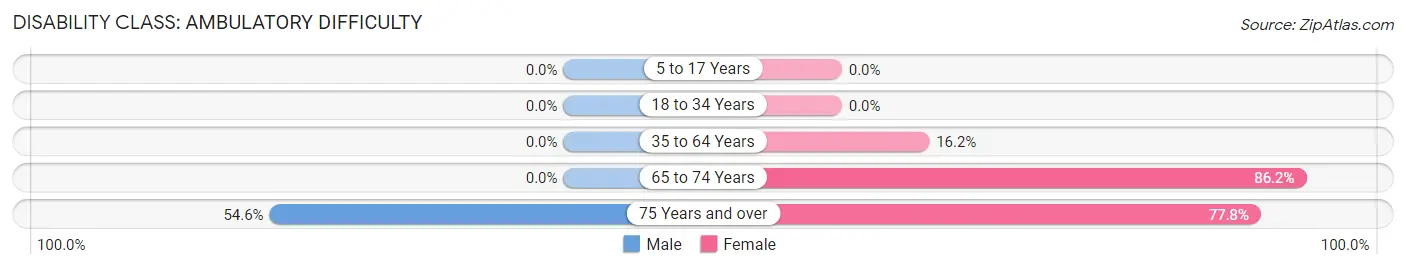
| Age Bracket | Male | Female |
| 5 to 17 Years | 0 (0.0%) | 0 (0.0%) |
| 18 to 34 Years | 0 (0.0%) | 0 (0.0%) |
| 35 to 64 Years | 0 (0.0%) | 6 (16.2%) |
| 65 to 74 Years | 0 (0.0%) | 25 (86.2%) |
| 75 Years and over | 6 (54.5%) | 7 (77.8%) |
Disability Class: Self-Care Difficulty
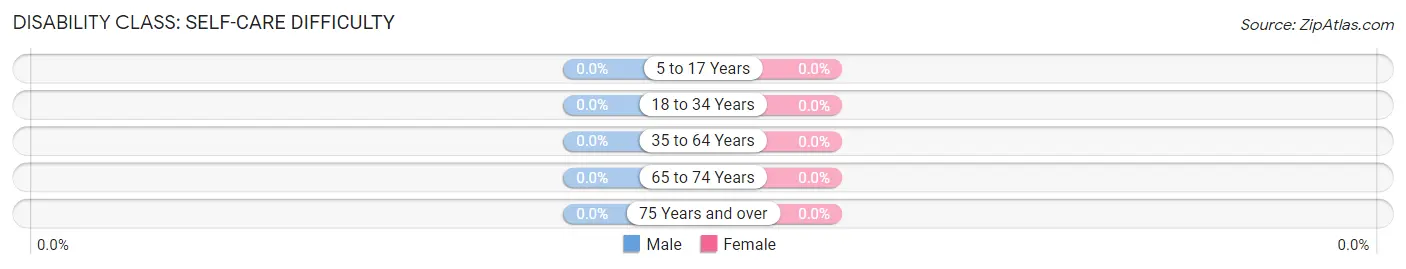
| Age Bracket | Male | Female |
| 5 to 17 Years | 0 (0.0%) | 0 (0.0%) |
| 18 to 34 Years | 0 (0.0%) | 0 (0.0%) |
| 35 to 64 Years | 0 (0.0%) | 0 (0.0%) |
| 65 to 74 Years | 0 (0.0%) | 0 (0.0%) |
| 75 Years and over | 0 (0.0%) | 0 (0.0%) |
Technology Access in Malta
Computing Device Access in Malta
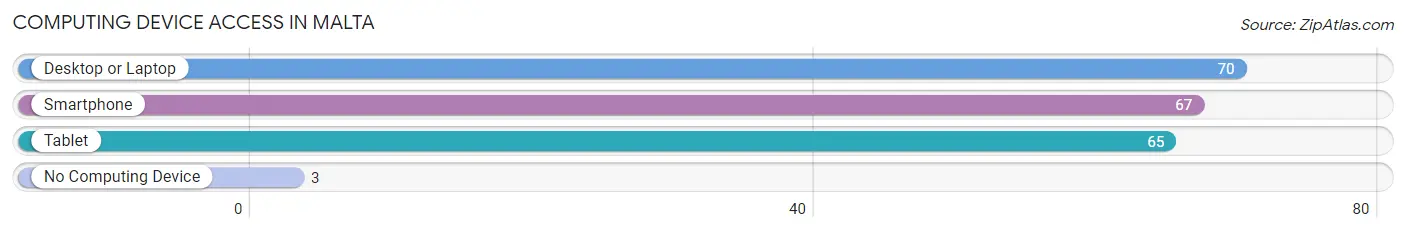
| Device Type | # Households | % Households |
| Desktop or Laptop | 70 | 90.9% |
| Smartphone | 67 | 87.0% |
| Tablet | 65 | 84.4% |
| No Computing Device | 3 | 3.9% |
| Total | 77 | 100.0% |
Internet Access in Malta
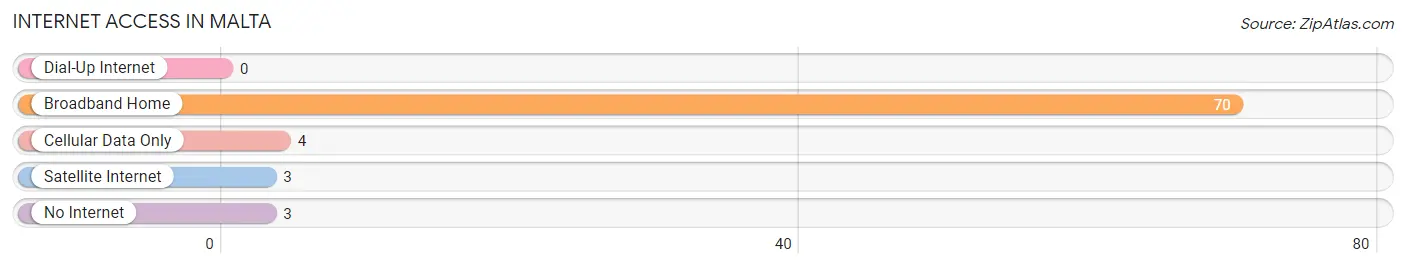
| Internet Type | # Households | % Households |
| Dial-Up Internet | 0 | 0.0% |
| Broadband Home | 70 | 90.9% |
| Cellular Data Only | 4 | 5.2% |
| Satellite Internet | 3 | 3.9% |
| No Internet | 3 | 3.9% |
| Total | 77 | 100.0% |
Malta Summary
Malta is an archipelago located in the Mediterranean Sea, south of Sicily and east of Tunisia. It is the smallest country in the European Union, with a total area of just over 316 square kilometers. The country is composed of three main islands: Malta, Gozo, and Comino. The capital city is Valletta, located on the main island of Malta.
History
Malta has a long and rich history, dating back to the Neolithic period. The islands were first settled by the Phoenicians in the 8th century BC, and later by the Greeks and Romans. The islands were ruled by the Arabs from 870 to 1090, and then by the Normans from 1090 to 1530. In 1530, the islands were given to the Knights of St. John, who ruled until 1798. During this period, the islands were fortified and developed, and the capital city of Valletta was built.
In 1798, the islands were occupied by the French, and then by the British in 1800. The British ruled Malta until 1964, when the country gained independence. Since then, Malta has been a republic, and a member of the European Union since 2004.
Geography
Malta is an archipelago located in the Mediterranean Sea, south of Sicily and east of Tunisia. It is the smallest country in the European Union, with a total area of just over 316 square kilometers. The country is composed of three main islands: Malta, Gozo, and Comino. The main island of Malta is the largest, with an area of 246 square kilometers. The other two islands are much smaller, with Gozo having an area of 67 square kilometers and Comino having an area of 3.5 square kilometers.
The terrain of Malta is mostly low-lying, with the highest point being Ta' Dmejrek, at 253 meters. The climate is Mediterranean, with hot, dry summers and mild, wet winters.
Economy
Malta has a small, open economy that is heavily reliant on foreign trade and tourism. The country's main exports are machinery and transport equipment, manufactured goods, and food and beverages. Its main trading partners are the United Kingdom, Italy, Germany, and France.
The country's main industries are tourism, electronics, shipbuilding, and pharmaceuticals. Tourism is the largest industry, accounting for around 25% of GDP. The country is also a major financial center, with a number of international banks and financial services companies based in Valletta.
Demographics
Malta has a population of just over 450,000 people, with the majority living on the main island of Malta. The population is predominantly Roman Catholic, with around 98% of the population identifying as such. The official language is Maltese, although English is also widely spoken.
The median age of the population is 40.5 years, with a life expectancy of 81.2 years. The population is growing at a rate of 0.3% per year. The unemployment rate is around 5.2%.
Common Questions
What is Per Capita Income in Malta?
Per Capita income in Malta is $21,327.
What is Family Income Deficit in Malta?
Family Income Deficit in Malta is $17,803.
Families that are below poverty line in Malta earn $17,803 less on average than the poverty threshold level.
What is Inequality or Gini Index in Malta?
Inequality or Gini Index in Malta is 0.52.
What is the Total Population of Malta?
Total Population of Malta is 294.
What is the Total Male Population of Malta?
Total Male Population of Malta is 125.
What is the Total Female Population of Malta?
Total Female Population of Malta is 169.
What is the Ratio of Males per 100 Females in Malta?
There are 73.96 Males per 100 Females in Malta.
What is the Ratio of Females per 100 Males in Malta?
There are 135.20 Females per 100 Males in Malta.
What is the Median Population Age in Malta?
Median Population Age in Malta is 41.5 Years.
What is the Average Family Size in Malta
Average Family Size in Malta is 3.9 People.
What is the Average Household Size in Malta
Average Household Size in Malta is 3.8 People.
How Large is the Labor Force in Malta?
There are 88 People in the Labor Forcein in Malta.
What is the Percentage of People in the Labor Force in Malta?
51.8% of People are in the Labor Force in Malta.