Zip Codes with the Highest Percentage of Self-Employed / Not Incorporated in Delaware

RELATED REPORTS & OPTIONS

Self-Employed / Not Incorporated
Population
Families and Households
Female Fertility
Female Fertility (Unmarried)
Race (Community Size)
Race (Percentage)
Ancestry (Community Size)
AfghanAfricanAlaska NativeAlaskan AthabascanAlbanianAleutAlsatianAmericanApacheArabArapahoArgentineanArmenianAssyrian / Chaldean / SyriacAustralianAustrianBahamianBangladeshiBarbadianBasqueBelgianBelizeanBermudanBhutaneseBlackfeetBolivianBrazilianBritishBritish West IndianBulgarianBurmeseCajunCambodianCanadianCape VerdeanCarpatho RusynCelticCentral AmericanCentral American IndianCherokeeCheyenneChickasawChileanChineseChippewaChoctawColombianColvilleComancheCosta RicanCreeCreekCroatianCrowCubanCypriotCzechCzechoslovakianDanishDelawareDominicanDutchDutch West IndianEastern EuropeanEcuadorianEgyptianEnglishEstonianEthiopianEuropeanFijianFilipinoFinnishFrenchFrench American IndianFrench CanadianGermanGerman RussianGhanaianGreekGuamanian / ChamorroGuatemalanGuyaneseHaitianHmongHonduranHopiHoumaHungarianIcelanderIndian (Asian)IndonesianInupiatIranianIraqiIrishIroquoisIsraeliItalianJamaicanJapaneseJordanianKenyanKiowaKoreanLaotianLatvianLebaneseLiberianLithuanianLumbeeLuxembourgerMacedonianMalaysianMalteseMarshalleseMenomineeMexicanMexican American IndianMongolianMoroccanNative HawaiianNavajoNepaleseNew ZealanderNicaraguanNigerianNorthern EuropeanNorwegianOkinawanOsageOttawaPaiutePakistaniPalestinianPanamanianParaguayanPennsylvania GermanPeruvianPimaPolishPortuguesePotawatomiPuebloPuerto RicanPuget Sound SalishRomanianRussianSalvadoranSamoanScandinavianScotch-IrishScottishSeminoleSenegaleseSerbianShoshoneSierra LeoneanSiouxSlavicSlovakSloveneSomaliSouth AfricanSouth AmericanSouth American IndianSoviet UnionSpaniardSpanishSpanish AmericanSpanish American IndianSri LankanSubsaharan AfricanSudaneseSwedishSwissSyrianTaiwaneseThaiTlingit-HaidaTohono O'OdhamTonganTrinidadian and TobagonianTsimshianTurkishU.S. Virgin IslanderUgandanUkrainianUruguayanUteVenezuelanVietnameseWelshWest IndianYakamaYaquiYugoslavianYumanYup'ikZimbabwean
Ancestry (Percentage)
AfghanAfricanAlaska NativeAlaskan AthabascanAlbanianAleutAlsatianAmericanApacheArabArapahoArgentineanArmenianAssyrian / Chaldean / SyriacAustralianAustrianBahamianBangladeshiBarbadianBasqueBelgianBelizeanBermudanBhutaneseBlackfeetBolivianBrazilianBritishBritish West IndianBulgarianBurmeseCajunCambodianCanadianCape VerdeanCarpatho RusynCelticCentral AmericanCentral American IndianCherokeeCheyenneChickasawChileanChineseChippewaChoctawColombianColvilleComancheCosta RicanCreeCreekCroatianCrowCubanCypriotCzechCzechoslovakianDanishDelawareDominicanDutchDutch West IndianEastern EuropeanEcuadorianEgyptianEnglishEstonianEthiopianEuropeanFijianFilipinoFinnishFrenchFrench American IndianFrench CanadianGermanGerman RussianGhanaianGreekGuamanian / ChamorroGuatemalanGuyaneseHaitianHmongHonduranHopiHoumaHungarianIcelanderIndian (Asian)IndonesianInupiatIranianIraqiIrishIroquoisIsraeliItalianJamaicanJapaneseJordanianKenyanKiowaKoreanLaotianLatvianLebaneseLiberianLithuanianLumbeeLuxembourgerMacedonianMalaysianMalteseMarshalleseMenomineeMexicanMexican American IndianMongolianMoroccanNative HawaiianNavajoNepaleseNew ZealanderNicaraguanNigerianNorthern EuropeanNorwegianOkinawanOsageOttawaPaiutePakistaniPalestinianPanamanianParaguayanPennsylvania GermanPeruvianPimaPolishPortuguesePotawatomiPuebloPuerto RicanPuget Sound SalishRomanianRussianSalvadoranSamoanScandinavianScotch-IrishScottishSeminoleSenegaleseSerbianShoshoneSierra LeoneanSiouxSlavicSlovakSloveneSomaliSouth AfricanSouth AmericanSouth American IndianSoviet UnionSpaniardSpanishSpanish AmericanSpanish American IndianSri LankanSubsaharan AfricanSudaneseSwedishSwissSyrianTaiwaneseThaiTlingit-HaidaTohono O'OdhamTonganTrinidadian and TobagonianTsimshianTurkishU.S. Virgin IslanderUgandanUkrainianUruguayanUteVenezuelanVietnameseWelshWest IndianYakamaYaquiYugoslavianYumanYup'ikZimbabwean
Immigrant Origin (Total)
AfghanistanAfricaAlbaniaArgentinaArmeniaAsiaAustraliaAustriaAzoresBahamasBangladeshBarbadosBelarusBelgiumBelizeBoliviaBosnia and HerzegovinaBrazilBulgariaBurma / MyanmarCabo VerdeCambodiaCameroonCanadaCaribbeanCentral AmericaChileChinaColombiaCongoCosta RicaCroatiaCubaCzechoslovakiaDenmarkDominicaDominican RepublicEastern AfricaEastern AsiaEastern EuropeEcuadorEgyptEl SalvadorEnglandEritreaEthiopiaEuropeFijiFranceGermanyGhanaGreeceGrenadaGuatemalaGuyanaHaitiHondurasHong KongHungaryIndiaIndonesiaIranIraqIrelandIsraelItalyJamaicaJapanJordanKazakhstanKenyaKoreaKuwaitLaosLatin AmericaLatviaLebanonLiberiaLithuaniaMalaysiaMexicoMicronesiaMiddle AfricaMoldovaMoroccoNepalNetherlandsNicaraguaNigeriaNorth MacedoniaNorthern AfricaNorthern EuropeNorwayOceaniaPakistanPanamaPeruPhilippinesPolandPortugalRomaniaRussiaSaudi ArabiaScotlandSenegalSerbiaSierra LeoneSingaporeSomaliaSouth AfricaSouth AmericaSouth Central AsiaSouth Eastern AsiaSouthern EuropeSpainSri LankaSt. Vincent and the GrenadinesSudanSwedenSwitzerlandSyriaTaiwanThailandTrinidad and TobagoTurkeyUgandaUkraineUruguayUzbekistanVenezuelaVietnamWest IndiesWestern AfricaWestern AsiaWestern EuropeYemenZaireZimbabwe
Immigrant Origin (Percentage)
AfghanistanAfricaAlbaniaArgentinaArmeniaAsiaAustraliaAustriaAzoresBahamasBangladeshBarbadosBelarusBelgiumBelizeBoliviaBosnia and HerzegovinaBrazilBulgariaBurma / MyanmarCabo VerdeCambodiaCameroonCanadaCaribbeanCentral AmericaChileChinaColombiaCongoCosta RicaCroatiaCubaCzechoslovakiaDenmarkDominicaDominican RepublicEastern AfricaEastern AsiaEastern EuropeEcuadorEgyptEl SalvadorEnglandEritreaEthiopiaEuropeFijiFranceGermanyGhanaGreeceGrenadaGuatemalaGuyanaHaitiHondurasHong KongHungaryIndiaIndonesiaIranIraqIrelandIsraelItalyJamaicaJapanJordanKazakhstanKenyaKoreaKuwaitLaosLatin AmericaLatviaLebanonLiberiaLithuaniaMalaysiaMexicoMicronesiaMiddle AfricaMoldovaMoroccoNepalNetherlandsNicaraguaNigeriaNorth MacedoniaNorthern AfricaNorthern EuropeNorwayOceaniaPakistanPanamaPeruPhilippinesPolandPortugalRomaniaRussiaSaudi ArabiaScotlandSenegalSerbiaSierra LeoneSingaporeSomaliaSouth AfricaSouth AmericaSouth Central AsiaSouth Eastern AsiaSouthern EuropeSpainSri LankaSt. Vincent and the GrenadinesSudanSwedenSwitzerlandSyriaTaiwanThailandTrinidad and TobagoTurkeyUgandaUkraineUruguayUzbekistanVenezuelaVietnamWest IndiesWestern AfricaWestern AsiaWestern EuropeYemenZaireZimbabwe
Income
Income (Families)
Income (Households)
Poverty
Poverty (Families)
Unemployment
Employment Occupations
Employment Industries
Employer Class
Commute Time
Commute Means
School Enrollment
Education by Degree Field
Occupancy
Finances
Physical Characteristics
Delaware
Compare Zip Codes
Comparison Subject

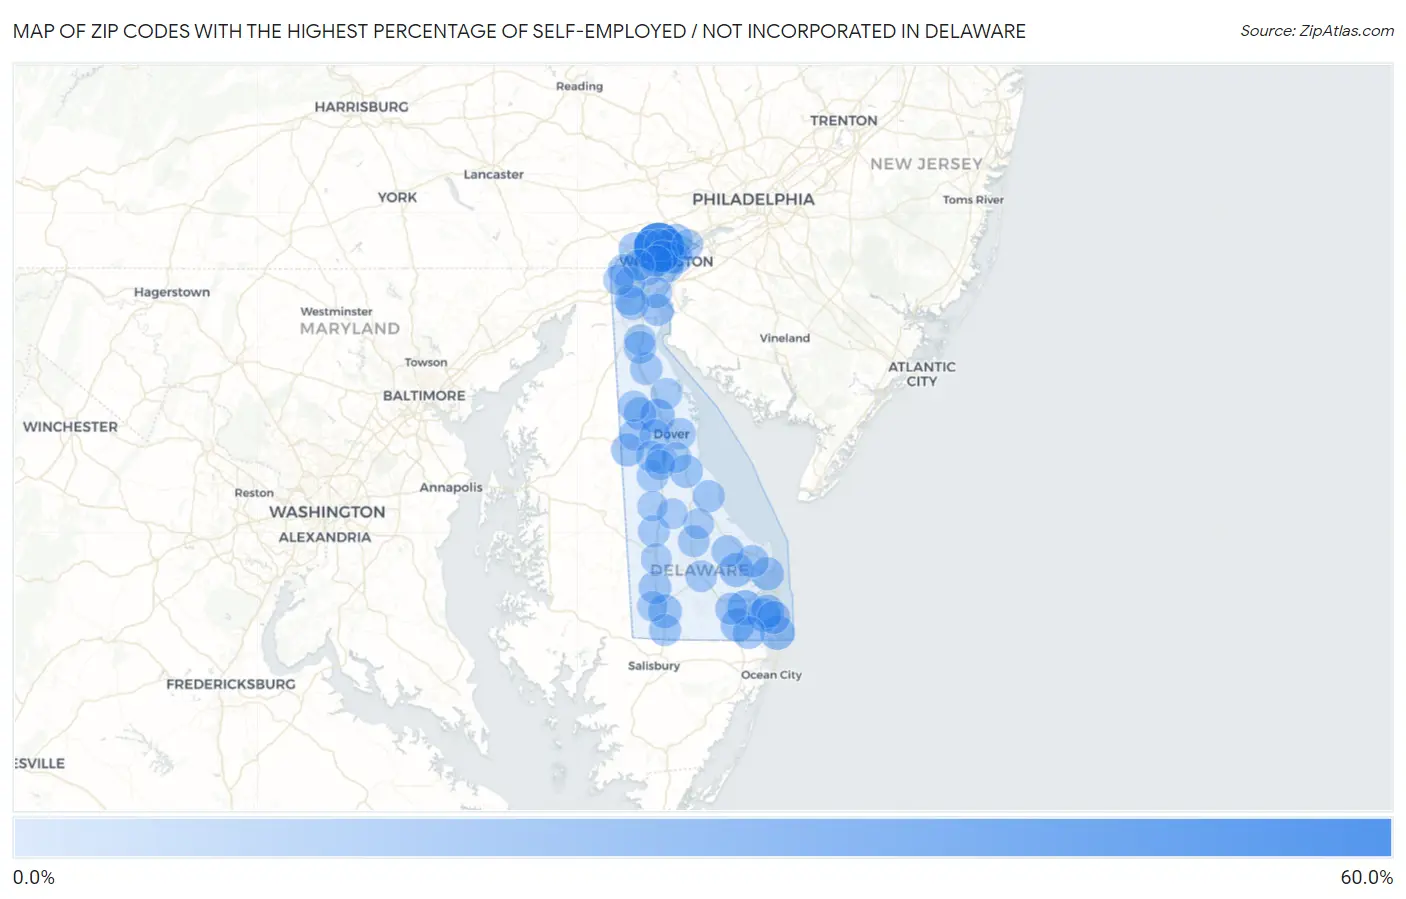
Map of Zip Codes with the Highest Percentage of Self-Employed / Not Incorporated in Delaware

0.0%
60.0%
Zip Codes with the Highest Percentage of Self-Employed / Not Incorporated in Delaware Map

Zip Codes with the Highest Percentage of Self-Employed / Not Incorporated in Delaware

Zip Code % Self-Employed / Not Incorporated vs State vs National
1.1971052.9%4.4%(+48.5)#15.8%(+47.1)#187
2.1993911.9%4.4%(+7.43)#25.8%(+6.06)#5,381
3.1993611.8%4.4%(+7.38)#35.8%(+6.00)#5,433
4.1994411.7%4.4%(+7.29)#45.8%(+5.91)#5,512
5.1995110.1%4.4%(+5.62)#55.8%(+4.24)#7,290
6.199569.1%4.4%(+4.71)#65.8%(+3.33)#8,546
7.199458.8%4.4%(+4.32)#75.8%(+2.94)#9,219
8.199678.5%4.4%(+4.10)#85.8%(+2.72)#9,586
9.199708.0%4.4%(+3.54)#95.8%(+2.16)#10,686
10.199467.8%4.4%(+3.38)#105.8%(+2.00)#11,040
11.199307.7%4.4%(+3.30)#115.8%(+1.93)#11,198
12.199717.7%4.4%(+3.22)#125.8%(+1.84)#11,405
13.199557.1%4.4%(+2.70)#135.8%(+1.33)#12,653
14.199647.1%4.4%(+2.68)#145.8%(+1.31)#12,707
15.199757.0%4.4%(+2.61)#155.8%(+1.23)#12,913
16.198096.9%4.4%(+2.50)#165.8%(+1.13)#13,201
17.199736.8%4.4%(+2.34)#175.8%(+0.967)#13,632
18.197076.6%4.4%(+2.17)#185.8%(+0.795)#14,101
19.199586.4%4.4%(+1.91)#195.8%(+0.536)#14,915
20.198046.3%4.4%(+1.90)#205.8%(+0.520)#14,968
21.197016.0%4.4%(+1.58)#215.8%(+0.203)#16,011
22.197345.9%4.4%(+1.42)#225.8%(+0.039)#16,528
23.197305.8%4.4%(+1.33)#235.8%(-0.046)#16,807
24.198075.8%4.4%(+1.31)#245.8%(-0.062)#16,852
25.199665.5%4.4%(+1.02)#255.8%(-0.354)#17,904
26.198105.4%4.4%(+0.958)#265.8%(-0.419)#18,137
27.198035.3%4.4%(+0.847)#275.8%(-0.529)#18,575
28.198025.3%4.4%(+0.840)#285.8%(-0.537)#18,601
29.199635.2%4.4%(+0.754)#295.8%(-0.623)#18,946
30.199404.9%4.4%(+0.503)#305.8%(-0.874)#19,884
31.198014.9%4.4%(+0.472)#315.8%(-0.905)#20,013
32.199684.8%4.4%(+0.344)#325.8%(-1.03)#20,485
33.197324.7%4.4%(+0.259)#335.8%(-1.12)#20,808
34.199534.7%4.4%(+0.243)#345.8%(-1.13)#20,864
35.197064.7%4.4%(+0.226)#355.8%(-1.15)#20,931
36.198064.4%4.4%(-0.055)#365.8%(-1.43)#22,018
37.199504.2%4.4%(-0.277)#375.8%(-1.65)#22,839
38.199414.0%4.4%(-0.390)#385.8%(-1.77)#23,221
39.197203.9%4.4%(-0.519)#395.8%(-1.90)#23,674
40.198053.8%4.4%(-0.663)#405.8%(-2.04)#24,142
41.199473.8%4.4%(-0.673)#415.8%(-2.05)#24,177
42.197113.7%4.4%(-0.765)#425.8%(-2.14)#24,490
43.199013.6%4.4%(-0.799)#435.8%(-2.18)#24,581
44.197093.3%4.4%(-1.16)#445.8%(-2.54)#25,665
45.199433.3%4.4%(-1.17)#455.8%(-2.54)#25,672
46.199773.2%4.4%(-1.19)#465.8%(-2.57)#25,734
47.199043.2%4.4%(-1.24)#475.8%(-2.62)#25,868
48.197032.9%4.4%(-1.56)#485.8%(-2.93)#26,644
49.199382.8%4.4%(-1.59)#495.8%(-2.97)#26,729
50.197132.8%4.4%(-1.61)#505.8%(-2.98)#26,757
51.199342.7%4.4%(-1.75)#515.8%(-3.13)#27,055
52.198082.6%4.4%(-1.82)#525.8%(-3.20)#27,209
53.197022.5%4.4%(-1.89)#535.8%(-3.27)#27,337
54.197171.9%4.4%(-2.51)#545.8%(-3.88)#28,325
55.199331.9%4.4%(-2.53)#555.8%(-3.91)#28,356
56.199601.5%4.4%(-2.90)#565.8%(-4.27)#28,702
57.199541.3%4.4%(-3.18)#575.8%(-4.56)#28,948
58.199801.1%4.4%(-3.33)#585.8%(-4.70)#29,051
59.199310.83%4.4%(-3.61)#595.8%(-4.99)#29,229
60.199520.76%4.4%(-3.67)#605.8%(-5.05)#29,270
61.199620.76%4.4%(-3.68)#615.8%(-5.06)#29,277
62.199790.70%4.4%(-3.74)#625.8%(-5.12)#29,305

Common Questions

What are the Top 10 Zip Codes with the Highest Percentage of Self-Employed / Not Incorporated in Delaware?
Top 10 Zip Codes with the Highest Percentage of Self-Employed / Not Incorporated in Delaware are:
#1
52.9%
#2
11.9%
#3
11.8%
#4
11.7%
#5
10.1%
#6
9.1%
#7
8.8%
#8
8.5%
#9
8.0%
#10
7.8%
What zip code has the Highest Percentage of Self-Employed / Not Incorporated in Delaware?
19710 has the Highest Percentage of Self-Employed / Not Incorporated in Delaware with 52.9%.
What is the Percentage of Self-Employed / Not Incorporated in the State of Delaware?
Percentage of Self-Employed / Not Incorporated in Delaware is 4.4%.
What is the Percentage of Self-Employed / Not Incorporated in the United States?
Percentage of Self-Employed / Not Incorporated in the United States is 5.8%.