Zip Codes with the Highest Percentage of Population Employed in Sales & Related in Delaware
RELATED REPORTS & OPTIONS
Sales & Related
Delaware
Compare Zip Codes
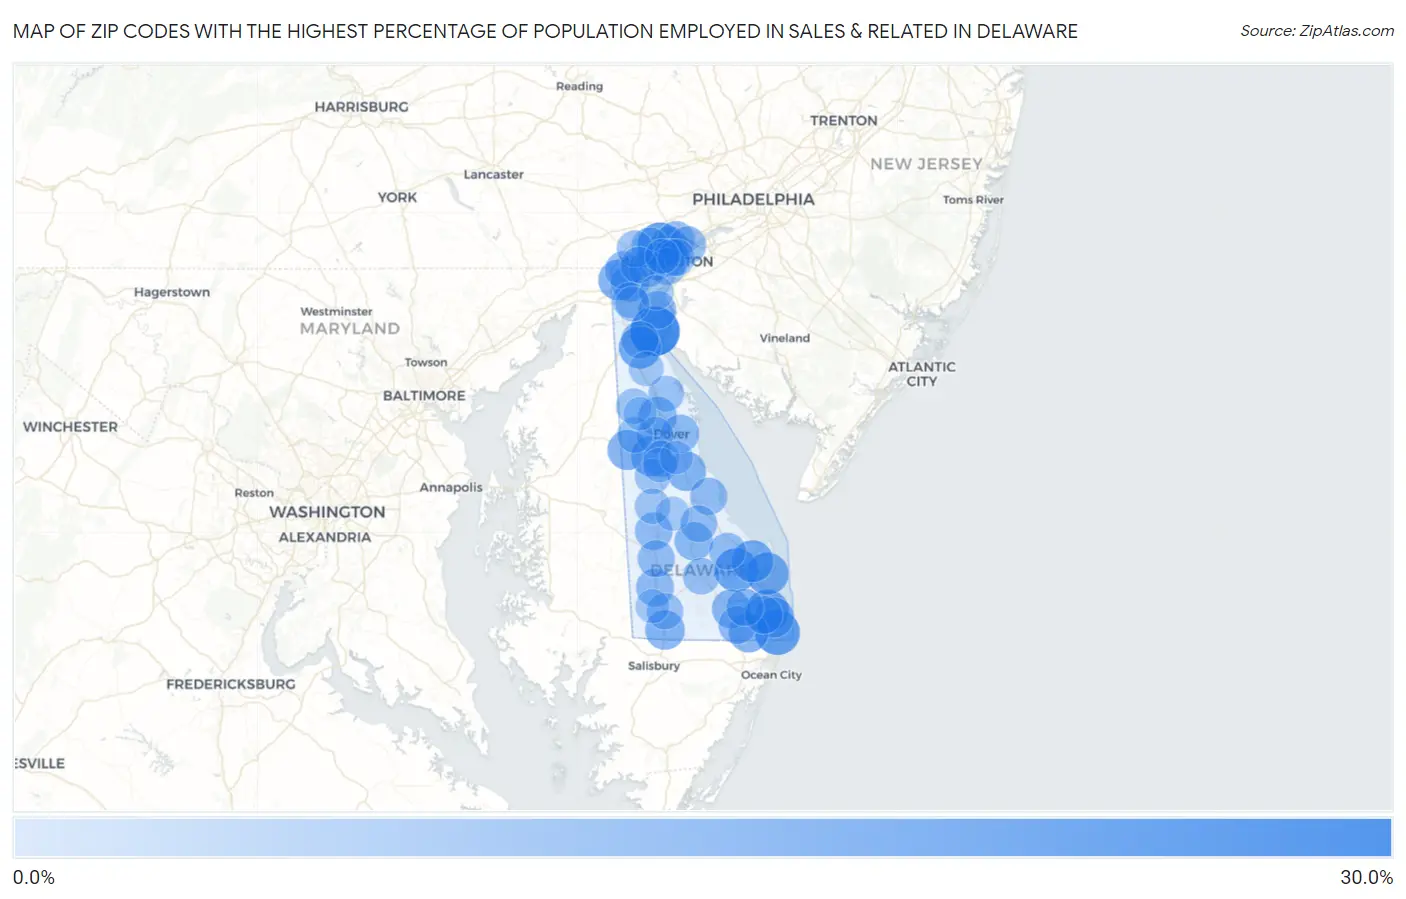
Map of Zip Codes with the Highest Percentage of Population Employed in Sales & Related in Delaware
0.0%
30.0%
Zip Codes with the Highest Percentage of Population Employed in Sales & Related in Delaware
| Zip Code | % Employed | vs State | vs National | |
| 1. | 19731 | 25.8% | 9.1%(+16.8)#1 | 9.6%(+16.2)#577 |
| 2. | 19944 | 19.5% | 9.1%(+10.4)#2 | 9.6%(+9.92)#1,232 |
| 3. | 19732 | 19.5% | 9.1%(+10.4)#3 | 9.6%(+9.87)#1,246 |
| 4. | 19951 | 17.8% | 9.1%(+8.69)#4 | 9.6%(+8.16)#1,624 |
| 5. | 19970 | 17.3% | 9.1%(+8.19)#5 | 9.6%(+7.66)#1,754 |
| 6. | 19730 | 16.0% | 9.1%(+6.96)#6 | 9.6%(+6.44)#2,225 |
| 7. | 19971 | 15.9% | 9.1%(+6.80)#7 | 9.6%(+6.27)#2,300 |
| 8. | 19958 | 15.8% | 9.1%(+6.70)#8 | 9.6%(+6.17)#2,344 |
| 9. | 19717 | 14.0% | 9.1%(+4.96)#9 | 9.6%(+4.43)#3,452 |
| 10. | 19934 | 13.4% | 9.1%(+4.32)#10 | 9.6%(+3.80)#4,045 |
| 11. | 19930 | 13.4% | 9.1%(+4.29)#11 | 9.6%(+3.77)#4,086 |
| 12. | 19964 | 12.9% | 9.1%(+3.88)#12 | 9.6%(+3.35)#4,537 |
| 13. | 19975 | 12.6% | 9.1%(+3.55)#13 | 9.6%(+3.02)#4,989 |
| 14. | 19940 | 12.3% | 9.1%(+3.22)#14 | 9.6%(+2.69)#5,508 |
| 15. | 19946 | 12.2% | 9.1%(+3.10)#15 | 9.6%(+2.57)#5,734 |
| 16. | 19966 | 11.3% | 9.1%(+2.28)#16 | 9.6%(+1.75)#7,375 |
| 17. | 19936 | 11.2% | 9.1%(+2.15)#17 | 9.6%(+1.62)#7,663 |
| 18. | 19941 | 10.9% | 9.1%(+1.81)#18 | 9.6%(+1.29)#8,497 |
| 19. | 19713 | 10.7% | 9.1%(+1.65)#19 | 9.6%(+1.12)#8,965 |
| 20. | 19901 | 10.7% | 9.1%(+1.62)#20 | 9.6%(+1.09)#9,026 |
| 21. | 19945 | 10.2% | 9.1%(+1.13)#21 | 9.6%(+0.601)#10,442 |
| 22. | 19967 | 10.1% | 9.1%(+1.04)#22 | 9.6%(+0.514)#10,693 |
| 23. | 19973 | 10.1% | 9.1%(+1.03)#23 | 9.6%(+0.497)#10,731 |
| 24. | 19706 | 10.0% | 9.1%(+0.944)#24 | 9.6%(+0.416)#10,966 |
| 25. | 19803 | 9.9% | 9.1%(+0.809)#25 | 9.6%(+0.281)#11,407 |
| 26. | 19950 | 9.8% | 9.1%(+0.765)#26 | 9.6%(+0.236)#11,535 |
| 27. | 19711 | 9.8% | 9.1%(+0.734)#27 | 9.6%(+0.206)#11,646 |
| 28. | 19810 | 9.8% | 9.1%(+0.717)#28 | 9.6%(+0.189)#11,731 |
| 29. | 19805 | 9.7% | 9.1%(+0.679)#29 | 9.6%(+0.151)#11,876 |
| 30. | 19703 | 9.6% | 9.1%(+0.509)#30 | 9.6%(-0.019)#12,480 |
| 31. | 19709 | 9.5% | 9.1%(+0.476)#31 | 9.6%(-0.052)#12,584 |
| 32. | 19807 | 9.5% | 9.1%(+0.466)#32 | 9.6%(-0.062)#12,639 |
| 33. | 19939 | 9.3% | 9.1%(+0.262)#33 | 9.6%(-0.266)#13,328 |
| 34. | 19802 | 9.3% | 9.1%(+0.199)#34 | 9.6%(-0.329)#13,538 |
| 35. | 19963 | 9.2% | 9.1%(+0.179)#35 | 9.6%(-0.349)#13,624 |
| 36. | 19933 | 9.2% | 9.1%(+0.122)#36 | 9.6%(-0.406)#13,827 |
| 37. | 19801 | 9.1% | 9.1%(+0.041)#37 | 9.6%(-0.488)#14,122 |
| 38. | 19804 | 9.0% | 9.1%(-0.044)#38 | 9.6%(-0.572)#14,423 |
| 39. | 19968 | 8.8% | 9.1%(-0.254)#39 | 9.6%(-0.783)#15,215 |
| 40. | 19809 | 8.8% | 9.1%(-0.257)#40 | 9.6%(-0.785)#15,234 |
| 41. | 19960 | 8.7% | 9.1%(-0.346)#41 | 9.6%(-0.875)#15,550 |
| 42. | 19904 | 8.5% | 9.1%(-0.534)#42 | 9.6%(-1.06)#16,227 |
| 43. | 19707 | 8.4% | 9.1%(-0.646)#43 | 9.6%(-1.17)#16,634 |
| 44. | 19947 | 8.4% | 9.1%(-0.707)#44 | 9.6%(-1.24)#16,828 |
| 45. | 19980 | 8.3% | 9.1%(-0.733)#45 | 9.6%(-1.26)#16,948 |
| 46. | 19808 | 8.3% | 9.1%(-0.811)#46 | 9.6%(-1.34)#17,220 |
| 47. | 19956 | 8.2% | 9.1%(-0.916)#47 | 9.6%(-1.44)#17,574 |
| 48. | 19953 | 7.5% | 9.1%(-1.59)#48 | 9.6%(-2.11)#19,731 |
| 49. | 19977 | 7.4% | 9.1%(-1.64)#49 | 9.6%(-2.16)#19,887 |
| 50. | 19938 | 7.1% | 9.1%(-1.94)#50 | 9.6%(-2.47)#20,852 |
| 51. | 19702 | 7.1% | 9.1%(-2.00)#51 | 9.6%(-2.53)#20,997 |
| 52. | 19943 | 6.9% | 9.1%(-2.17)#52 | 9.6%(-2.69)#21,482 |
| 53. | 19952 | 6.8% | 9.1%(-2.29)#53 | 9.6%(-2.82)#21,793 |
| 54. | 19806 | 6.3% | 9.1%(-2.80)#54 | 9.6%(-3.32)#23,018 |
| 55. | 19734 | 6.2% | 9.1%(-2.91)#55 | 9.6%(-3.44)#23,302 |
| 56. | 19979 | 6.1% | 9.1%(-2.94)#56 | 9.6%(-3.47)#23,377 |
| 57. | 19720 | 6.0% | 9.1%(-3.08)#57 | 9.6%(-3.61)#23,679 |
| 58. | 19701 | 5.9% | 9.1%(-3.13)#58 | 9.6%(-3.66)#23,795 |
| 59. | 19954 | 5.3% | 9.1%(-3.75)#59 | 9.6%(-4.27)#25,012 |
| 60. | 19931 | 5.0% | 9.1%(-4.02)#60 | 9.6%(-4.55)#25,493 |
| 61. | 19962 | 4.3% | 9.1%(-4.74)#61 | 9.6%(-5.26)#26,586 |
| 62. | 19955 | 4.1% | 9.1%(-4.96)#62 | 9.6%(-5.49)#26,899 |
1
Common Questions
What are the Top 10 Zip Codes with the Highest Percentage of Population Employed in Sales & Related in Delaware?
Top 10 Zip Codes with the Highest Percentage of Population Employed in Sales & Related in Delaware are:
What zip code has the Highest Percentage of Population Employed in Sales & Related in Delaware?
19731 has the Highest Percentage of Population Employed in Sales & Related in Delaware with 25.8%.
What is the Percentage of Population Employed in Sales & Related in the State of Delaware?
Percentage of Population Employed in Sales & Related in Delaware is 9.1%.
What is the Percentage of Population Employed in Sales & Related in the United States?
Percentage of Population Employed in Sales & Related in the United States is 9.6%.