Zip Codes with the Highest Percentage of Population Employed in Arts, Entertainment & Recreation in Delaware

RELATED REPORTS & OPTIONS

Arts, Entertainment & Recreation
Population
Families and Households
Female Fertility
Female Fertility (Unmarried)
Race (Community Size)
Race (Percentage)
Ancestry (Community Size)
AfghanAfricanAlaska NativeAlaskan AthabascanAlbanianAleutAlsatianAmericanApacheArabArapahoArgentineanArmenianAssyrian / Chaldean / SyriacAustralianAustrianBahamianBangladeshiBarbadianBasqueBelgianBelizeanBermudanBhutaneseBlackfeetBolivianBrazilianBritishBritish West IndianBulgarianBurmeseCajunCambodianCanadianCape VerdeanCarpatho RusynCelticCentral AmericanCentral American IndianCherokeeCheyenneChickasawChileanChineseChippewaChoctawColombianColvilleComancheCosta RicanCreeCreekCroatianCrowCubanCypriotCzechCzechoslovakianDanishDelawareDominicanDutchDutch West IndianEastern EuropeanEcuadorianEgyptianEnglishEstonianEthiopianEuropeanFijianFilipinoFinnishFrenchFrench American IndianFrench CanadianGermanGerman RussianGhanaianGreekGuamanian / ChamorroGuatemalanGuyaneseHaitianHmongHonduranHopiHoumaHungarianIcelanderIndian (Asian)IndonesianInupiatIranianIraqiIrishIroquoisIsraeliItalianJamaicanJapaneseJordanianKenyanKiowaKoreanLaotianLatvianLebaneseLiberianLithuanianLumbeeLuxembourgerMacedonianMalaysianMalteseMarshalleseMenomineeMexicanMexican American IndianMongolianMoroccanNative HawaiianNavajoNepaleseNew ZealanderNicaraguanNigerianNorthern EuropeanNorwegianOkinawanOsageOttawaPaiutePakistaniPalestinianPanamanianParaguayanPennsylvania GermanPeruvianPimaPolishPortuguesePotawatomiPuebloPuerto RicanPuget Sound SalishRomanianRussianSalvadoranSamoanScandinavianScotch-IrishScottishSeminoleSenegaleseSerbianShoshoneSierra LeoneanSiouxSlavicSlovakSloveneSomaliSouth AfricanSouth AmericanSouth American IndianSoviet UnionSpaniardSpanishSpanish AmericanSpanish American IndianSri LankanSubsaharan AfricanSudaneseSwedishSwissSyrianTaiwaneseThaiTlingit-HaidaTohono O'OdhamTonganTrinidadian and TobagonianTsimshianTurkishU.S. Virgin IslanderUgandanUkrainianUruguayanUteVenezuelanVietnameseWelshWest IndianYakamaYaquiYugoslavianYumanYup'ikZimbabwean
Ancestry (Percentage)
AfghanAfricanAlaska NativeAlaskan AthabascanAlbanianAleutAlsatianAmericanApacheArabArapahoArgentineanArmenianAssyrian / Chaldean / SyriacAustralianAustrianBahamianBangladeshiBarbadianBasqueBelgianBelizeanBermudanBhutaneseBlackfeetBolivianBrazilianBritishBritish West IndianBulgarianBurmeseCajunCambodianCanadianCape VerdeanCarpatho RusynCelticCentral AmericanCentral American IndianCherokeeCheyenneChickasawChileanChineseChippewaChoctawColombianColvilleComancheCosta RicanCreeCreekCroatianCrowCubanCypriotCzechCzechoslovakianDanishDelawareDominicanDutchDutch West IndianEastern EuropeanEcuadorianEgyptianEnglishEstonianEthiopianEuropeanFijianFilipinoFinnishFrenchFrench American IndianFrench CanadianGermanGerman RussianGhanaianGreekGuamanian / ChamorroGuatemalanGuyaneseHaitianHmongHonduranHopiHoumaHungarianIcelanderIndian (Asian)IndonesianInupiatIranianIraqiIrishIroquoisIsraeliItalianJamaicanJapaneseJordanianKenyanKiowaKoreanLaotianLatvianLebaneseLiberianLithuanianLumbeeLuxembourgerMacedonianMalaysianMalteseMarshalleseMenomineeMexicanMexican American IndianMongolianMoroccanNative HawaiianNavajoNepaleseNew ZealanderNicaraguanNigerianNorthern EuropeanNorwegianOkinawanOsageOttawaPaiutePakistaniPalestinianPanamanianParaguayanPennsylvania GermanPeruvianPimaPolishPortuguesePotawatomiPuebloPuerto RicanPuget Sound SalishRomanianRussianSalvadoranSamoanScandinavianScotch-IrishScottishSeminoleSenegaleseSerbianShoshoneSierra LeoneanSiouxSlavicSlovakSloveneSomaliSouth AfricanSouth AmericanSouth American IndianSoviet UnionSpaniardSpanishSpanish AmericanSpanish American IndianSri LankanSubsaharan AfricanSudaneseSwedishSwissSyrianTaiwaneseThaiTlingit-HaidaTohono O'OdhamTonganTrinidadian and TobagonianTsimshianTurkishU.S. Virgin IslanderUgandanUkrainianUruguayanUteVenezuelanVietnameseWelshWest IndianYakamaYaquiYugoslavianYumanYup'ikZimbabwean
Immigrant Origin (Total)
AfghanistanAfricaAlbaniaArgentinaArmeniaAsiaAustraliaAustriaAzoresBahamasBangladeshBarbadosBelarusBelgiumBelizeBoliviaBosnia and HerzegovinaBrazilBulgariaBurma / MyanmarCabo VerdeCambodiaCameroonCanadaCaribbeanCentral AmericaChileChinaColombiaCongoCosta RicaCroatiaCubaCzechoslovakiaDenmarkDominicaDominican RepublicEastern AfricaEastern AsiaEastern EuropeEcuadorEgyptEl SalvadorEnglandEritreaEthiopiaEuropeFijiFranceGermanyGhanaGreeceGrenadaGuatemalaGuyanaHaitiHondurasHong KongHungaryIndiaIndonesiaIranIraqIrelandIsraelItalyJamaicaJapanJordanKazakhstanKenyaKoreaKuwaitLaosLatin AmericaLatviaLebanonLiberiaLithuaniaMalaysiaMexicoMicronesiaMiddle AfricaMoldovaMoroccoNepalNetherlandsNicaraguaNigeriaNorth MacedoniaNorthern AfricaNorthern EuropeNorwayOceaniaPakistanPanamaPeruPhilippinesPolandPortugalRomaniaRussiaSaudi ArabiaScotlandSenegalSerbiaSierra LeoneSingaporeSomaliaSouth AfricaSouth AmericaSouth Central AsiaSouth Eastern AsiaSouthern EuropeSpainSri LankaSt. Vincent and the GrenadinesSudanSwedenSwitzerlandSyriaTaiwanThailandTrinidad and TobagoTurkeyUgandaUkraineUruguayUzbekistanVenezuelaVietnamWest IndiesWestern AfricaWestern AsiaWestern EuropeYemenZaireZimbabwe
Immigrant Origin (Percentage)
AfghanistanAfricaAlbaniaArgentinaArmeniaAsiaAustraliaAustriaAzoresBahamasBangladeshBarbadosBelarusBelgiumBelizeBoliviaBosnia and HerzegovinaBrazilBulgariaBurma / MyanmarCabo VerdeCambodiaCameroonCanadaCaribbeanCentral AmericaChileChinaColombiaCongoCosta RicaCroatiaCubaCzechoslovakiaDenmarkDominicaDominican RepublicEastern AfricaEastern AsiaEastern EuropeEcuadorEgyptEl SalvadorEnglandEritreaEthiopiaEuropeFijiFranceGermanyGhanaGreeceGrenadaGuatemalaGuyanaHaitiHondurasHong KongHungaryIndiaIndonesiaIranIraqIrelandIsraelItalyJamaicaJapanJordanKazakhstanKenyaKoreaKuwaitLaosLatin AmericaLatviaLebanonLiberiaLithuaniaMalaysiaMexicoMicronesiaMiddle AfricaMoldovaMoroccoNepalNetherlandsNicaraguaNigeriaNorth MacedoniaNorthern AfricaNorthern EuropeNorwayOceaniaPakistanPanamaPeruPhilippinesPolandPortugalRomaniaRussiaSaudi ArabiaScotlandSenegalSerbiaSierra LeoneSingaporeSomaliaSouth AfricaSouth AmericaSouth Central AsiaSouth Eastern AsiaSouthern EuropeSpainSri LankaSt. Vincent and the GrenadinesSudanSwedenSwitzerlandSyriaTaiwanThailandTrinidad and TobagoTurkeyUgandaUkraineUruguayUzbekistanVenezuelaVietnamWest IndiesWestern AfricaWestern AsiaWestern EuropeYemenZaireZimbabwe
Income
Income (Families)
Income (Households)
Poverty
Poverty (Families)
Unemployment
Employment Occupations
Employment Industries
Employer Class
Commute Time
Commute Means
School Enrollment
Education by Degree Field
Occupancy
Finances
Physical Characteristics
Delaware
Compare Zip Codes
Comparison Subject

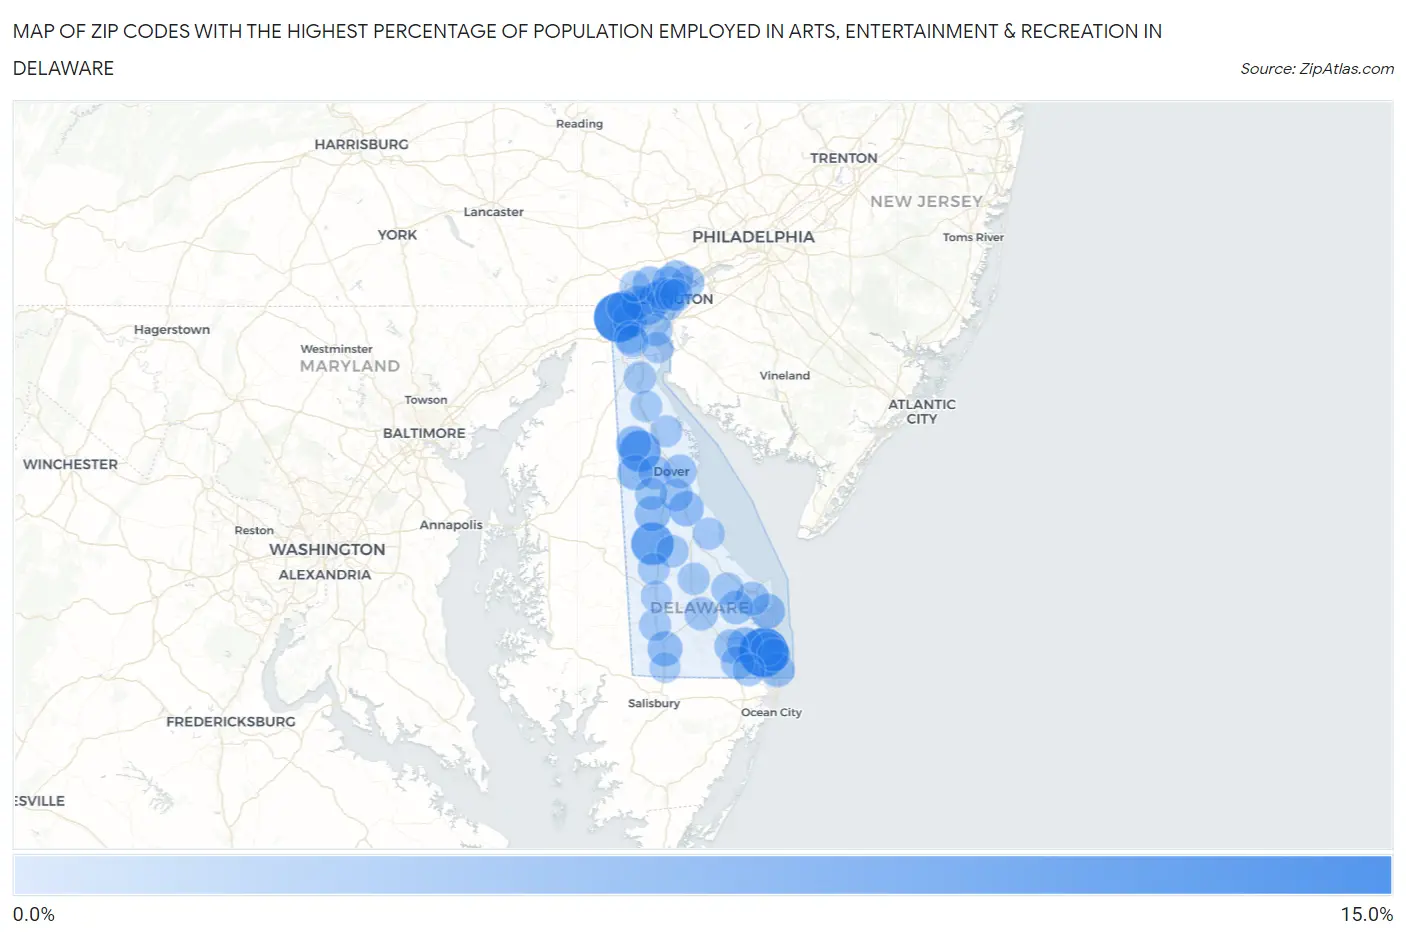
Map of Zip Codes with the Highest Percentage of Population Employed in Arts, Entertainment & Recreation in Delaware

0.0%
15.0%
Zip Codes with the Highest Percentage of Population Employed in Arts, Entertainment & Recreation in Delaware Map

Zip Codes with the Highest Percentage of Population Employed in Arts, Entertainment & Recreation in Delaware

Zip Code % Employed vs State vs National
1.1996712.0%2.0%(+9.98)#12.1%(+9.89)#510
2.1971711.9%2.0%(+9.95)#22.1%(+9.86)#512
3.199527.6%2.0%(+5.58)#32.1%(+5.50)#1,161
4.199556.8%2.0%(+4.85)#42.1%(+4.77)#1,378
5.198044.5%2.0%(+2.50)#52.1%(+2.41)#2,747
6.199433.3%2.0%(+1.28)#62.1%(+1.20)#4,614
7.199393.2%2.0%(+1.23)#72.1%(+1.14)#4,740
8.199383.2%2.0%(+1.19)#82.1%(+1.10)#4,839
9.199533.2%2.0%(+1.16)#92.1%(+1.07)#4,917
10.197133.0%2.0%(+0.976)#102.1%(+0.891)#5,437
11.199562.9%2.0%(+0.950)#112.1%(+0.865)#5,512
12.199712.9%2.0%(+0.941)#122.1%(+0.856)#5,542
13.199462.9%2.0%(+0.924)#132.1%(+0.839)#5,589
14.198072.7%2.0%(+0.702)#142.1%(+0.617)#6,362
15.198052.7%2.0%(+0.684)#152.1%(+0.599)#6,429
16.198082.5%2.0%(+0.473)#162.1%(+0.388)#7,307
17.199442.4%2.0%(+0.442)#172.1%(+0.356)#7,468
18.199582.3%2.0%(+0.343)#182.1%(+0.258)#7,921
19.198102.3%2.0%(+0.313)#192.1%(+0.228)#8,079
20.199662.3%2.0%(+0.303)#202.1%(+0.218)#8,120
21.197112.2%2.0%(+0.155)#212.1%(+0.070)#8,907
22.199702.1%2.0%(+0.083)#222.1%(-0.002)#9,318
23.199012.1%2.0%(+0.081)#232.1%(-0.004)#9,328
24.197032.1%2.0%(+0.070)#242.1%(-0.016)#9,389
25.199452.0%2.0%(+0.016)#252.1%(-0.069)#9,690
26.199512.0%2.0%(+0.000)#262.1%(-0.085)#9,790
27.199042.0%2.0%(-0.022)#272.1%(-0.107)#9,921
28.199472.0%2.0%(-0.035)#282.1%(-0.120)#10,001
29.199301.9%2.0%(-0.119)#292.1%(-0.204)#10,497
30.199621.8%2.0%(-0.218)#302.1%(-0.303)#11,162
31.198011.7%2.0%(-0.274)#312.1%(-0.360)#11,563
32.198031.6%2.0%(-0.352)#322.1%(-0.437)#12,122
33.198061.6%2.0%(-0.405)#332.1%(-0.490)#12,515
34.199541.5%2.0%(-0.497)#342.1%(-0.582)#13,231
35.197021.5%2.0%(-0.519)#352.1%(-0.604)#13,384
36.198021.5%2.0%(-0.521)#362.1%(-0.606)#13,401
37.199751.5%2.0%(-0.524)#372.1%(-0.609)#13,422
38.198091.5%2.0%(-0.540)#382.1%(-0.625)#13,538
39.197201.4%2.0%(-0.561)#392.1%(-0.646)#13,707
40.199681.4%2.0%(-0.581)#402.1%(-0.666)#13,845
41.199341.4%2.0%(-0.584)#412.1%(-0.669)#13,876
42.197091.4%2.0%(-0.638)#422.1%(-0.723)#14,298
43.199731.3%2.0%(-0.699)#432.1%(-0.784)#14,726
44.199411.3%2.0%(-0.727)#442.1%(-0.812)#14,931
45.199631.2%2.0%(-0.828)#452.1%(-0.913)#15,705
46.197011.1%2.0%(-0.868)#462.1%(-0.953)#16,004
47.199501.1%2.0%(-0.891)#472.1%(-0.976)#16,189
48.199771.1%2.0%(-0.899)#482.1%(-0.984)#16,260
49.197341.0%2.0%(-0.969)#492.1%(-1.05)#16,749
50.197060.78%2.0%(-1.22)#502.1%(-1.30)#18,555
51.199330.62%2.0%(-1.38)#512.1%(-1.46)#19,687
52.197070.59%2.0%(-1.41)#522.1%(-1.50)#19,928
53.199400.50%2.0%(-1.50)#532.1%(-1.58)#20,488

Common Questions

What are the Top 10 Zip Codes with the Highest Percentage of Population Employed in Arts, Entertainment & Recreation in Delaware?
Top 10 Zip Codes with the Highest Percentage of Population Employed in Arts, Entertainment & Recreation in Delaware are:
#1
12.0%
#2
11.9%
#3
7.6%
#4
6.8%
#5
4.5%
#6
3.3%
#7
3.2%
#8
3.2%
#9
3.2%
#10
3.0%
What zip code has the Highest Percentage of Population Employed in Arts, Entertainment & Recreation in Delaware?
19967 has the Highest Percentage of Population Employed in Arts, Entertainment & Recreation in Delaware with 12.0%.
What is the Percentage of Population Employed in Arts, Entertainment & Recreation in the State of Delaware?
Percentage of Population Employed in Arts, Entertainment & Recreation in Delaware is 2.0%.
What is the Percentage of Population Employed in Arts, Entertainment & Recreation in the United States?
Percentage of Population Employed in Arts, Entertainment & Recreation in the United States is 2.1%.