Zip Codes with the Lowest Percentage of Births to Unmarried Women over the Age of 35 in Pueblo, CO

RELATED REPORTS & OPTIONS

Lowest Illegitimacy | Women 35+
Population
Families and Households
Female Fertility
Female Fertility (Unmarried)
Race (Community Size)
Race (Percentage)
Ancestry (Community Size)
AfricanAmericanApacheArabArgentineanArmenianAustrianBasqueBelgianBhutaneseBlackfeetBolivianBrazilianBritishBurmeseCajunCanadianCelticCentral AmericanCherokeeCheyenneChickasawChileanChippewaChoctawColombianComancheCreekCroatianCrowCubanCzechCzechoslovakianDanishDominicanDutchEastern EuropeanEnglishEuropeanFinnishFrenchFrench CanadianGermanGreekGuamanian / ChamorroGuatemalanHonduranHungarianIcelanderIndian (Asian)IrishIroquoisItalianJamaicanKoreanLebaneseLithuanianLuxembourgerMexicanMexican American IndianNative HawaiianNavajoNigerianNorthern EuropeanNorwegianOkinawanPaiutePakistaniPanamanianPennsylvania GermanPeruvianPolishPortuguesePotawatomiPuebloPuerto RicanRomanianRussianSalvadoranSamoanScandinavianScotch-IrishScottishSeminoleSerbianSiouxSlavicSlovakSloveneSouth AmericanSpaniardSpanishSpanish AmericanSpanish American IndianSri LankanSubsaharan AfricanSwedishSwissThaiUkrainianUteWelshYugoslavian
Ancestry (Percentage)
AfricanAmericanApacheArabArgentineanArmenianAustrianBasqueBelgianBhutaneseBlackfeetBolivianBrazilianBritishBurmeseCajunCanadianCelticCentral AmericanCherokeeCheyenneChickasawChileanChippewaChoctawColombianComancheCreekCroatianCrowCubanCzechCzechoslovakianDanishDominicanDutchEastern EuropeanEnglishEuropeanFinnishFrenchFrench CanadianGermanGreekGuamanian / ChamorroGuatemalanHonduranHungarianIcelanderIndian (Asian)IrishIroquoisItalianJamaicanKoreanLebaneseLithuanianLuxembourgerMexicanMexican American IndianNative HawaiianNavajoNigerianNorthern EuropeanNorwegianOkinawanPaiutePakistaniPanamanianPennsylvania GermanPeruvianPolishPortuguesePotawatomiPuebloPuerto RicanRomanianRussianSalvadoranSamoanScandinavianScotch-IrishScottishSeminoleSerbianSiouxSlavicSlovakSloveneSouth AmericanSpaniardSpanishSpanish AmericanSpanish American IndianSri LankanSubsaharan AfricanSwedishSwissThaiUkrainianUteWelshYugoslavian
Immigrant Origin (Total)
Immigrant Origin (Percentage)
Income
Income (Families)
Income (Households)
Poverty
Poverty (Families)
Unemployment
Employment Occupations
Employment Industries
Employer Class
Commute Time
Commute Means
School Enrollment
Education by Degree Field
Occupancy
Finances
Physical Characteristics
Pueblo
Compare Zip Codes
Comparison Subject

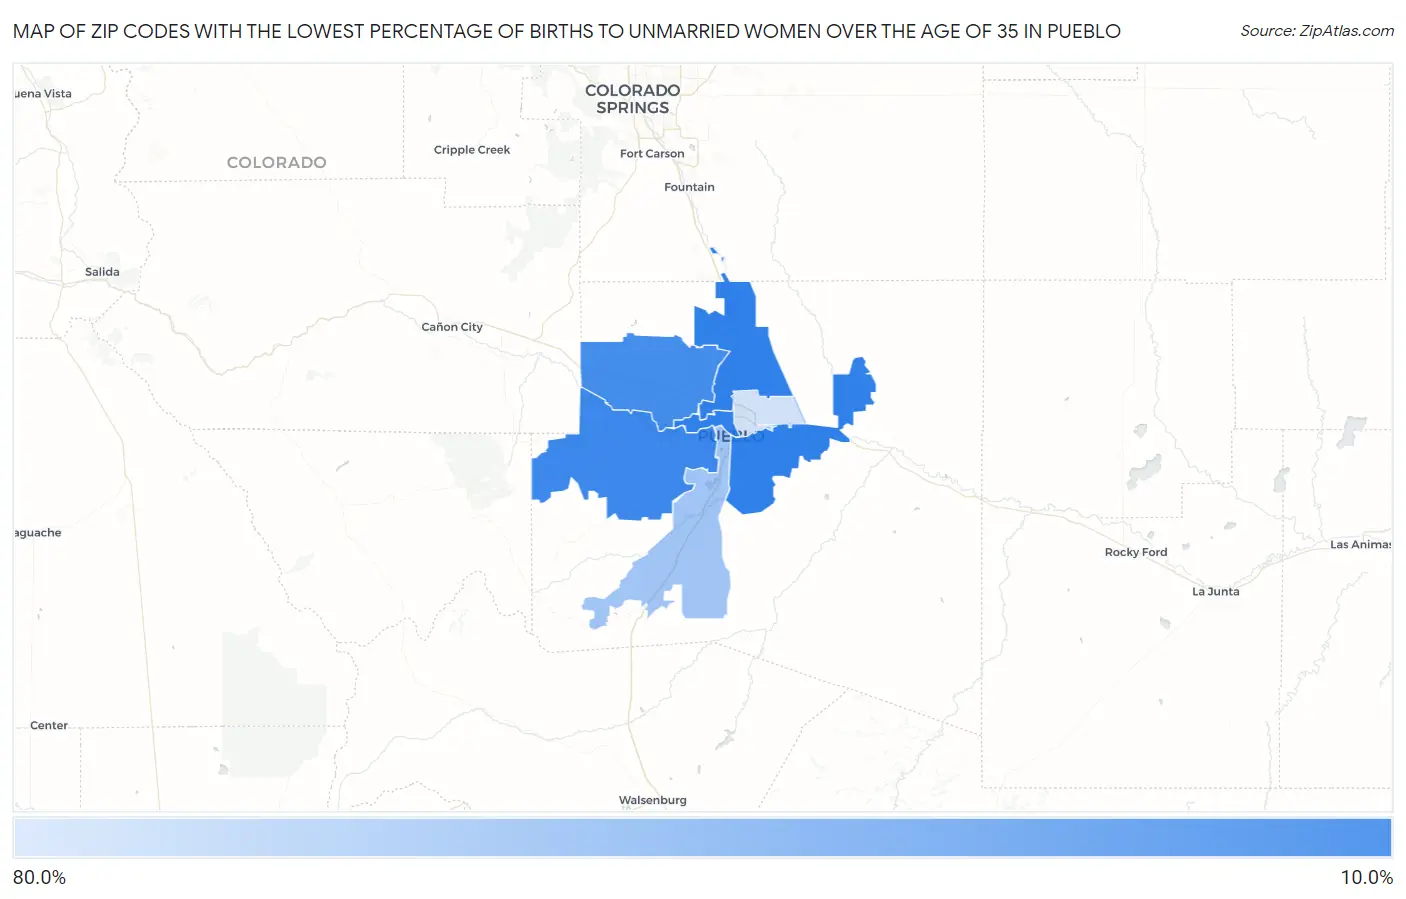
Map of Zip Codes with the Lowest Percentage of Births to Unmarried Women over the Age of 35 in Pueblo

80.0%
0.0%
Zip Codes with the Lowest Percentage of Births to Unmarried Women over the Age of 35 in Pueblo Map

Zip Codes with the Lowest Percentage of Births to Unmarried Women over the Age of 35 in Pueblo, CO

Zip Code % Unmarried vs State vs National
1.8100518.8%15.3%(+3.50)#3520.1%(-1.30)#1,843
2.8100721.5%15.3%(+6.20)#4120.1%(+1.40)#2,135
3.8100450.0%15.3%(+34.7)#7820.1%(+29.9)#4,353
4.8100167.6%15.3%(+52.3)#8920.1%(+47.5)#5,168

Common Questions

What are the Top 5 Zip Codes with the Lowest Percentage of Births to Unmarried Women over the Age of 35 in Pueblo, CO?
Top 5 Zip Codes with the Lowest Percentage of Births to Unmarried Women over the Age of 35 in Pueblo, CO are:
#1
0.0%
#2
0.0%
#3
0.0%
#4
18.8%
#5
21.5%
What zip code has the Lowest Percentage of Births to Unmarried Women over the Age of 35 in Pueblo, CO?
81005 has the Lowest Percentage of Births to Unmarried Women over the Age of 35 in Pueblo, CO with 18.8%.
What is the Percentage of Births to Unmarried Women over the Age of 35 in Pueblo, CO?
Percentage of Births to Unmarried Women over the Age of 35 in Pueblo is 37.0%.
What is the Percentage of Births to Unmarried Women over the Age of 35 in Colorado?
Percentage of Births to Unmarried Women over the Age of 35 in Colorado is 15.3%.
What is the Percentage of Births to Unmarried Women over the Age of 35 in the United States?
Percentage of Births to Unmarried Women over the Age of 35 in the United States is 20.1%.