Orange Grove Mobile Manor, AZ Map & Demographics
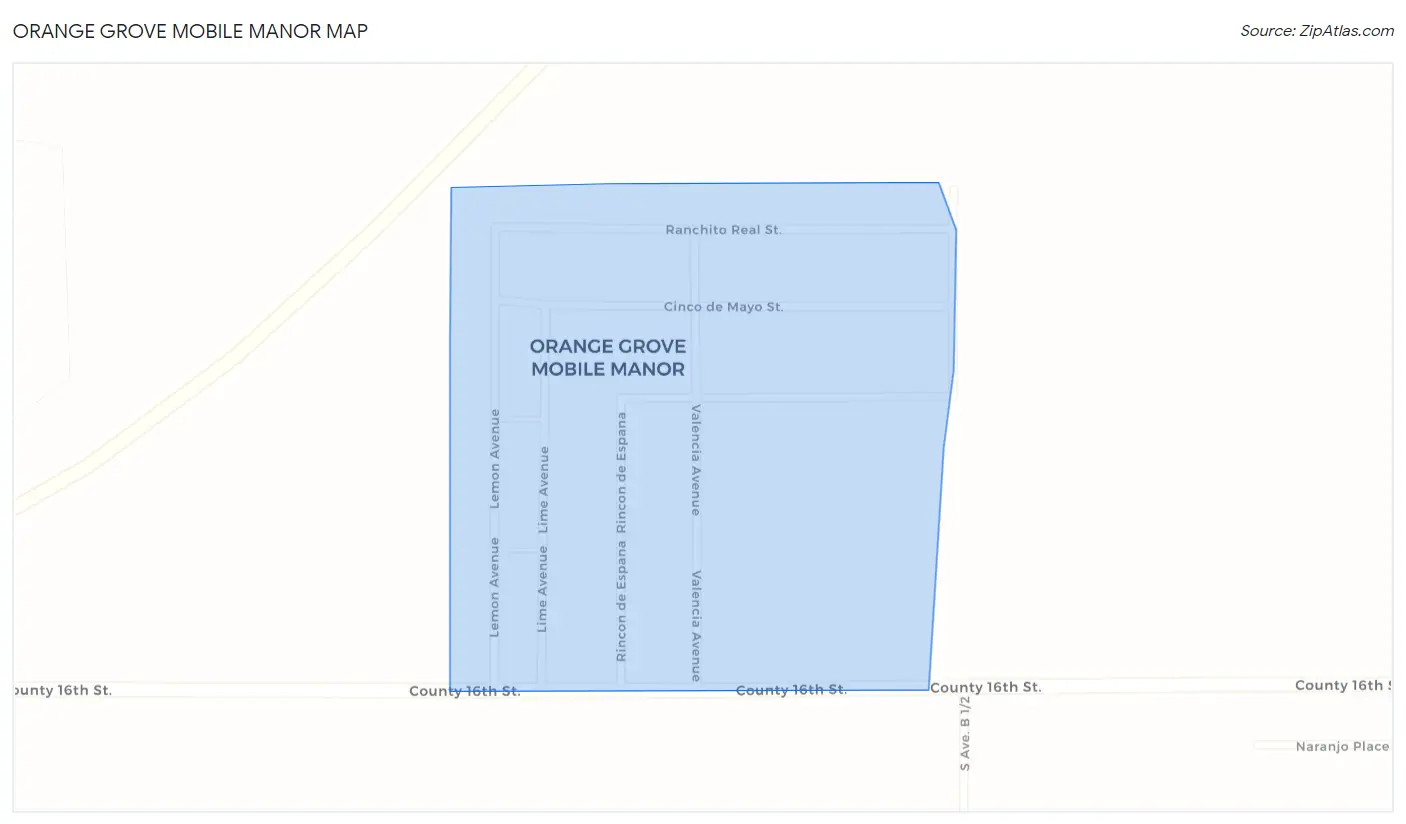
Orange Grove Mobile Manor Map
Orange Grove Mobile Manor Overview
$35,114
PER CAPITA INCOME
0.22
INEQUALITY / GINI INDEX
165
TOTAL POPULATION
109
MALE POPULATION
56
FEMALE POPULATION
194.64
MALES / 100 FEMALES
51.38
FEMALES / 100 MALES
47.1
MEDIAN AGE
3.0
AVG FAMILY SIZE
3.0
AVG HOUSEHOLD SIZE
125
LABOR FORCE [ PEOPLE ]
75.8%
PERCENT IN LABOR FORCE
Income in Orange Grove Mobile Manor
Income Overview in Orange Grove Mobile Manor
| Characteristic | Number | Measure |
| Per Capita Income | 165 | $35,114 |
| Median Family Income | 56 | $0 |
| Mean Family Income | 56 | $0 |
| Median Household Income | 56 | $0 |
| Mean Household Income | 56 | $0 |
| Income Deficit | 56 | $0 |
| Wage / Income Gap (%) | 165 | 0.00% |
| Wage / Income Gap ($) | 165 | 100.00¢ per $1 |
| Gini / Inequality Index | 165 | 0.22 |
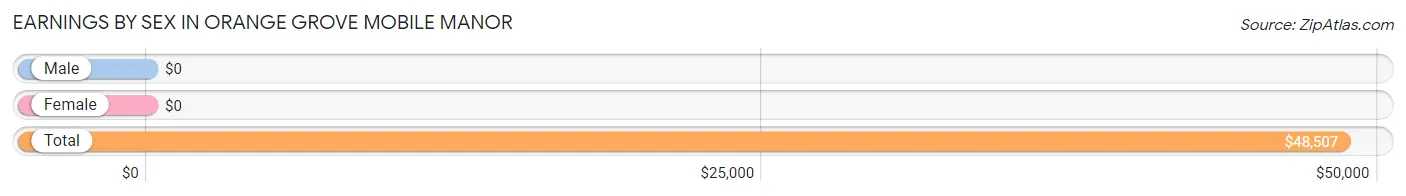
Earnings by Sex in Orange Grove Mobile Manor
| Sex | Number | Average Earnings |
| Male | 89 (71.2%) | $0 |
| Female | 36 (28.8%) | $0 |
| Total | 125 (100.0%) | $48,507 |
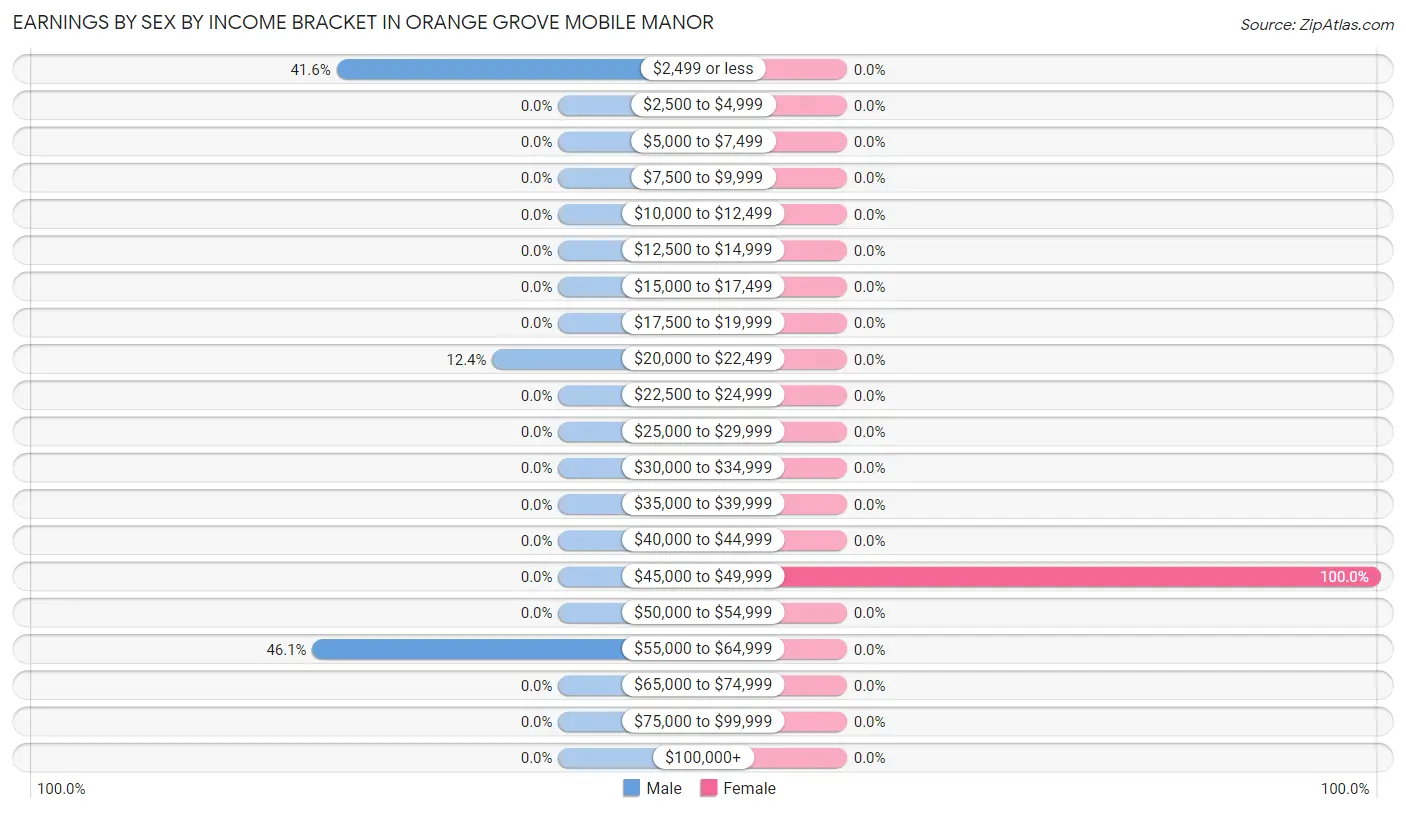
Earnings by Sex by Income Bracket in Orange Grove Mobile Manor
The most common earnings brackets in Orange Grove Mobile Manor are $55,000 to $64,999 for men (41 | 46.1%) and $45,000 to $49,999 for women (36 | 100.0%).
| Income | Male | Female |
| $2,499 or less | 37 (41.6%) | 0 (0.0%) |
| $2,500 to $4,999 | 0 (0.0%) | 0 (0.0%) |
| $5,000 to $7,499 | 0 (0.0%) | 0 (0.0%) |
| $7,500 to $9,999 | 0 (0.0%) | 0 (0.0%) |
| $10,000 to $12,499 | 0 (0.0%) | 0 (0.0%) |
| $12,500 to $14,999 | 0 (0.0%) | 0 (0.0%) |
| $15,000 to $17,499 | 0 (0.0%) | 0 (0.0%) |
| $17,500 to $19,999 | 0 (0.0%) | 0 (0.0%) |
| $20,000 to $22,499 | 11 (12.4%) | 0 (0.0%) |
| $22,500 to $24,999 | 0 (0.0%) | 0 (0.0%) |
| $25,000 to $29,999 | 0 (0.0%) | 0 (0.0%) |
| $30,000 to $34,999 | 0 (0.0%) | 0 (0.0%) |
| $35,000 to $39,999 | 0 (0.0%) | 0 (0.0%) |
| $40,000 to $44,999 | 0 (0.0%) | 0 (0.0%) |
| $45,000 to $49,999 | 0 (0.0%) | 36 (100.0%) |
| $50,000 to $54,999 | 0 (0.0%) | 0 (0.0%) |
| $55,000 to $64,999 | 41 (46.1%) | 0 (0.0%) |
| $65,000 to $74,999 | 0 (0.0%) | 0 (0.0%) |
| $75,000 to $99,999 | 0 (0.0%) | 0 (0.0%) |
| $100,000+ | 0 (0.0%) | 0 (0.0%) |
| Total | 89 (100.0%) | 36 (100.0%) |
Earnings by Sex by Educational Attainment in Orange Grove Mobile Manor
| Educational Attainment | Male Income | Female Income |
| Less than High School | - | - |
| High School Diploma | - | - |
| College or Associate's Degree | - | - |
| Bachelor's Degree | - | - |
| Graduate Degree | - | - |
| Total | - | - |
Family Income in Orange Grove Mobile Manor
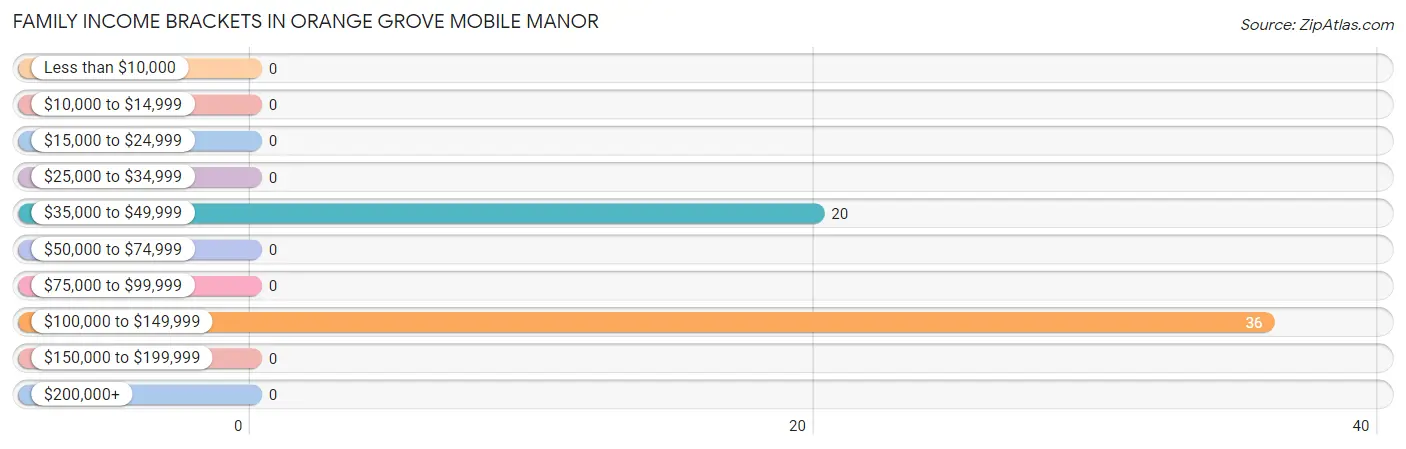
Family Income Brackets in Orange Grove Mobile Manor
According to the Orange Grove Mobile Manor family income data, there are 36 families falling into the $100,000 to $149,999 income range, which is the most common income bracket and makes up 64.3% of all families.
| Income Bracket | # Families | % Families |
| Less than $10,000 | 0 | 0.0% |
| $10,000 to $14,999 | 0 | 0.0% |
| $15,000 to $24,999 | 0 | 0.0% |
| $25,000 to $34,999 | 0 | 0.0% |
| $35,000 to $49,999 | 20 | 35.7% |
| $50,000 to $74,999 | 0 | 0.0% |
| $75,000 to $99,999 | 0 | 0.0% |
| $100,000 to $149,999 | 36 | 64.3% |
| $150,000 to $199,999 | 0 | 0.0% |
| $200,000+ | 0 | 0.0% |
Family Income by Famaliy Size in Orange Grove Mobile Manor
| Income Bracket | # Families | Median Income |
| 2-Person Families | 0 (0.0%) | $0 |
| 3-Person Families | 56 (100.0%) | $0 |
| 4-Person Families | 0 (0.0%) | $0 |
| 5-Person Families | 0 (0.0%) | $0 |
| 6-Person Families | 0 (0.0%) | $0 |
| 7+ Person Families | 0 (0.0%) | $0 |
| Total | 56 (100.0%) | $0 |
Family Income by Number of Earners in Orange Grove Mobile Manor
| Number of Earners | # Families | Median Income |
| No Earners | 0 (0.0%) | $0 |
| 1 Earner | 20 (35.7%) | $0 |
| 2 Earners | 0 (0.0%) | $0 |
| 3+ Earners | 36 (64.3%) | $0 |
| Total | 56 (100.0%) | $0 |
Household Income in Orange Grove Mobile Manor
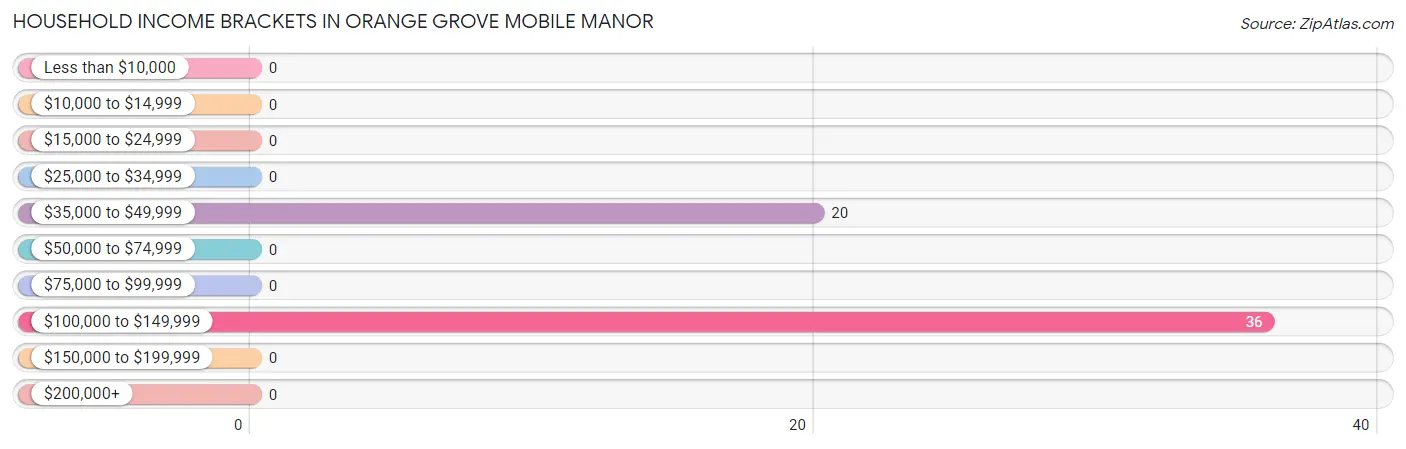
Household Income Brackets in Orange Grove Mobile Manor
With 36 households falling in the category, the $100,000 to $149,999 income range is the most frequent in Orange Grove Mobile Manor, accounting for 64.3% of all households.
| Income Bracket | # Households | % Households |
| Less than $10,000 | 0 | 0.0% |
| $10,000 to $14,999 | 0 | 0.0% |
| $15,000 to $24,999 | 0 | 0.0% |
| $25,000 to $34,999 | 0 | 0.0% |
| $35,000 to $49,999 | 20 | 35.7% |
| $50,000 to $74,999 | 0 | 0.0% |
| $75,000 to $99,999 | 0 | 0.0% |
| $100,000 to $149,999 | 36 | 64.3% |
| $150,000 to $199,999 | 0 | 0.0% |
| $200,000+ | 0 | 0.0% |
Household Income by Householder Age in Orange Grove Mobile Manor
| Income Bracket | # Households | Median Income |
| 15 to 24 Years | 0 (0.0%) | $0 |
| 25 to 44 Years | 0 (0.0%) | $0 |
| 45 to 64 Years | 36 (64.3%) | $0 |
| 65+ Years | 20 (35.7%) | $0 |
| Total | 56 (100.0%) | $0 |
Poverty in Orange Grove Mobile Manor
Income Below Poverty by Sex and Age in Orange Grove Mobile Manor
| Age Bracket | Male | Female |
| Under 5 Years | 0 (0.0%) | 0 (0.0%) |
| 5 Years | 0 (0.0%) | 0 (0.0%) |
| 6 to 11 Years | 0 (0.0%) | 0 (0.0%) |
| 12 to 14 Years | 0 (0.0%) | 0 (0.0%) |
| 15 Years | 0 (0.0%) | 0 (0.0%) |
| 16 and 17 Years | 0 (0.0%) | 0 (0.0%) |
| 18 to 24 Years | 0 (0.0%) | 0 (0.0%) |
| 25 to 34 Years | 0 (0.0%) | 0 (0.0%) |
| 35 to 44 Years | 0 (0.0%) | 0 (0.0%) |
| 45 to 54 Years | 0 (0.0%) | 0 (0.0%) |
| 55 to 64 Years | 0 (0.0%) | 0 (0.0%) |
| 65 to 74 Years | 0 (0.0%) | 0 (0.0%) |
| 75 Years and over | 0 (0.0%) | 0 (0.0%) |
| Total | 0 (0.0%) | 0 (0.0%) |
Income Above Poverty by Sex and Age in Orange Grove Mobile Manor
According to the poverty statistics in Orange Grove Mobile Manor, males aged 16 and 17 years and females aged 45 to 54 years are the age groups that are most secure financially, with 100.0% of males and 100.0% of females in these age groups living above the poverty line.
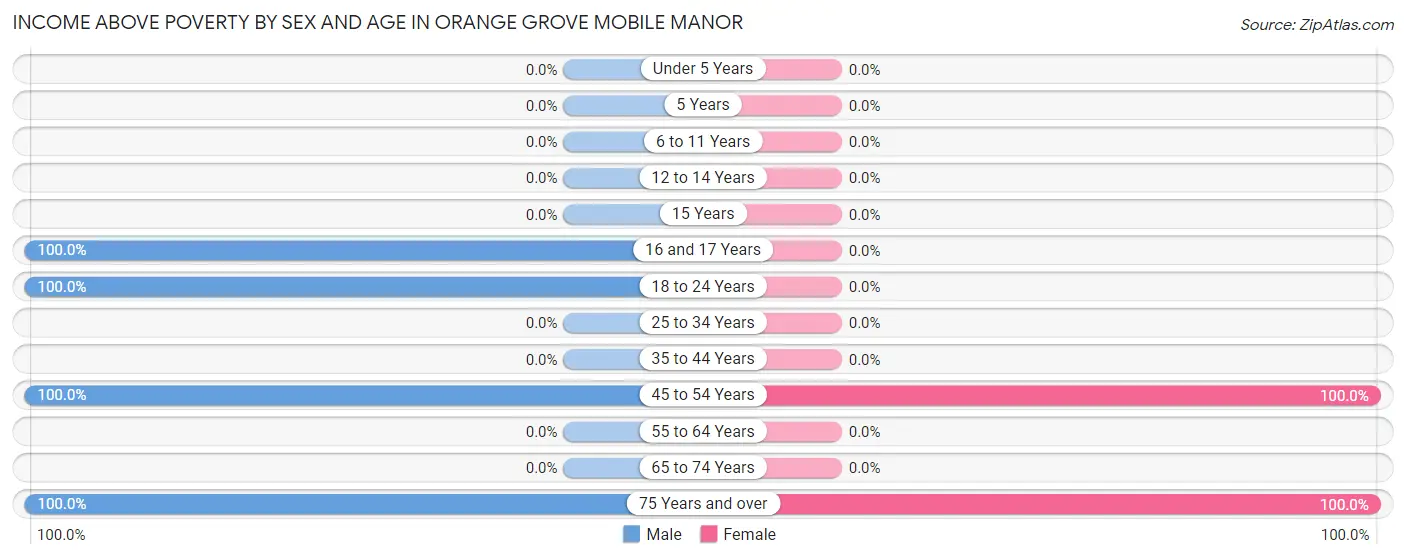
| Age Bracket | Male | Female |
| Under 5 Years | 0 (0.0%) | 0 (0.0%) |
| 5 Years | 0 (0.0%) | 0 (0.0%) |
| 6 to 11 Years | 0 (0.0%) | 0 (0.0%) |
| 12 to 14 Years | 0 (0.0%) | 0 (0.0%) |
| 15 Years | 0 (0.0%) | 0 (0.0%) |
| 16 and 17 Years | 37 (100.0%) | 0 (0.0%) |
| 18 to 24 Years | 41 (100.0%) | 0 (0.0%) |
| 25 to 34 Years | 0 (0.0%) | 0 (0.0%) |
| 35 to 44 Years | 0 (0.0%) | 0 (0.0%) |
| 45 to 54 Years | 11 (100.0%) | 36 (100.0%) |
| 55 to 64 Years | 0 (0.0%) | 0 (0.0%) |
| 65 to 74 Years | 0 (0.0%) | 0 (0.0%) |
| 75 Years and over | 20 (100.0%) | 20 (100.0%) |
| Total | 109 (100.0%) | 56 (100.0%) |
Income Below Poverty Among Married-Couple Families in Orange Grove Mobile Manor
| Children | Above Poverty | Below Poverty |
| No Children | 20 (100.0%) | 0 (0.0%) |
| 1 or 2 Children | 0 (0.0%) | 0 (0.0%) |
| 3 or 4 Children | 0 (0.0%) | 0 (0.0%) |
| 5 or more Children | 0 (0.0%) | 0 (0.0%) |
| Total | 20 (100.0%) | 0 (0.0%) |
Income Below Poverty Among Single-Parent Households in Orange Grove Mobile Manor
| Children | Single Father | Single Mother |
| No Children | 0 (0.0%) | 0 (0.0%) |
| 1 or 2 Children | 0 (0.0%) | 0 (0.0%) |
| 3 or 4 Children | 0 (0.0%) | 0 (0.0%) |
| 5 or more Children | 0 (0.0%) | 0 (0.0%) |
| Total | 0 (0.0%) | 0 (0.0%) |
Income Below Poverty Among Married-Couple vs Single-Parent Households in Orange Grove Mobile Manor
| Children | Married-Couple Families | Single-Parent Households |
| No Children | 0 (0.0%) | 0 (0.0%) |
| 1 or 2 Children | 0 (0.0%) | 0 (0.0%) |
| 3 or 4 Children | 0 (0.0%) | 0 (0.0%) |
| 5 or more Children | 0 (0.0%) | 0 (0.0%) |
| Total | 0 (0.0%) | 0 (0.0%) |
Race in Orange Grove Mobile Manor
The most populous races in Orange Grove Mobile Manor are Hispanic or Latino (165 | 100.0%), Two or more Races (114 | 69.1%), and White / Caucasian (51 | 30.9%).
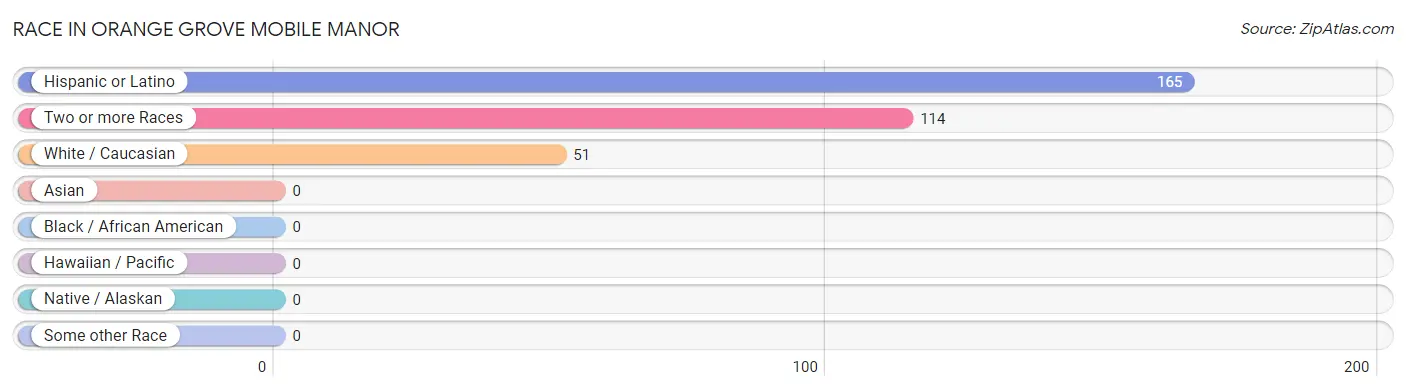
| Race | # Population | % Population |
| Asian | 0 | 0.0% |
| Black / African American | 0 | 0.0% |
| Hawaiian / Pacific | 0 | 0.0% |
| Hispanic or Latino | 165 | 100.0% |
| Native / Alaskan | 0 | 0.0% |
| White / Caucasian | 51 | 30.9% |
| Two or more Races | 114 | 69.1% |
| Some other Race | 0 | 0.0% |
| Total | 165 | 100.0% |
Ancestry in Orange Grove Mobile Manor
The most populous ancestries reported in Orange Grove Mobile Manor are , and Mexican (165 | 100.0%), together accounting for 100.0% of all Orange Grove Mobile Manor residents.

| Ancestry | # Population | % Population |
| Mexican | 165 | 100.0% | View All 1 Rows |
Immigrants in Orange Grove Mobile Manor
The most numerous immigrant groups reported in Orange Grove Mobile Manor came from Central America (76 | 46.1%), Latin America (76 | 46.1%), and Mexico (76 | 46.1%), together accounting for 138.2% of all Orange Grove Mobile Manor residents.
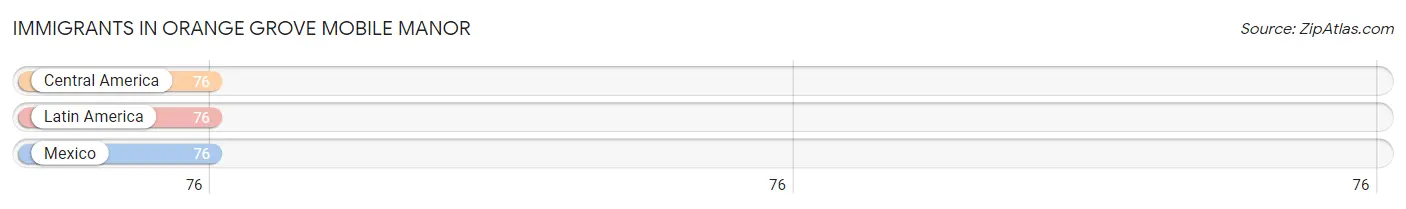
| Immigration Origin | # Population | % Population |
| Central America | 76 | 46.1% |
| Latin America | 76 | 46.1% |
| Mexico | 76 | 46.1% | View All 3 Rows |
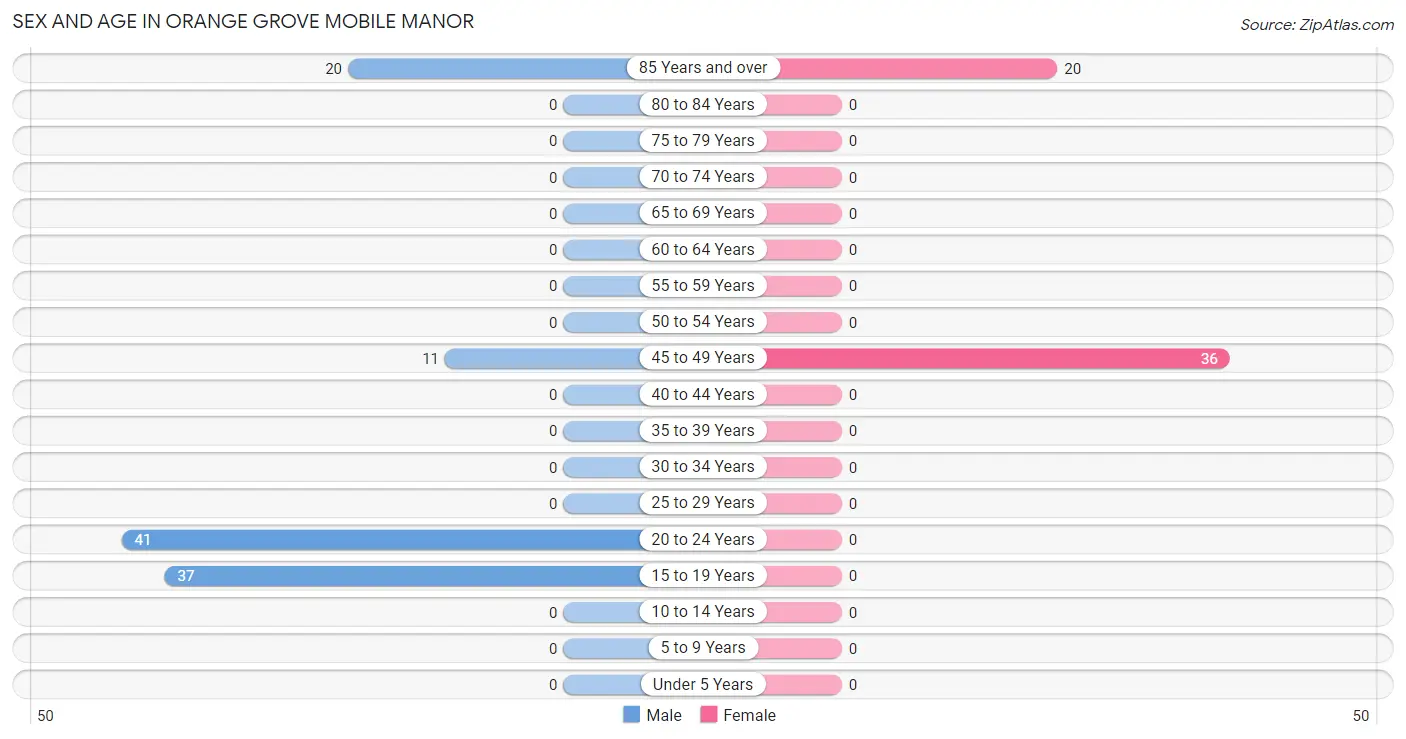
Sex and Age in Orange Grove Mobile Manor
Sex and Age in Orange Grove Mobile Manor
The most populous age groups in Orange Grove Mobile Manor are 20 to 24 Years (41 | 37.6%) for men and 45 to 49 Years (36 | 64.3%) for women.
| Age Bracket | Male | Female |
| Under 5 Years | 0 (0.0%) | 0 (0.0%) |
| 5 to 9 Years | 0 (0.0%) | 0 (0.0%) |
| 10 to 14 Years | 0 (0.0%) | 0 (0.0%) |
| 15 to 19 Years | 37 (33.9%) | 0 (0.0%) |
| 20 to 24 Years | 41 (37.6%) | 0 (0.0%) |
| 25 to 29 Years | 0 (0.0%) | 0 (0.0%) |
| 30 to 34 Years | 0 (0.0%) | 0 (0.0%) |
| 35 to 39 Years | 0 (0.0%) | 0 (0.0%) |
| 40 to 44 Years | 0 (0.0%) | 0 (0.0%) |
| 45 to 49 Years | 11 (10.1%) | 36 (64.3%) |
| 50 to 54 Years | 0 (0.0%) | 0 (0.0%) |
| 55 to 59 Years | 0 (0.0%) | 0 (0.0%) |
| 60 to 64 Years | 0 (0.0%) | 0 (0.0%) |
| 65 to 69 Years | 0 (0.0%) | 0 (0.0%) |
| 70 to 74 Years | 0 (0.0%) | 0 (0.0%) |
| 75 to 79 Years | 0 (0.0%) | 0 (0.0%) |
| 80 to 84 Years | 0 (0.0%) | 0 (0.0%) |
| 85 Years and over | 20 (18.3%) | 20 (35.7%) |
| Total | 109 (100.0%) | 56 (100.0%) |
Families and Households in Orange Grove Mobile Manor
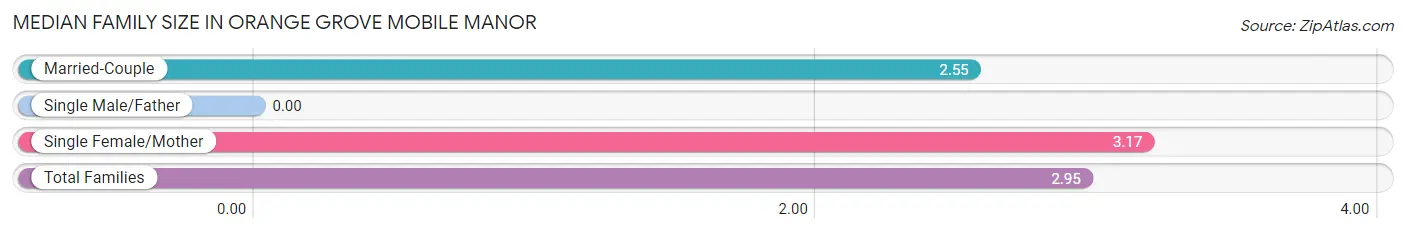
Median Family Size in Orange Grove Mobile Manor
| Family Type | # Families | Family Size |
| Married-Couple | 20 (35.7%) | 2.55 |
| Single Male/Father | 0 (0.0%) | - |
| Single Female/Mother | 36 (64.3%) | 3.17 |
| Total Families | 56 (100.0%) | 2.95 |
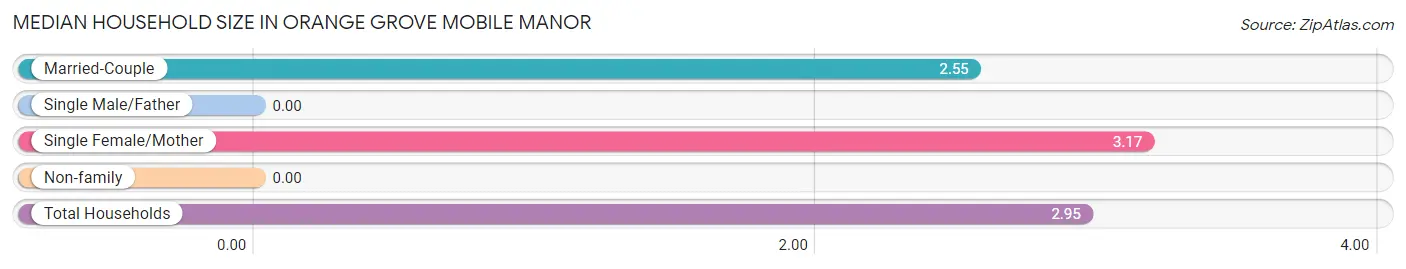
Median Household Size in Orange Grove Mobile Manor
| Household Type | # Households | Household Size |
| Married-Couple | 20 (35.7%) | 2.55 |
| Single Male/Father | 0 (0.0%) | - |
| Single Female/Mother | 36 (64.3%) | 3.17 |
| Non-family | 0 (0.0%) | - |
| Total Households | 56 (100.0%) | 2.95 |
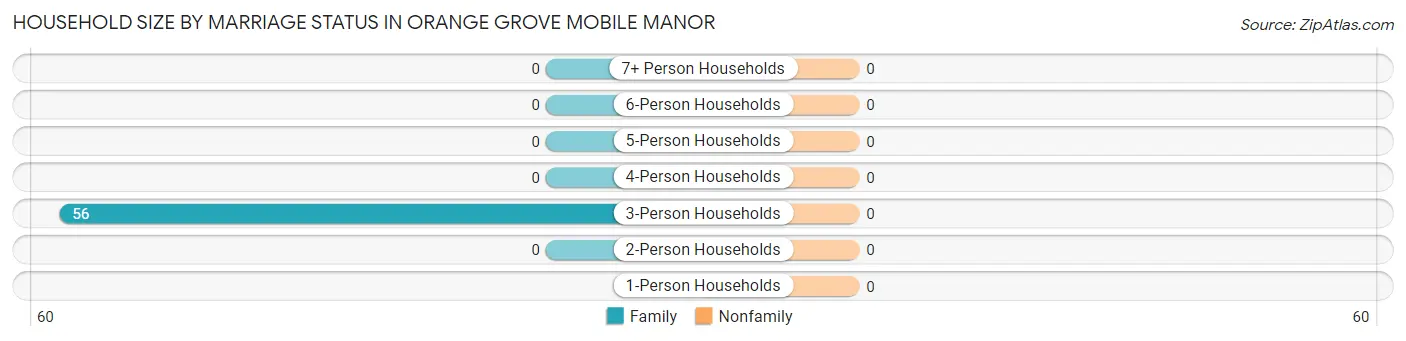
Household Size by Marriage Status in Orange Grove Mobile Manor
| Household Size | Family Households | Nonfamily Households |
| 1-Person Households | - | 0 (0.0%) |
| 2-Person Households | 0 (0.0%) | 0 (0.0%) |
| 3-Person Households | 56 (100.0%) | 0 (0.0%) |
| 4-Person Households | 0 (0.0%) | 0 (0.0%) |
| 5-Person Households | 0 (0.0%) | 0 (0.0%) |
| 6-Person Households | 0 (0.0%) | 0 (0.0%) |
| 7+ Person Households | 0 (0.0%) | 0 (0.0%) |
| Total | 56 (100.0%) | 0 (0.0%) |
Female Fertility in Orange Grove Mobile Manor
Fertility by Age in Orange Grove Mobile Manor
| Age Bracket | Women with Births | Births / 1,000 Women |
| 15 to 19 years | 0 (0.0%) | 0.0 |
| 20 to 34 years | 0 (0.0%) | 0.0 |
| 35 to 50 years | 0 (0.0%) | 0.0 |
| Total | 0 (0.0%) | 0.0 |
Fertility by Age by Marriage Status in Orange Grove Mobile Manor
| Age Bracket | Married | Unmarried |
| 15 to 19 years | 0 (0.0%) | 0 (0.0%) |
| 20 to 34 years | 0 (0.0%) | 0 (0.0%) |
| 35 to 50 years | 0 (0.0%) | 0 (0.0%) |
| Total | 0 (0.0%) | 0 (0.0%) |
Fertility by Education in Orange Grove Mobile Manor
| Educational Attainment | Women with Births | Births / 1,000 Women |
| Less than High School | 0 (0.0%) | 0.0 |
| High School Diploma | 0 (0.0%) | 0.0 |
| College or Associate's Degree | 0 (0.0%) | 0.0 |
| Bachelor's Degree | 0 (0.0%) | 0.0 |
| Graduate Degree | 0 (0.0%) | 0.0 |
| Total | 0 (0.0%) | 0.0 |
Fertility by Education by Marriage Status in Orange Grove Mobile Manor
| Educational Attainment | Married | Unmarried |
| Less than High School | 0 (0.0%) | 0 (0.0%) |
| High School Diploma | 0 (0.0%) | 0 (0.0%) |
| College or Associate's Degree | 0 (0.0%) | 0 (0.0%) |
| Bachelor's Degree | 0 (0.0%) | 0 (0.0%) |
| Graduate Degree | 0 (0.0%) | 0 (0.0%) |
| Total | 0 (0.0%) | 0 (0.0%) |
Employment Characteristics in Orange Grove Mobile Manor
Employment by Class of Employer in Orange Grove Mobile Manor
Among the 125 employed individuals in Orange Grove Mobile Manor, local government employees (114 | 91.2%), and private company employees (11 | 8.8%) make up the most common classes of employment.
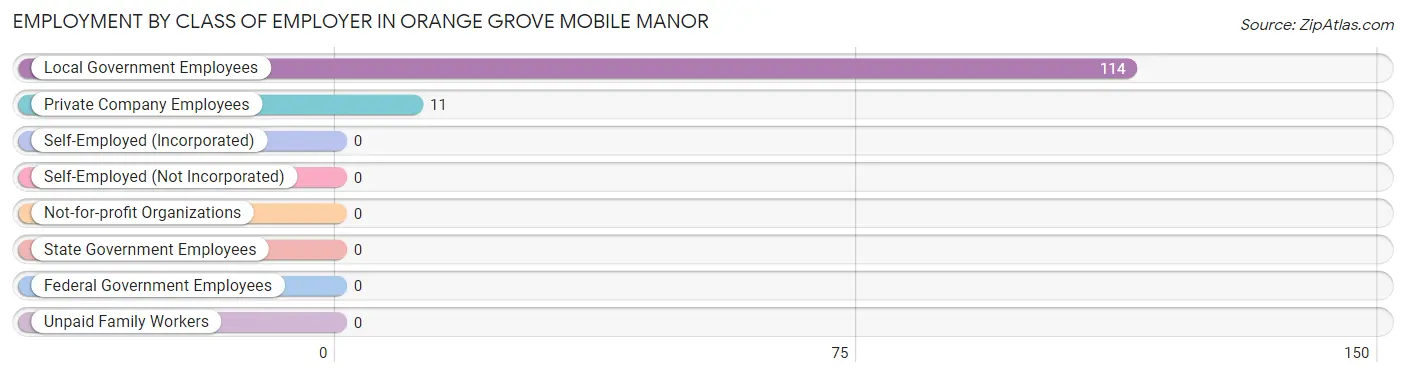
| Employer Class | # Employees | % Employees |
| Private Company Employees | 11 | 8.8% |
| Self-Employed (Incorporated) | 0 | 0.0% |
| Self-Employed (Not Incorporated) | 0 | 0.0% |
| Not-for-profit Organizations | 0 | 0.0% |
| Local Government Employees | 114 | 91.2% |
| State Government Employees | 0 | 0.0% |
| Federal Government Employees | 0 | 0.0% |
| Unpaid Family Workers | 0 | 0.0% |
| Total | 125 | 100.0% |
Employment Status by Age in Orange Grove Mobile Manor
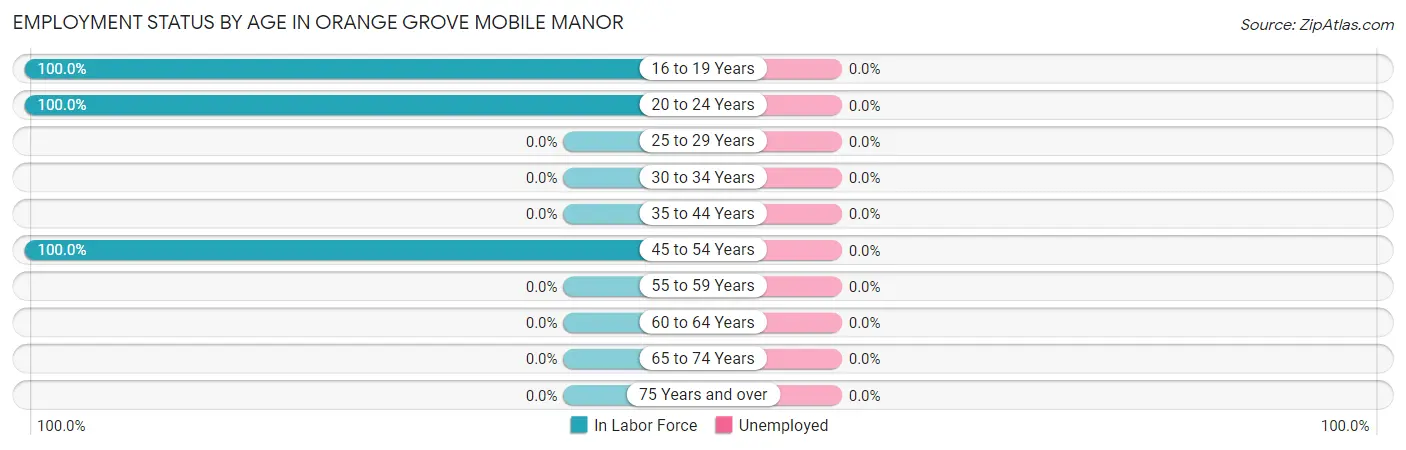
| Age Bracket | In Labor Force | Unemployed |
| 16 to 19 Years | 37 (100.0%) | 0 (0.0%) |
| 20 to 24 Years | 41 (100.0%) | 0 (0.0%) |
| 25 to 29 Years | 0 (0.0%) | 0 (0.0%) |
| 30 to 34 Years | 0 (0.0%) | 0 (0.0%) |
| 35 to 44 Years | 0 (0.0%) | 0 (0.0%) |
| 45 to 54 Years | 47 (100.0%) | 0 (0.0%) |
| 55 to 59 Years | 0 (0.0%) | 0 (0.0%) |
| 60 to 64 Years | 0 (0.0%) | 0 (0.0%) |
| 65 to 74 Years | 0 (0.0%) | 0 (0.0%) |
| 75 Years and over | 0 (0.0%) | 0 (0.0%) |
| Total | 125 (75.8%) | 0 (0.0%) |
Employment Status by Educational Attainment in Orange Grove Mobile Manor
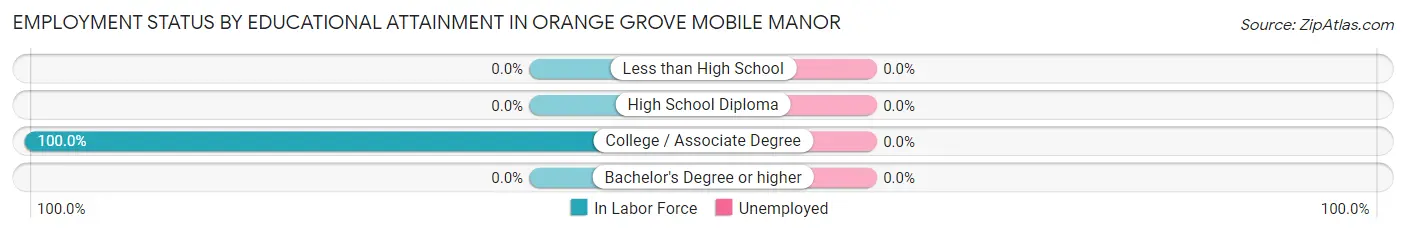
| Educational Attainment | In Labor Force | Unemployed |
| Less than High School | 0 (0.0%) | 0 (0.0%) |
| High School Diploma | 0 (0.0%) | 0 (0.0%) |
| College / Associate Degree | 47 (100.0%) | 0 (0.0%) |
| Bachelor's Degree or higher | 0 (0.0%) | 0 (0.0%) |
| Total | 47 (100.0%) | 0 (0.0%) |
Employment Occupations by Sex in Orange Grove Mobile Manor
Management, Business, Science and Arts Occupations
The most common Management, Business, Science and Arts occupations in Orange Grove Mobile Manor are , and Business & Financial (36 | 28.8%).
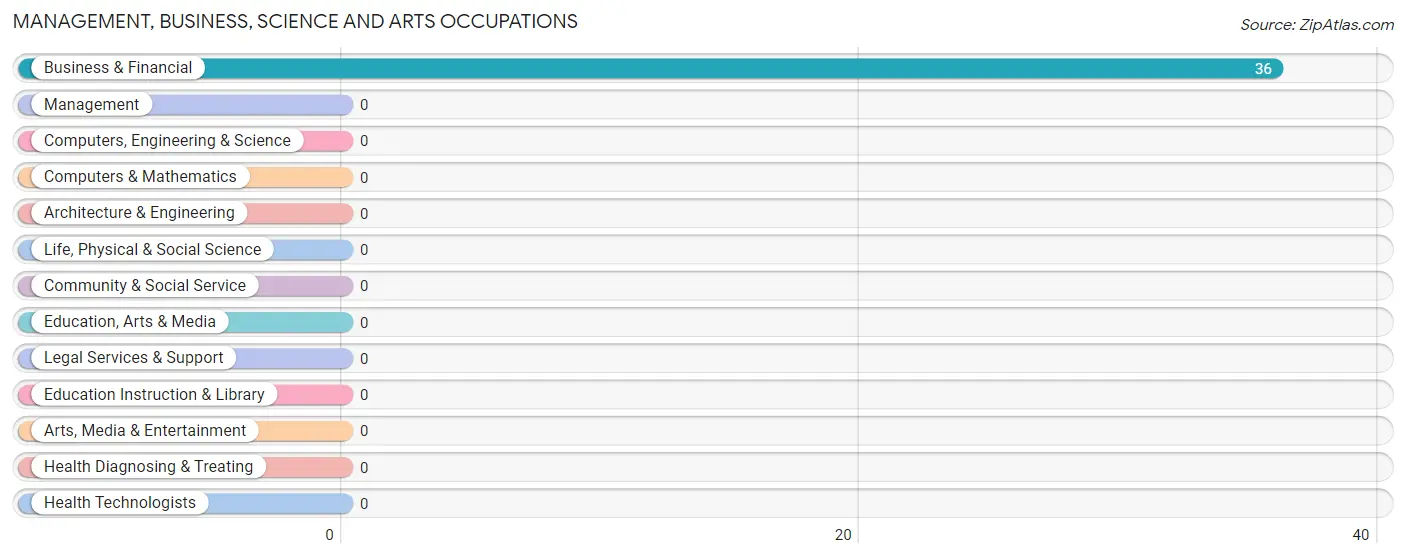
Management, Business, Science and Arts Occupations by Sex
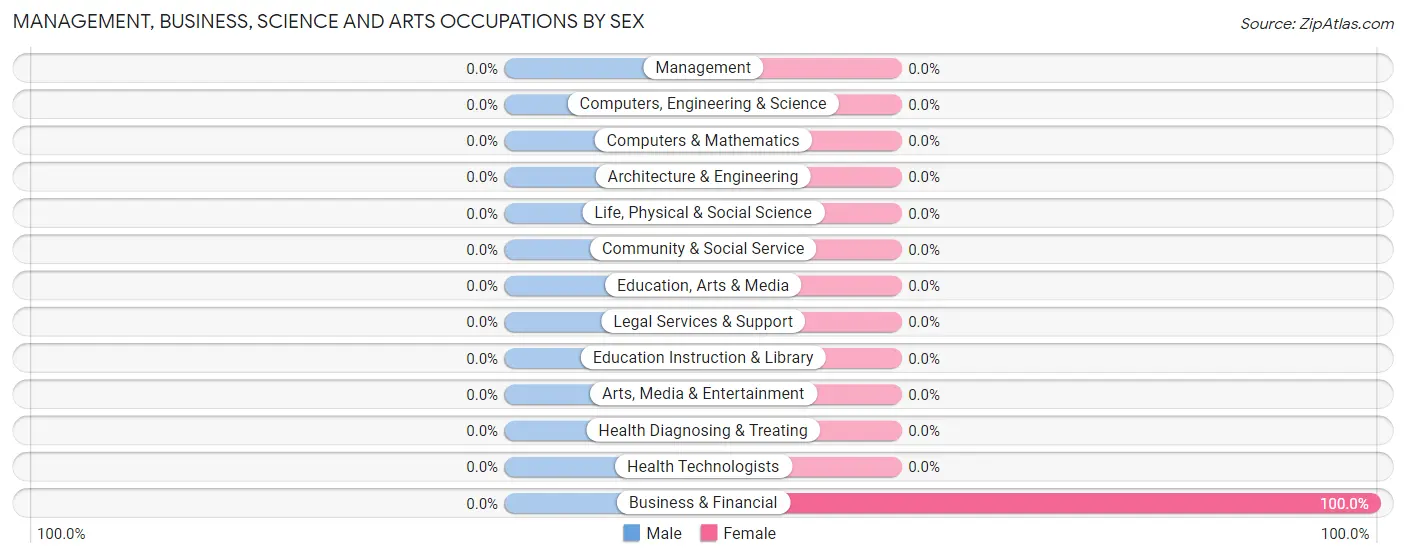
| Occupation | Male | Female |
| Management | 0 (0.0%) | 0 (0.0%) |
| Business & Financial | 0 (0.0%) | 36 (100.0%) |
| Computers, Engineering & Science | 0 (0.0%) | 0 (0.0%) |
| Computers & Mathematics | 0 (0.0%) | 0 (0.0%) |
| Architecture & Engineering | 0 (0.0%) | 0 (0.0%) |
| Life, Physical & Social Science | 0 (0.0%) | 0 (0.0%) |
| Community & Social Service | 0 (0.0%) | 0 (0.0%) |
| Education, Arts & Media | 0 (0.0%) | 0 (0.0%) |
| Legal Services & Support | 0 (0.0%) | 0 (0.0%) |
| Education Instruction & Library | 0 (0.0%) | 0 (0.0%) |
| Arts, Media & Entertainment | 0 (0.0%) | 0 (0.0%) |
| Health Diagnosing & Treating | 0 (0.0%) | 0 (0.0%) |
| Health Technologists | 0 (0.0%) | 0 (0.0%) |
| Total (Category) | 0 (0.0%) | 36 (100.0%) |
| Total (Overall) | 89 (71.2%) | 36 (28.8%) |
Services Occupations
The most common Services occupations in Orange Grove Mobile Manor are Security & Protection (41 | 32.8%), Firefighting & Prevention (41 | 32.8%), Personal Care & Service (37 | 29.6%), and Healthcare Support (11 | 8.8%).
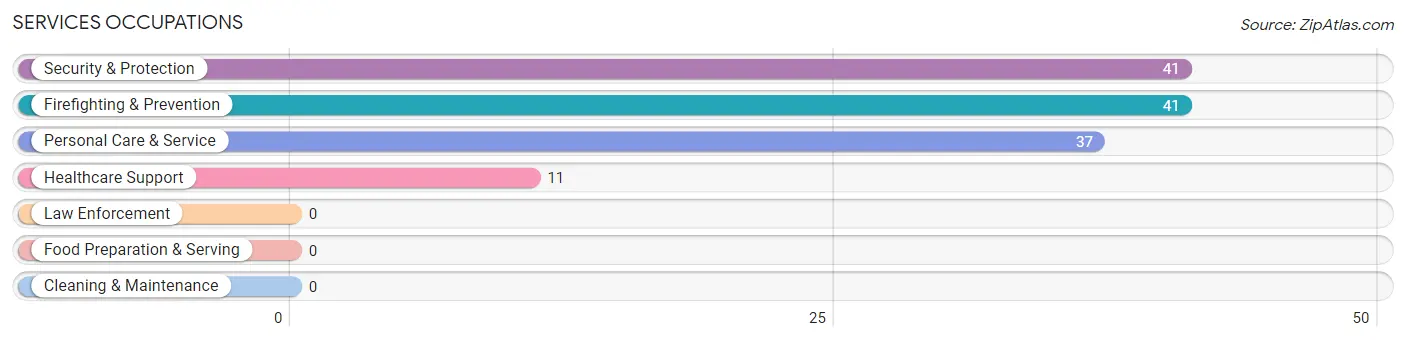
Services Occupations by Sex
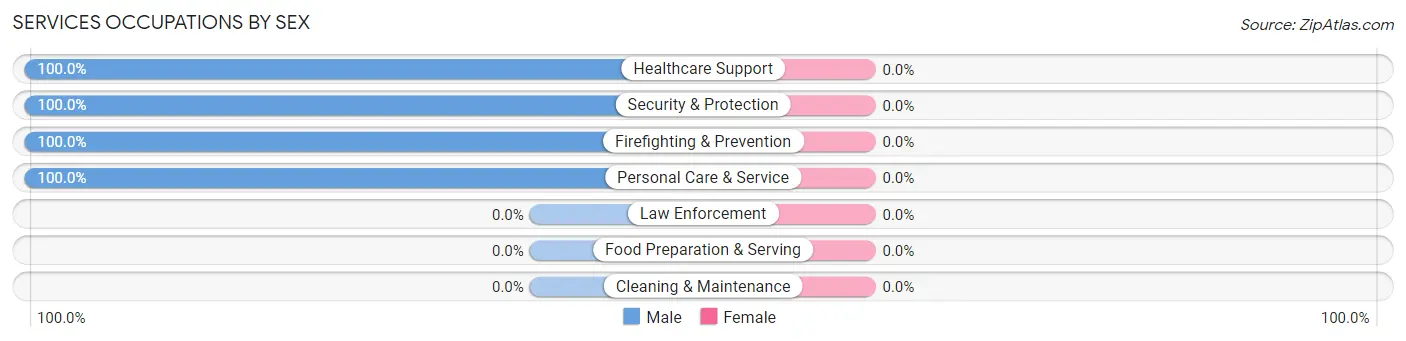
| Occupation | Male | Female |
| Healthcare Support | 11 (100.0%) | 0 (0.0%) |
| Security & Protection | 41 (100.0%) | 0 (0.0%) |
| Firefighting & Prevention | 41 (100.0%) | 0 (0.0%) |
| Law Enforcement | 0 (0.0%) | 0 (0.0%) |
| Food Preparation & Serving | 0 (0.0%) | 0 (0.0%) |
| Cleaning & Maintenance | 0 (0.0%) | 0 (0.0%) |
| Personal Care & Service | 37 (100.0%) | 0 (0.0%) |
| Total (Category) | 89 (100.0%) | 0 (0.0%) |
| Total (Overall) | 89 (71.2%) | 36 (28.8%) |
Sales and Office Occupations
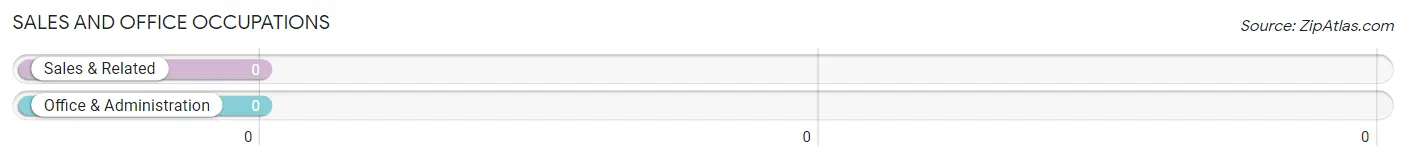
Sales and Office Occupations by Sex
| Occupation | Male | Female |
| Sales & Related | 0 (0.0%) | 0 (0.0%) |
| Office & Administration | 0 (0.0%) | 0 (0.0%) |
| Total (Category) | 0 (0.0%) | 0 (0.0%) |
| Total (Overall) | 89 (71.2%) | 36 (28.8%) |
Natural Resources, Construction and Maintenance Occupations
Natural Resources, Construction and Maintenance Occupations by Sex
| Occupation | Male | Female |
| Farming, Fishing & Forestry | 0 (0.0%) | 0 (0.0%) |
| Construction & Extraction | 0 (0.0%) | 0 (0.0%) |
| Installation, Maintenance & Repair | 0 (0.0%) | 0 (0.0%) |
| Total (Category) | 0 (0.0%) | 0 (0.0%) |
| Total (Overall) | 89 (71.2%) | 36 (28.8%) |
Production, Transportation and Moving Occupations
Production, Transportation and Moving Occupations by Sex
| Occupation | Male | Female |
| Production | 0 (0.0%) | 0 (0.0%) |
| Transportation | 0 (0.0%) | 0 (0.0%) |
| Material Moving | 0 (0.0%) | 0 (0.0%) |
| Total (Category) | 0 (0.0%) | 0 (0.0%) |
| Total (Overall) | 89 (71.2%) | 36 (28.8%) |
Employment Industries by Sex in Orange Grove Mobile Manor
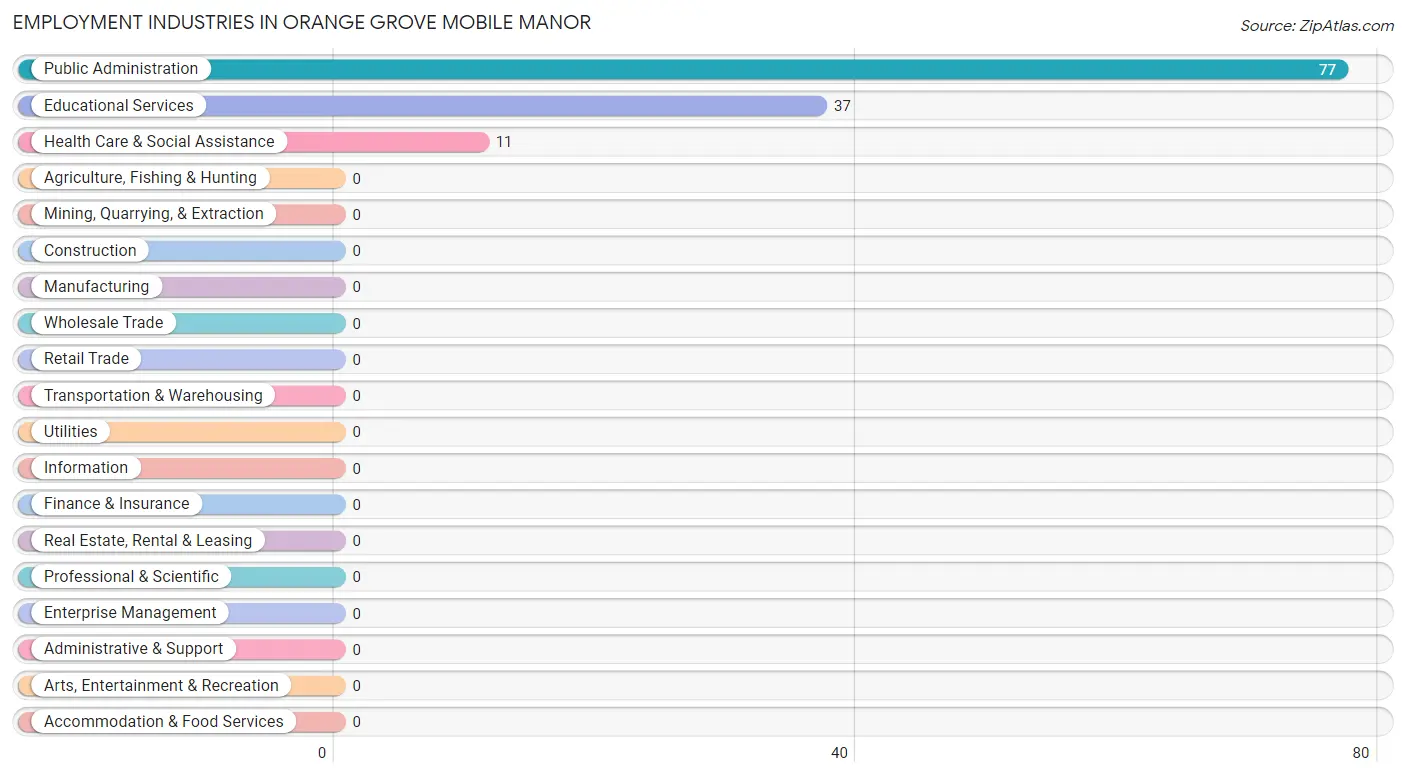
Employment Industries in Orange Grove Mobile Manor
The major employment industries in Orange Grove Mobile Manor include Public Administration (77 | 61.6%), Educational Services (37 | 29.6%), and Health Care & Social Assistance (11 | 8.8%).
Employment Industries by Sex in Orange Grove Mobile Manor
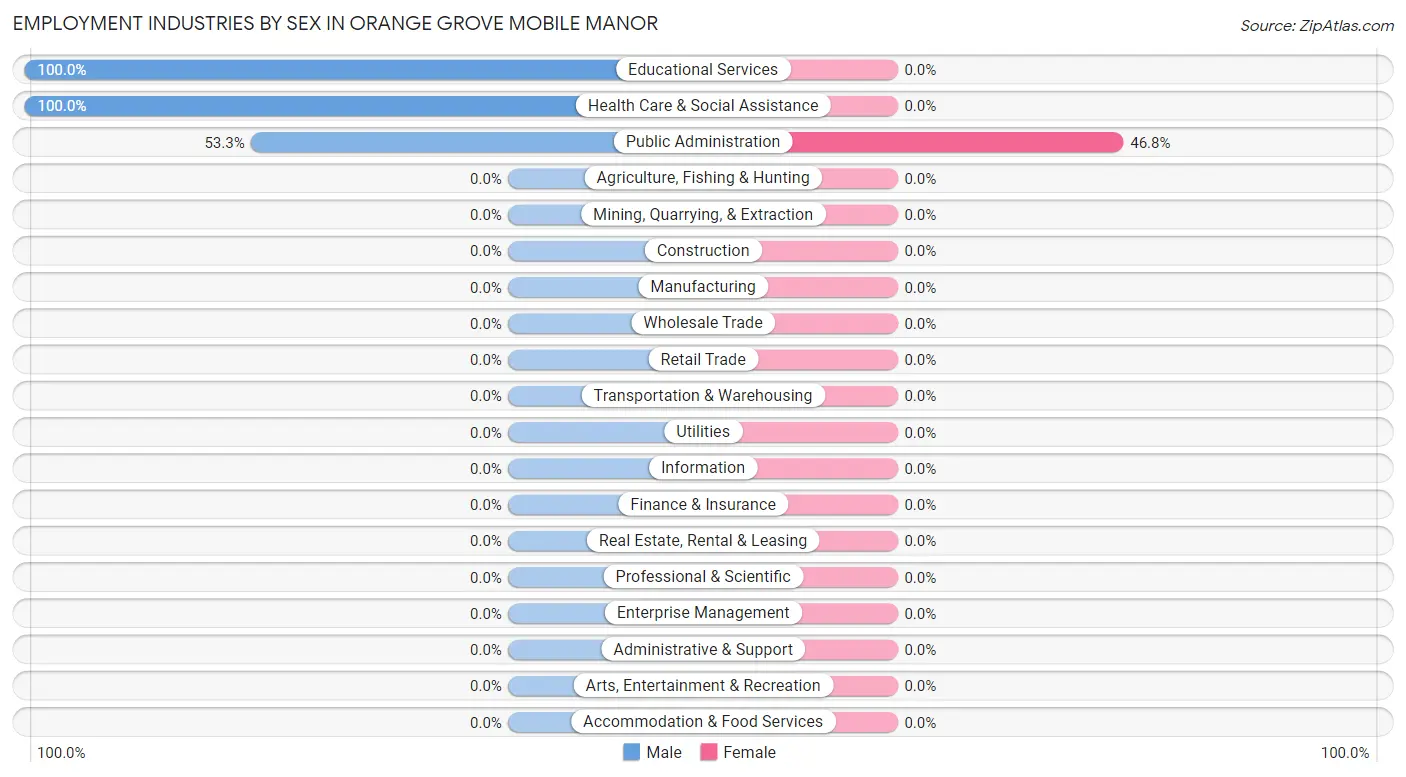
| Industry | Male | Female |
| Agriculture, Fishing & Hunting | 0 (0.0%) | 0 (0.0%) |
| Mining, Quarrying, & Extraction | 0 (0.0%) | 0 (0.0%) |
| Construction | 0 (0.0%) | 0 (0.0%) |
| Manufacturing | 0 (0.0%) | 0 (0.0%) |
| Wholesale Trade | 0 (0.0%) | 0 (0.0%) |
| Retail Trade | 0 (0.0%) | 0 (0.0%) |
| Transportation & Warehousing | 0 (0.0%) | 0 (0.0%) |
| Utilities | 0 (0.0%) | 0 (0.0%) |
| Information | 0 (0.0%) | 0 (0.0%) |
| Finance & Insurance | 0 (0.0%) | 0 (0.0%) |
| Real Estate, Rental & Leasing | 0 (0.0%) | 0 (0.0%) |
| Professional & Scientific | 0 (0.0%) | 0 (0.0%) |
| Enterprise Management | 0 (0.0%) | 0 (0.0%) |
| Administrative & Support | 0 (0.0%) | 0 (0.0%) |
| Educational Services | 37 (100.0%) | 0 (0.0%) |
| Health Care & Social Assistance | 11 (100.0%) | 0 (0.0%) |
| Arts, Entertainment & Recreation | 0 (0.0%) | 0 (0.0%) |
| Accommodation & Food Services | 0 (0.0%) | 0 (0.0%) |
| Public Administration | 41 (53.2%) | 36 (46.8%) |
| Total | 89 (71.2%) | 36 (28.8%) |
Education in Orange Grove Mobile Manor
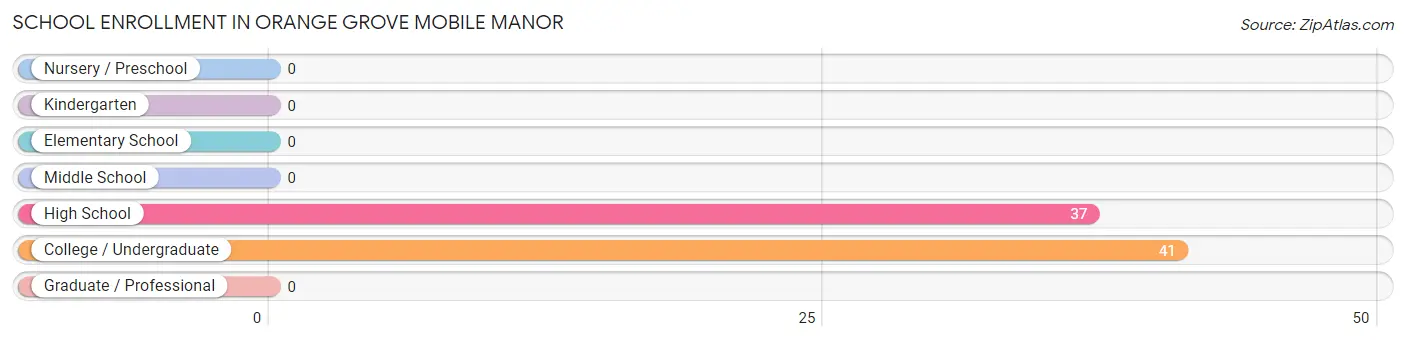
School Enrollment in Orange Grove Mobile Manor
The most common levels of schooling among the 78 students in Orange Grove Mobile Manor are college / undergraduate (41 | 52.6%), and high school (37 | 47.4%).
| School Level | # Students | % Students |
| Nursery / Preschool | 0 | 0.0% |
| Kindergarten | 0 | 0.0% |
| Elementary School | 0 | 0.0% |
| Middle School | 0 | 0.0% |
| High School | 37 | 47.4% |
| College / Undergraduate | 41 | 52.6% |
| Graduate / Professional | 0 | 0.0% |
| Total | 78 | 100.0% |
School Enrollment by Age by Funding Source in Orange Grove Mobile Manor
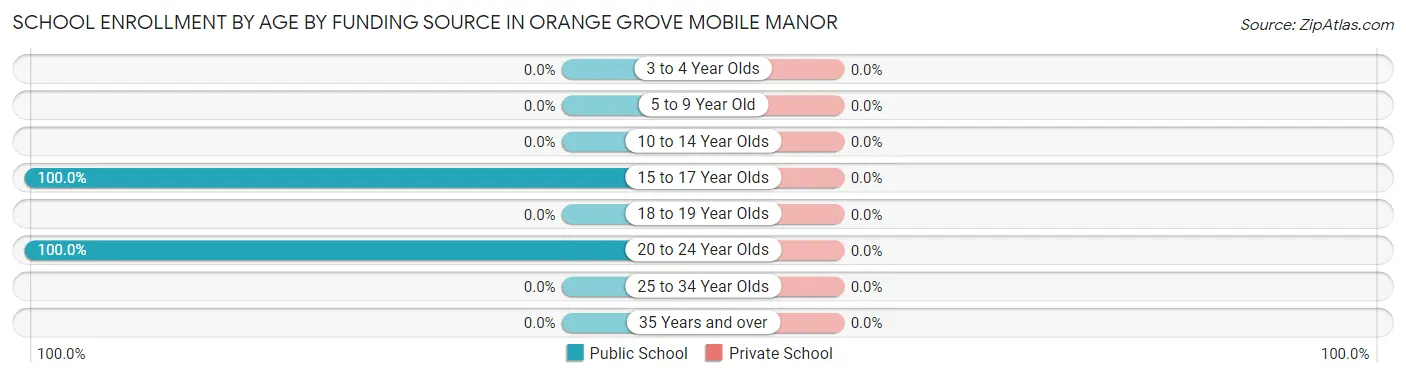
| Age Bracket | Public School | Private School |
| 3 to 4 Year Olds | 0 (0.0%) | 0 (0.0%) |
| 5 to 9 Year Old | 0 (0.0%) | 0 (0.0%) |
| 10 to 14 Year Olds | 0 (0.0%) | 0 (0.0%) |
| 15 to 17 Year Olds | 37 (100.0%) | 0 (0.0%) |
| 18 to 19 Year Olds | 0 (0.0%) | 0 (0.0%) |
| 20 to 24 Year Olds | 41 (100.0%) | 0 (0.0%) |
| 25 to 34 Year Olds | 0 (0.0%) | 0 (0.0%) |
| 35 Years and over | 0 (0.0%) | 0 (0.0%) |
| Total | 78 (100.0%) | 0 (0.0%) |
Educational Attainment by Field of Study in Orange Grove Mobile Manor
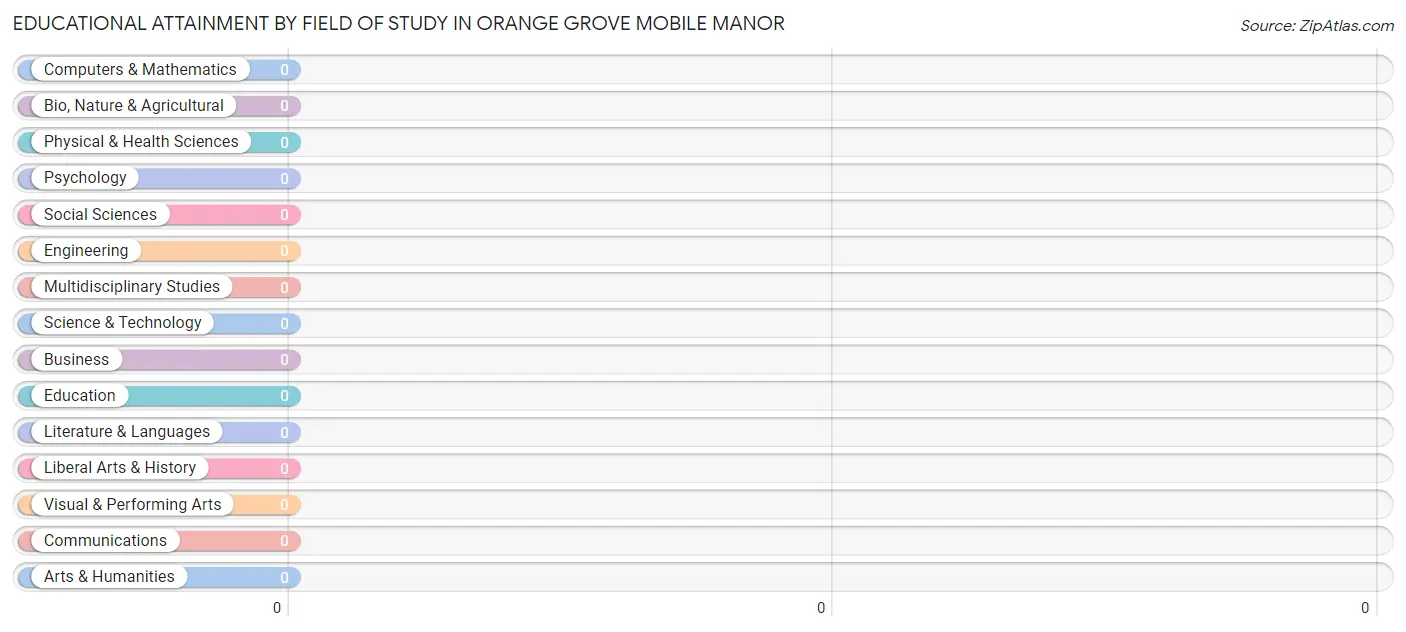
| Field of Study | # Graduates | % Graduates |
| Computers & Mathematics | 0 | 0.0% |
| Bio, Nature & Agricultural | 0 | 0.0% |
| Physical & Health Sciences | 0 | 0.0% |
| Psychology | 0 | 0.0% |
| Social Sciences | 0 | 0.0% |
| Engineering | 0 | 0.0% |
| Multidisciplinary Studies | 0 | 0.0% |
| Science & Technology | 0 | 0.0% |
| Business | 0 | 0.0% |
| Education | 0 | 0.0% |
| Literature & Languages | 0 | 0.0% |
| Liberal Arts & History | 0 | 0.0% |
| Visual & Performing Arts | 0 | 0.0% |
| Communications | 0 | 0.0% |
| Arts & Humanities | 0 | 0.0% |
| Total | 0 | 0.0% |
Transportation & Commute in Orange Grove Mobile Manor
Vehicle Availability by Sex in Orange Grove Mobile Manor
The most prevalent vehicle ownership categories in Orange Grove Mobile Manor are males with 3 vehicles (78, accounting for 87.6%) and females with 3 vehicles (36, making up 216.7%).
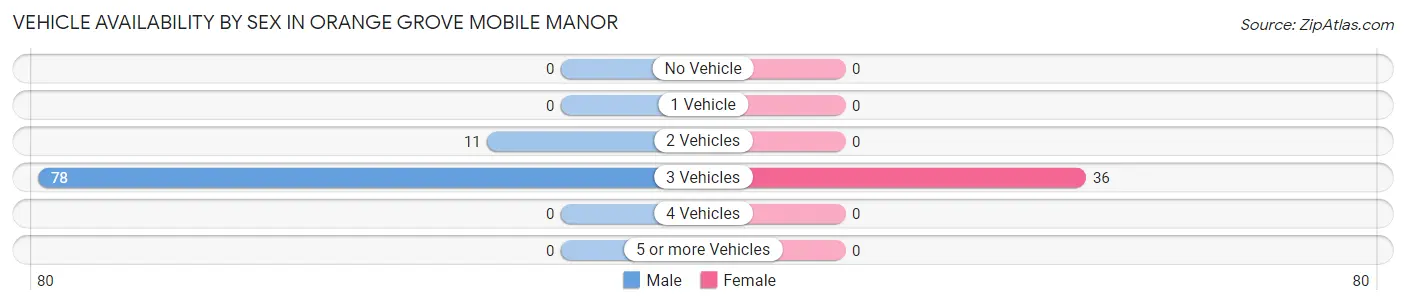
| Vehicles Available | Male | Female |
| No Vehicle | 0 (0.0%) | 0 (0.0%) |
| 1 Vehicle | 0 (0.0%) | 0 (0.0%) |
| 2 Vehicles | 11 (12.4%) | 0 (0.0%) |
| 3 Vehicles | 78 (87.6%) | 36 (100.0%) |
| 4 Vehicles | 0 (0.0%) | 0 (0.0%) |
| 5 or more Vehicles | 0 (0.0%) | 0 (0.0%) |
| Total | 89 (100.0%) | 36 (100.0%) |
Commute Time in Orange Grove Mobile Manor
The most frequently occuring commute durations in Orange Grove Mobile Manor are 10 to 14 minutes (41 commuters, 32.8%), less than 5 minutes (37 commuters, 29.6%), and 20 to 24 minutes (36 commuters, 28.8%).
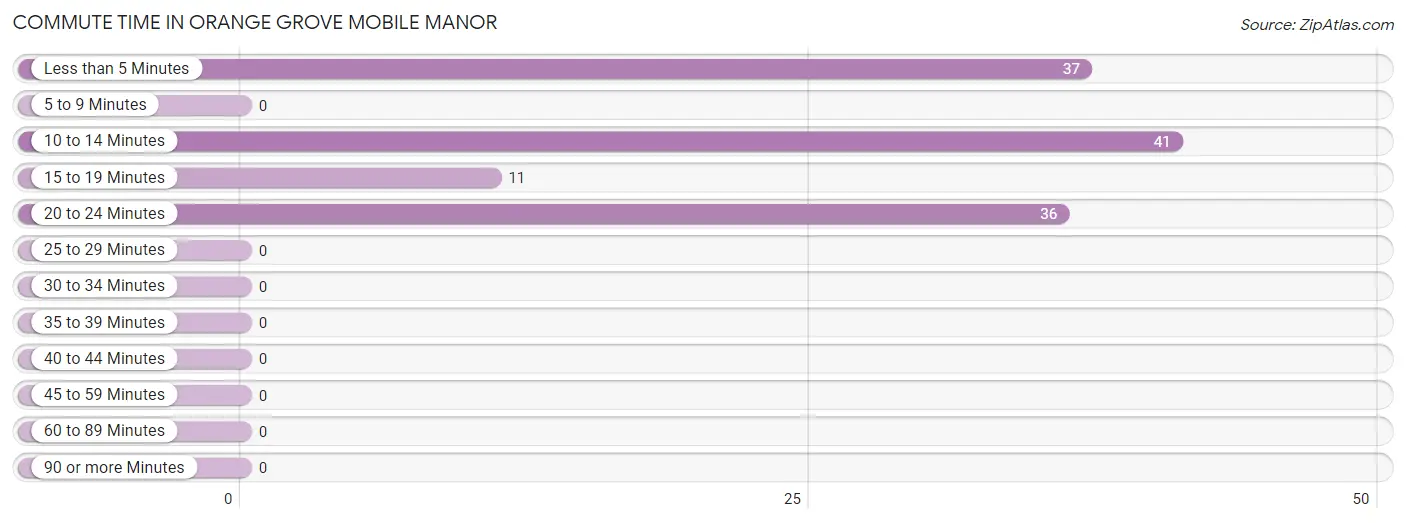
| Commute Time | # Commuters | % Commuters |
| Less than 5 Minutes | 37 | 29.6% |
| 5 to 9 Minutes | 0 | 0.0% |
| 10 to 14 Minutes | 41 | 32.8% |
| 15 to 19 Minutes | 11 | 8.8% |
| 20 to 24 Minutes | 36 | 28.8% |
| 25 to 29 Minutes | 0 | 0.0% |
| 30 to 34 Minutes | 0 | 0.0% |
| 35 to 39 Minutes | 0 | 0.0% |
| 40 to 44 Minutes | 0 | 0.0% |
| 45 to 59 Minutes | 0 | 0.0% |
| 60 to 89 Minutes | 0 | 0.0% |
| 90 or more Minutes | 0 | 0.0% |
Commute Time by Sex in Orange Grove Mobile Manor
The most common commute times in Orange Grove Mobile Manor are 10 to 14 minutes (41 commuters, 46.1%) for males and 20 to 24 minutes (36 commuters, 100.0%) for females.
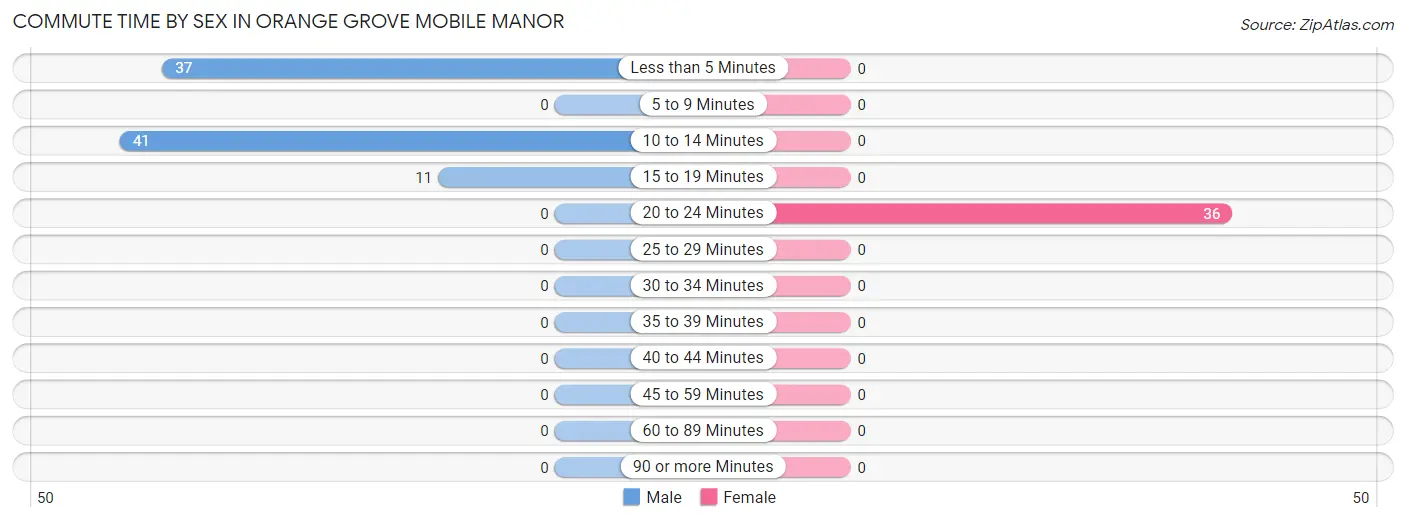
| Commute Time | Male | Female |
| Less than 5 Minutes | 37 (41.6%) | 0 (0.0%) |
| 5 to 9 Minutes | 0 (0.0%) | 0 (0.0%) |
| 10 to 14 Minutes | 41 (46.1%) | 0 (0.0%) |
| 15 to 19 Minutes | 11 (12.4%) | 0 (0.0%) |
| 20 to 24 Minutes | 0 (0.0%) | 36 (100.0%) |
| 25 to 29 Minutes | 0 (0.0%) | 0 (0.0%) |
| 30 to 34 Minutes | 0 (0.0%) | 0 (0.0%) |
| 35 to 39 Minutes | 0 (0.0%) | 0 (0.0%) |
| 40 to 44 Minutes | 0 (0.0%) | 0 (0.0%) |
| 45 to 59 Minutes | 0 (0.0%) | 0 (0.0%) |
| 60 to 89 Minutes | 0 (0.0%) | 0 (0.0%) |
| 90 or more Minutes | 0 (0.0%) | 0 (0.0%) |
Time of Departure to Work by Sex in Orange Grove Mobile Manor
The most frequent times of departure to work in Orange Grove Mobile Manor are 4:00 PM to 11:59 PM (41, 46.1%) for males and 4:00 PM to 11:59 PM (36, 100.0%) for females.
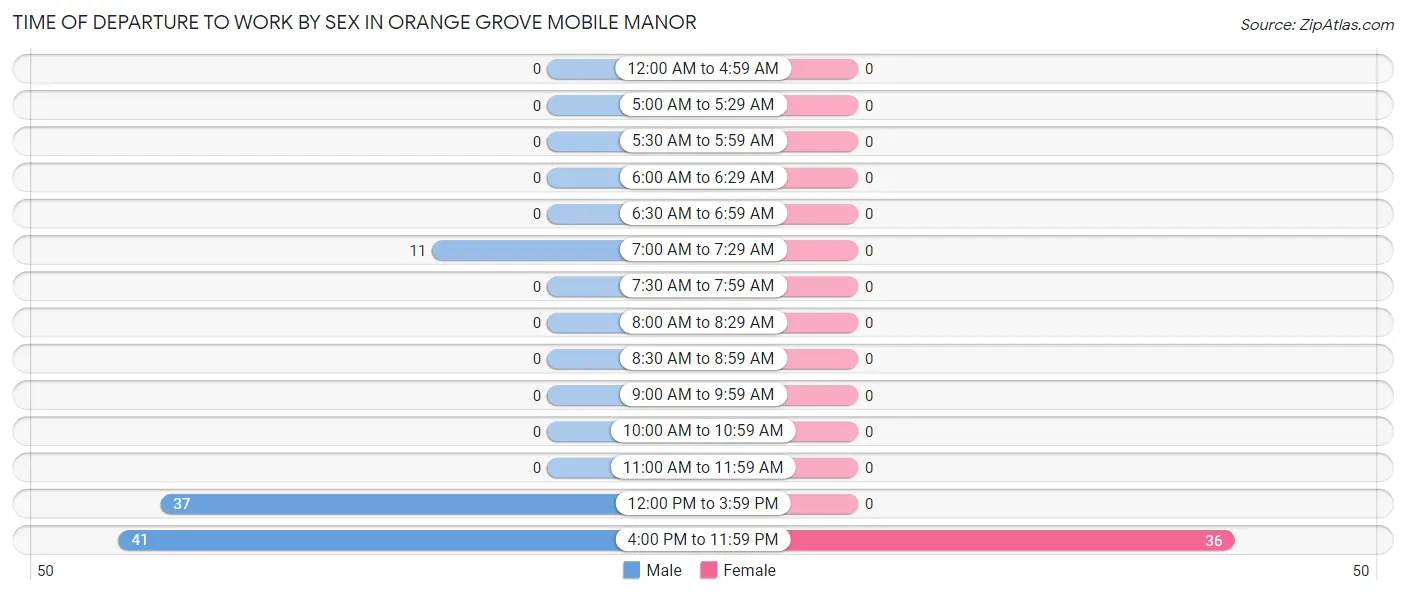
| Time of Departure | Male | Female |
| 12:00 AM to 4:59 AM | 0 (0.0%) | 0 (0.0%) |
| 5:00 AM to 5:29 AM | 0 (0.0%) | 0 (0.0%) |
| 5:30 AM to 5:59 AM | 0 (0.0%) | 0 (0.0%) |
| 6:00 AM to 6:29 AM | 0 (0.0%) | 0 (0.0%) |
| 6:30 AM to 6:59 AM | 0 (0.0%) | 0 (0.0%) |
| 7:00 AM to 7:29 AM | 11 (12.4%) | 0 (0.0%) |
| 7:30 AM to 7:59 AM | 0 (0.0%) | 0 (0.0%) |
| 8:00 AM to 8:29 AM | 0 (0.0%) | 0 (0.0%) |
| 8:30 AM to 8:59 AM | 0 (0.0%) | 0 (0.0%) |
| 9:00 AM to 9:59 AM | 0 (0.0%) | 0 (0.0%) |
| 10:00 AM to 10:59 AM | 0 (0.0%) | 0 (0.0%) |
| 11:00 AM to 11:59 AM | 0 (0.0%) | 0 (0.0%) |
| 12:00 PM to 3:59 PM | 37 (41.6%) | 0 (0.0%) |
| 4:00 PM to 11:59 PM | 41 (46.1%) | 36 (100.0%) |
| Total | 89 (100.0%) | 36 (100.0%) |
Housing Occupancy in Orange Grove Mobile Manor
Occupancy by Ownership in Orange Grove Mobile Manor
Of the total 56 dwellings in Orange Grove Mobile Manor, owner-occupied units account for 56 (100.0%), while renter-occupied units make up 0 (0.0%).
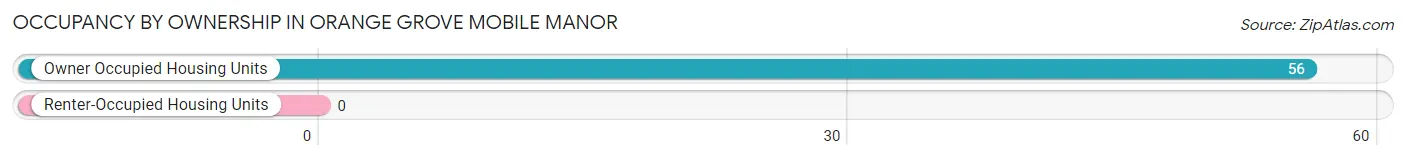
| Occupancy | # Housing Units | % Housing Units |
| Owner Occupied Housing Units | 56 | 100.0% |
| Renter-Occupied Housing Units | 0 | 0.0% |
| Total Occupied Housing Units | 56 | 100.0% |
Occupancy by Household Size in Orange Grove Mobile Manor
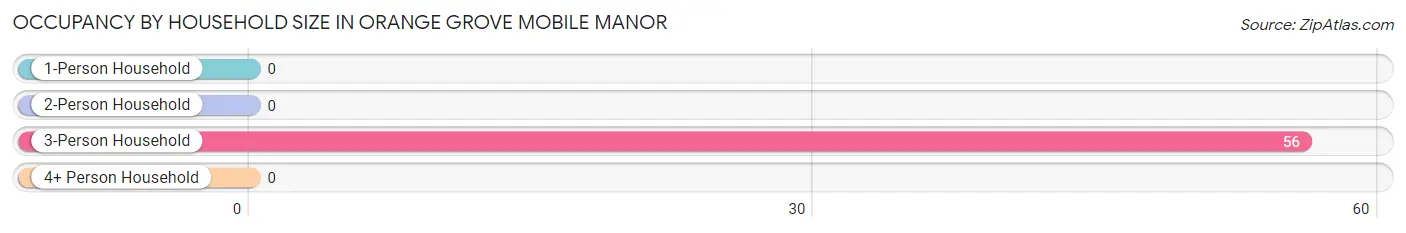
| Household Size | # Housing Units | % Housing Units |
| 1-Person Household | 0 | 0.0% |
| 2-Person Household | 0 | 0.0% |
| 3-Person Household | 56 | 100.0% |
| 4+ Person Household | 0 | 0.0% |
| Total Housing Units | 56 | 100.0% |
Occupancy by Ownership by Household Size in Orange Grove Mobile Manor
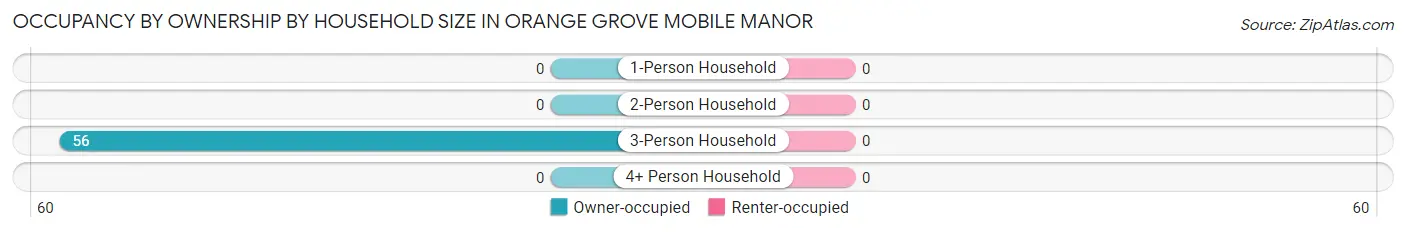
| Household Size | Owner-occupied | Renter-occupied |
| 1-Person Household | 0 (0.0%) | 0 (0.0%) |
| 2-Person Household | 0 (0.0%) | 0 (0.0%) |
| 3-Person Household | 56 (100.0%) | 0 (0.0%) |
| 4+ Person Household | 0 (0.0%) | 0 (0.0%) |
| Total Housing Units | 56 (100.0%) | 0 (0.0%) |
Occupancy by Educational Attainment in Orange Grove Mobile Manor
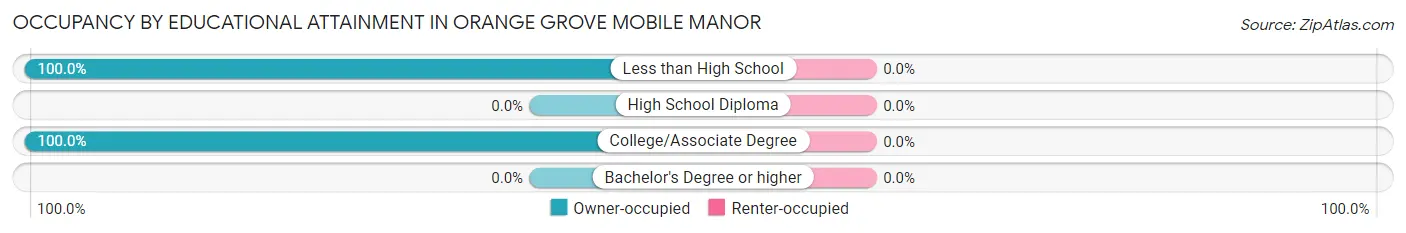
| Household Size | Owner-occupied | Renter-occupied |
| Less than High School | 20 (100.0%) | 0 (0.0%) |
| High School Diploma | 0 (0.0%) | 0 (0.0%) |
| College/Associate Degree | 36 (100.0%) | 0 (0.0%) |
| Bachelor's Degree or higher | 0 (0.0%) | 0 (0.0%) |
Occupancy by Age of Householder in Orange Grove Mobile Manor
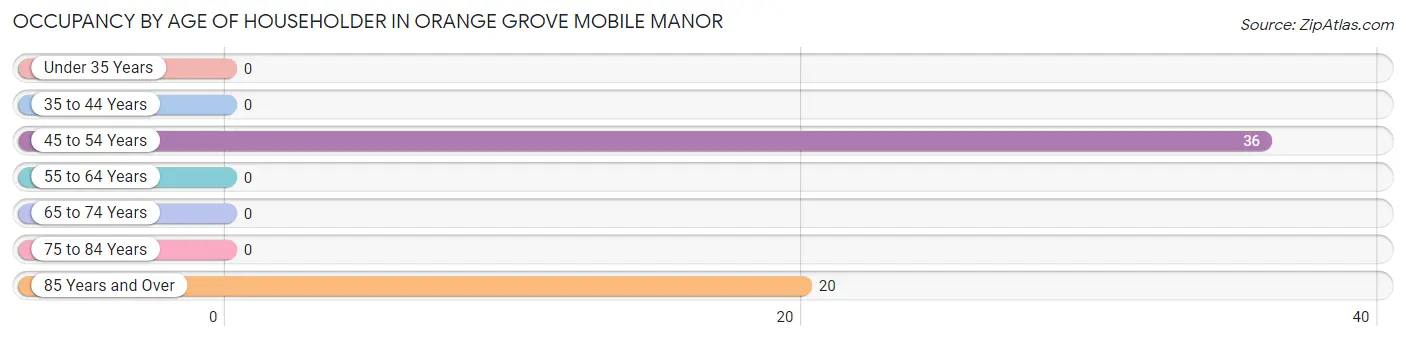
| Age Bracket | # Households | % Households |
| Under 35 Years | 0 | 0.0% |
| 35 to 44 Years | 0 | 0.0% |
| 45 to 54 Years | 36 | 64.3% |
| 55 to 64 Years | 0 | 0.0% |
| 65 to 74 Years | 0 | 0.0% |
| 75 to 84 Years | 0 | 0.0% |
| 85 Years and Over | 20 | 35.7% |
| Total | 56 | 100.0% |
Housing Finances in Orange Grove Mobile Manor
Median Income by Occupancy in Orange Grove Mobile Manor
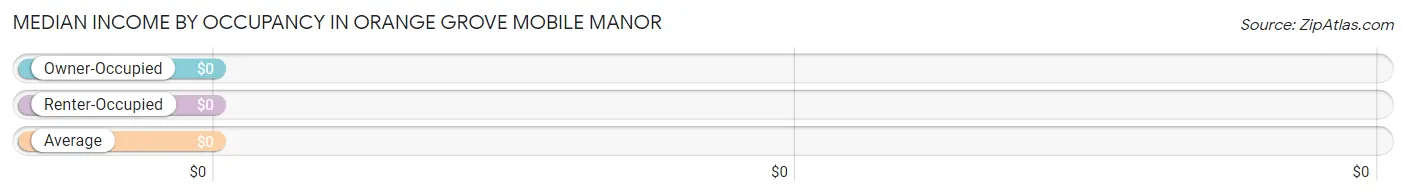
| Occupancy Type | # Households | Median Income |
| Owner-Occupied | 56 (100.0%) | $0 |
| Renter-Occupied | 0 (0.0%) | $0 |
| Average | 56 (100.0%) | $0 |
Occupancy by Householder Income Bracket in Orange Grove Mobile Manor
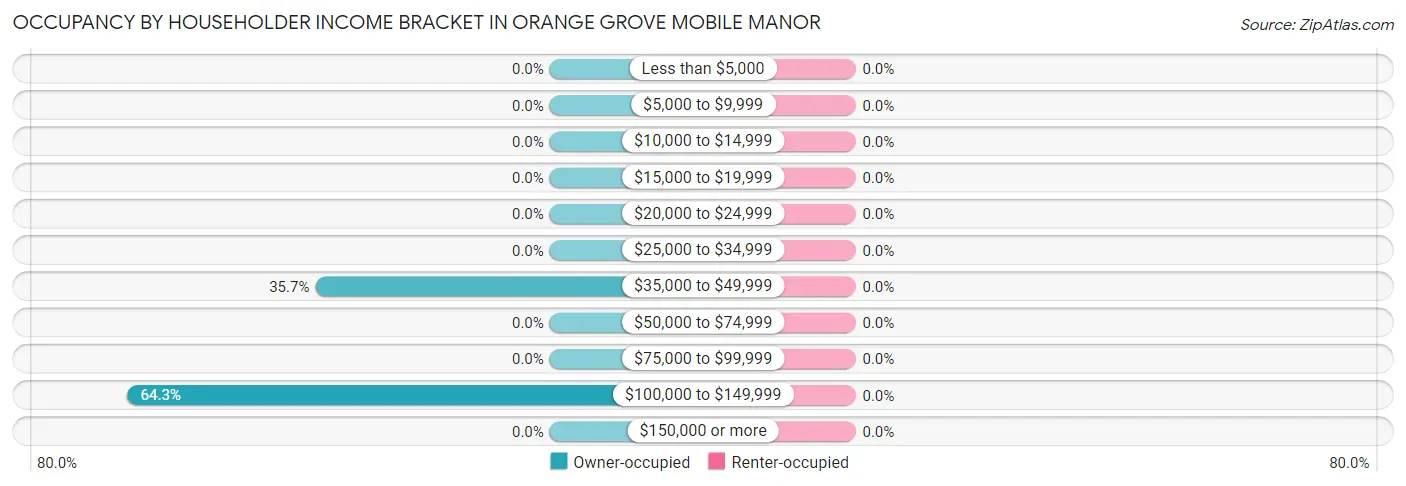
| Income Bracket | Owner-occupied | Renter-occupied |
| Less than $5,000 | 0 (0.0%) | 0 (0.0%) |
| $5,000 to $9,999 | 0 (0.0%) | 0 (0.0%) |
| $10,000 to $14,999 | 0 (0.0%) | 0 (0.0%) |
| $15,000 to $19,999 | 0 (0.0%) | 0 (0.0%) |
| $20,000 to $24,999 | 0 (0.0%) | 0 (0.0%) |
| $25,000 to $34,999 | 0 (0.0%) | 0 (0.0%) |
| $35,000 to $49,999 | 20 (35.7%) | 0 (0.0%) |
| $50,000 to $74,999 | 0 (0.0%) | 0 (0.0%) |
| $75,000 to $99,999 | 0 (0.0%) | 0 (0.0%) |
| $100,000 to $149,999 | 36 (64.3%) | 0 (0.0%) |
| $150,000 or more | 0 (0.0%) | 0 (0.0%) |
| Total | 56 (100.0%) | 0 (0.0%) |
Monthly Housing Cost Tiers in Orange Grove Mobile Manor
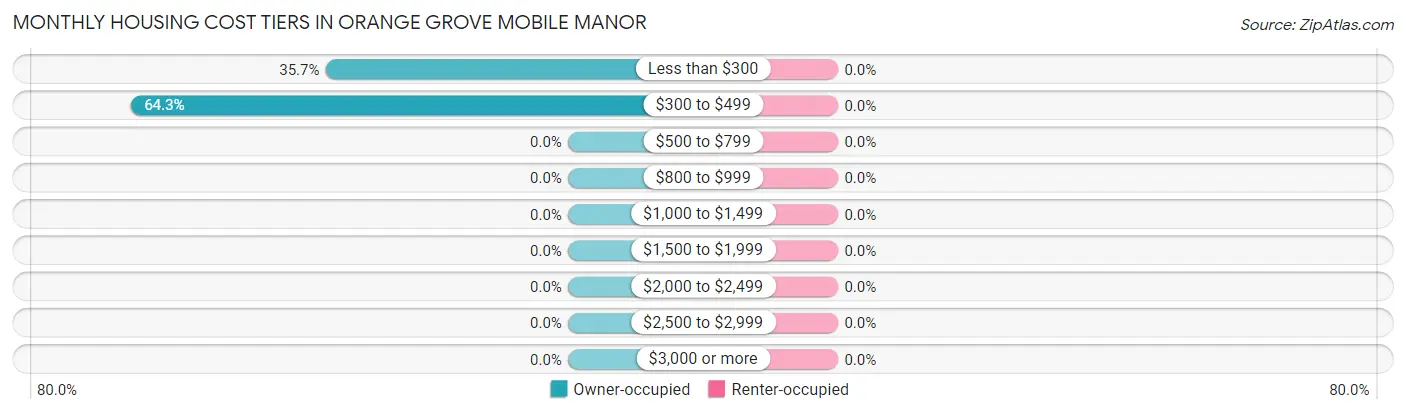
| Monthly Cost | Owner-occupied | Renter-occupied |
| Less than $300 | 20 (35.7%) | 0 (0.0%) |
| $300 to $499 | 36 (64.3%) | 0 (0.0%) |
| $500 to $799 | 0 (0.0%) | 0 (0.0%) |
| $800 to $999 | 0 (0.0%) | 0 (0.0%) |
| $1,000 to $1,499 | 0 (0.0%) | 0 (0.0%) |
| $1,500 to $1,999 | 0 (0.0%) | 0 (0.0%) |
| $2,000 to $2,499 | 0 (0.0%) | 0 (0.0%) |
| $2,500 to $2,999 | 0 (0.0%) | 0 (0.0%) |
| $3,000 or more | 0 (0.0%) | 0 (0.0%) |
| Total | 56 (100.0%) | 0 (0.0%) |
Physical Housing Characteristics in Orange Grove Mobile Manor
Housing Structures in Orange Grove Mobile Manor
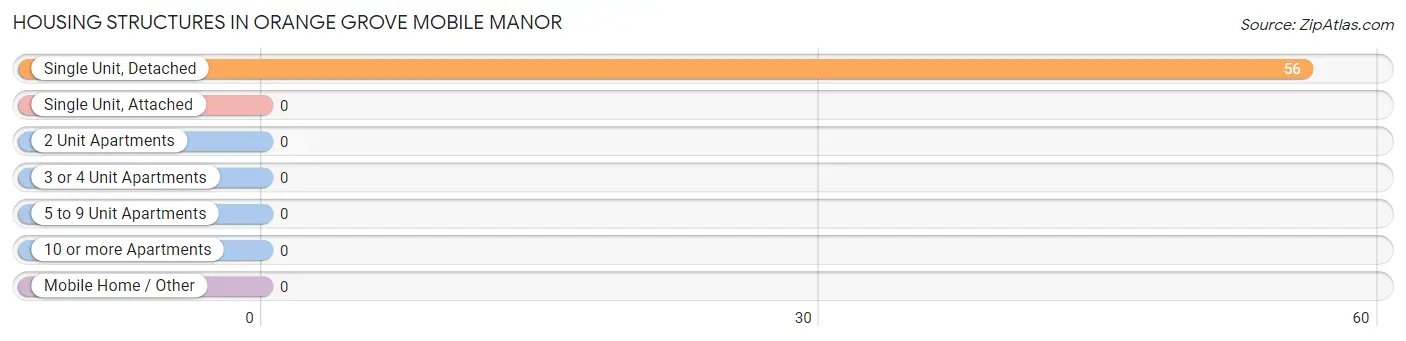
| Structure Type | # Housing Units | % Housing Units |
| Single Unit, Detached | 56 | 100.0% |
| Single Unit, Attached | 0 | 0.0% |
| 2 Unit Apartments | 0 | 0.0% |
| 3 or 4 Unit Apartments | 0 | 0.0% |
| 5 to 9 Unit Apartments | 0 | 0.0% |
| 10 or more Apartments | 0 | 0.0% |
| Mobile Home / Other | 0 | 0.0% |
| Total | 56 | 100.0% |
Housing Structures by Occupancy in Orange Grove Mobile Manor
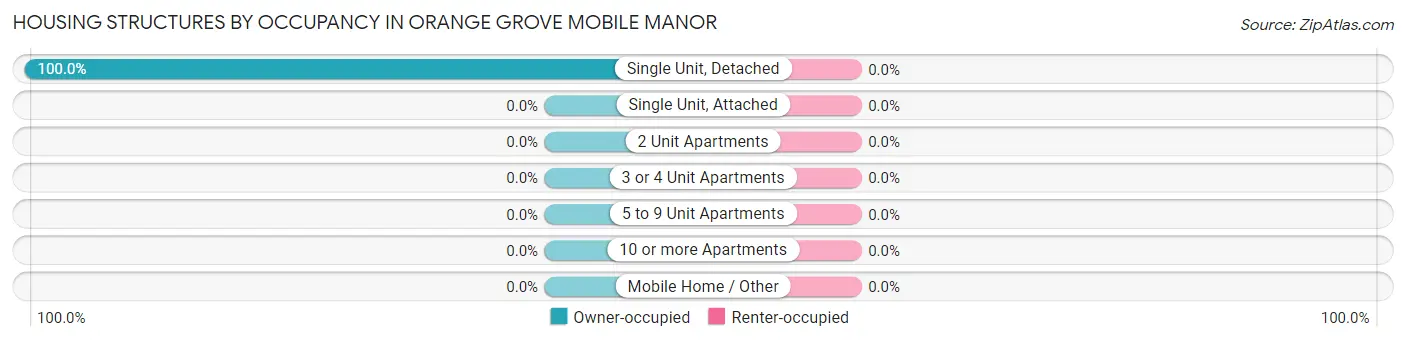
| Structure Type | Owner-occupied | Renter-occupied |
| Single Unit, Detached | 56 (100.0%) | 0 (0.0%) |
| Single Unit, Attached | 0 (0.0%) | 0 (0.0%) |
| 2 Unit Apartments | 0 (0.0%) | 0 (0.0%) |
| 3 or 4 Unit Apartments | 0 (0.0%) | 0 (0.0%) |
| 5 to 9 Unit Apartments | 0 (0.0%) | 0 (0.0%) |
| 10 or more Apartments | 0 (0.0%) | 0 (0.0%) |
| Mobile Home / Other | 0 (0.0%) | 0 (0.0%) |
| Total | 56 (100.0%) | 0 (0.0%) |
Housing Structures by Number of Rooms in Orange Grove Mobile Manor
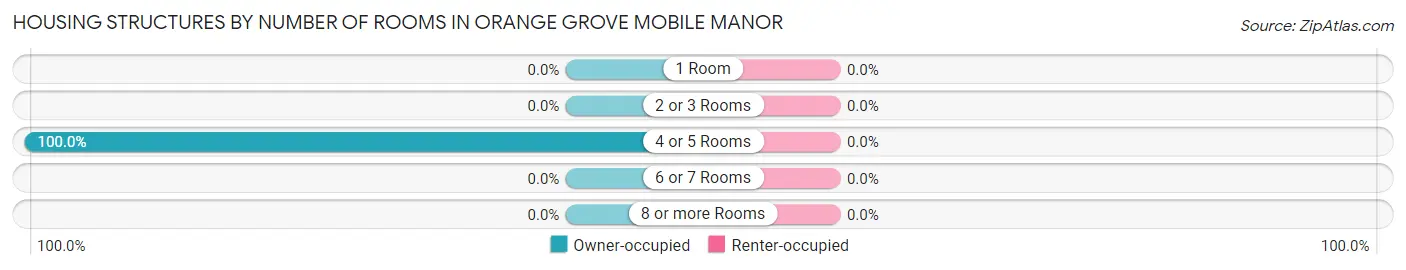
| Number of Rooms | Owner-occupied | Renter-occupied |
| 1 Room | 0 (0.0%) | 0 (0.0%) |
| 2 or 3 Rooms | 0 (0.0%) | 0 (0.0%) |
| 4 or 5 Rooms | 56 (100.0%) | 0 (0.0%) |
| 6 or 7 Rooms | 0 (0.0%) | 0 (0.0%) |
| 8 or more Rooms | 0 (0.0%) | 0 (0.0%) |
| Total | 56 (100.0%) | 0 (0.0%) |
Housing Structure by Heating Type in Orange Grove Mobile Manor
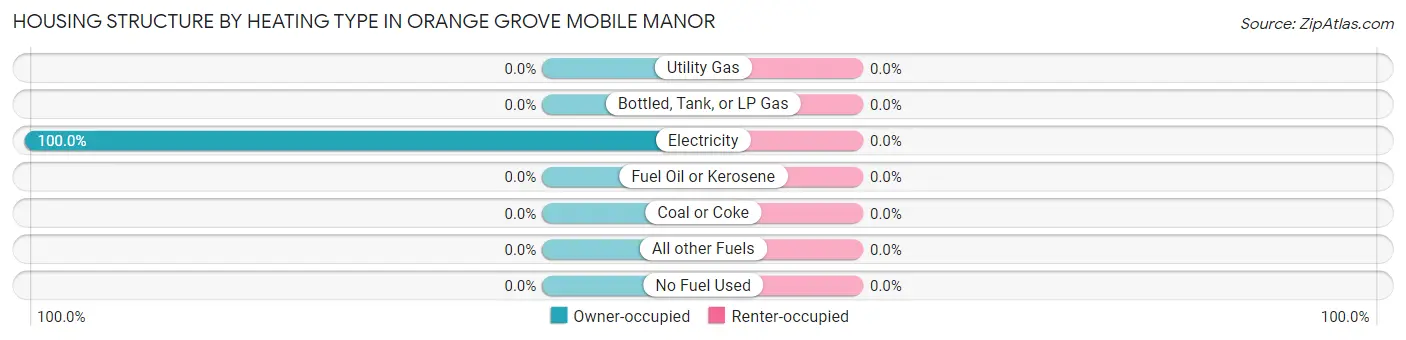
| Heating Type | Owner-occupied | Renter-occupied |
| Utility Gas | 0 (0.0%) | 0 (0.0%) |
| Bottled, Tank, or LP Gas | 0 (0.0%) | 0 (0.0%) |
| Electricity | 56 (100.0%) | 0 (0.0%) |
| Fuel Oil or Kerosene | 0 (0.0%) | 0 (0.0%) |
| Coal or Coke | 0 (0.0%) | 0 (0.0%) |
| All other Fuels | 0 (0.0%) | 0 (0.0%) |
| No Fuel Used | 0 (0.0%) | 0 (0.0%) |
| Total | 56 (100.0%) | 0 (0.0%) |
Household Vehicle Usage in Orange Grove Mobile Manor
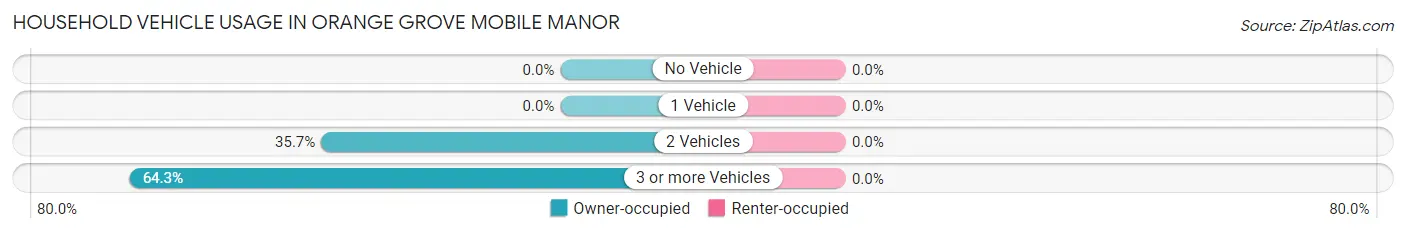
| Vehicles per Household | Owner-occupied | Renter-occupied |
| No Vehicle | 0 (0.0%) | 0 (0.0%) |
| 1 Vehicle | 0 (0.0%) | 0 (0.0%) |
| 2 Vehicles | 20 (35.7%) | 0 (0.0%) |
| 3 or more Vehicles | 36 (64.3%) | 0 (0.0%) |
| Total | 56 (100.0%) | 0 (0.0%) |
Real Estate & Mortgages in Orange Grove Mobile Manor
Real Estate and Mortgage Overview in Orange Grove Mobile Manor
| Characteristic | Without Mortgage | With Mortgage |
| Housing Units | 56 | 0 |
| Median Property Value | - | - |
| Median Household Income | - | - |
| Monthly Housing Costs | - | - |
| Real Estate Taxes | - | - |
Property Value by Mortgage Status in Orange Grove Mobile Manor
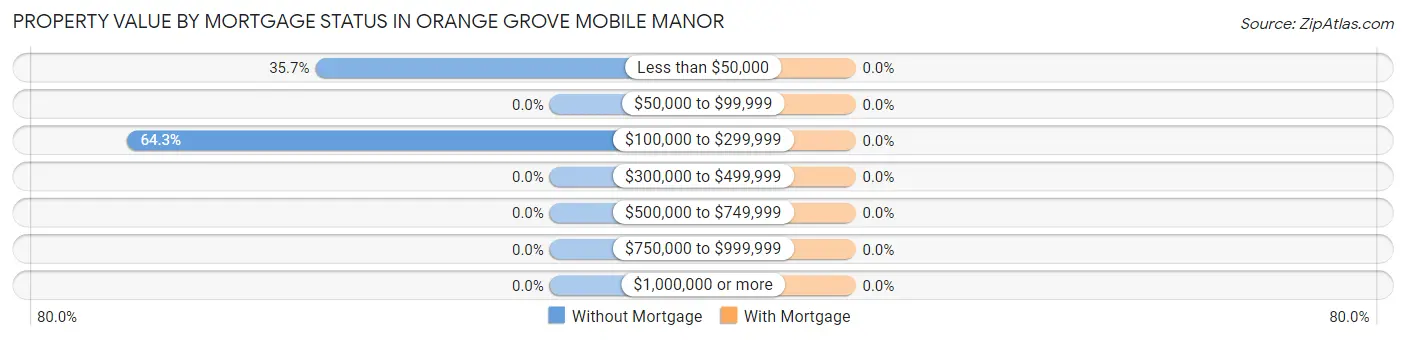
| Property Value | Without Mortgage | With Mortgage |
| Less than $50,000 | 20 (35.7%) | 0 (0.0%) |
| $50,000 to $99,999 | 0 (0.0%) | 0 (0.0%) |
| $100,000 to $299,999 | 36 (64.3%) | 0 (0.0%) |
| $300,000 to $499,999 | 0 (0.0%) | 0 (0.0%) |
| $500,000 to $749,999 | 0 (0.0%) | 0 (0.0%) |
| $750,000 to $999,999 | 0 (0.0%) | 0 (0.0%) |
| $1,000,000 or more | 0 (0.0%) | 0 (0.0%) |
| Total | 56 (100.0%) | 0 (0.0%) |
Household Income by Mortgage Status in Orange Grove Mobile Manor
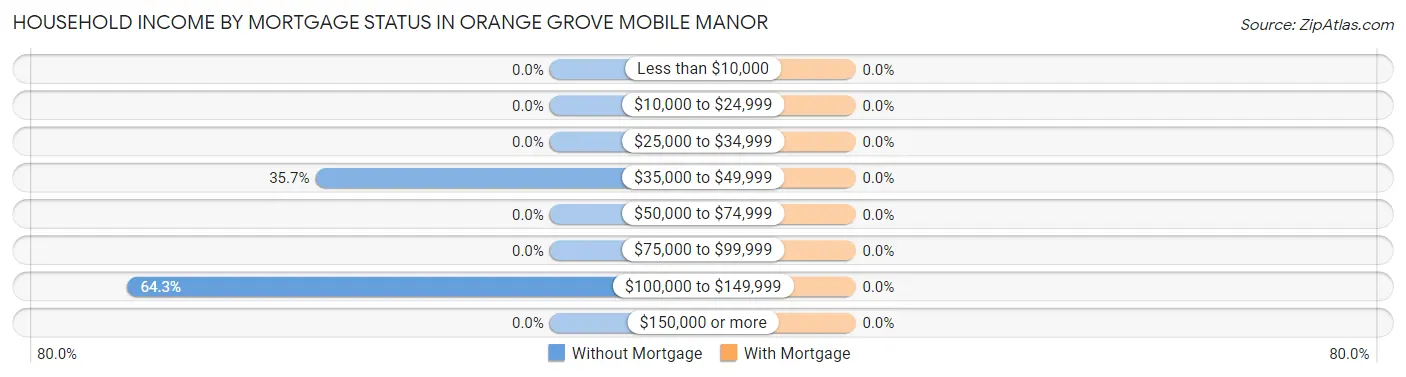
| Household Income | Without Mortgage | With Mortgage |
| Less than $10,000 | 0 (0.0%) | 0 (0.0%) |
| $10,000 to $24,999 | 0 (0.0%) | 0 (0.0%) |
| $25,000 to $34,999 | 0 (0.0%) | 0 (0.0%) |
| $35,000 to $49,999 | 20 (35.7%) | 0 (0.0%) |
| $50,000 to $74,999 | 0 (0.0%) | 0 (0.0%) |
| $75,000 to $99,999 | 0 (0.0%) | 0 (0.0%) |
| $100,000 to $149,999 | 36 (64.3%) | 0 (0.0%) |
| $150,000 or more | 0 (0.0%) | 0 (0.0%) |
| Total | 56 (100.0%) | 0 (0.0%) |
Property Value to Household Income Ratio in Orange Grove Mobile Manor
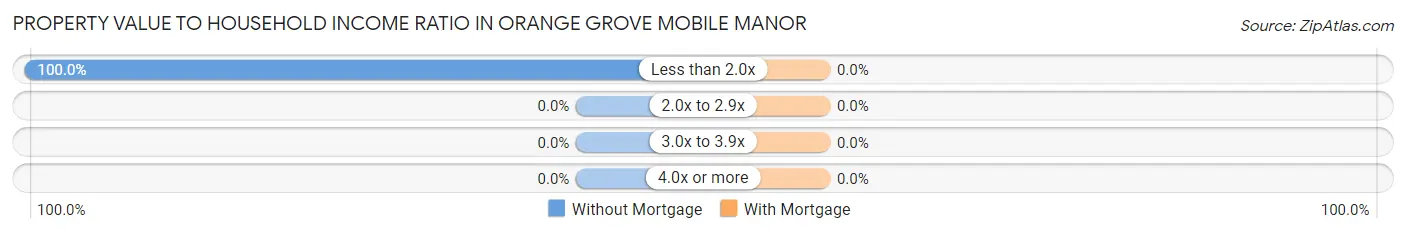
| Value-to-Income Ratio | Without Mortgage | With Mortgage |
| Less than 2.0x | 56 (100.0%) | 0 (0.0%) |
| 2.0x to 2.9x | 0 (0.0%) | 0 (0.0%) |
| 3.0x to 3.9x | 0 (0.0%) | 0 (0.0%) |
| 4.0x or more | 0 (0.0%) | 0 (0.0%) |
| Total | 56 (100.0%) | 0 (0.0%) |
Real Estate Taxes by Mortgage Status in Orange Grove Mobile Manor
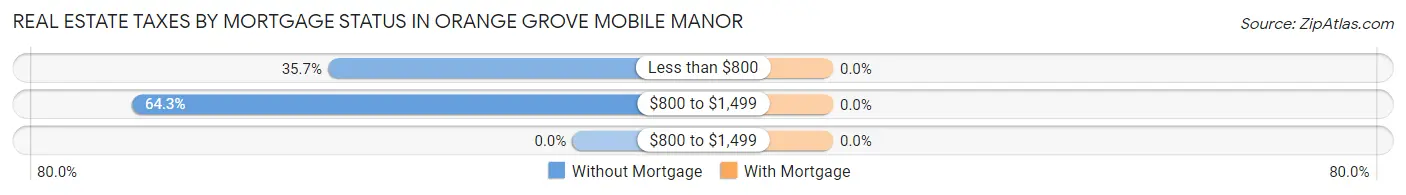
| Property Taxes | Without Mortgage | With Mortgage |
| Less than $800 | 20 (35.7%) | 0 (0.0%) |
| $800 to $1,499 | 36 (64.3%) | 0 (0.0%) |
| $800 to $1,499 | 0 (0.0%) | 0 (0.0%) |
| Total | 56 (100.0%) | 0 (0.0%) |
Health & Disability in Orange Grove Mobile Manor
Health Insurance Coverage by Age in Orange Grove Mobile Manor
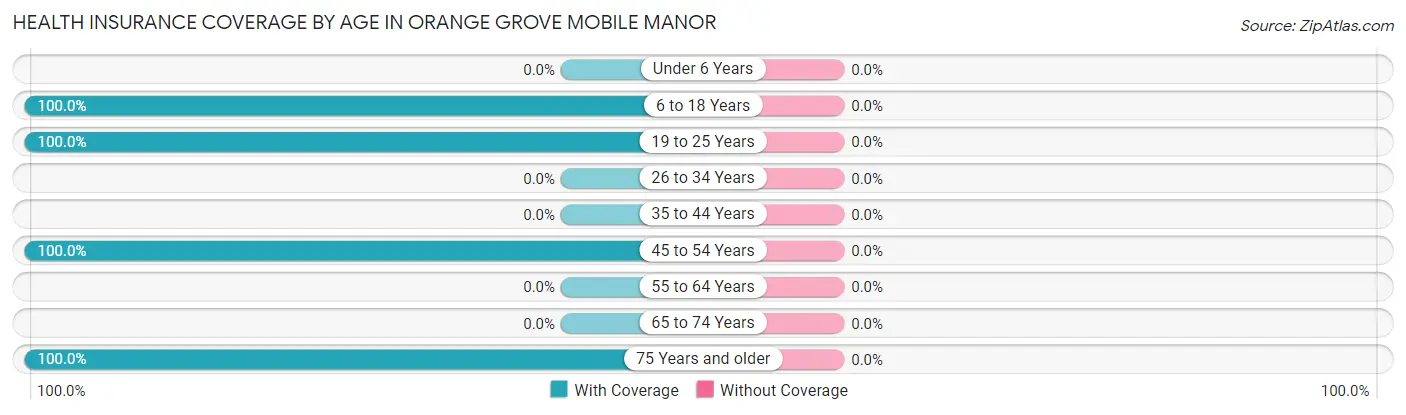
| Age Bracket | With Coverage | Without Coverage |
| Under 6 Years | 0 (0.0%) | 0 (0.0%) |
| 6 to 18 Years | 37 (100.0%) | 0 (0.0%) |
| 19 to 25 Years | 41 (100.0%) | 0 (0.0%) |
| 26 to 34 Years | 0 (0.0%) | 0 (0.0%) |
| 35 to 44 Years | 0 (0.0%) | 0 (0.0%) |
| 45 to 54 Years | 47 (100.0%) | 0 (0.0%) |
| 55 to 64 Years | 0 (0.0%) | 0 (0.0%) |
| 65 to 74 Years | 0 (0.0%) | 0 (0.0%) |
| 75 Years and older | 40 (100.0%) | 0 (0.0%) |
| Total | 165 (100.0%) | 0 (0.0%) |
Health Insurance Coverage by Citizenship Status in Orange Grove Mobile Manor
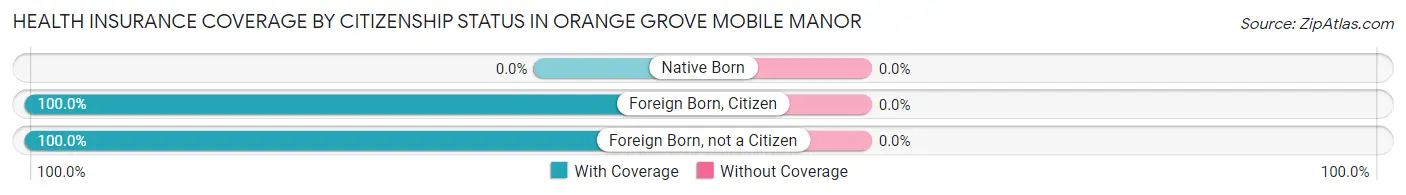
| Citizenship Status | With Coverage | Without Coverage |
| Native Born | 0 (0.0%) | 0 (0.0%) |
| Foreign Born, Citizen | 37 (100.0%) | 0 (0.0%) |
| Foreign Born, not a Citizen | 41 (100.0%) | 0 (0.0%) |
Health Insurance Coverage by Household Income in Orange Grove Mobile Manor
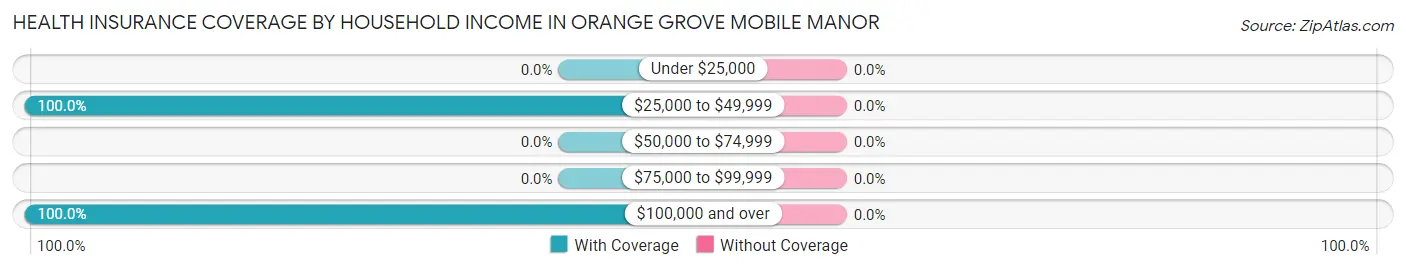
| Household Income | With Coverage | Without Coverage |
| Under $25,000 | 0 (0.0%) | 0 (0.0%) |
| $25,000 to $49,999 | 51 (100.0%) | 0 (0.0%) |
| $50,000 to $74,999 | 0 (0.0%) | 0 (0.0%) |
| $75,000 to $99,999 | 0 (0.0%) | 0 (0.0%) |
| $100,000 and over | 114 (100.0%) | 0 (0.0%) |
Public vs Private Health Insurance Coverage by Age in Orange Grove Mobile Manor
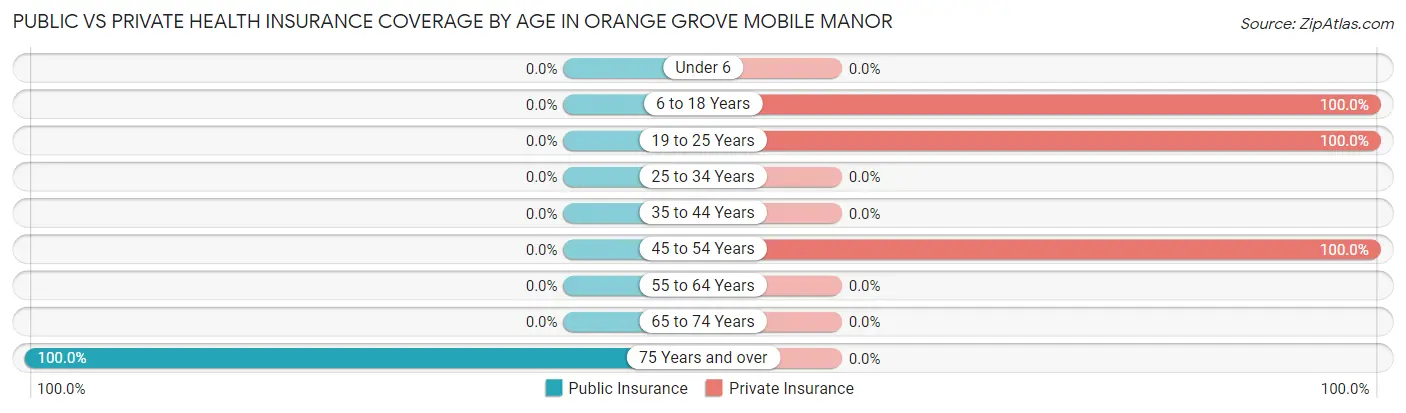
| Age Bracket | Public Insurance | Private Insurance |
| Under 6 | 0 (0.0%) | 0 (0.0%) |
| 6 to 18 Years | 0 (0.0%) | 37 (100.0%) |
| 19 to 25 Years | 0 (0.0%) | 41 (100.0%) |
| 25 to 34 Years | 0 (0.0%) | 0 (0.0%) |
| 35 to 44 Years | 0 (0.0%) | 0 (0.0%) |
| 45 to 54 Years | 0 (0.0%) | 47 (100.0%) |
| 55 to 64 Years | 0 (0.0%) | 0 (0.0%) |
| 65 to 74 Years | 0 (0.0%) | 0 (0.0%) |
| 75 Years and over | 40 (100.0%) | 0 (0.0%) |
| Total | 40 (24.2%) | 125 (75.8%) |
Disability Status by Sex by Age in Orange Grove Mobile Manor
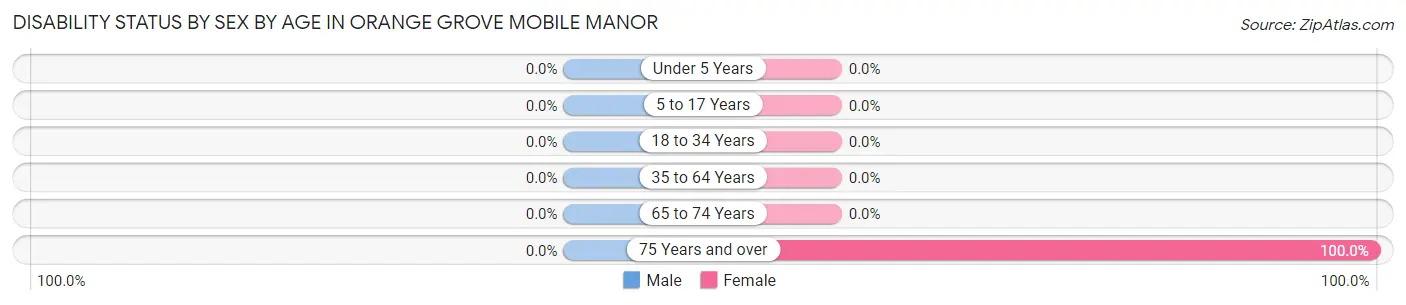
| Age Bracket | Male | Female |
| Under 5 Years | 0 (0.0%) | 0 (0.0%) |
| 5 to 17 Years | 0 (0.0%) | 0 (0.0%) |
| 18 to 34 Years | 0 (0.0%) | 0 (0.0%) |
| 35 to 64 Years | 0 (0.0%) | 0 (0.0%) |
| 65 to 74 Years | 0 (0.0%) | 0 (0.0%) |
| 75 Years and over | 0 (0.0%) | 20 (100.0%) |
Disability Class by Sex by Age in Orange Grove Mobile Manor
Disability Class: Hearing Difficulty
| Age Bracket | Male | Female |
| Under 5 Years | 0 (0.0%) | 0 (0.0%) |
| 5 to 17 Years | 0 (0.0%) | 0 (0.0%) |
| 18 to 34 Years | 0 (0.0%) | 0 (0.0%) |
| 35 to 64 Years | 0 (0.0%) | 0 (0.0%) |
| 65 to 74 Years | 0 (0.0%) | 0 (0.0%) |
| 75 Years and over | 0 (0.0%) | 0 (0.0%) |
Disability Class: Vision Difficulty
| Age Bracket | Male | Female |
| Under 5 Years | 0 (0.0%) | 0 (0.0%) |
| 5 to 17 Years | 0 (0.0%) | 0 (0.0%) |
| 18 to 34 Years | 0 (0.0%) | 0 (0.0%) |
| 35 to 64 Years | 0 (0.0%) | 0 (0.0%) |
| 65 to 74 Years | 0 (0.0%) | 0 (0.0%) |
| 75 Years and over | 0 (0.0%) | 0 (0.0%) |
Disability Class: Cognitive Difficulty
| Age Bracket | Male | Female |
| 5 to 17 Years | 0 (0.0%) | 0 (0.0%) |
| 18 to 34 Years | 0 (0.0%) | 0 (0.0%) |
| 35 to 64 Years | 0 (0.0%) | 0 (0.0%) |
| 65 to 74 Years | 0 (0.0%) | 0 (0.0%) |
| 75 Years and over | 0 (0.0%) | 20 (100.0%) |
Disability Class: Ambulatory Difficulty
| Age Bracket | Male | Female |
| 5 to 17 Years | 0 (0.0%) | 0 (0.0%) |
| 18 to 34 Years | 0 (0.0%) | 0 (0.0%) |
| 35 to 64 Years | 0 (0.0%) | 0 (0.0%) |
| 65 to 74 Years | 0 (0.0%) | 0 (0.0%) |
| 75 Years and over | 0 (0.0%) | 20 (100.0%) |
Disability Class: Self-Care Difficulty
| Age Bracket | Male | Female |
| 5 to 17 Years | 0 (0.0%) | 0 (0.0%) |
| 18 to 34 Years | 0 (0.0%) | 0 (0.0%) |
| 35 to 64 Years | 0 (0.0%) | 0 (0.0%) |
| 65 to 74 Years | 0 (0.0%) | 0 (0.0%) |
| 75 Years and over | 0 (0.0%) | 0 (0.0%) |
Technology Access in Orange Grove Mobile Manor
Computing Device Access in Orange Grove Mobile Manor
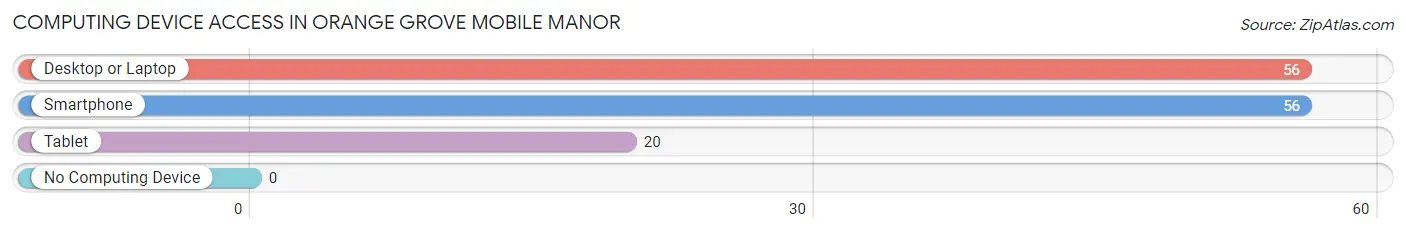
| Device Type | # Households | % Households |
| Desktop or Laptop | 56 | 100.0% |
| Smartphone | 56 | 100.0% |
| Tablet | 20 | 35.7% |
| No Computing Device | 0 | 0.0% |
| Total | 56 | 100.0% |
Internet Access in Orange Grove Mobile Manor
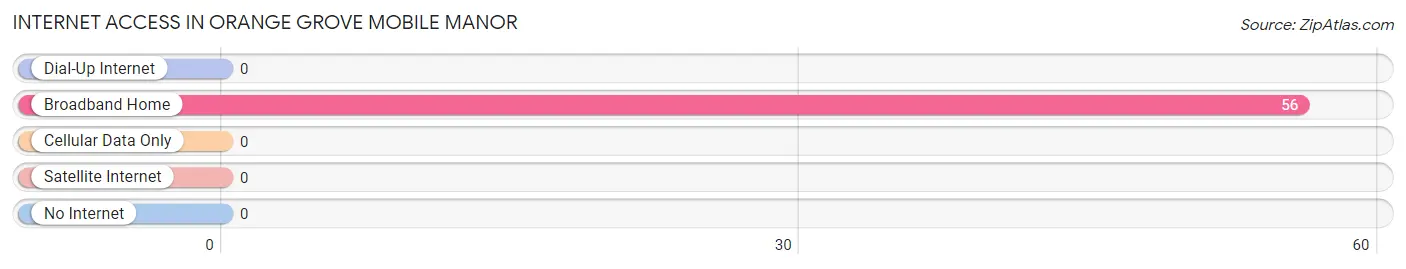
| Internet Type | # Households | % Households |
| Dial-Up Internet | 0 | 0.0% |
| Broadband Home | 56 | 100.0% |
| Cellular Data Only | 0 | 0.0% |
| Satellite Internet | 0 | 0.0% |
| No Internet | 0 | 0.0% |
| Total | 56 | 100.0% |
Orange Grove Mobile Manor Summary
Orange Grove Mobile Manor is a census-designated place (CDP) located in Pima County, Arizona. It is situated in the foothills of the Santa Catalina Mountains, approximately 10 miles north of Tucson. The CDP has a total area of 0.3 square miles, all of which is land. As of the 2010 census, the population of Orange Grove Mobile Manor was 1,845.
Geography
Orange Grove Mobile Manor is located in the foothills of the Santa Catalina Mountains, approximately 10 miles north of Tucson. The CDP has a total area of 0.3 square miles, all of which is land. The terrain is mostly flat, with some rolling hills. The area is mostly residential, with some commercial development along the main roads.
Climate
Orange Grove Mobile Manor has a semi-arid climate, with hot summers and mild winters. The average annual temperature is 73°F, with an average high of 95°F in July and an average low of 51°F in January. The average annual precipitation is 11.5 inches, with most of it falling in the summer months.
Demographics
As of the 2010 census, the population of Orange Grove Mobile Manor was 1,845. The racial makeup of the CDP was 79.2% White, 0.7% African American, 0.7% Native American, 0.7% Asian, 0.1% Pacific Islander, 16.2% from other races, and 2.4% from two or more races. Hispanic or Latino of any race were 44.2% of the population.
Economy
The economy of Orange Grove Mobile Manor is largely based on the service industry. The area is home to a variety of restaurants, retail stores, and other businesses. The CDP also has a number of light industrial and manufacturing businesses.
Education
Orange Grove Mobile Manor is served by the Tucson Unified School District. The area is home to several elementary schools, a middle school, and a high school. The CDP also has a number of private schools.
Transportation
Orange Grove Mobile Manor is served by the Sun Tran bus system, which provides public transportation throughout the Tucson metropolitan area. The CDP is also served by a number of taxi and ride-sharing services.
Conclusion
Orange Grove Mobile Manor is a census-designated place located in Pima County, Arizona. It is situated in the foothills of the Santa Catalina Mountains, approximately 10 miles north of Tucson. The CDP has a total area of 0.3 square miles, all of which is land. As of the 2010 census, the population of Orange Grove Mobile Manor was 1,845. The economy of Orange Grove Mobile Manor is largely based on the service industry, and the area is served by the Tucson Unified School District. The CDP is also served by the Sun Tran bus system, which provides public transportation throughout the Tucson metropolitan area.
Common Questions
What is Per Capita Income in Orange Grove Mobile Manor?
Per Capita income in Orange Grove Mobile Manor is $35,114.
What is Inequality or Gini Index in Orange Grove Mobile Manor?
Inequality or Gini Index in Orange Grove Mobile Manor is 0.22.
What is the Total Population of Orange Grove Mobile Manor?
Total Population of Orange Grove Mobile Manor is 165.
What is the Total Male Population of Orange Grove Mobile Manor?
Total Male Population of Orange Grove Mobile Manor is 109.
What is the Total Female Population of Orange Grove Mobile Manor?
Total Female Population of Orange Grove Mobile Manor is 56.
What is the Ratio of Males per 100 Females in Orange Grove Mobile Manor?
There are 194.64 Males per 100 Females in Orange Grove Mobile Manor.
What is the Ratio of Females per 100 Males in Orange Grove Mobile Manor?
There are 51.38 Females per 100 Males in Orange Grove Mobile Manor.
What is the Median Population Age in Orange Grove Mobile Manor?
Median Population Age in Orange Grove Mobile Manor is 47.1 Years.
What is the Average Family Size in Orange Grove Mobile Manor
Average Family Size in Orange Grove Mobile Manor is 3.0 People.
What is the Average Household Size in Orange Grove Mobile Manor
Average Household Size in Orange Grove Mobile Manor is 3.0 People.
How Large is the Labor Force in Orange Grove Mobile Manor?
There are 125 People in the Labor Forcein in Orange Grove Mobile Manor.
What is the Percentage of People in the Labor Force in Orange Grove Mobile Manor?
75.8% of People are in the Labor Force in Orange Grove Mobile Manor.