Gisela, AZ Map & Demographics
Gisela Map
Gisela Overview
$21,387
PER CAPITA INCOME
$67,772
AVG FAMILY INCOME
$19,909
AVG HOUSEHOLD INCOME
62.9%
WAGE / INCOME GAP [ % ]
37.1¢/ $1
WAGE / INCOME GAP [ $ ]
0.55
INEQUALITY / GINI INDEX
516
TOTAL POPULATION
270
MALE POPULATION
246
FEMALE POPULATION
109.76
MALES / 100 FEMALES
91.11
FEMALES / 100 MALES
52.0
MEDIAN AGE
3.1
AVG FAMILY SIZE
1.8
AVG HOUSEHOLD SIZE
126
LABOR FORCE [ PEOPLE ]
34.4%
PERCENT IN LABOR FORCE
Income in Gisela
Income Overview in Gisela
Per Capita Income in Gisela is $21,387, while median incomes of families and households are $67,772 and $19,909 respectively.
| Characteristic | Number | Measure |
| Per Capita Income | 516 | $21,387 |
| Median Family Income | 109 | $67,772 |
| Mean Family Income | 109 | $60,547 |
| Median Household Income | 285 | $19,909 |
| Mean Household Income | 285 | $40,163 |
| Income Deficit | 109 | $0 |
| Wage / Income Gap (%) | 516 | 62.95% |
| Wage / Income Gap ($) | 516 | 37.05¢ per $1 |
| Gini / Inequality Index | 516 | 0.55 |
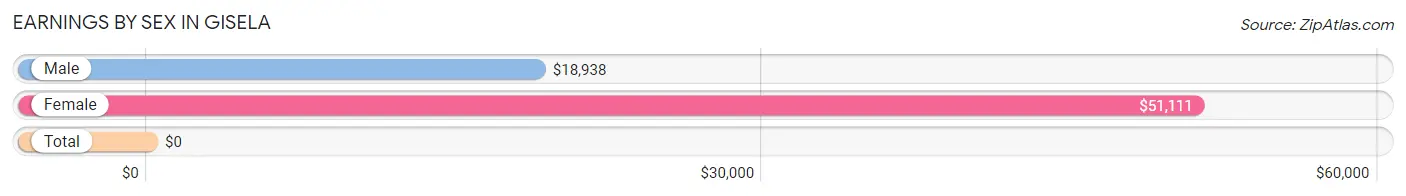
Earnings by Sex in Gisela
| Sex | Number | Average Earnings |
| Male | 104 (77.6%) | $18,938 |
| Female | 30 (22.4%) | $51,111 |
| Total | 134 (100.0%) | $0 |
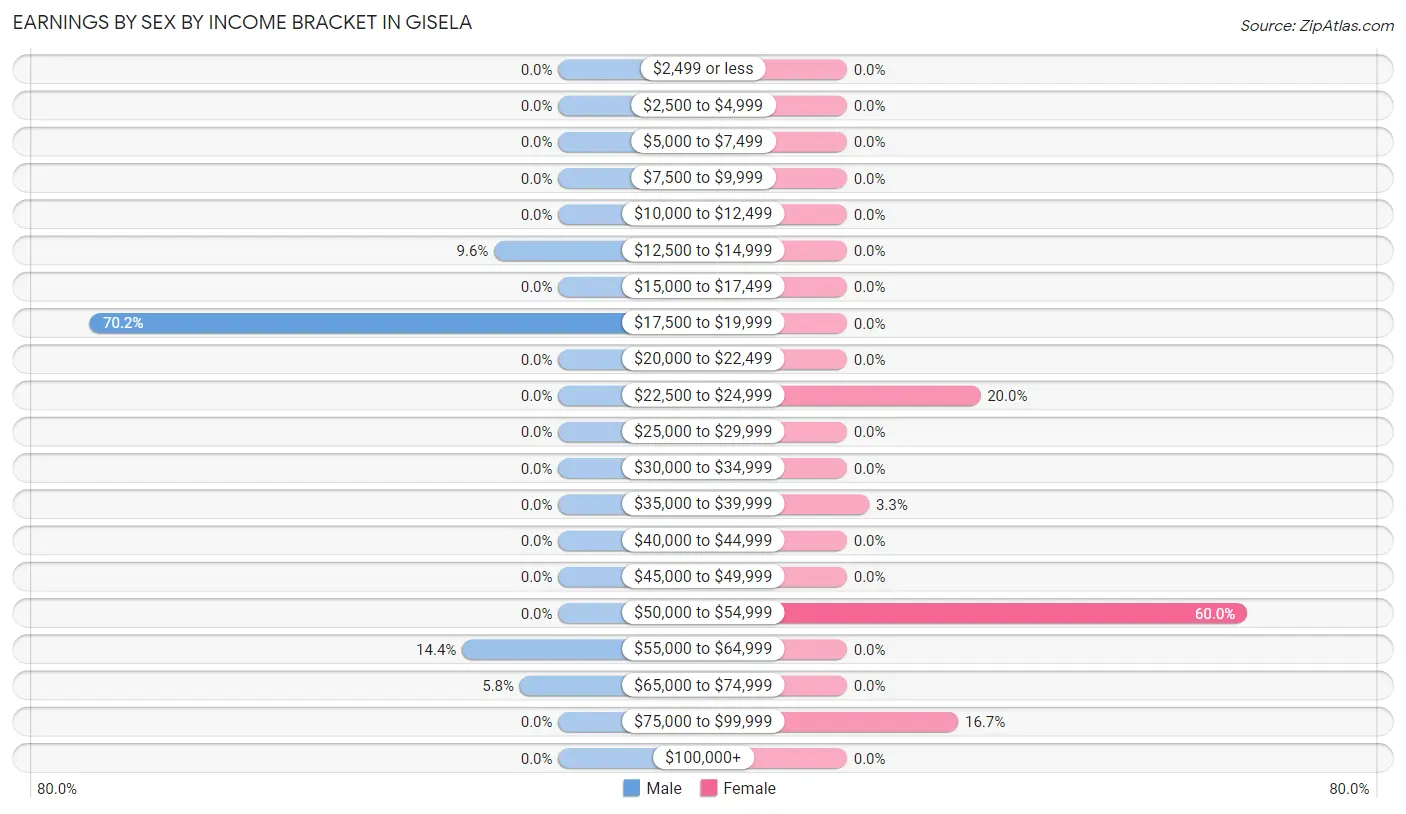
Earnings by Sex by Income Bracket in Gisela
The most common earnings brackets in Gisela are $17,500 to $19,999 for men (73 | 70.2%) and $50,000 to $54,999 for women (18 | 60.0%).
| Income | Male | Female |
| $2,499 or less | 0 (0.0%) | 0 (0.0%) |
| $2,500 to $4,999 | 0 (0.0%) | 0 (0.0%) |
| $5,000 to $7,499 | 0 (0.0%) | 0 (0.0%) |
| $7,500 to $9,999 | 0 (0.0%) | 0 (0.0%) |
| $10,000 to $12,499 | 0 (0.0%) | 0 (0.0%) |
| $12,500 to $14,999 | 10 (9.6%) | 0 (0.0%) |
| $15,000 to $17,499 | 0 (0.0%) | 0 (0.0%) |
| $17,500 to $19,999 | 73 (70.2%) | 0 (0.0%) |
| $20,000 to $22,499 | 0 (0.0%) | 0 (0.0%) |
| $22,500 to $24,999 | 0 (0.0%) | 6 (20.0%) |
| $25,000 to $29,999 | 0 (0.0%) | 0 (0.0%) |
| $30,000 to $34,999 | 0 (0.0%) | 0 (0.0%) |
| $35,000 to $39,999 | 0 (0.0%) | 1 (3.3%) |
| $40,000 to $44,999 | 0 (0.0%) | 0 (0.0%) |
| $45,000 to $49,999 | 0 (0.0%) | 0 (0.0%) |
| $50,000 to $54,999 | 0 (0.0%) | 18 (60.0%) |
| $55,000 to $64,999 | 15 (14.4%) | 0 (0.0%) |
| $65,000 to $74,999 | 6 (5.8%) | 0 (0.0%) |
| $75,000 to $99,999 | 0 (0.0%) | 5 (16.7%) |
| $100,000+ | 0 (0.0%) | 0 (0.0%) |
| Total | 104 (100.0%) | 30 (100.0%) |
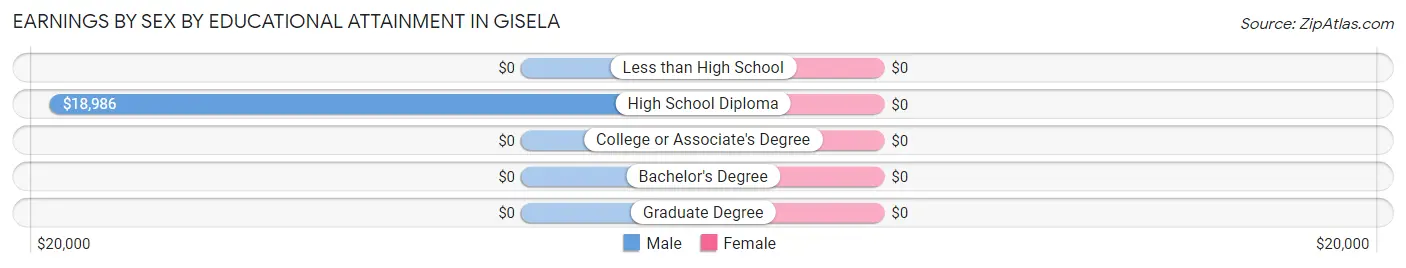
Earnings by Sex by Educational Attainment in Gisela
| Educational Attainment | Male Income | Female Income |
| Less than High School | - | - |
| High School Diploma | $18,986 | $0 |
| College or Associate's Degree | - | - |
| Bachelor's Degree | - | - |
| Graduate Degree | - | - |
| Total | $18,938 | $51,111 |
Family Income in Gisela
Family Income Brackets in Gisela
According to the Gisela family income data, there are 38 families falling into the $50,000 to $74,999 income range, which is the most common income bracket and makes up 34.9% of all families.
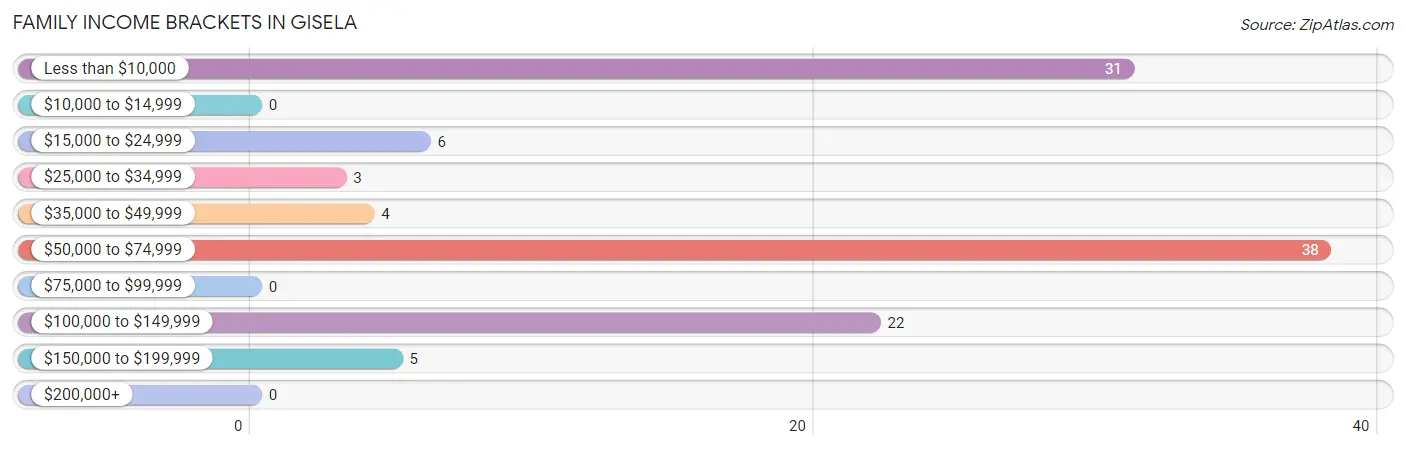
| Income Bracket | # Families | % Families |
| Less than $10,000 | 31 | 28.4% |
| $10,000 to $14,999 | 0 | 0.0% |
| $15,000 to $24,999 | 6 | 5.5% |
| $25,000 to $34,999 | 3 | 2.8% |
| $35,000 to $49,999 | 4 | 3.7% |
| $50,000 to $74,999 | 38 | 34.9% |
| $75,000 to $99,999 | 0 | 0.0% |
| $100,000 to $149,999 | 22 | 20.2% |
| $150,000 to $199,999 | 5 | 4.6% |
| $200,000+ | 0 | 0.0% |
Family Income by Famaliy Size in Gisela
2-person families (43 | 39.5%) account for the highest median family income in Gisela with $68,859 per family, while 2-person families (43 | 39.5%) have the highest median income of $34,430 per family member.
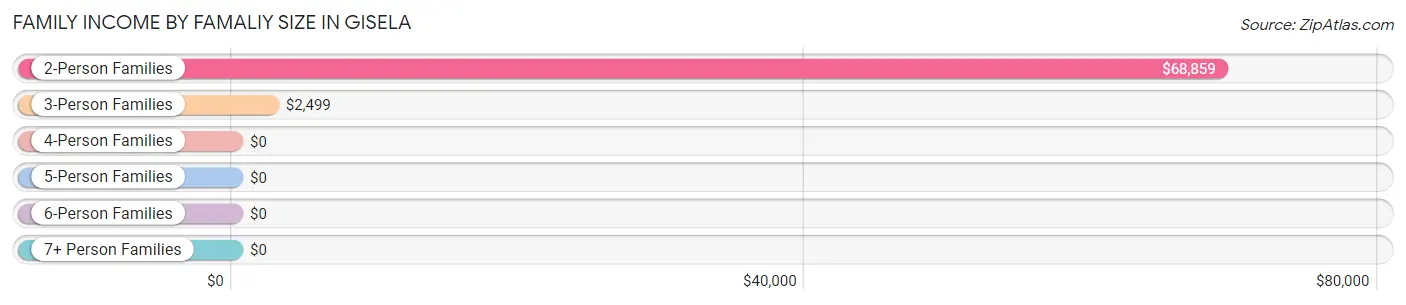
| Income Bracket | # Families | Median Income |
| 2-Person Families | 43 (39.5%) | $68,859 |
| 3-Person Families | 43 (39.5%) | $2,499 |
| 4-Person Families | 5 (4.6%) | $0 |
| 5-Person Families | 0 (0.0%) | $0 |
| 6-Person Families | 0 (0.0%) | $0 |
| 7+ Person Families | 18 (16.5%) | $0 |
| Total | 109 (100.0%) | $67,772 |
Family Income by Number of Earners in Gisela
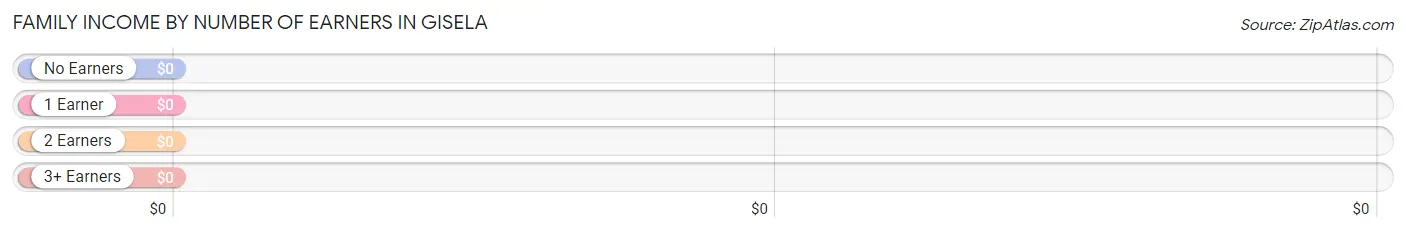
| Number of Earners | # Families | Median Income |
| No Earners | 69 (63.3%) | $0 |
| 1 Earner | 35 (32.1%) | $0 |
| 2 Earners | 5 (4.6%) | $0 |
| 3+ Earners | 0 (0.0%) | $0 |
| Total | 109 (100.0%) | $67,772 |
Household Income in Gisela
Household Income Brackets in Gisela
With 92 households falling in the category, the $15,000 to $24,999 income range is the most frequent in Gisela, accounting for 32.3% of all households.
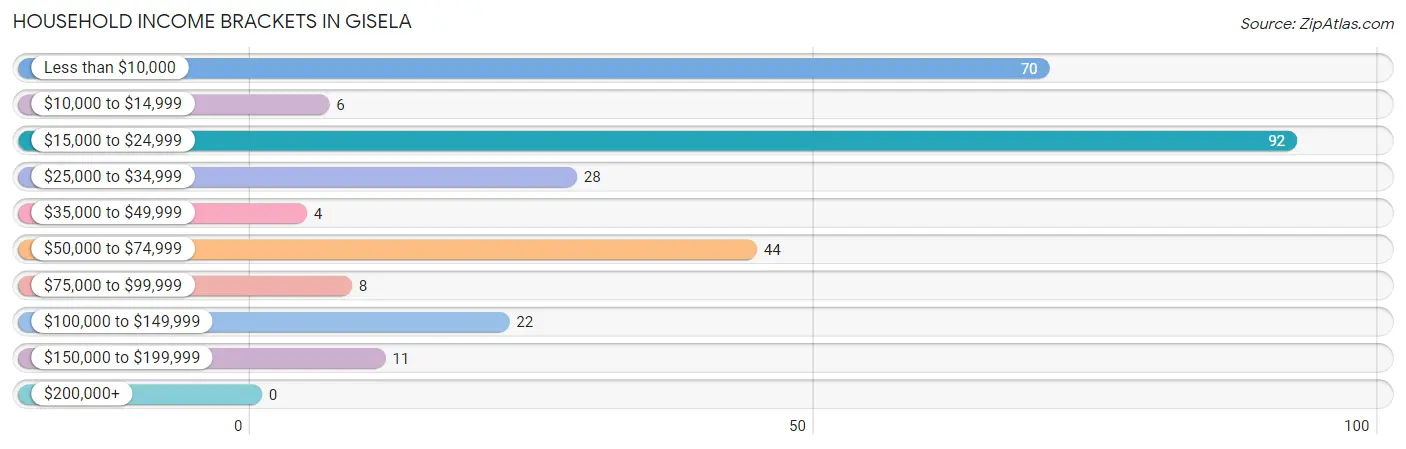
| Income Bracket | # Households | % Households |
| Less than $10,000 | 70 | 24.6% |
| $10,000 to $14,999 | 6 | 2.1% |
| $15,000 to $24,999 | 92 | 32.3% |
| $25,000 to $34,999 | 28 | 9.8% |
| $35,000 to $49,999 | 4 | 1.4% |
| $50,000 to $74,999 | 44 | 15.4% |
| $75,000 to $99,999 | 8 | 2.8% |
| $100,000 to $149,999 | 22 | 7.7% |
| $150,000 to $199,999 | 11 | 3.9% |
| $200,000+ | 0 | 0.0% |
Household Income by Householder Age in Gisela
The median household income in Gisela is $19,909, with the highest median household income of $19,257 found in the 45 to 64 years age bracket for the primary householder. A total of 121 households (42.5%) fall into this category.
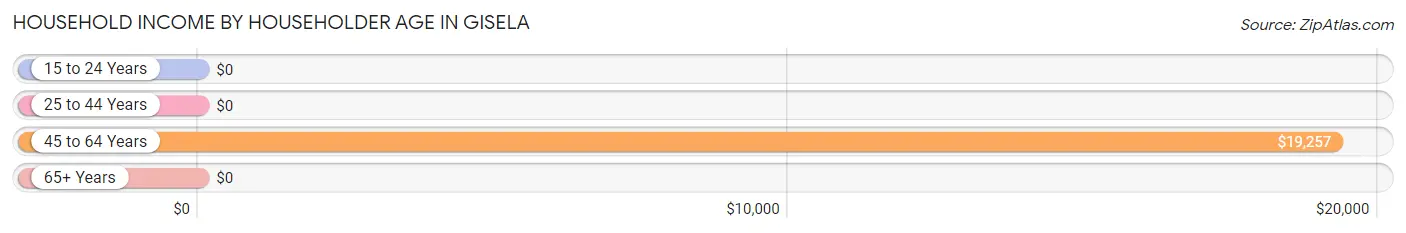
| Income Bracket | # Households | Median Income |
| 15 to 24 Years | 0 (0.0%) | $0 |
| 25 to 44 Years | 65 (22.8%) | $0 |
| 45 to 64 Years | 121 (42.5%) | $19,257 |
| 65+ Years | 99 (34.7%) | $0 |
| Total | 285 (100.0%) | $19,909 |
Poverty in Gisela
Income Below Poverty by Sex and Age in Gisela
With 6.7% poverty level for males and 40.2% for females among the residents of Gisela, 45 to 54 year old males and 75 year old and over females are the most vulnerable to poverty, with 12 males (100.0%) and 27 females (84.4%) in their respective age groups living below the poverty level.
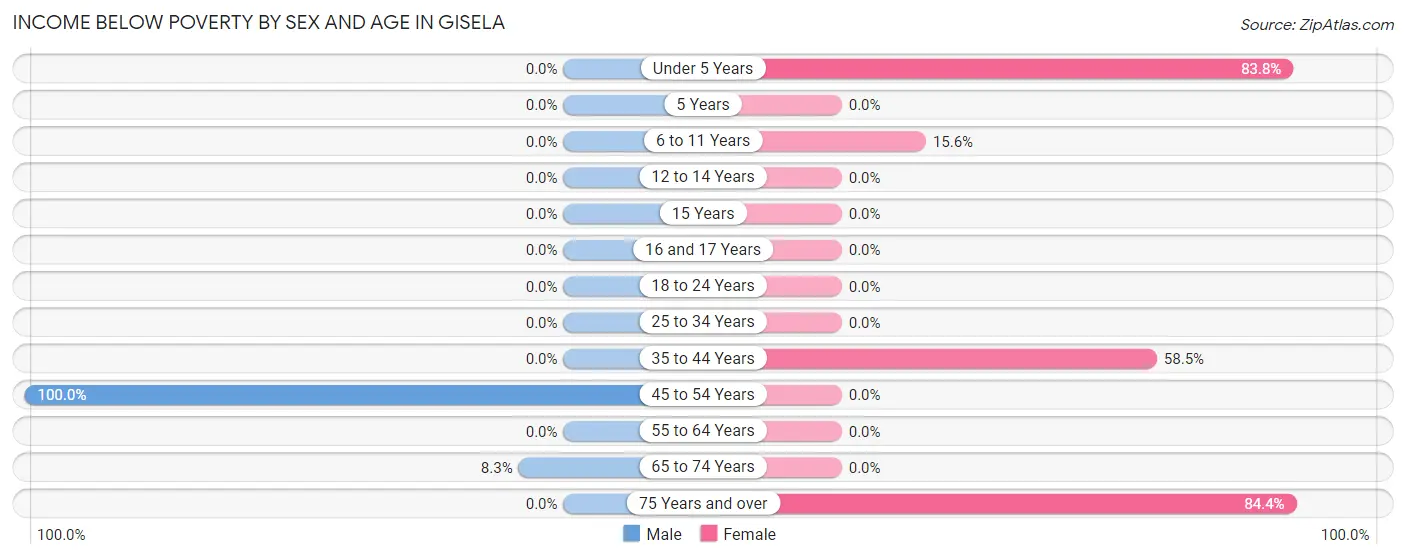
| Age Bracket | Male | Female |
| Under 5 Years | 0 (0.0%) | 31 (83.8%) |
| 5 Years | 0 (0.0%) | 0 (0.0%) |
| 6 to 11 Years | 0 (0.0%) | 10 (15.6%) |
| 12 to 14 Years | 0 (0.0%) | 0 (0.0%) |
| 15 Years | 0 (0.0%) | 0 (0.0%) |
| 16 and 17 Years | 0 (0.0%) | 0 (0.0%) |
| 18 to 24 Years | 0 (0.0%) | 0 (0.0%) |
| 25 to 34 Years | 0 (0.0%) | 0 (0.0%) |
| 35 to 44 Years | 0 (0.0%) | 31 (58.5%) |
| 45 to 54 Years | 12 (100.0%) | 0 (0.0%) |
| 55 to 64 Years | 0 (0.0%) | 0 (0.0%) |
| 65 to 74 Years | 6 (8.3%) | 0 (0.0%) |
| 75 Years and over | 0 (0.0%) | 27 (84.4%) |
| Total | 18 (6.7%) | 99 (40.2%) |
Income Above Poverty by Sex and Age in Gisela
According to the poverty statistics in Gisela, males aged 5 years and females aged 12 to 14 years are the age groups that are most secure financially, with 100.0% of males and 100.0% of females in these age groups living above the poverty line.
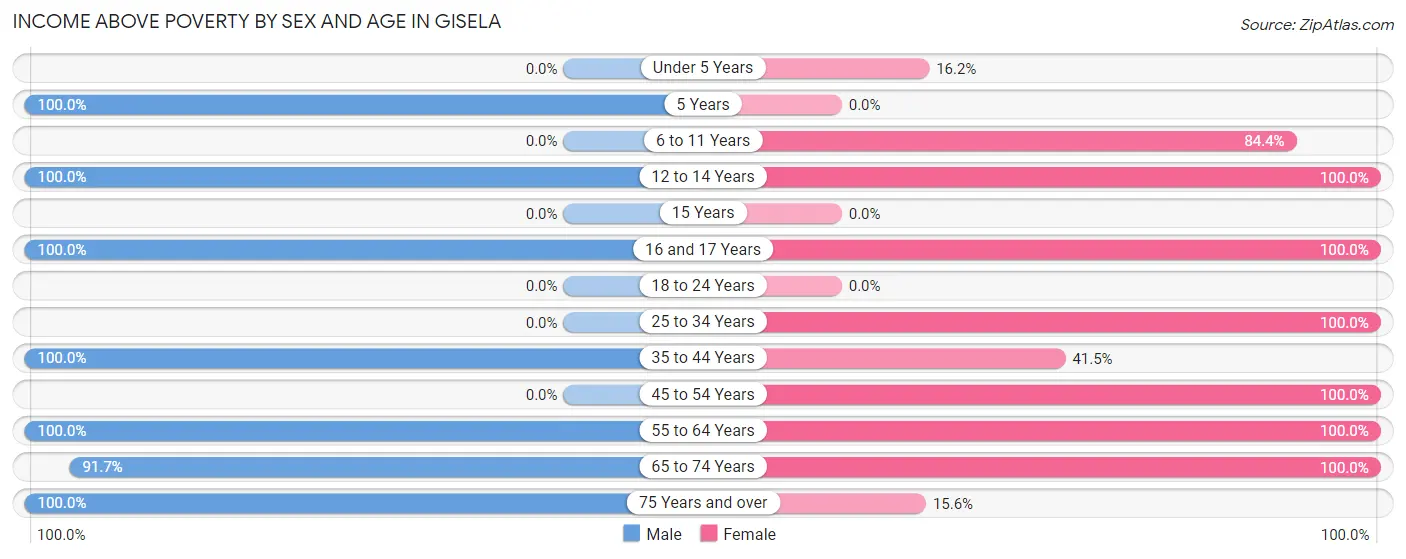
| Age Bracket | Male | Female |
| Under 5 Years | 0 (0.0%) | 6 (16.2%) |
| 5 Years | 16 (100.0%) | 0 (0.0%) |
| 6 to 11 Years | 0 (0.0%) | 54 (84.4%) |
| 12 to 14 Years | 32 (100.0%) | 1 (100.0%) |
| 15 Years | 0 (0.0%) | 0 (0.0%) |
| 16 and 17 Years | 3 (100.0%) | 3 (100.0%) |
| 18 to 24 Years | 0 (0.0%) | 0 (0.0%) |
| 25 to 34 Years | 0 (0.0%) | 6 (100.0%) |
| 35 to 44 Years | 26 (100.0%) | 22 (41.5%) |
| 45 to 54 Years | 0 (0.0%) | 5 (100.0%) |
| 55 to 64 Years | 108 (100.0%) | 35 (100.0%) |
| 65 to 74 Years | 66 (91.7%) | 10 (100.0%) |
| 75 Years and over | 1 (100.0%) | 5 (15.6%) |
| Total | 252 (93.3%) | 147 (59.8%) |
Income Below Poverty Among Married-Couple Families in Gisela
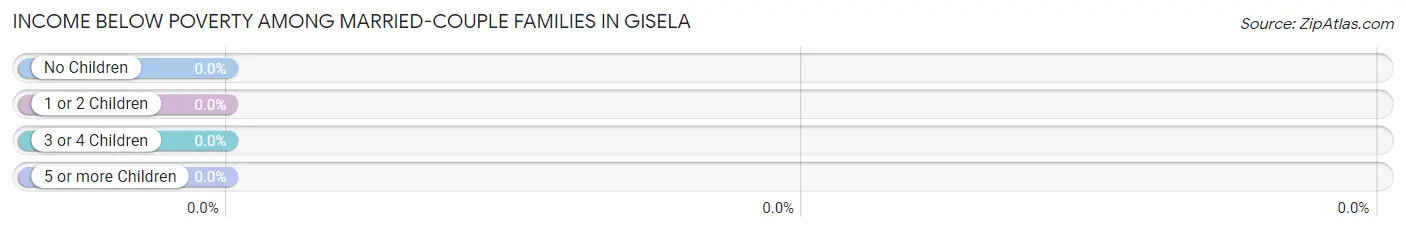
| Children | Above Poverty | Below Poverty |
| No Children | 44 (100.0%) | 0 (0.0%) |
| 1 or 2 Children | 1 (100.0%) | 0 (0.0%) |
| 3 or 4 Children | 0 (0.0%) | 0 (0.0%) |
| 5 or more Children | 18 (100.0%) | 0 (0.0%) |
| Total | 63 (100.0%) | 0 (0.0%) |
Income Below Poverty Among Single-Parent Households in Gisela
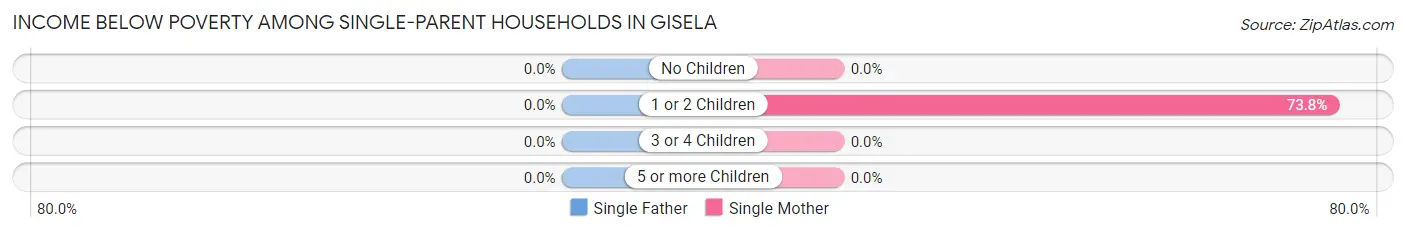
| Children | Single Father | Single Mother |
| No Children | 0 (0.0%) | 0 (0.0%) |
| 1 or 2 Children | 0 (0.0%) | 31 (73.8%) |
| 3 or 4 Children | 0 (0.0%) | 0 (0.0%) |
| 5 or more Children | 0 (0.0%) | 0 (0.0%) |
| Total | 0 (0.0%) | 31 (67.4%) |
Income Below Poverty Among Married-Couple vs Single-Parent Households in Gisela
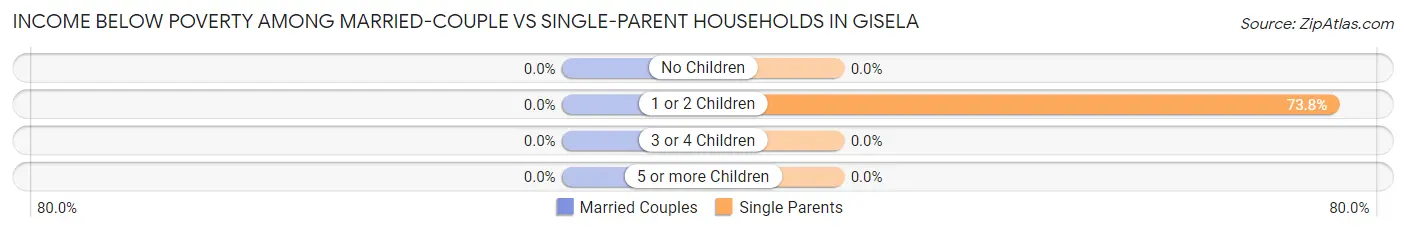
| Children | Married-Couple Families | Single-Parent Households |
| No Children | 0 (0.0%) | 0 (0.0%) |
| 1 or 2 Children | 0 (0.0%) | 31 (73.8%) |
| 3 or 4 Children | 0 (0.0%) | 0 (0.0%) |
| 5 or more Children | 0 (0.0%) | 0 (0.0%) |
| Total | 0 (0.0%) | 31 (67.4%) |
Race in Gisela
The most populous races in Gisela are White / Caucasian (374 | 72.5%), Hispanic or Latino (135 | 26.2%), and Two or more Races (102 | 19.8%).
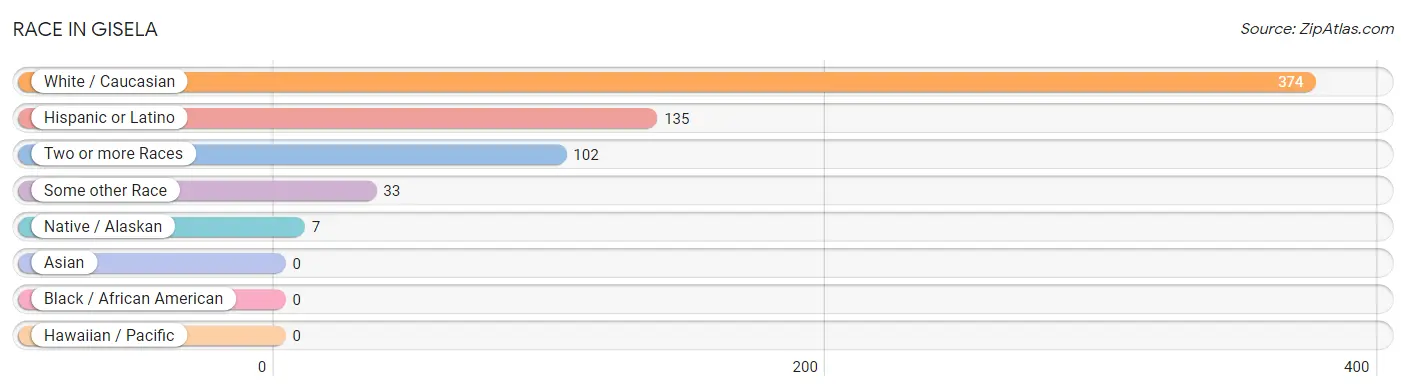
| Race | # Population | % Population |
| Asian | 0 | 0.0% |
| Black / African American | 0 | 0.0% |
| Hawaiian / Pacific | 0 | 0.0% |
| Hispanic or Latino | 135 | 26.2% |
| Native / Alaskan | 7 | 1.4% |
| White / Caucasian | 374 | 72.5% |
| Two or more Races | 102 | 19.8% |
| Some other Race | 33 | 6.4% |
| Total | 516 | 100.0% |
Ancestry in Gisela
The most populous ancestries reported in Gisela are Irish (227 | 44.0%), German (222 | 43.0%), Cuban (120 | 23.3%), English (25 | 4.8%), and Swedish (19 | 3.7%), together accounting for 118.8% of all Gisela residents.
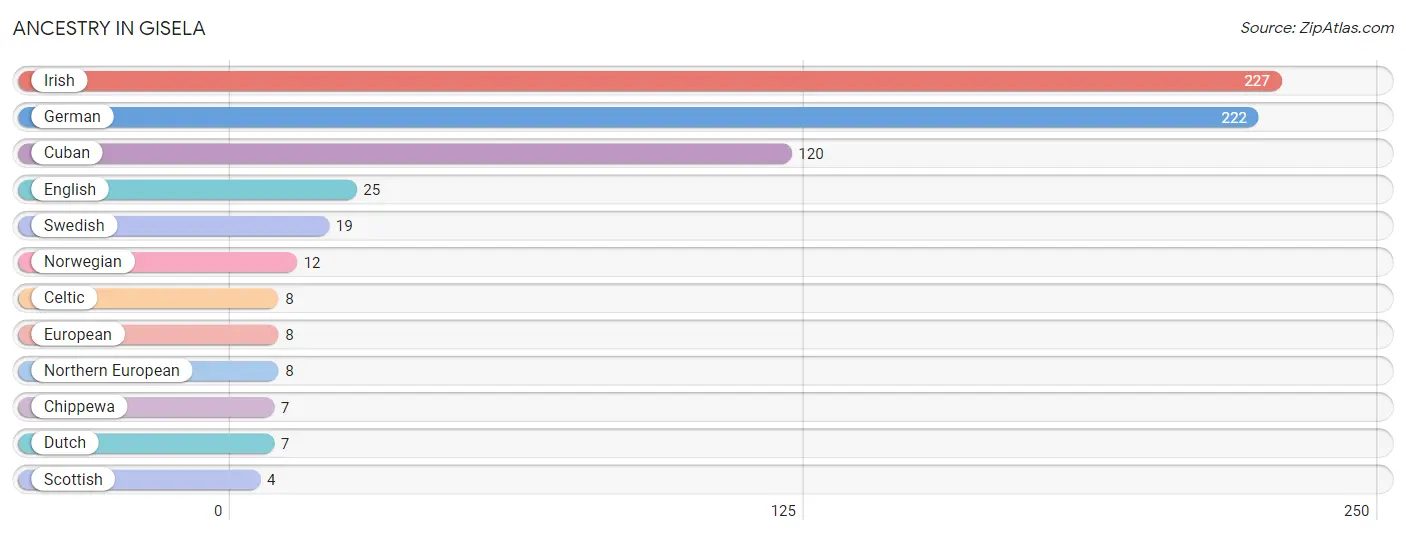
| Ancestry | # Population | % Population |
| Celtic | 8 | 1.5% |
| Chippewa | 7 | 1.4% |
| Cuban | 120 | 23.3% |
| Dutch | 7 | 1.4% |
| English | 25 | 4.8% |
| European | 8 | 1.5% |
| German | 222 | 43.0% |
| Irish | 227 | 44.0% |
| Northern European | 8 | 1.5% |
| Norwegian | 12 | 2.3% |
| Scottish | 4 | 0.8% |
| Swedish | 19 | 3.7% | View All 12 Rows |
Immigrants in Gisela

| Immigration Origin | # Population | % Population | View All 0 Rows |
Sex and Age in Gisela
Sex and Age in Gisela
The most populous age groups in Gisela are 55 to 59 Years (69 | 25.6%) for men and Under 5 Years (37 | 15.0%) for women.
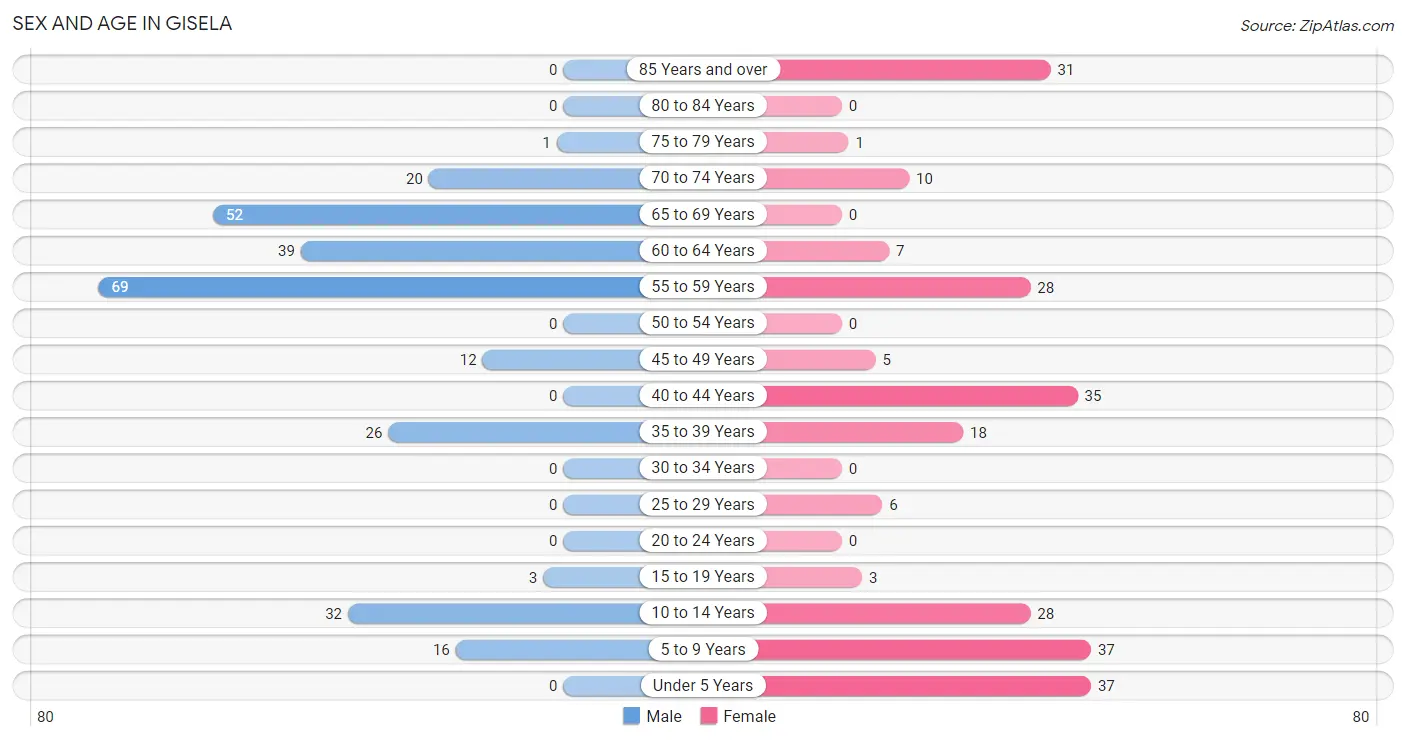
| Age Bracket | Male | Female |
| Under 5 Years | 0 (0.0%) | 37 (15.0%) |
| 5 to 9 Years | 16 (5.9%) | 37 (15.0%) |
| 10 to 14 Years | 32 (11.8%) | 28 (11.4%) |
| 15 to 19 Years | 3 (1.1%) | 3 (1.2%) |
| 20 to 24 Years | 0 (0.0%) | 0 (0.0%) |
| 25 to 29 Years | 0 (0.0%) | 6 (2.4%) |
| 30 to 34 Years | 0 (0.0%) | 0 (0.0%) |
| 35 to 39 Years | 26 (9.6%) | 18 (7.3%) |
| 40 to 44 Years | 0 (0.0%) | 35 (14.2%) |
| 45 to 49 Years | 12 (4.4%) | 5 (2.0%) |
| 50 to 54 Years | 0 (0.0%) | 0 (0.0%) |
| 55 to 59 Years | 69 (25.6%) | 28 (11.4%) |
| 60 to 64 Years | 39 (14.4%) | 7 (2.9%) |
| 65 to 69 Years | 52 (19.3%) | 0 (0.0%) |
| 70 to 74 Years | 20 (7.4%) | 10 (4.1%) |
| 75 to 79 Years | 1 (0.4%) | 1 (0.4%) |
| 80 to 84 Years | 0 (0.0%) | 0 (0.0%) |
| 85 Years and over | 0 (0.0%) | 31 (12.6%) |
| Total | 270 (100.0%) | 246 (100.0%) |
Families and Households in Gisela
Median Family Size in Gisela
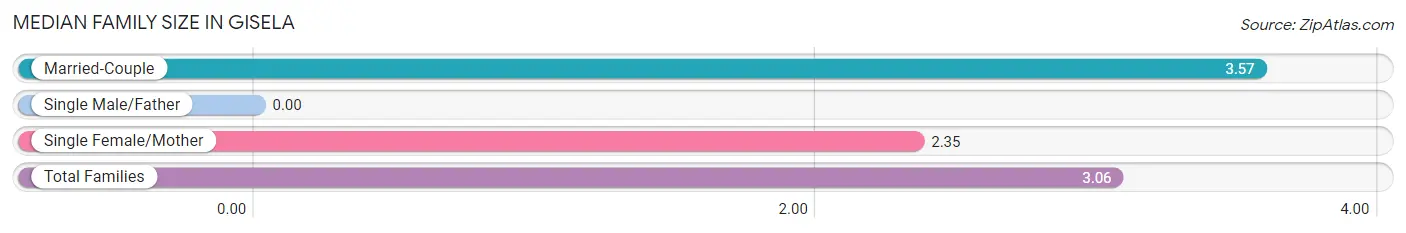
| Family Type | # Families | Family Size |
| Married-Couple | 63 (57.8%) | 3.57 |
| Single Male/Father | 0 (0.0%) | - |
| Single Female/Mother | 46 (42.2%) | 2.35 |
| Total Families | 109 (100.0%) | 3.06 |
Median Household Size in Gisela
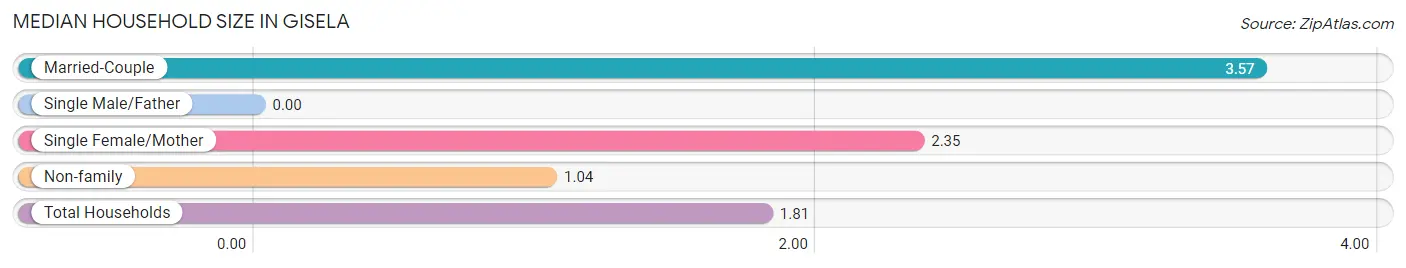
| Household Type | # Households | Household Size |
| Married-Couple | 63 (22.1%) | 3.57 |
| Single Male/Father | 0 (0.0%) | - |
| Single Female/Mother | 46 (16.1%) | 2.35 |
| Non-family | 176 (61.8%) | 1.04 |
| Total Households | 285 (100.0%) | 1.81 |
Household Size by Marriage Status in Gisela
Out of a total of 285 households in Gisela, 109 (38.3%) are family households, while 176 (61.8%) are nonfamily households. The most numerous type of family households are 2-person households, comprising 43, and the most common type of nonfamily households are 1-person households, comprising 170.
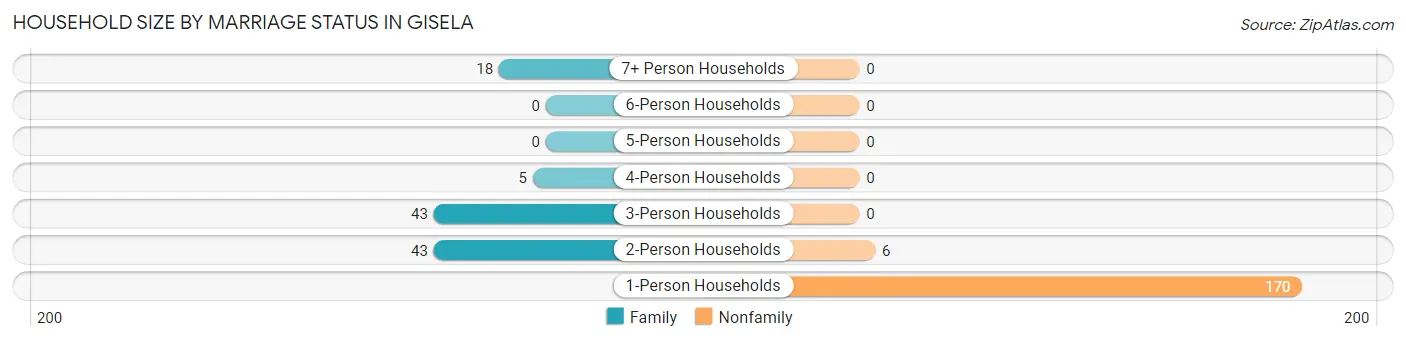
| Household Size | Family Households | Nonfamily Households |
| 1-Person Households | - | 170 (59.7%) |
| 2-Person Households | 43 (15.1%) | 6 (2.1%) |
| 3-Person Households | 43 (15.1%) | 0 (0.0%) |
| 4-Person Households | 5 (1.8%) | 0 (0.0%) |
| 5-Person Households | 0 (0.0%) | 0 (0.0%) |
| 6-Person Households | 0 (0.0%) | 0 (0.0%) |
| 7+ Person Households | 18 (6.3%) | 0 (0.0%) |
| Total | 109 (38.3%) | 176 (61.8%) |
Female Fertility in Gisela
Fertility by Age in Gisela
| Age Bracket | Women with Births | Births / 1,000 Women |
| 15 to 19 years | 0 (0.0%) | 0.0 |
| 20 to 34 years | 0 (0.0%) | 0.0 |
| 35 to 50 years | 0 (0.0%) | 0.0 |
| Total | 0 (0.0%) | 0.0 |
Fertility by Age by Marriage Status in Gisela
| Age Bracket | Married | Unmarried |
| 15 to 19 years | 0 (0.0%) | 0 (0.0%) |
| 20 to 34 years | 0 (0.0%) | 0 (0.0%) |
| 35 to 50 years | 0 (0.0%) | 0 (0.0%) |
| Total | 0 (0.0%) | 0 (0.0%) |
Fertility by Education in Gisela
| Educational Attainment | Women with Births | Births / 1,000 Women |
| Less than High School | 0 (0.0%) | 0.0 |
| High School Diploma | 0 (0.0%) | 0.0 |
| College or Associate's Degree | 0 (0.0%) | 0.0 |
| Bachelor's Degree | 0 (0.0%) | 0.0 |
| Graduate Degree | 0 (0.0%) | 0.0 |
| Total | 0 (0.0%) | 0.0 |
Fertility by Education by Marriage Status in Gisela
| Educational Attainment | Married | Unmarried |
| Less than High School | 0 (0.0%) | 0 (0.0%) |
| High School Diploma | 0 (0.0%) | 0 (0.0%) |
| College or Associate's Degree | 0 (0.0%) | 0 (0.0%) |
| Bachelor's Degree | 0 (0.0%) | 0 (0.0%) |
| Graduate Degree | 0 (0.0%) | 0 (0.0%) |
| Total | 0 (0.0%) | 0 (0.0%) |
Employment Characteristics in Gisela
Employment by Class of Employer in Gisela
Among the 126 employed individuals in Gisela, self-employed (not incorporated) (69 | 54.8%), private company employees (24 | 19.1%), and state government employees (18 | 14.3%) make up the most common classes of employment.
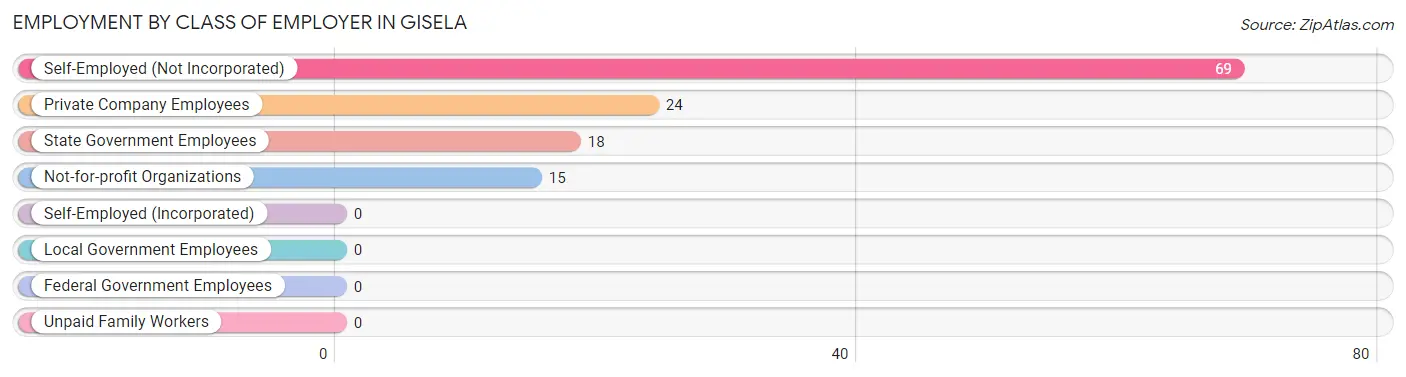
| Employer Class | # Employees | % Employees |
| Private Company Employees | 24 | 19.1% |
| Self-Employed (Incorporated) | 0 | 0.0% |
| Self-Employed (Not Incorporated) | 69 | 54.8% |
| Not-for-profit Organizations | 15 | 11.9% |
| Local Government Employees | 0 | 0.0% |
| State Government Employees | 18 | 14.3% |
| Federal Government Employees | 0 | 0.0% |
| Unpaid Family Workers | 0 | 0.0% |
| Total | 126 | 100.0% |
Employment Status by Age in Gisela
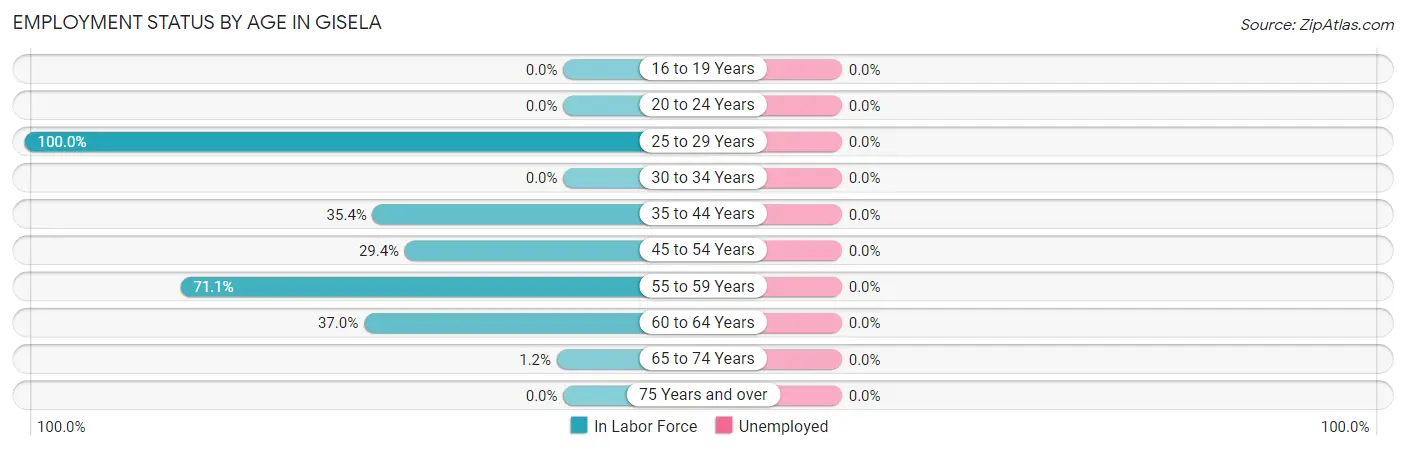
| Age Bracket | In Labor Force | Unemployed |
| 16 to 19 Years | 0 (0.0%) | 0 (0.0%) |
| 20 to 24 Years | 0 (0.0%) | 0 (0.0%) |
| 25 to 29 Years | 6 (100.0%) | 0 (0.0%) |
| 30 to 34 Years | 0 (0.0%) | 0 (0.0%) |
| 35 to 44 Years | 28 (35.4%) | 0 (0.0%) |
| 45 to 54 Years | 5 (29.4%) | 0 (0.0%) |
| 55 to 59 Years | 69 (71.1%) | 0 (0.0%) |
| 60 to 64 Years | 17 (37.0%) | 0 (0.0%) |
| 65 to 74 Years | 1 (1.2%) | 0 (0.0%) |
| 75 Years and over | 0 (0.0%) | 0 (0.0%) |
| Total | 126 (34.4%) | 0 (0.0%) |
Employment Status by Educational Attainment in Gisela
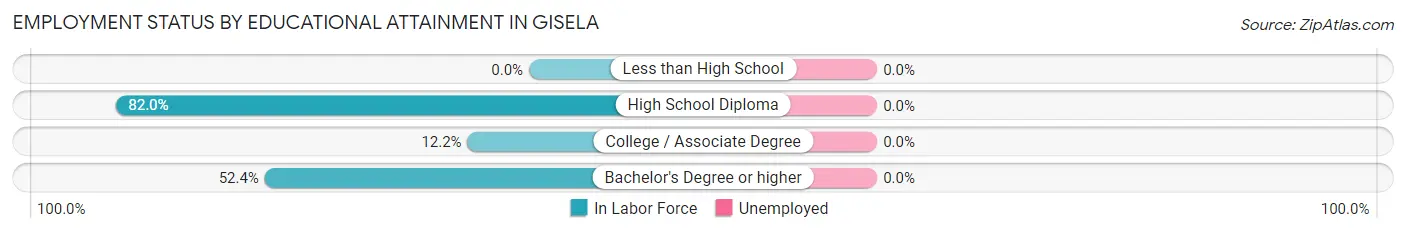
| Educational Attainment | In Labor Force | Unemployed |
| Less than High School | 0 (0.0%) | 0 (0.0%) |
| High School Diploma | 82 (82.0%) | 0 (0.0%) |
| College / Associate Degree | 10 (12.2%) | 0 (0.0%) |
| Bachelor's Degree or higher | 33 (52.4%) | 0 (0.0%) |
| Total | 125 (51.0%) | 0 (0.0%) |
Employment Occupations by Sex in Gisela
Management, Business, Science and Arts Occupations
The most common Management, Business, Science and Arts occupations in Gisela are Management (6 | 4.8%), Health Diagnosing & Treating (5 | 4.0%), and Health Technologists (5 | 4.0%).
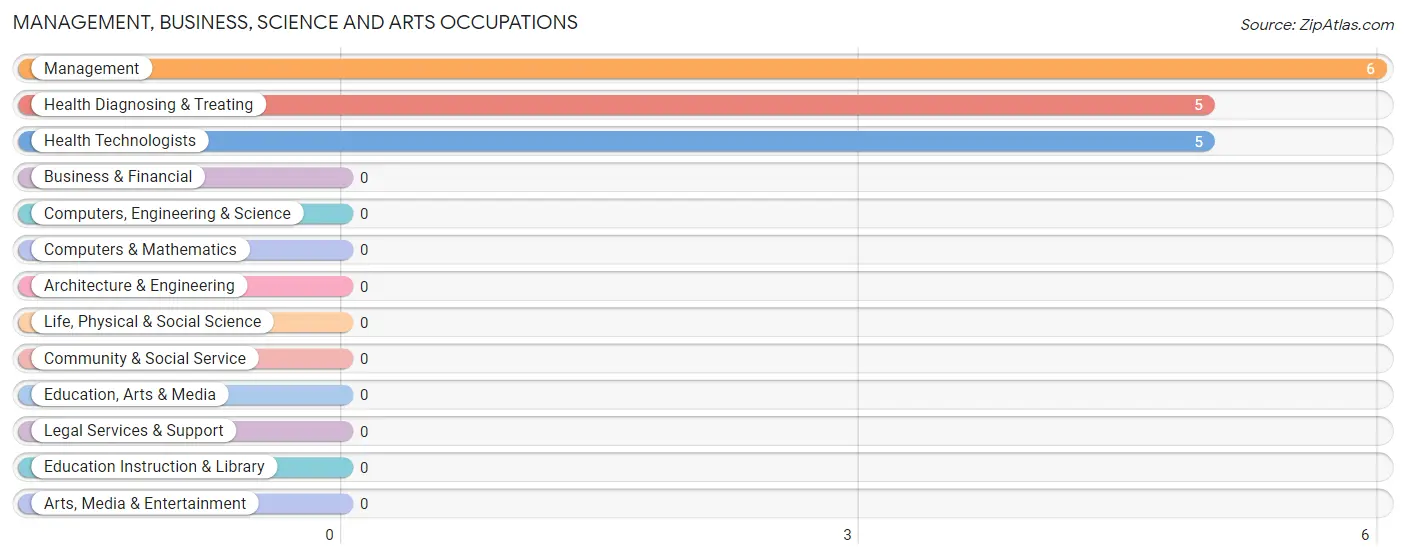
Management, Business, Science and Arts Occupations by Sex
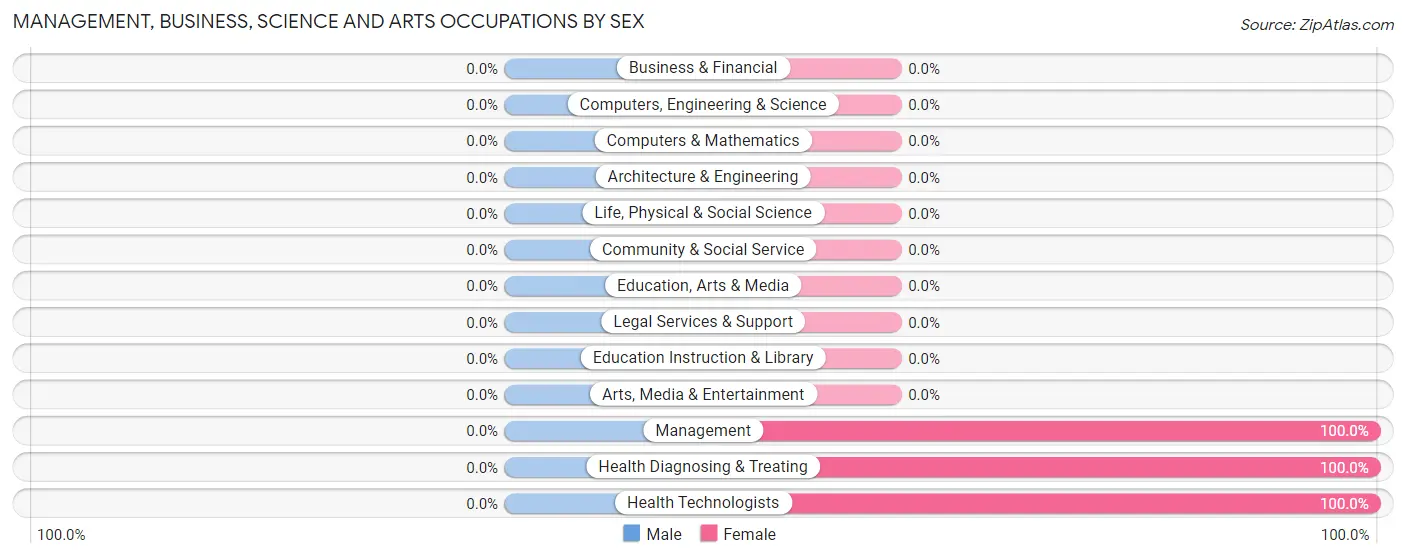
| Occupation | Male | Female |
| Management | 0 (0.0%) | 6 (100.0%) |
| Business & Financial | 0 (0.0%) | 0 (0.0%) |
| Computers, Engineering & Science | 0 (0.0%) | 0 (0.0%) |
| Computers & Mathematics | 0 (0.0%) | 0 (0.0%) |
| Architecture & Engineering | 0 (0.0%) | 0 (0.0%) |
| Life, Physical & Social Science | 0 (0.0%) | 0 (0.0%) |
| Community & Social Service | 0 (0.0%) | 0 (0.0%) |
| Education, Arts & Media | 0 (0.0%) | 0 (0.0%) |
| Legal Services & Support | 0 (0.0%) | 0 (0.0%) |
| Education Instruction & Library | 0 (0.0%) | 0 (0.0%) |
| Arts, Media & Entertainment | 0 (0.0%) | 0 (0.0%) |
| Health Diagnosing & Treating | 0 (0.0%) | 5 (100.0%) |
| Health Technologists | 0 (0.0%) | 5 (100.0%) |
| Total (Category) | 0 (0.0%) | 11 (100.0%) |
| Total (Overall) | 96 (76.2%) | 30 (23.8%) |
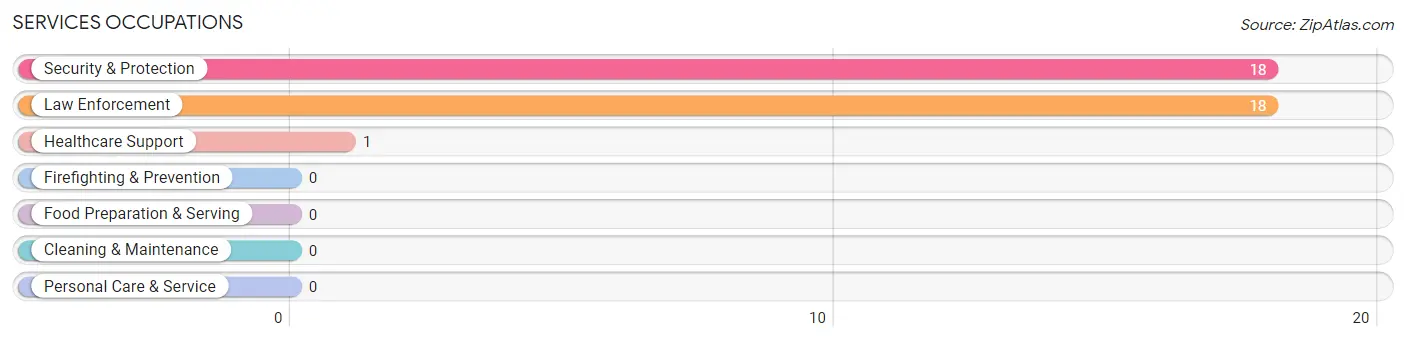
Services Occupations
The most common Services occupations in Gisela are Security & Protection (18 | 14.3%), Law Enforcement (18 | 14.3%), and Healthcare Support (1 | 0.8%).
Services Occupations by Sex
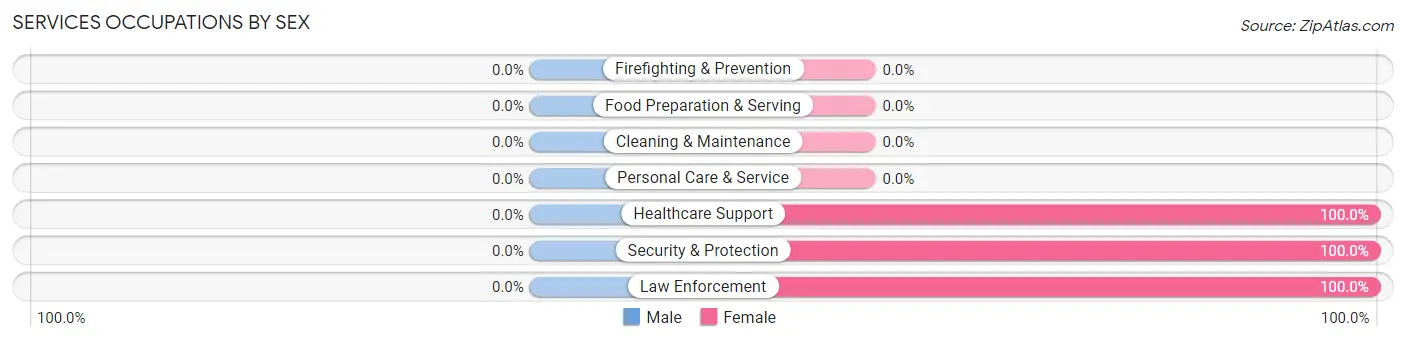
| Occupation | Male | Female |
| Healthcare Support | 0 (0.0%) | 1 (100.0%) |
| Security & Protection | 0 (0.0%) | 18 (100.0%) |
| Firefighting & Prevention | 0 (0.0%) | 0 (0.0%) |
| Law Enforcement | 0 (0.0%) | 18 (100.0%) |
| Food Preparation & Serving | 0 (0.0%) | 0 (0.0%) |
| Cleaning & Maintenance | 0 (0.0%) | 0 (0.0%) |
| Personal Care & Service | 0 (0.0%) | 0 (0.0%) |
| Total (Category) | 0 (0.0%) | 19 (100.0%) |
| Total (Overall) | 96 (76.2%) | 30 (23.8%) |
Sales and Office Occupations
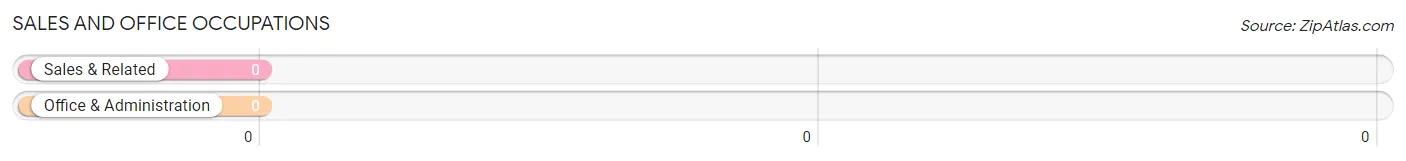
Sales and Office Occupations by Sex
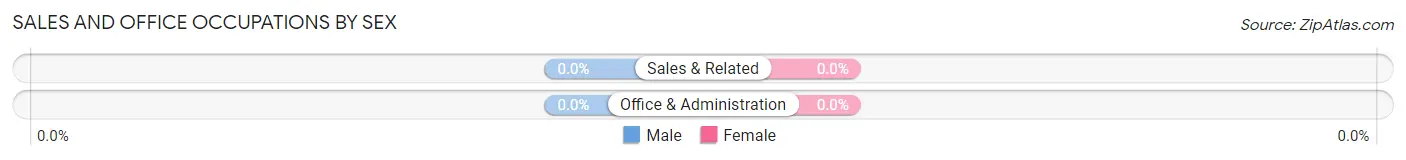
| Occupation | Male | Female |
| Sales & Related | 0 (0.0%) | 0 (0.0%) |
| Office & Administration | 0 (0.0%) | 0 (0.0%) |
| Total (Category) | 0 (0.0%) | 0 (0.0%) |
| Total (Overall) | 96 (76.2%) | 30 (23.8%) |
Natural Resources, Construction and Maintenance Occupations
The most common Natural Resources, Construction and Maintenance occupations in Gisela are , and Construction & Extraction (21 | 16.7%).
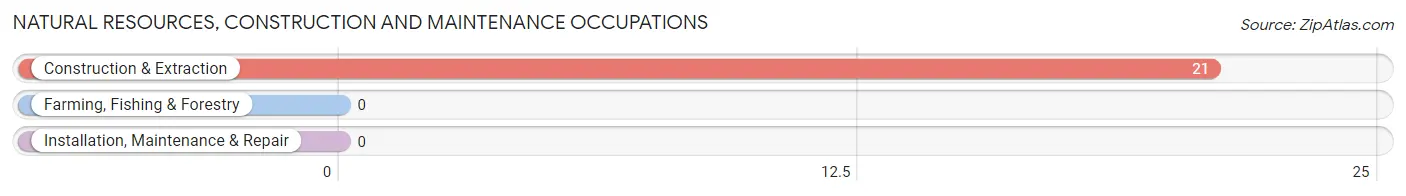
Natural Resources, Construction and Maintenance Occupations by Sex
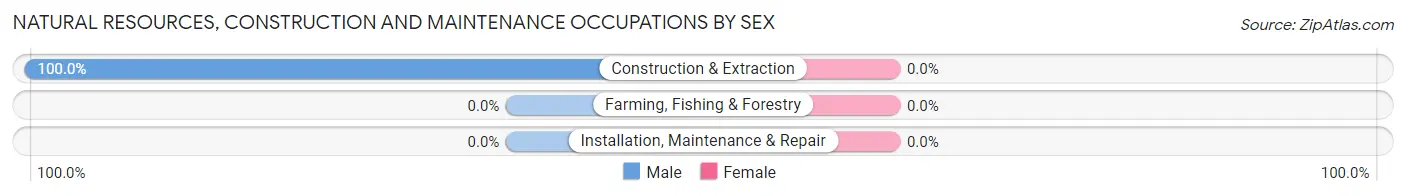
| Occupation | Male | Female |
| Farming, Fishing & Forestry | 0 (0.0%) | 0 (0.0%) |
| Construction & Extraction | 21 (100.0%) | 0 (0.0%) |
| Installation, Maintenance & Repair | 0 (0.0%) | 0 (0.0%) |
| Total (Category) | 21 (100.0%) | 0 (0.0%) |
| Total (Overall) | 96 (76.2%) | 30 (23.8%) |
Production, Transportation and Moving Occupations
The most common Production, Transportation and Moving occupations in Gisela are , and Production (75 | 59.5%).
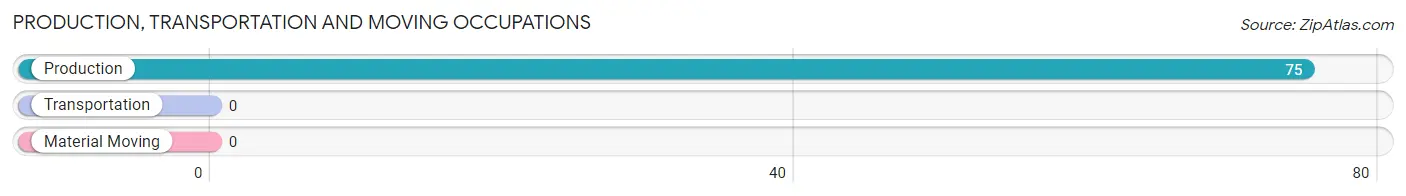
Production, Transportation and Moving Occupations by Sex
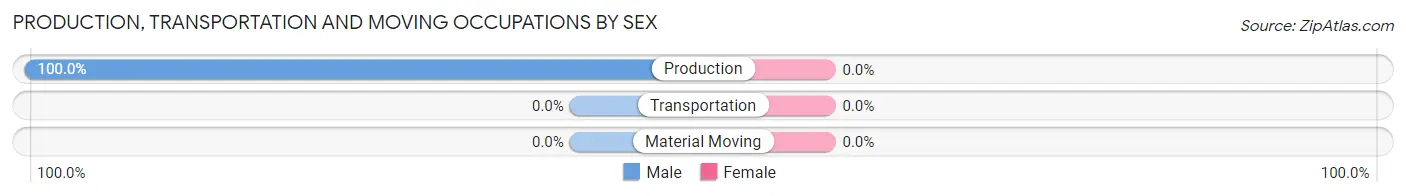
| Occupation | Male | Female |
| Production | 75 (100.0%) | 0 (0.0%) |
| Transportation | 0 (0.0%) | 0 (0.0%) |
| Material Moving | 0 (0.0%) | 0 (0.0%) |
| Total (Category) | 75 (100.0%) | 0 (0.0%) |
| Total (Overall) | 96 (76.2%) | 30 (23.8%) |
Employment Industries by Sex in Gisela
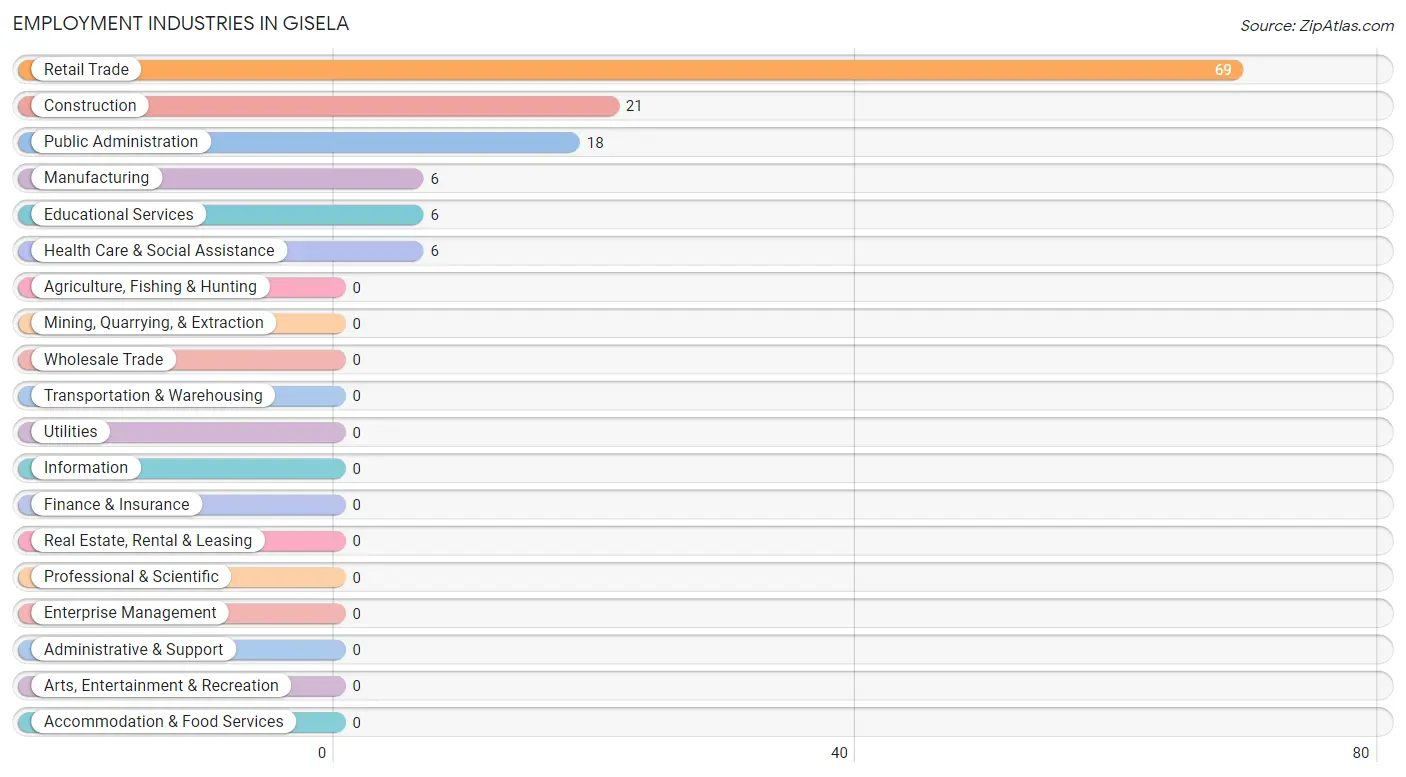
Employment Industries in Gisela
The major employment industries in Gisela include Retail Trade (69 | 54.8%), Construction (21 | 16.7%), Public Administration (18 | 14.3%), Manufacturing (6 | 4.8%), and Educational Services (6 | 4.8%).
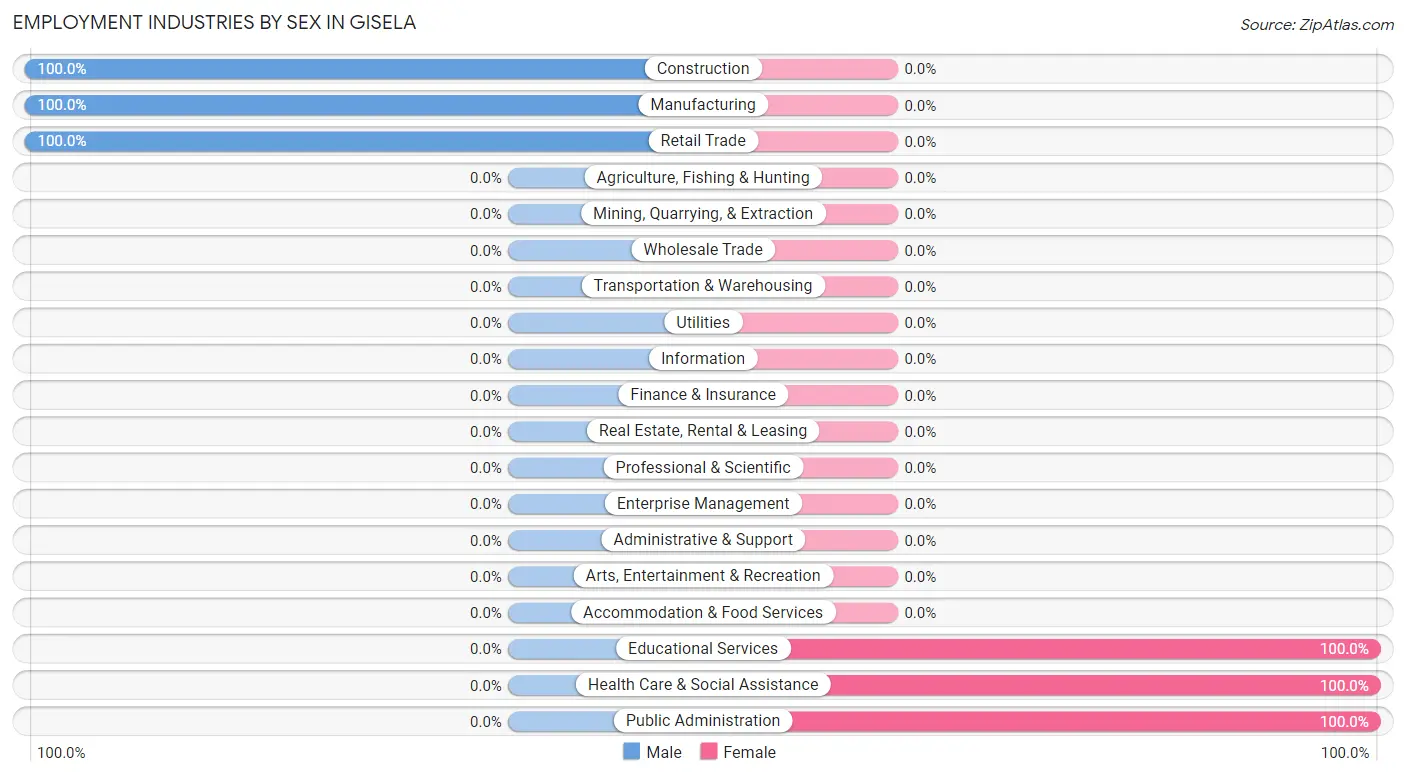
Employment Industries by Sex in Gisela
The Gisela industries that see more men than women are Construction (100.0%), Manufacturing (100.0%), and Retail Trade (100.0%), whereas the industries that tend to have a higher number of women are Educational Services (100.0%), Health Care & Social Assistance (100.0%), and Public Administration (100.0%).
| Industry | Male | Female |
| Agriculture, Fishing & Hunting | 0 (0.0%) | 0 (0.0%) |
| Mining, Quarrying, & Extraction | 0 (0.0%) | 0 (0.0%) |
| Construction | 21 (100.0%) | 0 (0.0%) |
| Manufacturing | 6 (100.0%) | 0 (0.0%) |
| Wholesale Trade | 0 (0.0%) | 0 (0.0%) |
| Retail Trade | 69 (100.0%) | 0 (0.0%) |
| Transportation & Warehousing | 0 (0.0%) | 0 (0.0%) |
| Utilities | 0 (0.0%) | 0 (0.0%) |
| Information | 0 (0.0%) | 0 (0.0%) |
| Finance & Insurance | 0 (0.0%) | 0 (0.0%) |
| Real Estate, Rental & Leasing | 0 (0.0%) | 0 (0.0%) |
| Professional & Scientific | 0 (0.0%) | 0 (0.0%) |
| Enterprise Management | 0 (0.0%) | 0 (0.0%) |
| Administrative & Support | 0 (0.0%) | 0 (0.0%) |
| Educational Services | 0 (0.0%) | 6 (100.0%) |
| Health Care & Social Assistance | 0 (0.0%) | 6 (100.0%) |
| Arts, Entertainment & Recreation | 0 (0.0%) | 0 (0.0%) |
| Accommodation & Food Services | 0 (0.0%) | 0 (0.0%) |
| Public Administration | 0 (0.0%) | 18 (100.0%) |
| Total | 96 (76.2%) | 30 (23.8%) |
Education in Gisela
School Enrollment in Gisela
The most common levels of schooling among the 152 students in Gisela are middle school (60 | 39.5%), elementary school (37 | 24.3%), and college / undergraduate (33 | 21.7%).
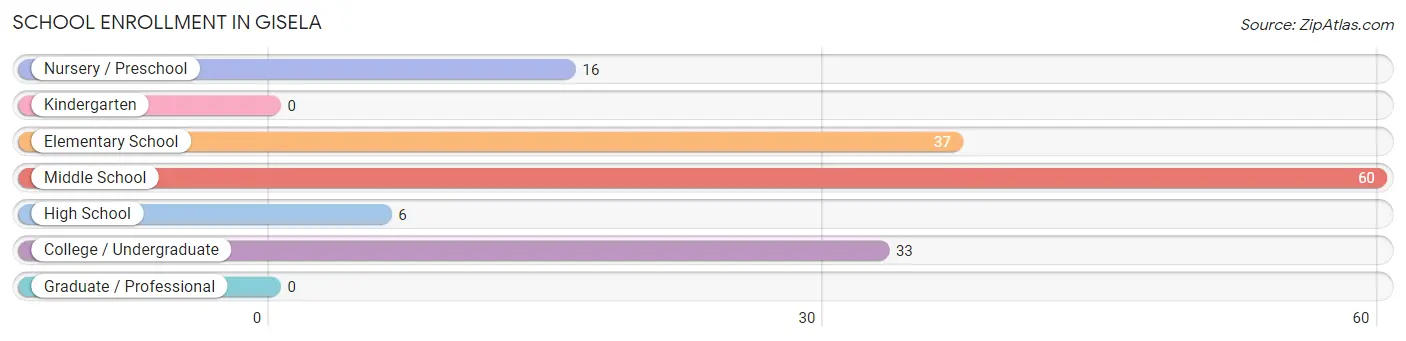
| School Level | # Students | % Students |
| Nursery / Preschool | 16 | 10.5% |
| Kindergarten | 0 | 0.0% |
| Elementary School | 37 | 24.3% |
| Middle School | 60 | 39.5% |
| High School | 6 | 4.0% |
| College / Undergraduate | 33 | 21.7% |
| Graduate / Professional | 0 | 0.0% |
| Total | 152 | 100.0% |
School Enrollment by Age by Funding Source in Gisela
Out of a total of 152 students who are enrolled in schools in Gisela, 6 (3.9%) attend a private institution, while the remaining 146 (96.1%) are enrolled in public schools. The age group of 35 years and over has the highest likelihood of being enrolled in private schools, with 5 (15.1% in the age bracket) enrolled. Conversely, the age group of 5 to 9 year old has the lowest likelihood of being enrolled in a private school, with 53 (100.0% in the age bracket) attending a public institution.
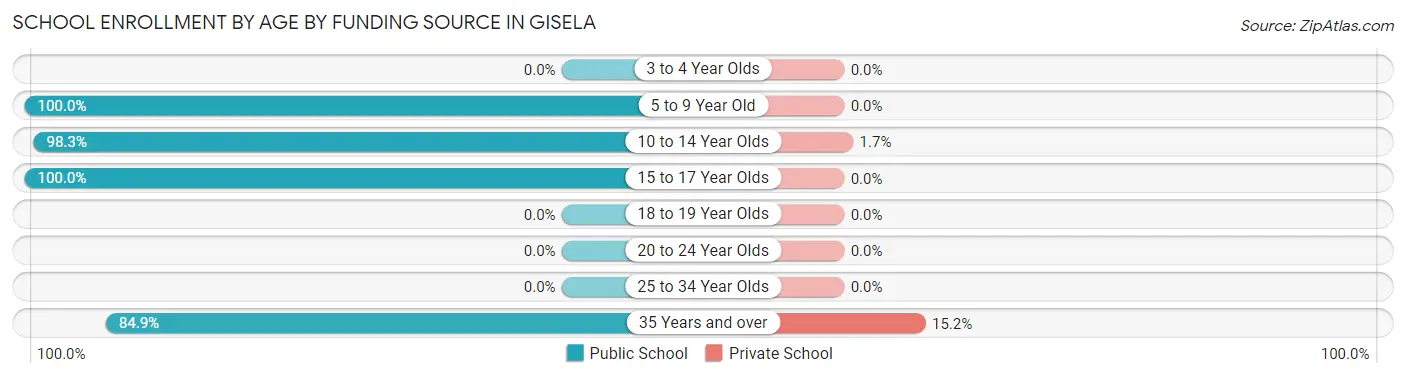
| Age Bracket | Public School | Private School |
| 3 to 4 Year Olds | 0 (0.0%) | 0 (0.0%) |
| 5 to 9 Year Old | 53 (100.0%) | 0 (0.0%) |
| 10 to 14 Year Olds | 59 (98.3%) | 1 (1.7%) |
| 15 to 17 Year Olds | 6 (100.0%) | 0 (0.0%) |
| 18 to 19 Year Olds | 0 (0.0%) | 0 (0.0%) |
| 20 to 24 Year Olds | 0 (0.0%) | 0 (0.0%) |
| 25 to 34 Year Olds | 0 (0.0%) | 0 (0.0%) |
| 35 Years and over | 28 (84.9%) | 5 (15.1%) |
| Total | 146 (96.1%) | 6 (3.9%) |
Educational Attainment by Field of Study in Gisela
Business (26 | 35.6%), bio, nature & agricultural (18 | 24.7%), psychology (10 | 13.7%), engineering (8 | 11.0%), and social sciences (6 | 8.2%) are the most common fields of study among 73 individuals in Gisela who have obtained a bachelor's degree or higher.
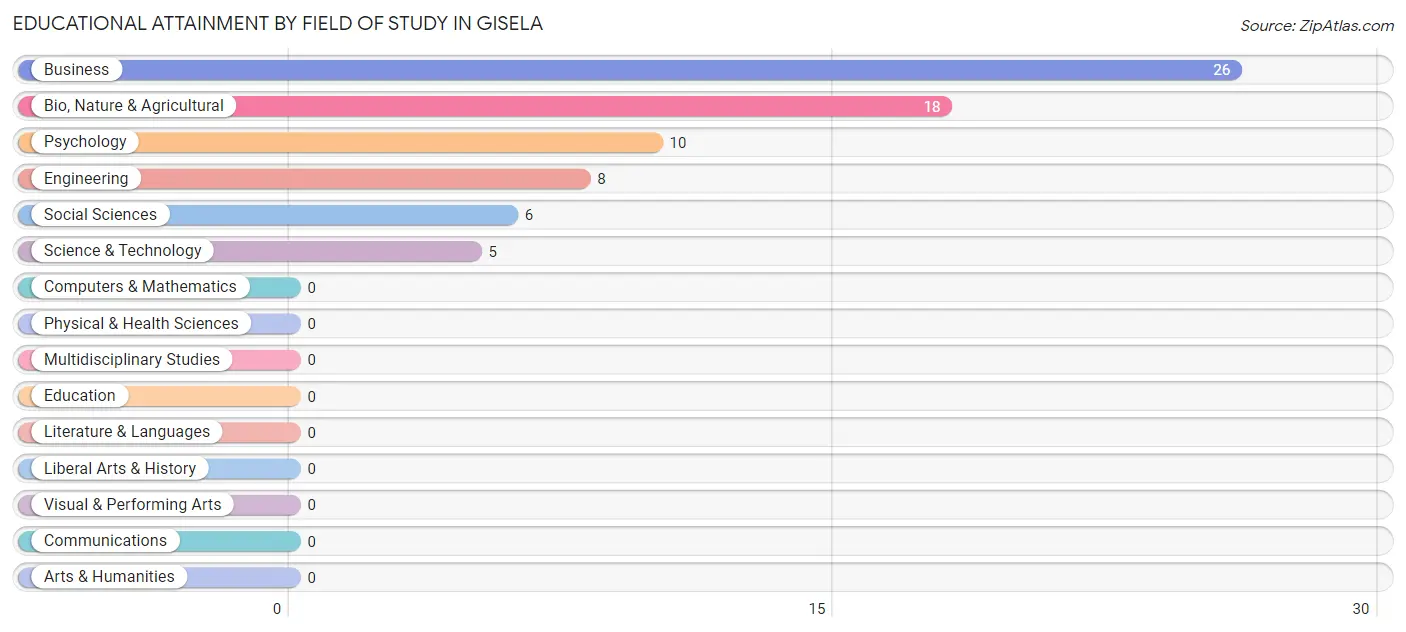
| Field of Study | # Graduates | % Graduates |
| Computers & Mathematics | 0 | 0.0% |
| Bio, Nature & Agricultural | 18 | 24.7% |
| Physical & Health Sciences | 0 | 0.0% |
| Psychology | 10 | 13.7% |
| Social Sciences | 6 | 8.2% |
| Engineering | 8 | 11.0% |
| Multidisciplinary Studies | 0 | 0.0% |
| Science & Technology | 5 | 6.9% |
| Business | 26 | 35.6% |
| Education | 0 | 0.0% |
| Literature & Languages | 0 | 0.0% |
| Liberal Arts & History | 0 | 0.0% |
| Visual & Performing Arts | 0 | 0.0% |
| Communications | 0 | 0.0% |
| Arts & Humanities | 0 | 0.0% |
| Total | 73 | 100.0% |
Transportation & Commute in Gisela
Vehicle Availability by Sex in Gisela
The most prevalent vehicle ownership categories in Gisela are males with 3 vehicles (79, accounting for 82.3%) and females with 3 vehicles (0, making up 263.3%).
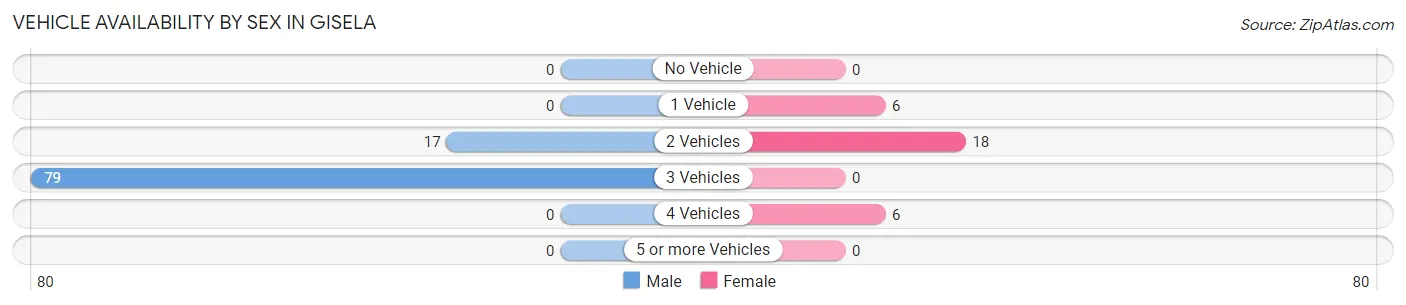
| Vehicles Available | Male | Female |
| No Vehicle | 0 (0.0%) | 0 (0.0%) |
| 1 Vehicle | 0 (0.0%) | 6 (20.0%) |
| 2 Vehicles | 17 (17.7%) | 18 (60.0%) |
| 3 Vehicles | 79 (82.3%) | 0 (0.0%) |
| 4 Vehicles | 0 (0.0%) | 6 (20.0%) |
| 5 or more Vehicles | 0 (0.0%) | 0 (0.0%) |
| Total | 96 (100.0%) | 30 (100.0%) |
Commute Time in Gisela
The most frequently occuring commute durations in Gisela are 30 to 34 minutes (24 commuters, 49.0%), 90 or more minutes (16 commuters, 32.7%), and 25 to 29 minutes (5 commuters, 10.2%).
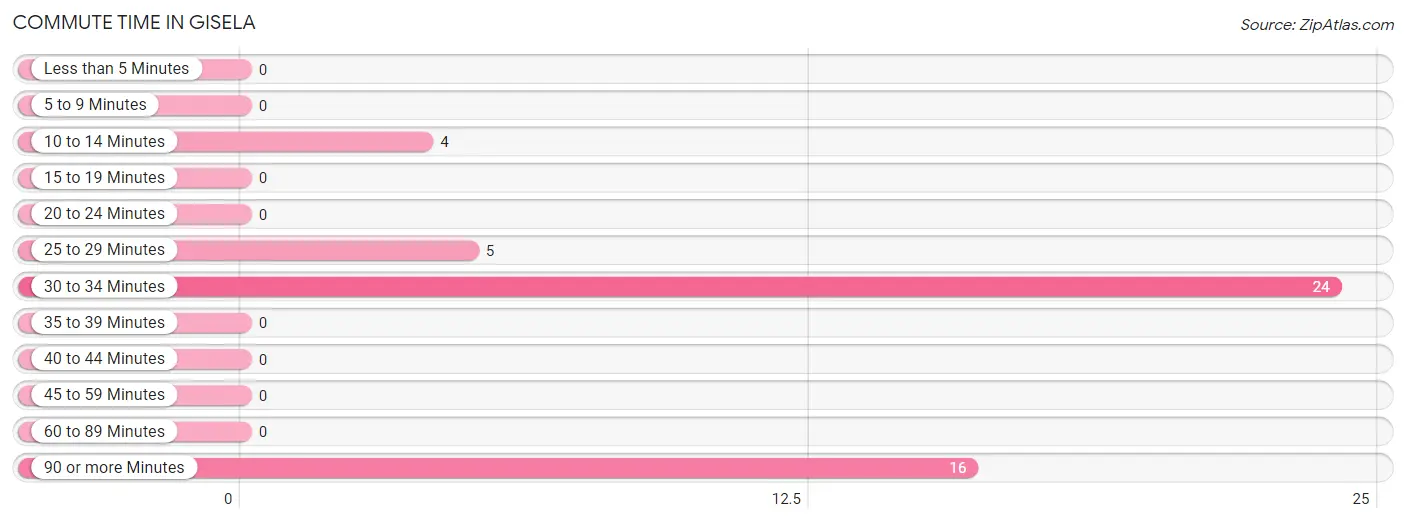
| Commute Time | # Commuters | % Commuters |
| Less than 5 Minutes | 0 | 0.0% |
| 5 to 9 Minutes | 0 | 0.0% |
| 10 to 14 Minutes | 4 | 8.2% |
| 15 to 19 Minutes | 0 | 0.0% |
| 20 to 24 Minutes | 0 | 0.0% |
| 25 to 29 Minutes | 5 | 10.2% |
| 30 to 34 Minutes | 24 | 49.0% |
| 35 to 39 Minutes | 0 | 0.0% |
| 40 to 44 Minutes | 0 | 0.0% |
| 45 to 59 Minutes | 0 | 0.0% |
| 60 to 89 Minutes | 0 | 0.0% |
| 90 or more Minutes | 16 | 32.7% |
Commute Time by Sex in Gisela
The most common commute times in Gisela are 90 or more minutes (16 commuters, 80.0%) for males and 30 to 34 minutes (24 commuters, 82.8%) for females.
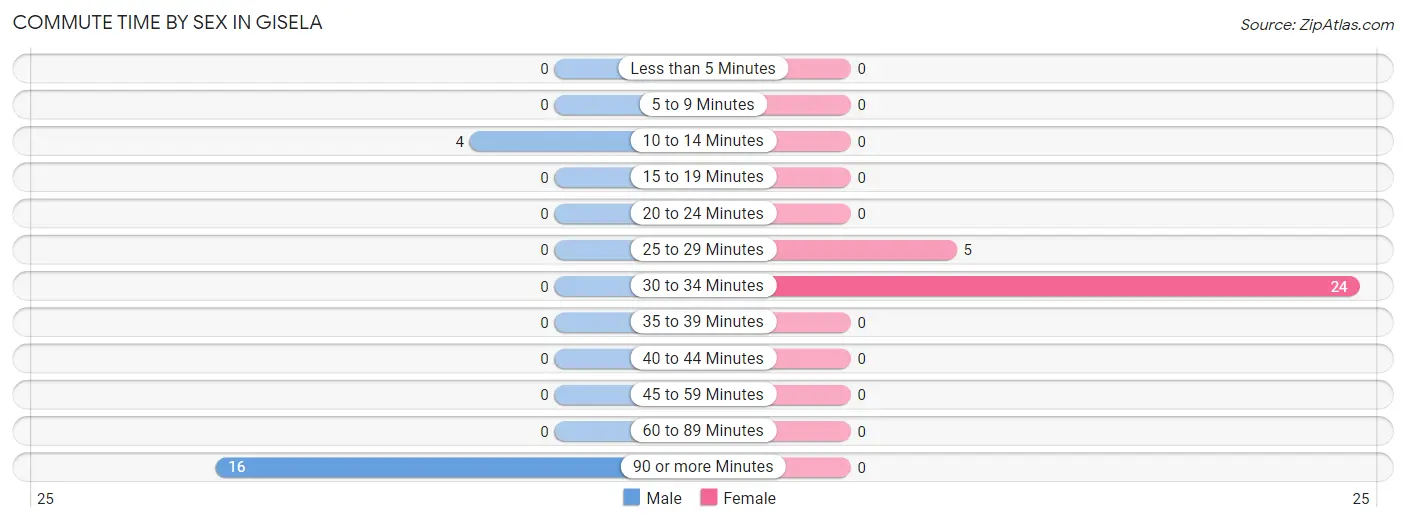
| Commute Time | Male | Female |
| Less than 5 Minutes | 0 (0.0%) | 0 (0.0%) |
| 5 to 9 Minutes | 0 (0.0%) | 0 (0.0%) |
| 10 to 14 Minutes | 4 (20.0%) | 0 (0.0%) |
| 15 to 19 Minutes | 0 (0.0%) | 0 (0.0%) |
| 20 to 24 Minutes | 0 (0.0%) | 0 (0.0%) |
| 25 to 29 Minutes | 0 (0.0%) | 5 (17.2%) |
| 30 to 34 Minutes | 0 (0.0%) | 24 (82.8%) |
| 35 to 39 Minutes | 0 (0.0%) | 0 (0.0%) |
| 40 to 44 Minutes | 0 (0.0%) | 0 (0.0%) |
| 45 to 59 Minutes | 0 (0.0%) | 0 (0.0%) |
| 60 to 89 Minutes | 0 (0.0%) | 0 (0.0%) |
| 90 or more Minutes | 16 (80.0%) | 0 (0.0%) |
Time of Departure to Work by Sex in Gisela
The most frequent times of departure to work in Gisela are 6:30 AM to 6:59 AM (10, 50.0%) for males and 7:00 AM to 7:29 AM (18, 62.1%) for females.
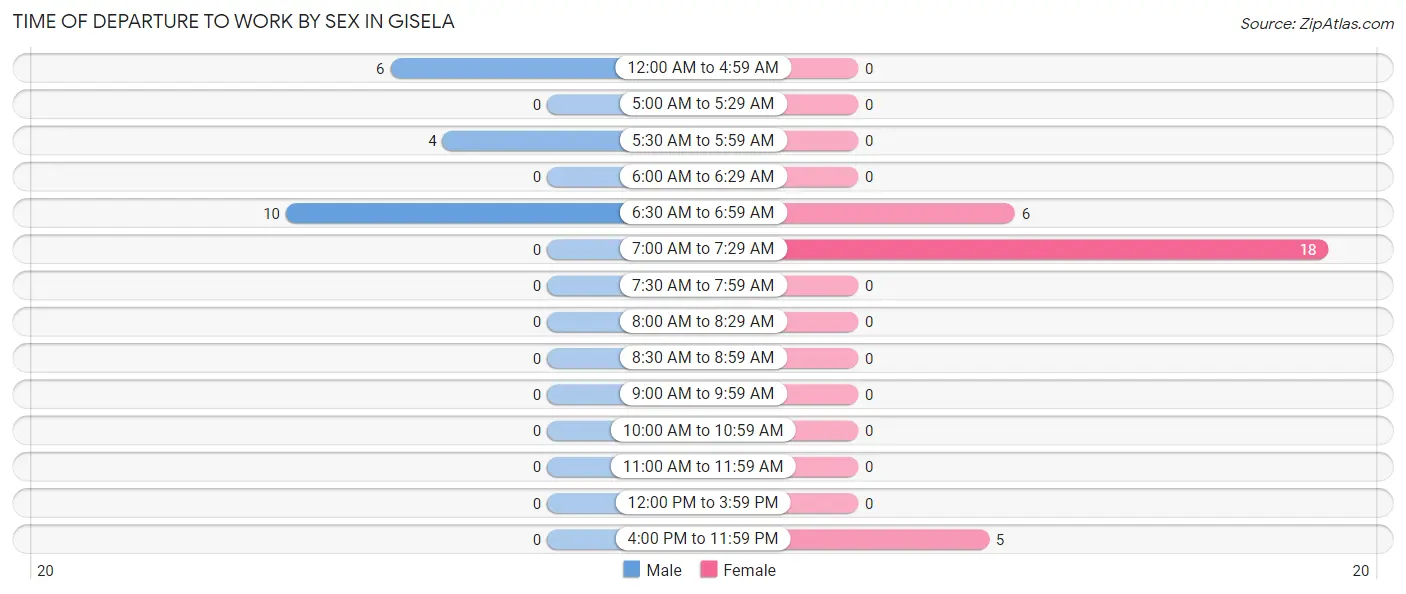
| Time of Departure | Male | Female |
| 12:00 AM to 4:59 AM | 6 (30.0%) | 0 (0.0%) |
| 5:00 AM to 5:29 AM | 0 (0.0%) | 0 (0.0%) |
| 5:30 AM to 5:59 AM | 4 (20.0%) | 0 (0.0%) |
| 6:00 AM to 6:29 AM | 0 (0.0%) | 0 (0.0%) |
| 6:30 AM to 6:59 AM | 10 (50.0%) | 6 (20.7%) |
| 7:00 AM to 7:29 AM | 0 (0.0%) | 18 (62.1%) |
| 7:30 AM to 7:59 AM | 0 (0.0%) | 0 (0.0%) |
| 8:00 AM to 8:29 AM | 0 (0.0%) | 0 (0.0%) |
| 8:30 AM to 8:59 AM | 0 (0.0%) | 0 (0.0%) |
| 9:00 AM to 9:59 AM | 0 (0.0%) | 0 (0.0%) |
| 10:00 AM to 10:59 AM | 0 (0.0%) | 0 (0.0%) |
| 11:00 AM to 11:59 AM | 0 (0.0%) | 0 (0.0%) |
| 12:00 PM to 3:59 PM | 0 (0.0%) | 0 (0.0%) |
| 4:00 PM to 11:59 PM | 0 (0.0%) | 5 (17.2%) |
| Total | 20 (100.0%) | 29 (100.0%) |
Housing Occupancy in Gisela
Occupancy by Ownership in Gisela
Of the total 285 dwellings in Gisela, owner-occupied units account for 285 (100.0%), while renter-occupied units make up 0 (0.0%).
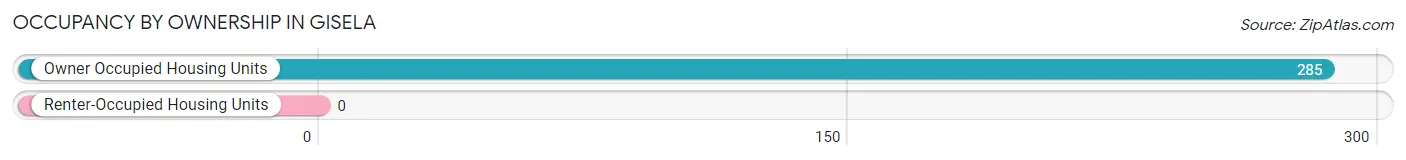
| Occupancy | # Housing Units | % Housing Units |
| Owner Occupied Housing Units | 285 | 100.0% |
| Renter-Occupied Housing Units | 0 | 0.0% |
| Total Occupied Housing Units | 285 | 100.0% |
Occupancy by Household Size in Gisela
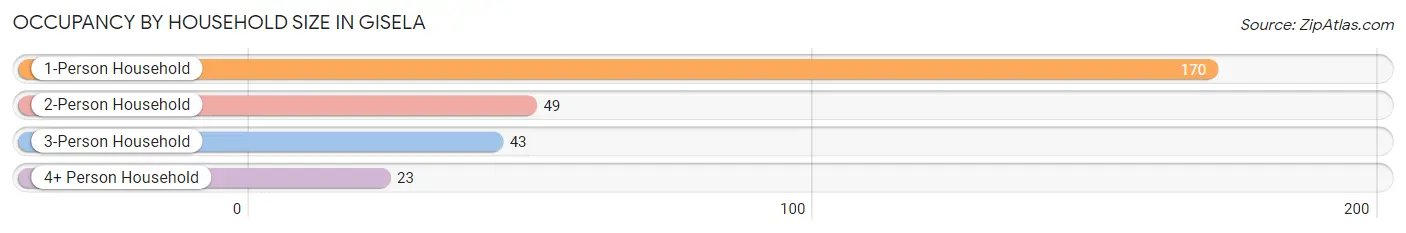
| Household Size | # Housing Units | % Housing Units |
| 1-Person Household | 170 | 59.7% |
| 2-Person Household | 49 | 17.2% |
| 3-Person Household | 43 | 15.1% |
| 4+ Person Household | 23 | 8.1% |
| Total Housing Units | 285 | 100.0% |
Occupancy by Ownership by Household Size in Gisela
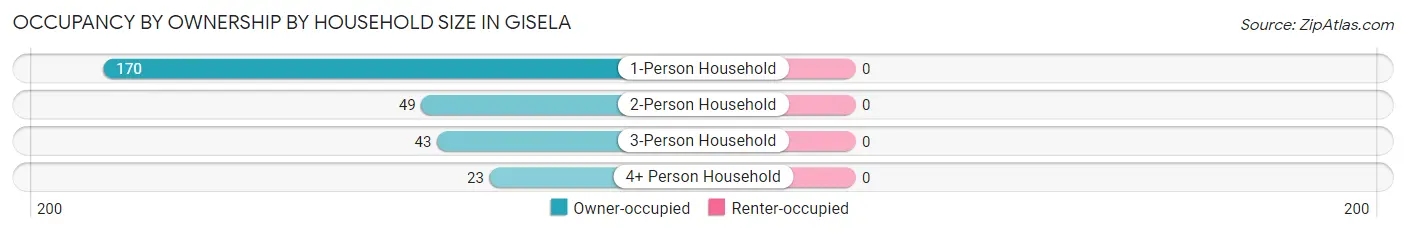
| Household Size | Owner-occupied | Renter-occupied |
| 1-Person Household | 170 (100.0%) | 0 (0.0%) |
| 2-Person Household | 49 (100.0%) | 0 (0.0%) |
| 3-Person Household | 43 (100.0%) | 0 (0.0%) |
| 4+ Person Household | 23 (100.0%) | 0 (0.0%) |
| Total Housing Units | 285 (100.0%) | 0 (0.0%) |
Occupancy by Educational Attainment in Gisela
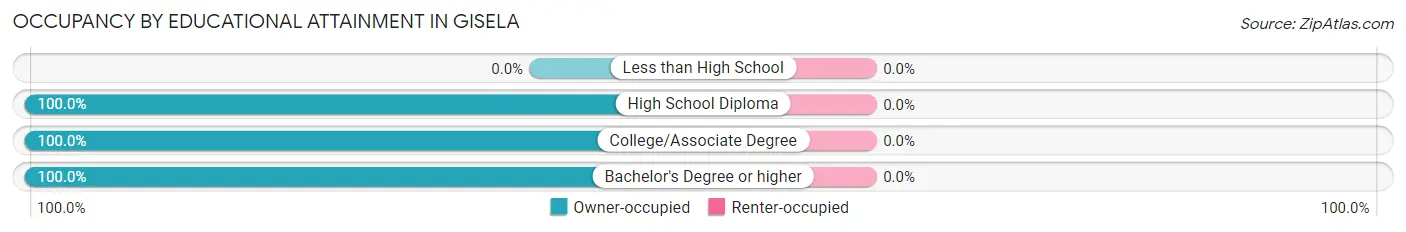
| Household Size | Owner-occupied | Renter-occupied |
| Less than High School | 0 (0.0%) | 0 (0.0%) |
| High School Diploma | 143 (100.0%) | 0 (0.0%) |
| College/Associate Degree | 91 (100.0%) | 0 (0.0%) |
| Bachelor's Degree or higher | 51 (100.0%) | 0 (0.0%) |
Occupancy by Age of Householder in Gisela
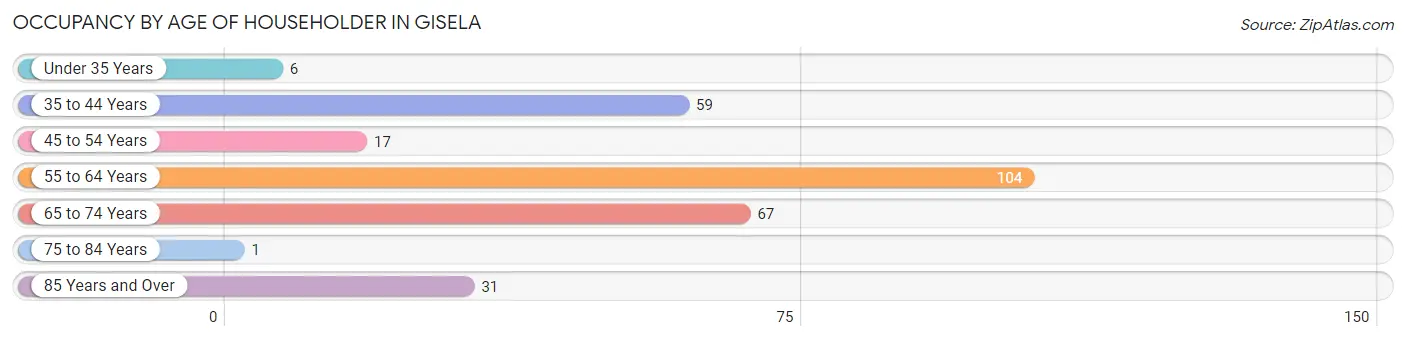
| Age Bracket | # Households | % Households |
| Under 35 Years | 6 | 2.1% |
| 35 to 44 Years | 59 | 20.7% |
| 45 to 54 Years | 17 | 6.0% |
| 55 to 64 Years | 104 | 36.5% |
| 65 to 74 Years | 67 | 23.5% |
| 75 to 84 Years | 1 | 0.4% |
| 85 Years and Over | 31 | 10.9% |
| Total | 285 | 100.0% |
Housing Finances in Gisela
Median Income by Occupancy in Gisela
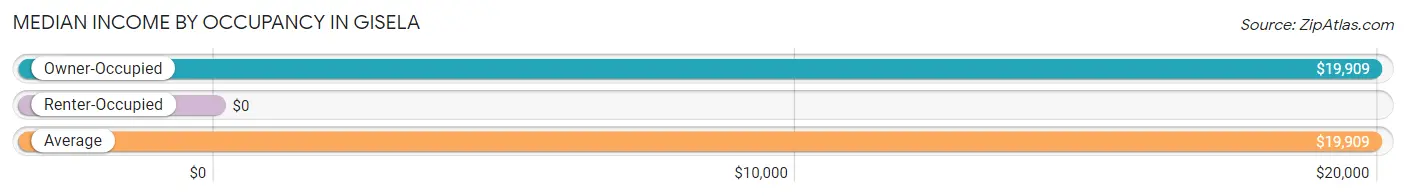
| Occupancy Type | # Households | Median Income |
| Owner-Occupied | 285 (100.0%) | $19,909 |
| Renter-Occupied | 0 (0.0%) | $0 |
| Average | 285 (100.0%) | $19,909 |
Occupancy by Householder Income Bracket in Gisela
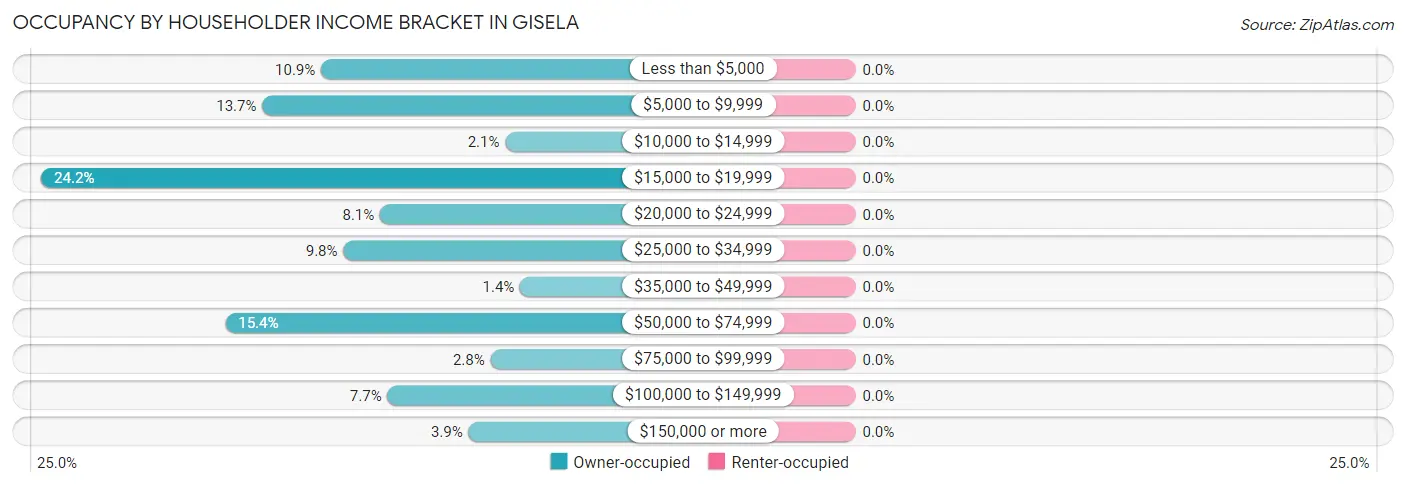
| Income Bracket | Owner-occupied | Renter-occupied |
| Less than $5,000 | 31 (10.9%) | 0 (0.0%) |
| $5,000 to $9,999 | 39 (13.7%) | 0 (0.0%) |
| $10,000 to $14,999 | 6 (2.1%) | 0 (0.0%) |
| $15,000 to $19,999 | 69 (24.2%) | 0 (0.0%) |
| $20,000 to $24,999 | 23 (8.1%) | 0 (0.0%) |
| $25,000 to $34,999 | 28 (9.8%) | 0 (0.0%) |
| $35,000 to $49,999 | 4 (1.4%) | 0 (0.0%) |
| $50,000 to $74,999 | 44 (15.4%) | 0 (0.0%) |
| $75,000 to $99,999 | 8 (2.8%) | 0 (0.0%) |
| $100,000 to $149,999 | 22 (7.7%) | 0 (0.0%) |
| $150,000 or more | 11 (3.9%) | 0 (0.0%) |
| Total | 285 (100.0%) | 0 (0.0%) |
Monthly Housing Cost Tiers in Gisela
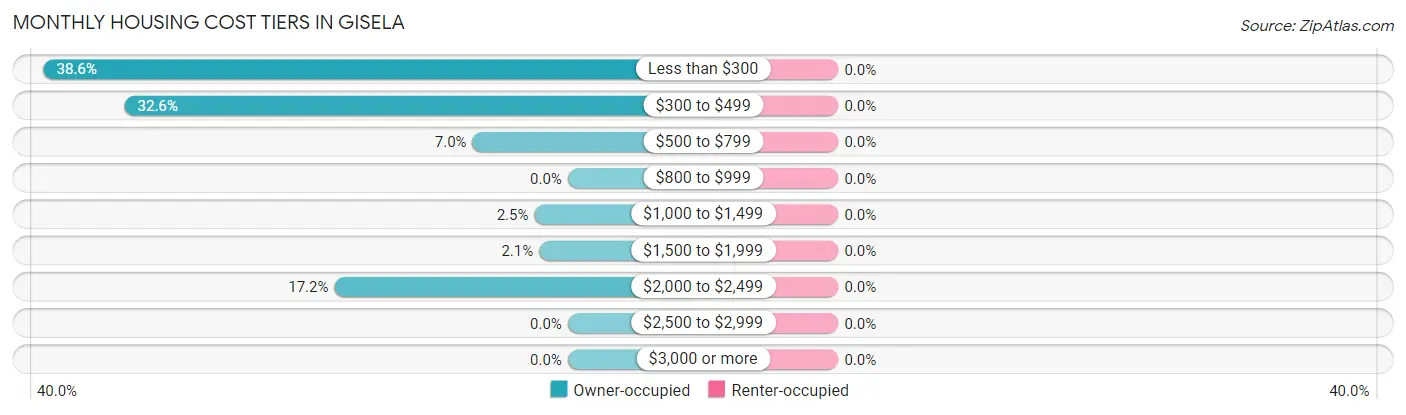
| Monthly Cost | Owner-occupied | Renter-occupied |
| Less than $300 | 110 (38.6%) | 0 (0.0%) |
| $300 to $499 | 93 (32.6%) | 0 (0.0%) |
| $500 to $799 | 20 (7.0%) | 0 (0.0%) |
| $800 to $999 | 0 (0.0%) | 0 (0.0%) |
| $1,000 to $1,499 | 7 (2.5%) | 0 (0.0%) |
| $1,500 to $1,999 | 6 (2.1%) | 0 (0.0%) |
| $2,000 to $2,499 | 49 (17.2%) | 0 (0.0%) |
| $2,500 to $2,999 | 0 (0.0%) | 0 (0.0%) |
| $3,000 or more | 0 (0.0%) | 0 (0.0%) |
| Total | 285 (100.0%) | 0 (0.0%) |
Physical Housing Characteristics in Gisela
Housing Structures in Gisela
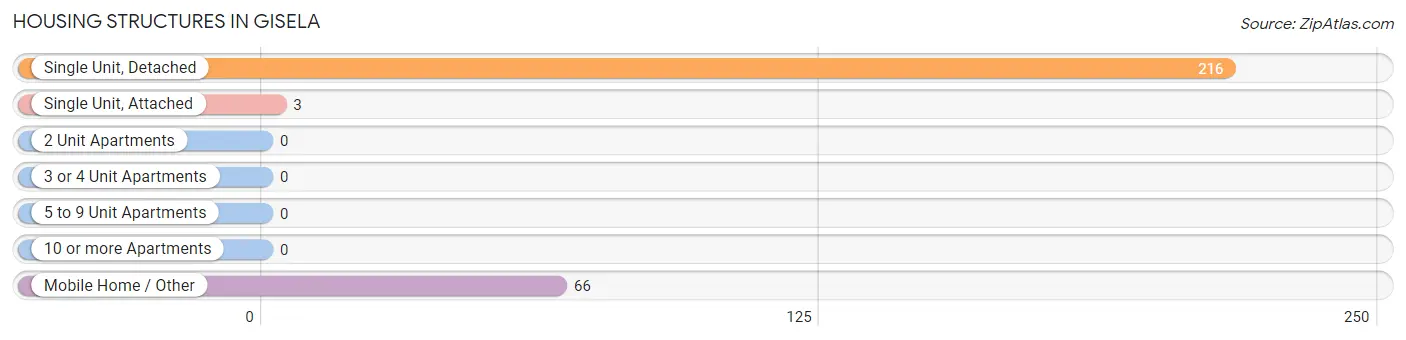
| Structure Type | # Housing Units | % Housing Units |
| Single Unit, Detached | 216 | 75.8% |
| Single Unit, Attached | 3 | 1.1% |
| 2 Unit Apartments | 0 | 0.0% |
| 3 or 4 Unit Apartments | 0 | 0.0% |
| 5 to 9 Unit Apartments | 0 | 0.0% |
| 10 or more Apartments | 0 | 0.0% |
| Mobile Home / Other | 66 | 23.2% |
| Total | 285 | 100.0% |
Housing Structures by Occupancy in Gisela
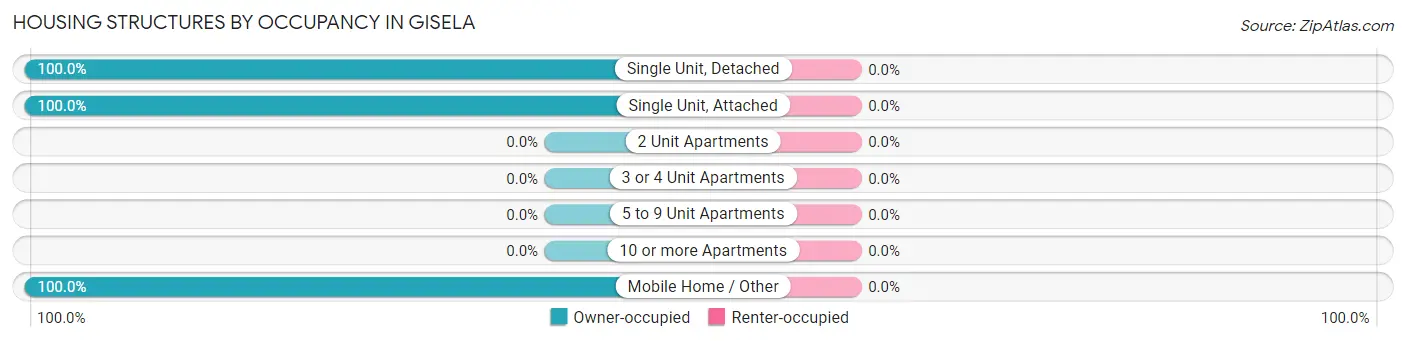
| Structure Type | Owner-occupied | Renter-occupied |
| Single Unit, Detached | 216 (100.0%) | 0 (0.0%) |
| Single Unit, Attached | 3 (100.0%) | 0 (0.0%) |
| 2 Unit Apartments | 0 (0.0%) | 0 (0.0%) |
| 3 or 4 Unit Apartments | 0 (0.0%) | 0 (0.0%) |
| 5 to 9 Unit Apartments | 0 (0.0%) | 0 (0.0%) |
| 10 or more Apartments | 0 (0.0%) | 0 (0.0%) |
| Mobile Home / Other | 66 (100.0%) | 0 (0.0%) |
| Total | 285 (100.0%) | 0 (0.0%) |
Housing Structures by Number of Rooms in Gisela
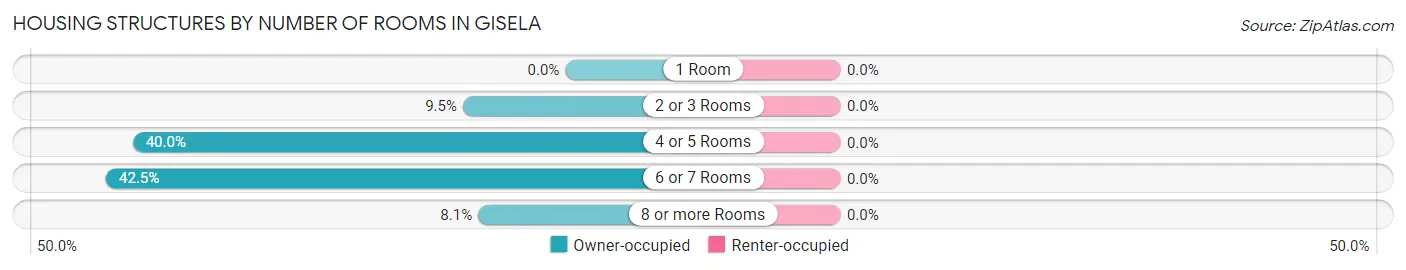
| Number of Rooms | Owner-occupied | Renter-occupied |
| 1 Room | 0 (0.0%) | 0 (0.0%) |
| 2 or 3 Rooms | 27 (9.5%) | 0 (0.0%) |
| 4 or 5 Rooms | 114 (40.0%) | 0 (0.0%) |
| 6 or 7 Rooms | 121 (42.5%) | 0 (0.0%) |
| 8 or more Rooms | 23 (8.1%) | 0 (0.0%) |
| Total | 285 (100.0%) | 0 (0.0%) |
Housing Structure by Heating Type in Gisela
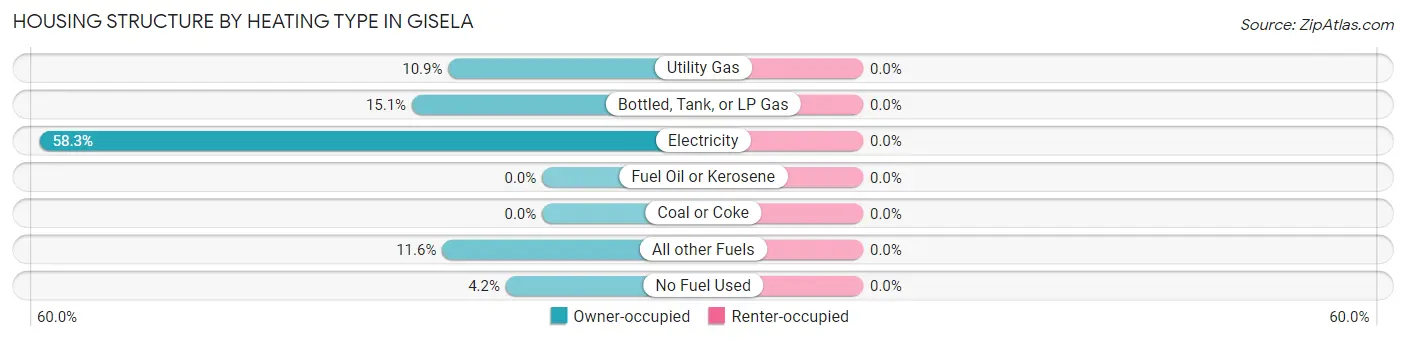
| Heating Type | Owner-occupied | Renter-occupied |
| Utility Gas | 31 (10.9%) | 0 (0.0%) |
| Bottled, Tank, or LP Gas | 43 (15.1%) | 0 (0.0%) |
| Electricity | 166 (58.3%) | 0 (0.0%) |
| Fuel Oil or Kerosene | 0 (0.0%) | 0 (0.0%) |
| Coal or Coke | 0 (0.0%) | 0 (0.0%) |
| All other Fuels | 33 (11.6%) | 0 (0.0%) |
| No Fuel Used | 12 (4.2%) | 0 (0.0%) |
| Total | 285 (100.0%) | 0 (0.0%) |
Household Vehicle Usage in Gisela
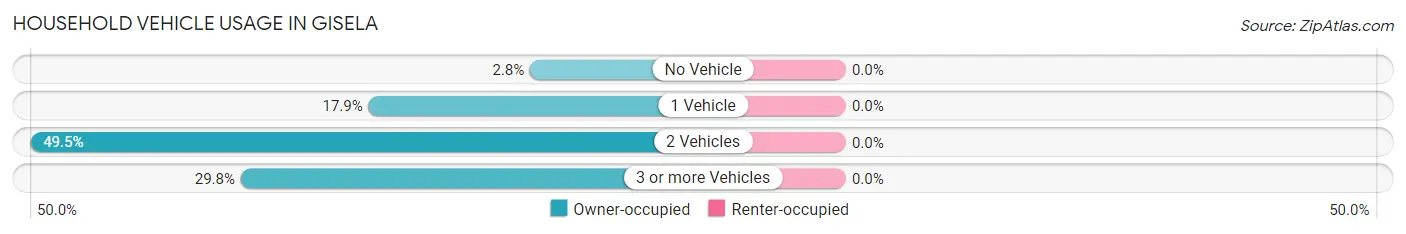
| Vehicles per Household | Owner-occupied | Renter-occupied |
| No Vehicle | 8 (2.8%) | 0 (0.0%) |
| 1 Vehicle | 51 (17.9%) | 0 (0.0%) |
| 2 Vehicles | 141 (49.5%) | 0 (0.0%) |
| 3 or more Vehicles | 85 (29.8%) | 0 (0.0%) |
| Total | 285 (100.0%) | 0 (0.0%) |
Real Estate & Mortgages in Gisela
Real Estate and Mortgage Overview in Gisela
| Characteristic | Without Mortgage | With Mortgage |
| Housing Units | 223 | 62 |
| Median Property Value | $138,800 | $400,000 |
| Median Household Income | $19,909 | $0 |
| Monthly Housing Costs | $301 | $0 |
| Real Estate Taxes | $834 | $0 |
Property Value by Mortgage Status in Gisela
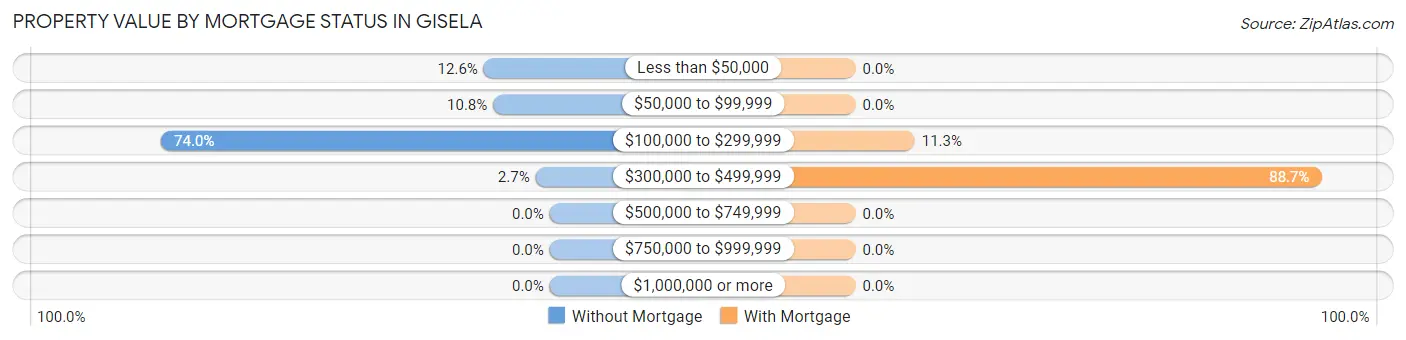
| Property Value | Without Mortgage | With Mortgage |
| Less than $50,000 | 28 (12.6%) | 0 (0.0%) |
| $50,000 to $99,999 | 24 (10.8%) | 0 (0.0%) |
| $100,000 to $299,999 | 165 (74.0%) | 7 (11.3%) |
| $300,000 to $499,999 | 6 (2.7%) | 55 (88.7%) |
| $500,000 to $749,999 | 0 (0.0%) | 0 (0.0%) |
| $750,000 to $999,999 | 0 (0.0%) | 0 (0.0%) |
| $1,000,000 or more | 0 (0.0%) | 0 (0.0%) |
| Total | 223 (100.0%) | 62 (100.0%) |
Household Income by Mortgage Status in Gisela
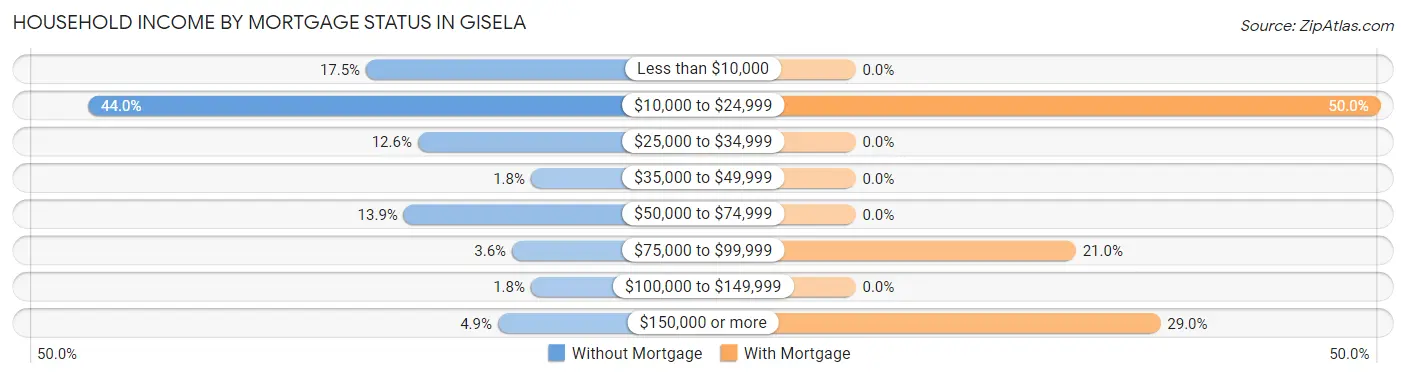
| Household Income | Without Mortgage | With Mortgage |
| Less than $10,000 | 39 (17.5%) | 0 (0.0%) |
| $10,000 to $24,999 | 98 (44.0%) | 31 (50.0%) |
| $25,000 to $34,999 | 28 (12.6%) | 0 (0.0%) |
| $35,000 to $49,999 | 4 (1.8%) | 0 (0.0%) |
| $50,000 to $74,999 | 31 (13.9%) | 0 (0.0%) |
| $75,000 to $99,999 | 8 (3.6%) | 13 (21.0%) |
| $100,000 to $149,999 | 4 (1.8%) | 0 (0.0%) |
| $150,000 or more | 11 (4.9%) | 18 (29.0%) |
| Total | 223 (100.0%) | 62 (100.0%) |
Property Value to Household Income Ratio in Gisela
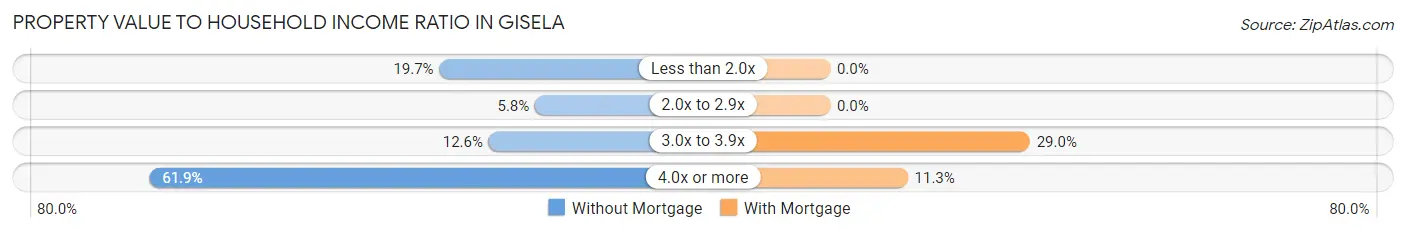
| Value-to-Income Ratio | Without Mortgage | With Mortgage |
| Less than 2.0x | 44 (19.7%) | 0 (0.0%) |
| 2.0x to 2.9x | 13 (5.8%) | 0 (0.0%) |
| 3.0x to 3.9x | 28 (12.6%) | 18 (29.0%) |
| 4.0x or more | 138 (61.9%) | 7 (11.3%) |
| Total | 223 (100.0%) | 62 (100.0%) |
Real Estate Taxes by Mortgage Status in Gisela
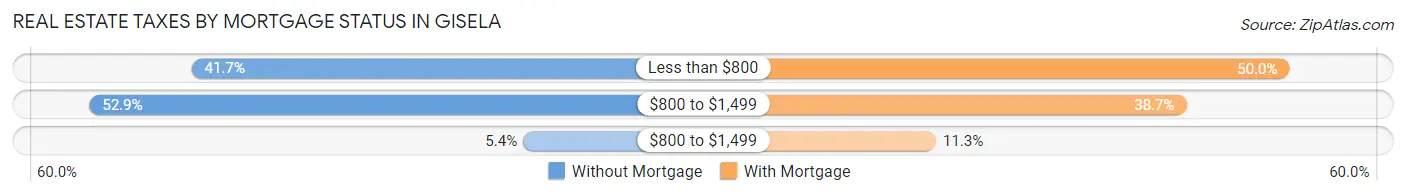
| Property Taxes | Without Mortgage | With Mortgage |
| Less than $800 | 93 (41.7%) | 31 (50.0%) |
| $800 to $1,499 | 118 (52.9%) | 24 (38.7%) |
| $800 to $1,499 | 12 (5.4%) | 7 (11.3%) |
| Total | 223 (100.0%) | 62 (100.0%) |
Health & Disability in Gisela
Health Insurance Coverage by Age in Gisela
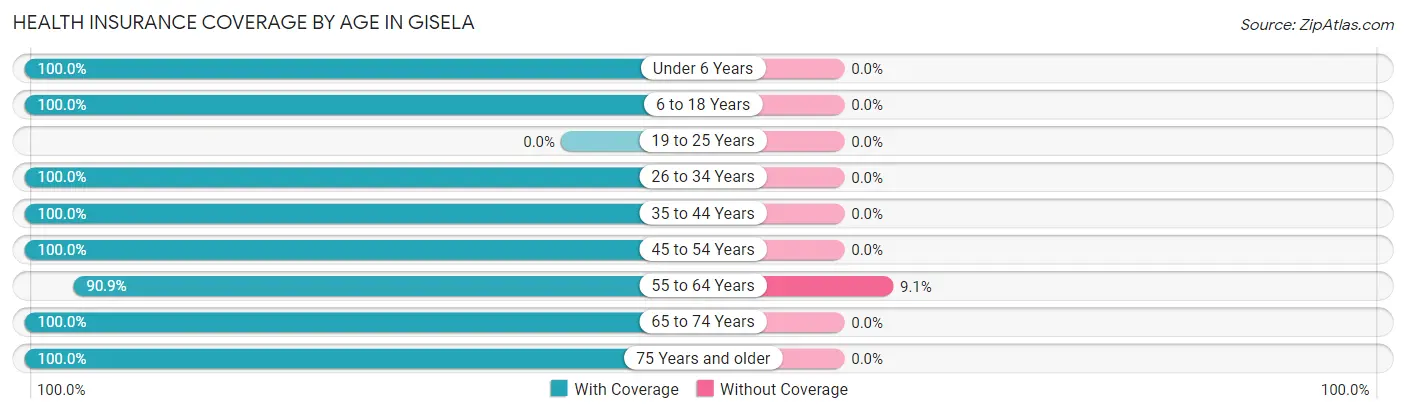
| Age Bracket | With Coverage | Without Coverage |
| Under 6 Years | 53 (100.0%) | 0 (0.0%) |
| 6 to 18 Years | 103 (100.0%) | 0 (0.0%) |
| 19 to 25 Years | 0 (0.0%) | 0 (0.0%) |
| 26 to 34 Years | 6 (100.0%) | 0 (0.0%) |
| 35 to 44 Years | 79 (100.0%) | 0 (0.0%) |
| 45 to 54 Years | 17 (100.0%) | 0 (0.0%) |
| 55 to 64 Years | 130 (90.9%) | 13 (9.1%) |
| 65 to 74 Years | 82 (100.0%) | 0 (0.0%) |
| 75 Years and older | 33 (100.0%) | 0 (0.0%) |
| Total | 503 (97.5%) | 13 (2.5%) |
Health Insurance Coverage by Citizenship Status in Gisela
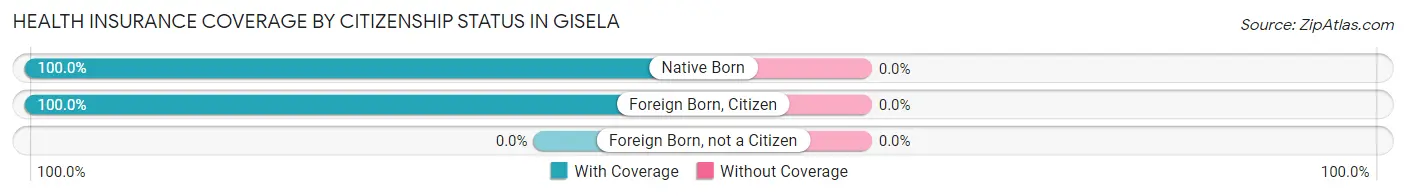
| Citizenship Status | With Coverage | Without Coverage |
| Native Born | 53 (100.0%) | 0 (0.0%) |
| Foreign Born, Citizen | 103 (100.0%) | 0 (0.0%) |
| Foreign Born, not a Citizen | 0 (0.0%) | 0 (0.0%) |
Health Insurance Coverage by Household Income in Gisela
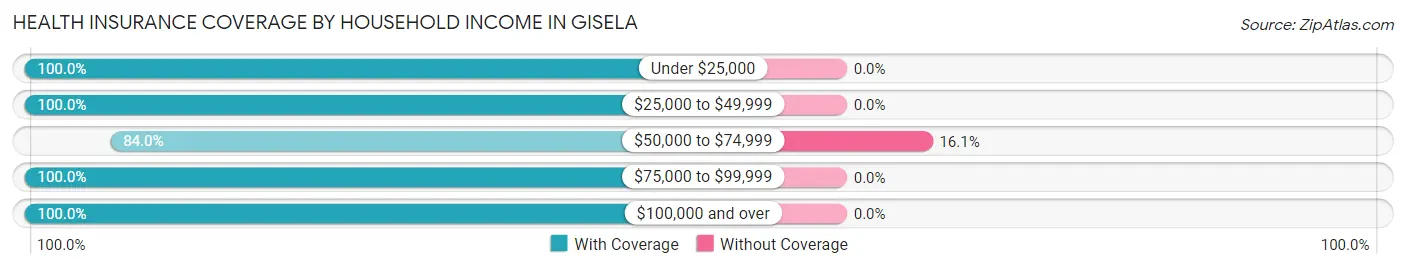
| Household Income | With Coverage | Without Coverage |
| Under $25,000 | 215 (100.0%) | 0 (0.0%) |
| $25,000 to $49,999 | 43 (100.0%) | 0 (0.0%) |
| $50,000 to $74,999 | 68 (84.0%) | 13 (16.1%) |
| $75,000 to $99,999 | 8 (100.0%) | 0 (0.0%) |
| $100,000 and over | 169 (100.0%) | 0 (0.0%) |
Public vs Private Health Insurance Coverage by Age in Gisela
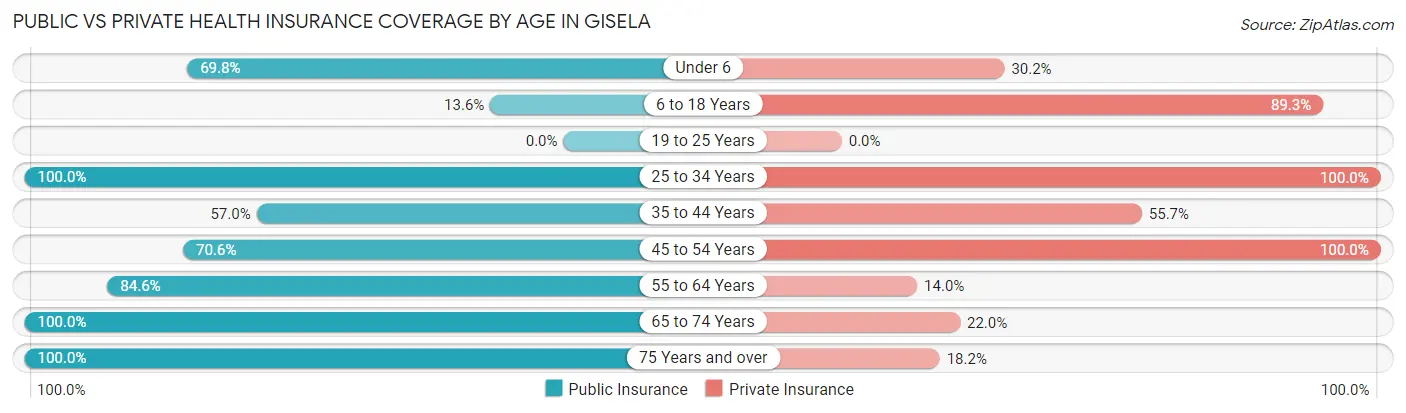
| Age Bracket | Public Insurance | Private Insurance |
| Under 6 | 37 (69.8%) | 16 (30.2%) |
| 6 to 18 Years | 14 (13.6%) | 92 (89.3%) |
| 19 to 25 Years | 0 (0.0%) | 0 (0.0%) |
| 25 to 34 Years | 6 (100.0%) | 6 (100.0%) |
| 35 to 44 Years | 45 (57.0%) | 44 (55.7%) |
| 45 to 54 Years | 12 (70.6%) | 17 (100.0%) |
| 55 to 64 Years | 121 (84.6%) | 20 (14.0%) |
| 65 to 74 Years | 82 (100.0%) | 18 (22.0%) |
| 75 Years and over | 33 (100.0%) | 6 (18.2%) |
| Total | 350 (67.8%) | 219 (42.4%) |
Disability Status by Sex by Age in Gisela
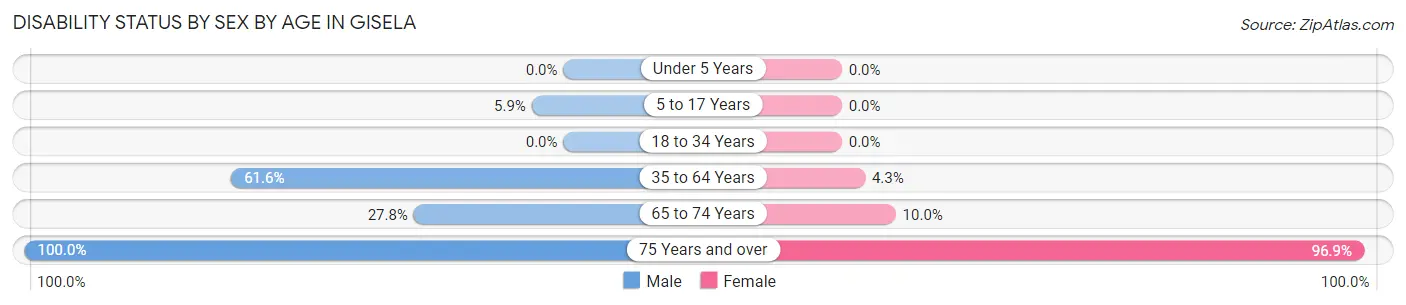
| Age Bracket | Male | Female |
| Under 5 Years | 0 (0.0%) | 0 (0.0%) |
| 5 to 17 Years | 3 (5.9%) | 0 (0.0%) |
| 18 to 34 Years | 0 (0.0%) | 0 (0.0%) |
| 35 to 64 Years | 90 (61.6%) | 4 (4.3%) |
| 65 to 74 Years | 20 (27.8%) | 1 (10.0%) |
| 75 Years and over | 1 (100.0%) | 31 (96.9%) |
Disability Class by Sex by Age in Gisela
Disability Class: Hearing Difficulty
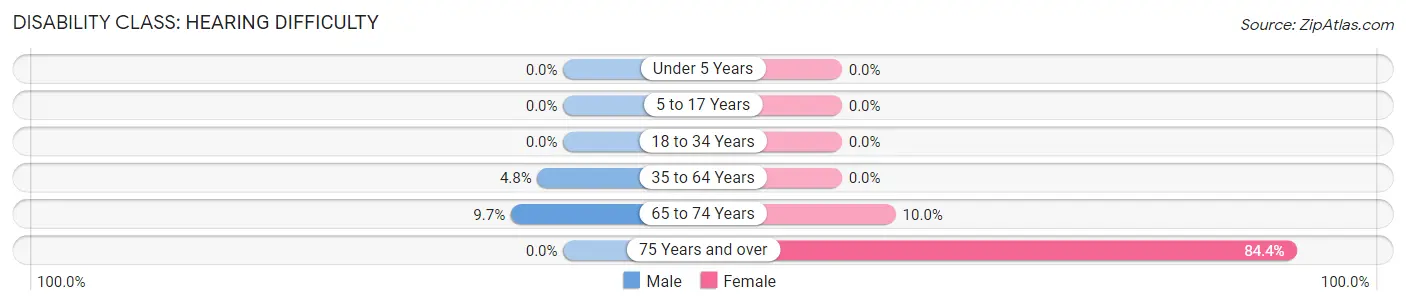
| Age Bracket | Male | Female |
| Under 5 Years | 0 (0.0%) | 0 (0.0%) |
| 5 to 17 Years | 0 (0.0%) | 0 (0.0%) |
| 18 to 34 Years | 0 (0.0%) | 0 (0.0%) |
| 35 to 64 Years | 7 (4.8%) | 0 (0.0%) |
| 65 to 74 Years | 7 (9.7%) | 1 (10.0%) |
| 75 Years and over | 0 (0.0%) | 27 (84.4%) |
Disability Class: Vision Difficulty
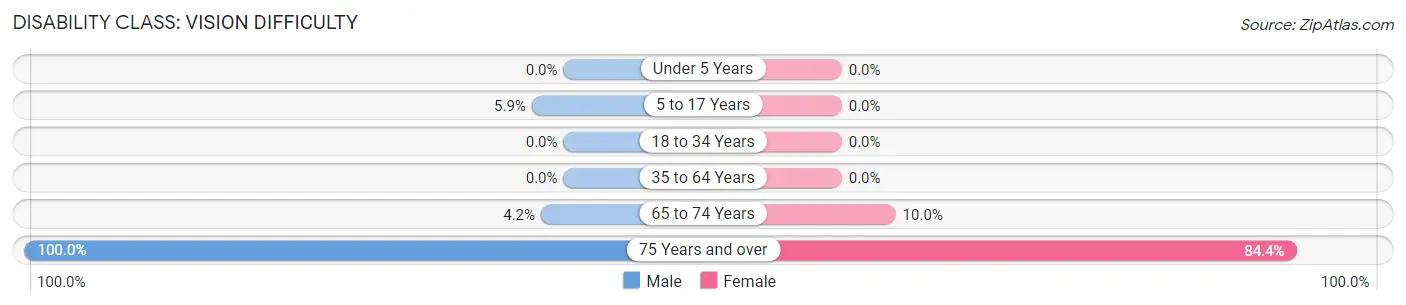
| Age Bracket | Male | Female |
| Under 5 Years | 0 (0.0%) | 0 (0.0%) |
| 5 to 17 Years | 3 (5.9%) | 0 (0.0%) |
| 18 to 34 Years | 0 (0.0%) | 0 (0.0%) |
| 35 to 64 Years | 0 (0.0%) | 0 (0.0%) |
| 65 to 74 Years | 3 (4.2%) | 1 (10.0%) |
| 75 Years and over | 1 (100.0%) | 27 (84.4%) |
Disability Class: Cognitive Difficulty
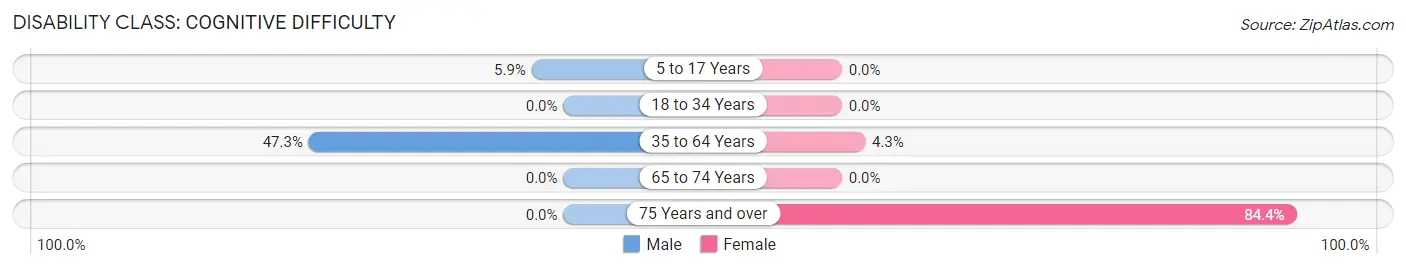
| Age Bracket | Male | Female |
| 5 to 17 Years | 3 (5.9%) | 0 (0.0%) |
| 18 to 34 Years | 0 (0.0%) | 0 (0.0%) |
| 35 to 64 Years | 69 (47.3%) | 4 (4.3%) |
| 65 to 74 Years | 0 (0.0%) | 0 (0.0%) |
| 75 Years and over | 0 (0.0%) | 27 (84.4%) |
Disability Class: Ambulatory Difficulty
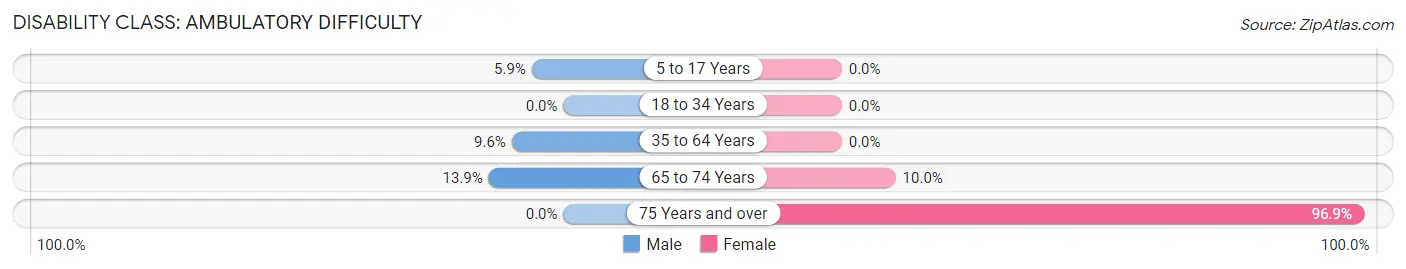
| Age Bracket | Male | Female |
| 5 to 17 Years | 3 (5.9%) | 0 (0.0%) |
| 18 to 34 Years | 0 (0.0%) | 0 (0.0%) |
| 35 to 64 Years | 14 (9.6%) | 0 (0.0%) |
| 65 to 74 Years | 10 (13.9%) | 1 (10.0%) |
| 75 Years and over | 0 (0.0%) | 31 (96.9%) |
Disability Class: Self-Care Difficulty
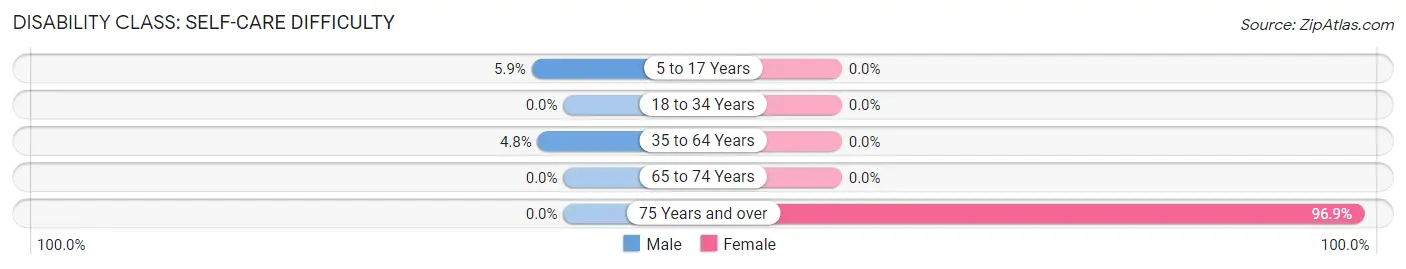
| Age Bracket | Male | Female |
| 5 to 17 Years | 3 (5.9%) | 0 (0.0%) |
| 18 to 34 Years | 0 (0.0%) | 0 (0.0%) |
| 35 to 64 Years | 7 (4.8%) | 0 (0.0%) |
| 65 to 74 Years | 0 (0.0%) | 0 (0.0%) |
| 75 Years and over | 0 (0.0%) | 31 (96.9%) |
Technology Access in Gisela
Computing Device Access in Gisela
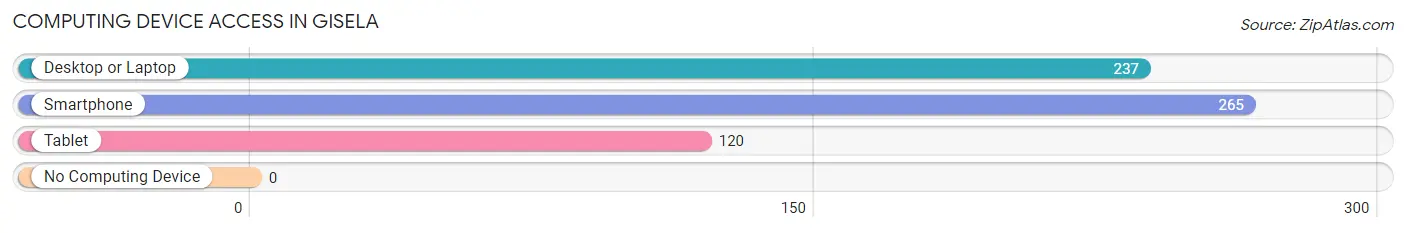
| Device Type | # Households | % Households |
| Desktop or Laptop | 237 | 83.2% |
| Smartphone | 265 | 93.0% |
| Tablet | 120 | 42.1% |
| No Computing Device | 0 | 0.0% |
| Total | 285 | 100.0% |
Internet Access in Gisela
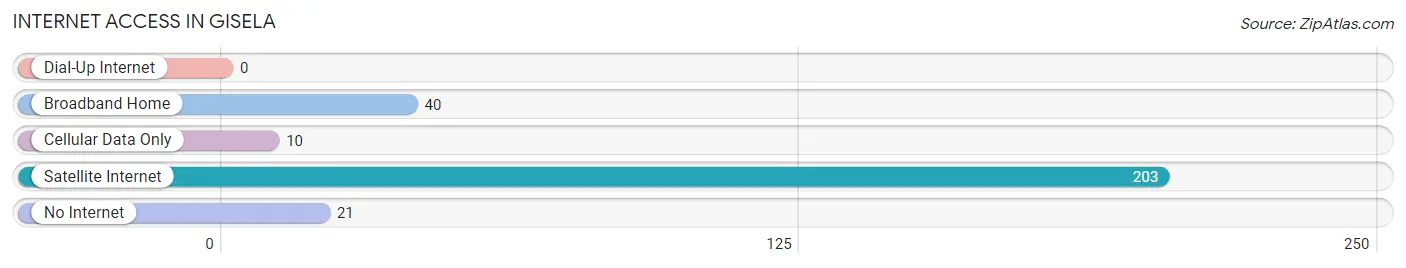
| Internet Type | # Households | % Households |
| Dial-Up Internet | 0 | 0.0% |
| Broadband Home | 40 | 14.0% |
| Cellular Data Only | 10 | 3.5% |
| Satellite Internet | 203 | 71.2% |
| No Internet | 21 | 7.4% |
| Total | 285 | 100.0% |
Gisela Summary
Gisela is a small unincorporated community located in Gila County, Arizona. It is situated in the Tonto National Forest, approximately 10 miles east of Payson. The town is located along the banks of the East Verde River, and is surrounded by the Mogollon Rim and the Mazatzal Mountains. Gisela is a rural community with a population of approximately 200 people.
History
Gisela was founded in 1882 by German immigrant, John Gisela. He was a rancher and miner who had come to Arizona in search of gold. He established a ranch and a small store in the area, and the town was named after him. The town grew slowly, and by the early 1900s, it had become a popular destination for tourists and hunters.
In the 1920s, Gisela was a thriving community with a population of over 500 people. It had a post office, a school, a hotel, a general store, and several other businesses. The town was also home to a number of churches, including the Gisela Methodist Church, which was founded in 1921.
In the 1950s, the population of Gisela began to decline as people moved away in search of better opportunities. By the 1970s, the population had dropped to just over 200 people. The town has remained relatively unchanged since then, and today it is still a small, rural community.
Geography
Gisela is located in the Tonto National Forest, approximately 10 miles east of Payson. The town is situated along the banks of the East Verde River, and is surrounded by the Mogollon Rim and the Mazatzal Mountains. The area is known for its scenic beauty, and is a popular destination for hikers, campers, and other outdoor enthusiasts.
The climate in Gisela is semi-arid, with hot summers and mild winters. The average annual temperature is around 70 degrees Fahrenheit, and the average annual precipitation is around 15 inches.
Economy
The economy of Gisela is largely based on tourism and agriculture. The town is home to several small businesses, including a general store, a restaurant, and a gas station. There are also several small farms in the area, which produce hay, alfalfa, and other crops.
The town is also home to a number of recreational activities, including fishing, hunting, and camping. The nearby Tonto National Forest offers a variety of outdoor activities, including hiking, biking, and horseback riding.
Demographics
As of the 2010 census, the population of Gisela was approximately 200 people. The racial makeup of the town was 97.5% White, 0.5% Native American, 0.5% Asian, and 1.5% from other races. The median household income was $35,000, and the median age was 44 years.
Gisela is a small, rural community with a strong sense of community. The town is home to a number of churches, and there are several community events throughout the year, including an annual rodeo and a Fourth of July celebration. The town is also home to a number of recreational activities, and is a popular destination for outdoor enthusiasts.
Common Questions
What is Per Capita Income in Gisela?
Per Capita income in Gisela is $21,387.
What is the Median Family Income in Gisela?
Median Family Income in Gisela is $67,772.
What is the Median Household income in Gisela?
Median Household Income in Gisela is $19,909.
What is Income or Wage Gap in Gisela?
Income or Wage Gap in Gisela is 62.9%.
Women in Gisela earn 37.1 cents for every dollar earned by a man.
What is Inequality or Gini Index in Gisela?
Inequality or Gini Index in Gisela is 0.55.
What is the Total Population of Gisela?
Total Population of Gisela is 516.
What is the Total Male Population of Gisela?
Total Male Population of Gisela is 270.
What is the Total Female Population of Gisela?
Total Female Population of Gisela is 246.
What is the Ratio of Males per 100 Females in Gisela?
There are 109.76 Males per 100 Females in Gisela.
What is the Ratio of Females per 100 Males in Gisela?
There are 91.11 Females per 100 Males in Gisela.
What is the Median Population Age in Gisela?
Median Population Age in Gisela is 52.0 Years.
What is the Average Family Size in Gisela
Average Family Size in Gisela is 3.1 People.
What is the Average Household Size in Gisela
Average Household Size in Gisela is 1.8 People.
How Large is the Labor Force in Gisela?
There are 126 People in the Labor Forcein in Gisela.
What is the Percentage of People in the Labor Force in Gisela?
34.4% of People are in the Labor Force in Gisela.