Zip Codes with the Highest Percentage of Population Employed in Security & Protection in Prescott Valley, AZ
RELATED REPORTS & OPTIONS
Security & Protection
Prescott Valley
Compare Zip Codes
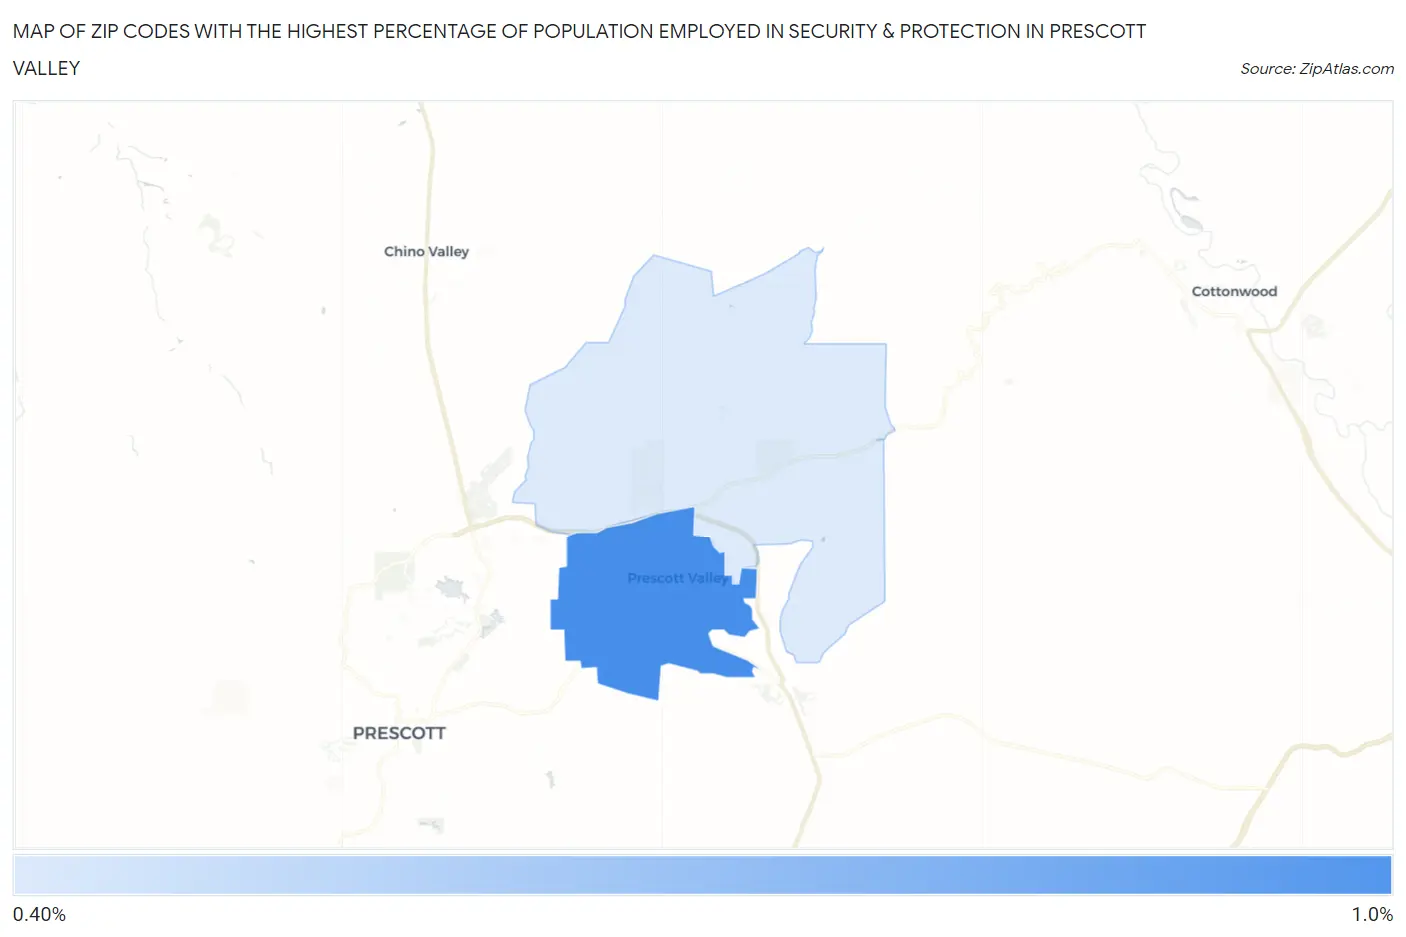
Map of Zip Codes with the Highest Percentage of Population Employed in Security & Protection in Prescott Valley
0.48%
0.92%
Zip Codes with the Highest Percentage of Population Employed in Security & Protection in Prescott Valley, AZ
| Zip Code | % Employed | vs State | vs National | |
| 1. | 86314 | 0.92% | 2.5%(-1.53)#314 | 2.1%(-1.22)#20,626 |
| 2. | 86315 | 0.48% | 2.5%(-1.97)#329 | 2.1%(-1.67)#23,349 |
1
Common Questions
What are the Top Zip Codes with the Highest Percentage of Population Employed in Security & Protection in Prescott Valley, AZ?
Top Zip Codes with the Highest Percentage of Population Employed in Security & Protection in Prescott Valley, AZ are:
What zip code has the Highest Percentage of Population Employed in Security & Protection in Prescott Valley, AZ?
86314 has the Highest Percentage of Population Employed in Security & Protection in Prescott Valley, AZ with 0.92%.
What is the Percentage of Population Employed in Security & Protection in Prescott Valley, AZ?
Percentage of Population Employed in Security & Protection in Prescott Valley is 0.87%.
What is the Percentage of Population Employed in Security & Protection in Arizona?
Percentage of Population Employed in Security & Protection in Arizona is 2.5%.
What is the Percentage of Population Employed in Security & Protection in the United States?
Percentage of Population Employed in Security & Protection in the United States is 2.1%.