Sunizona, AZ Map & Demographics
Sunizona Map
Sunizona Overview
$17,641
PER CAPITA INCOME
$21,375
AVG HOUSEHOLD INCOME
0.40
INEQUALITY / GINI INDEX
217
TOTAL POPULATION
124
MALE POPULATION
93
FEMALE POPULATION
133.33
MALES / 100 FEMALES
75.00
FEMALES / 100 MALES
58.8
MEDIAN AGE
3.0
AVG FAMILY SIZE
1.8
AVG HOUSEHOLD SIZE
57
LABOR FORCE [ PEOPLE ]
33.5%
PERCENT IN LABOR FORCE
Income in Sunizona
Income Overview in Sunizona
| Characteristic | Number | Measure |
| Per Capita Income | 217 | $17,641 |
| Median Family Income | 44 | $0 |
| Mean Family Income | 44 | $42,932 |
| Median Household Income | 123 | $21,375 |
| Mean Household Income | 123 | $31,540 |
| Income Deficit | 44 | $0 |
| Wage / Income Gap (%) | 217 | 0.00% |
| Wage / Income Gap ($) | 217 | 100.00¢ per $1 |
| Gini / Inequality Index | 217 | 0.40 |
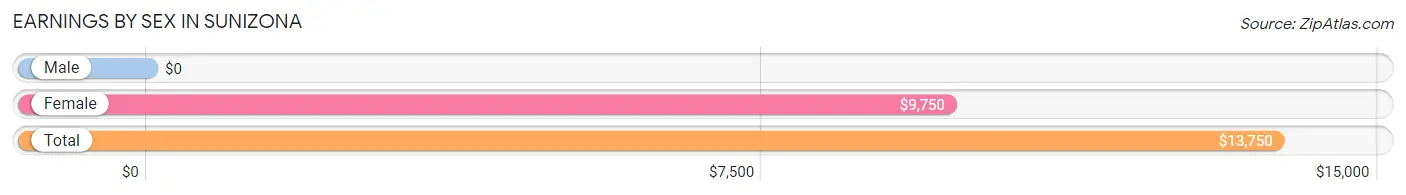
Earnings by Sex in Sunizona
| Sex | Number | Average Earnings |
| Male | 42 (64.6%) | $0 |
| Female | 23 (35.4%) | $9,750 |
| Total | 65 (100.0%) | $13,750 |
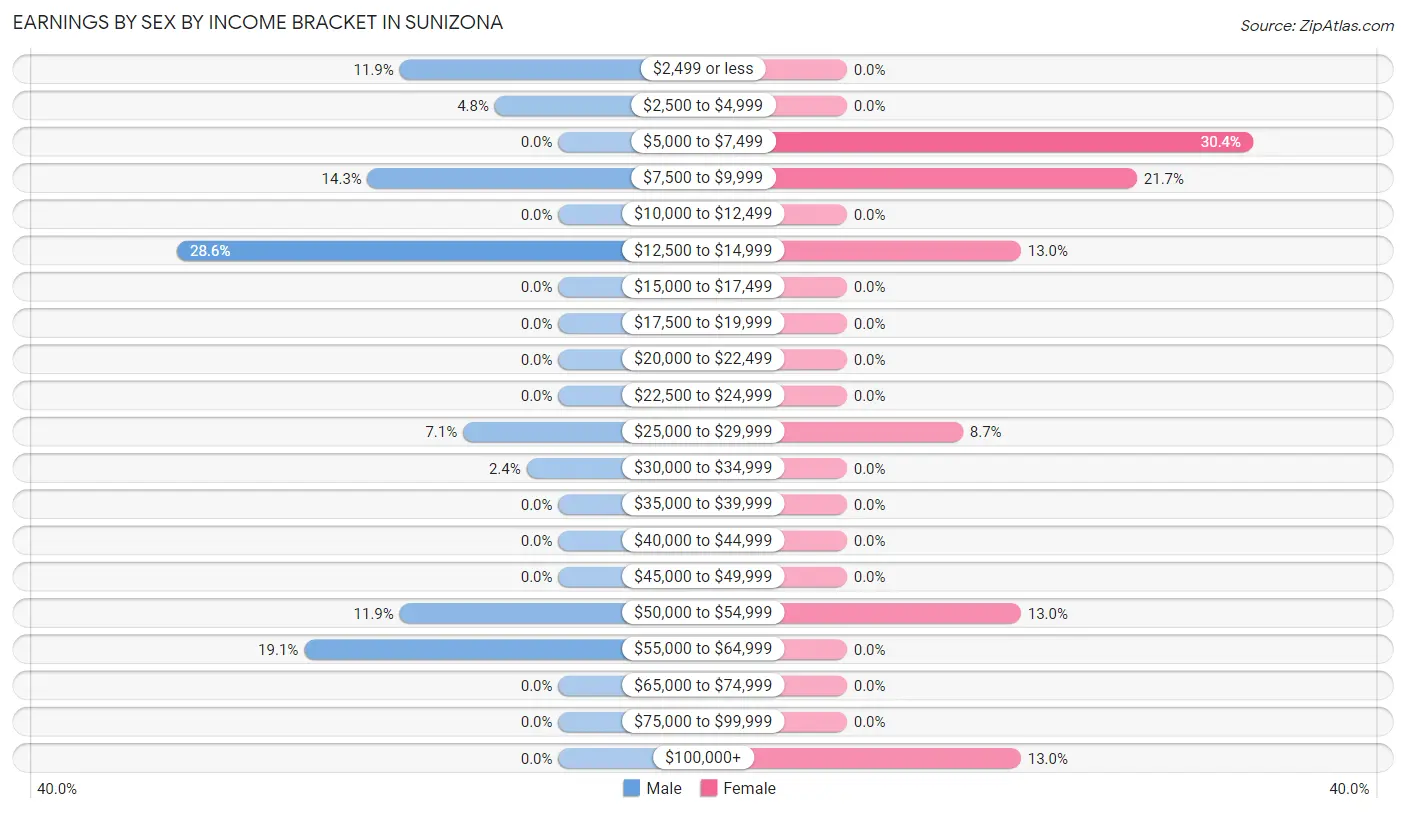
Earnings by Sex by Income Bracket in Sunizona
The most common earnings brackets in Sunizona are $12,500 to $14,999 for men (12 | 28.6%) and $5,000 to $7,499 for women (7 | 30.4%).
| Income | Male | Female |
| $2,499 or less | 5 (11.9%) | 0 (0.0%) |
| $2,500 to $4,999 | 2 (4.8%) | 0 (0.0%) |
| $5,000 to $7,499 | 0 (0.0%) | 7 (30.4%) |
| $7,500 to $9,999 | 6 (14.3%) | 5 (21.7%) |
| $10,000 to $12,499 | 0 (0.0%) | 0 (0.0%) |
| $12,500 to $14,999 | 12 (28.6%) | 3 (13.0%) |
| $15,000 to $17,499 | 0 (0.0%) | 0 (0.0%) |
| $17,500 to $19,999 | 0 (0.0%) | 0 (0.0%) |
| $20,000 to $22,499 | 0 (0.0%) | 0 (0.0%) |
| $22,500 to $24,999 | 0 (0.0%) | 0 (0.0%) |
| $25,000 to $29,999 | 3 (7.1%) | 2 (8.7%) |
| $30,000 to $34,999 | 1 (2.4%) | 0 (0.0%) |
| $35,000 to $39,999 | 0 (0.0%) | 0 (0.0%) |
| $40,000 to $44,999 | 0 (0.0%) | 0 (0.0%) |
| $45,000 to $49,999 | 0 (0.0%) | 0 (0.0%) |
| $50,000 to $54,999 | 5 (11.9%) | 3 (13.0%) |
| $55,000 to $64,999 | 8 (19.1%) | 0 (0.0%) |
| $65,000 to $74,999 | 0 (0.0%) | 0 (0.0%) |
| $75,000 to $99,999 | 0 (0.0%) | 0 (0.0%) |
| $100,000+ | 0 (0.0%) | 3 (13.0%) |
| Total | 42 (100.0%) | 23 (100.0%) |
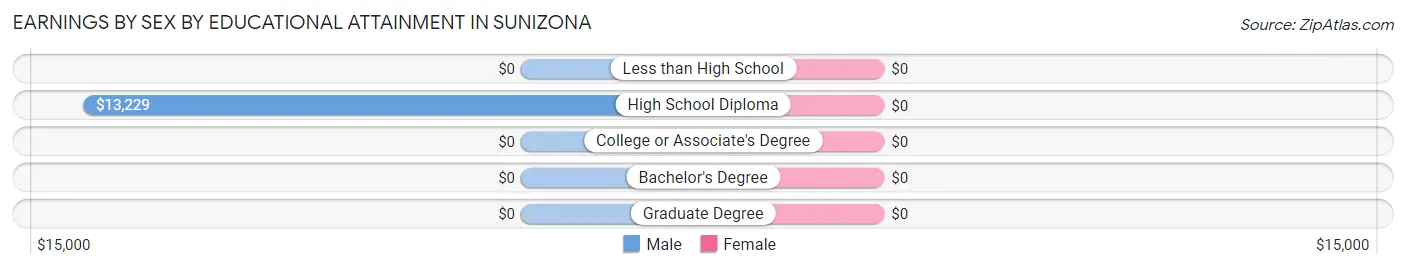
Earnings by Sex by Educational Attainment in Sunizona
| Educational Attainment | Male Income | Female Income |
| Less than High School | - | - |
| High School Diploma | $13,229 | $0 |
| College or Associate's Degree | - | - |
| Bachelor's Degree | - | - |
| Graduate Degree | - | - |
| Total | $13,958 | $9,750 |
Family Income in Sunizona
Family Income Brackets in Sunizona
According to the Sunizona family income data, there are 12 families falling into the $10,000 to $14,999 income range, which is the most common income bracket and makes up 27.3% of all families.
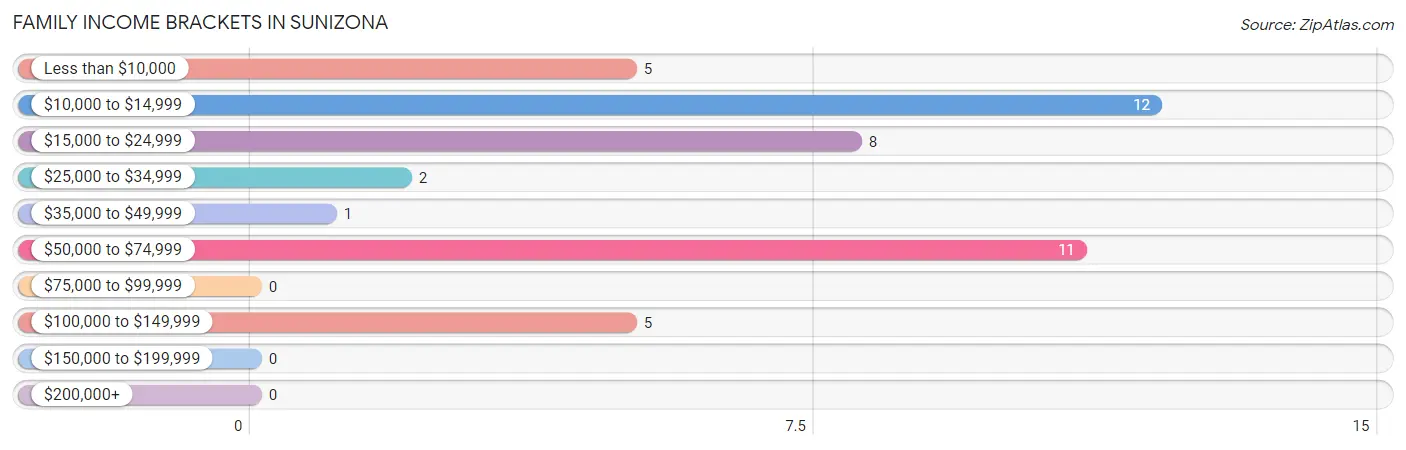
| Income Bracket | # Families | % Families |
| Less than $10,000 | 5 | 11.4% |
| $10,000 to $14,999 | 12 | 27.3% |
| $15,000 to $24,999 | 8 | 18.2% |
| $25,000 to $34,999 | 2 | 4.5% |
| $35,000 to $49,999 | 1 | 2.3% |
| $50,000 to $74,999 | 11 | 25.0% |
| $75,000 to $99,999 | 0 | 0.0% |
| $100,000 to $149,999 | 5 | 11.4% |
| $150,000 to $199,999 | 0 | 0.0% |
| $200,000+ | 0 | 0.0% |
Family Income by Famaliy Size in Sunizona
2-person families (24 | 54.5%) account for the highest median family income in Sunizona with $13,958 per family, while 2-person families (24 | 54.5%) have the highest median income of $6,979 per family member.
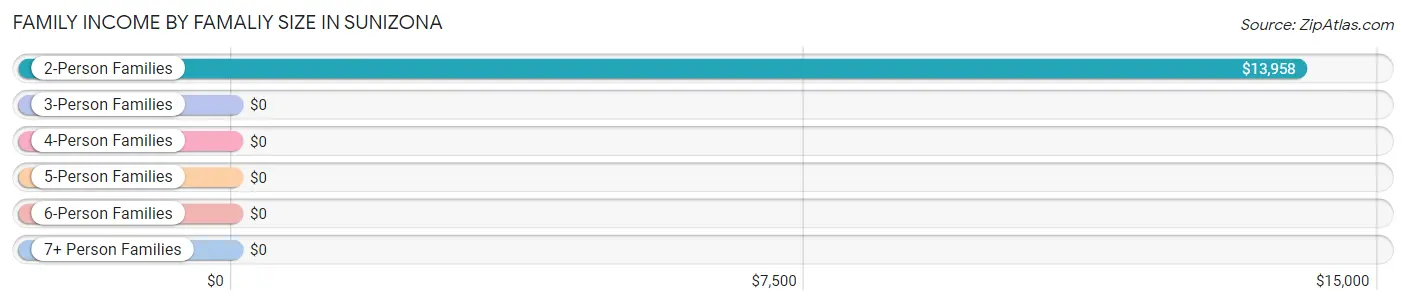
| Income Bracket | # Families | Median Income |
| 2-Person Families | 24 (54.5%) | $13,958 |
| 3-Person Families | 0 (0.0%) | $0 |
| 4-Person Families | 8 (18.2%) | $0 |
| 5-Person Families | 12 (27.3%) | $0 |
| 6-Person Families | 0 (0.0%) | $0 |
| 7+ Person Families | 0 (0.0%) | $0 |
| Total | 44 (100.0%) | $0 |
Family Income by Number of Earners in Sunizona
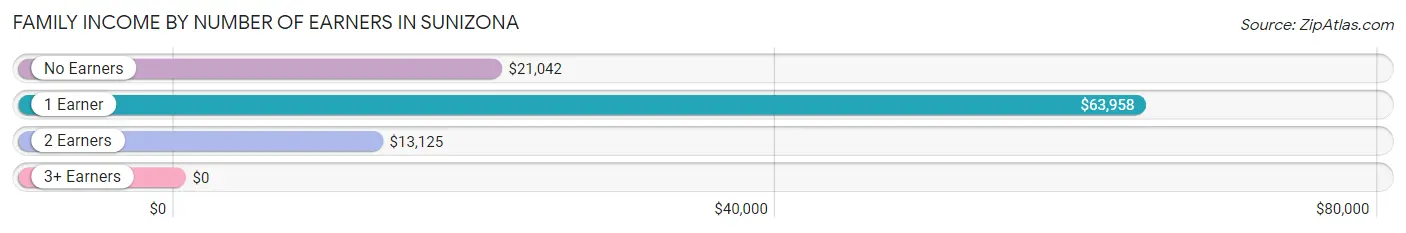
| Number of Earners | # Families | Median Income |
| No Earners | 13 (29.5%) | $21,042 |
| 1 Earner | 15 (34.1%) | $63,958 |
| 2 Earners | 13 (29.5%) | $13,125 |
| 3+ Earners | 3 (6.8%) | $0 |
| Total | 44 (100.0%) | $0 |
Household Income in Sunizona
Household Income Brackets in Sunizona
With 32 households falling in the category, the $25,000 to $34,999 income range is the most frequent in Sunizona, accounting for 26.0% of all households.
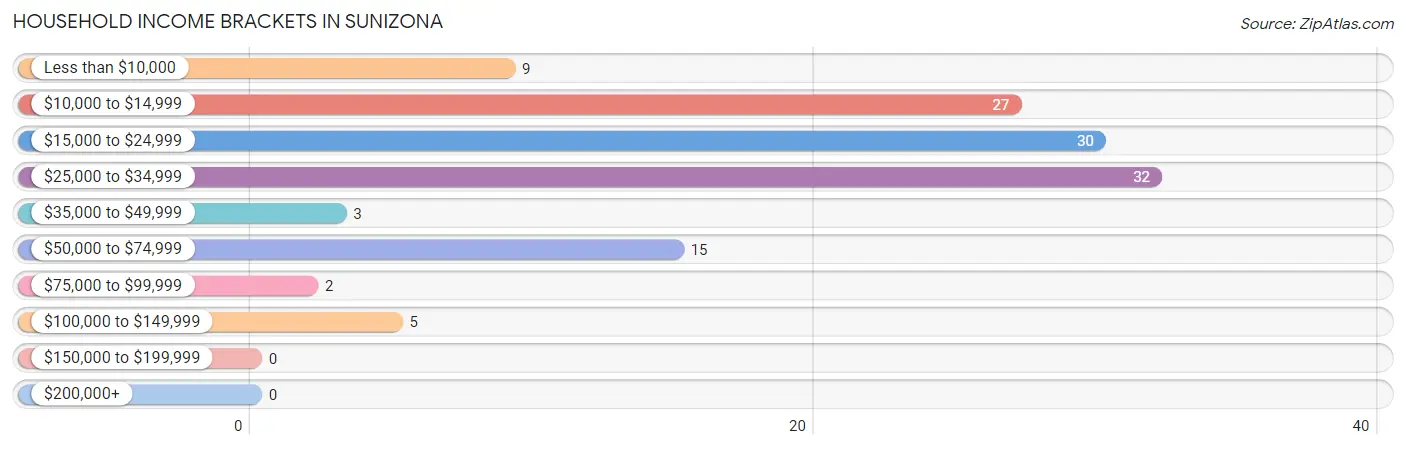
| Income Bracket | # Households | % Households |
| Less than $10,000 | 9 | 7.3% |
| $10,000 to $14,999 | 27 | 22.0% |
| $15,000 to $24,999 | 30 | 24.4% |
| $25,000 to $34,999 | 32 | 26.0% |
| $35,000 to $49,999 | 3 | 2.4% |
| $50,000 to $74,999 | 15 | 12.2% |
| $75,000 to $99,999 | 2 | 1.6% |
| $100,000 to $149,999 | 5 | 4.1% |
| $150,000 to $199,999 | 0 | 0.0% |
| $200,000+ | 0 | 0.0% |
Household Income by Householder Age in Sunizona
The median household income in Sunizona is $21,375, with the highest median household income of $30,217 found in the 65+ years age bracket for the primary householder. A total of 58 households (47.1%) fall into this category.
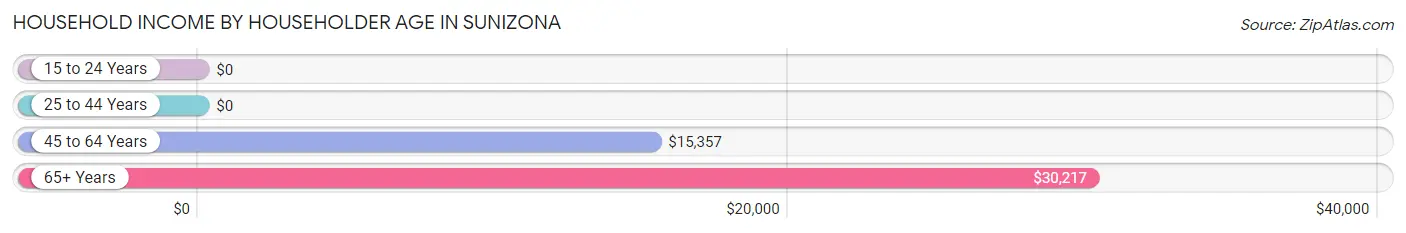
| Income Bracket | # Households | Median Income |
| 15 to 24 Years | 0 (0.0%) | $0 |
| 25 to 44 Years | 19 (15.4%) | $0 |
| 45 to 64 Years | 46 (37.4%) | $15,357 |
| 65+ Years | 58 (47.1%) | $30,217 |
| Total | 123 (100.0%) | $21,375 |
Poverty in Sunizona
Income Below Poverty by Sex and Age in Sunizona
With 41.1% poverty level for males and 36.6% for females among the residents of Sunizona, 6 to 11 year old males and 75 year old and over females are the most vulnerable to poverty, with 12 males (75.0%) and 4 females (100.0%) in their respective age groups living below the poverty level.
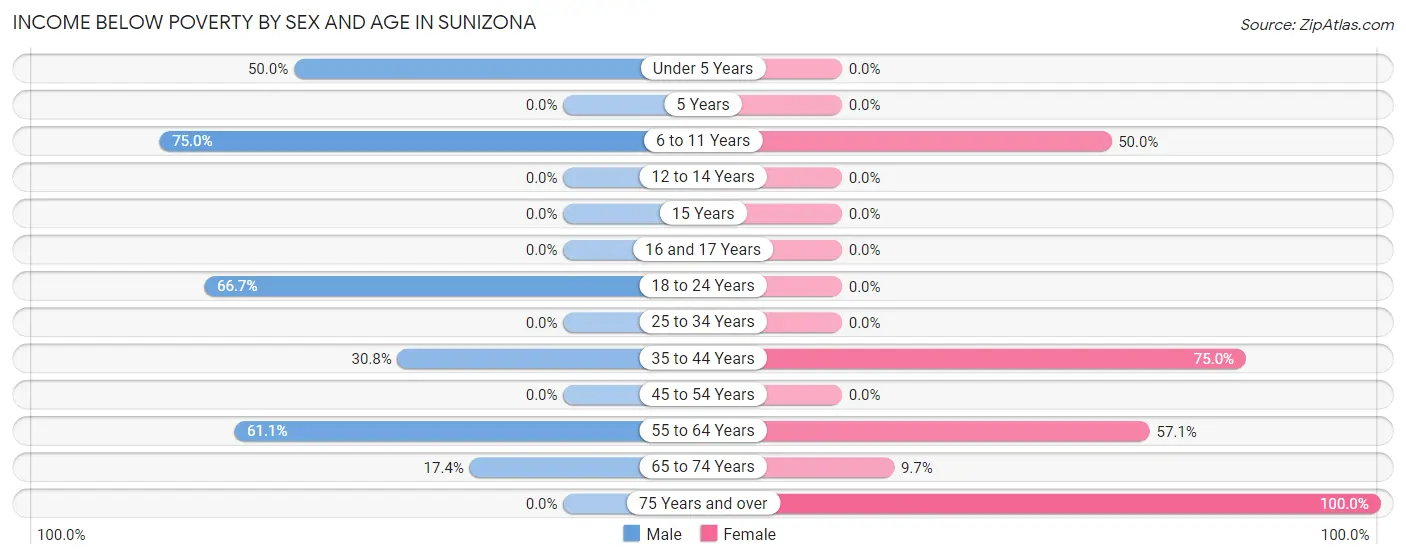
| Age Bracket | Male | Female |
| Under 5 Years | 5 (50.0%) | 0 (0.0%) |
| 5 Years | 0 (0.0%) | 0 (0.0%) |
| 6 to 11 Years | 12 (75.0%) | 6 (50.0%) |
| 12 to 14 Years | 0 (0.0%) | 0 (0.0%) |
| 15 Years | 0 (0.0%) | 0 (0.0%) |
| 16 and 17 Years | 0 (0.0%) | 0 (0.0%) |
| 18 to 24 Years | 4 (66.7%) | 0 (0.0%) |
| 25 to 34 Years | 0 (0.0%) | 0 (0.0%) |
| 35 to 44 Years | 4 (30.8%) | 9 (75.0%) |
| 45 to 54 Years | 0 (0.0%) | 0 (0.0%) |
| 55 to 64 Years | 22 (61.1%) | 12 (57.1%) |
| 65 to 74 Years | 4 (17.4%) | 3 (9.7%) |
| 75 Years and over | 0 (0.0%) | 4 (100.0%) |
| Total | 51 (41.1%) | 34 (36.6%) |
Income Above Poverty by Sex and Age in Sunizona
According to the poverty statistics in Sunizona, males aged 12 to 14 years and females aged 5 years are the age groups that are most secure financially, with 100.0% of males and 100.0% of females in these age groups living above the poverty line.
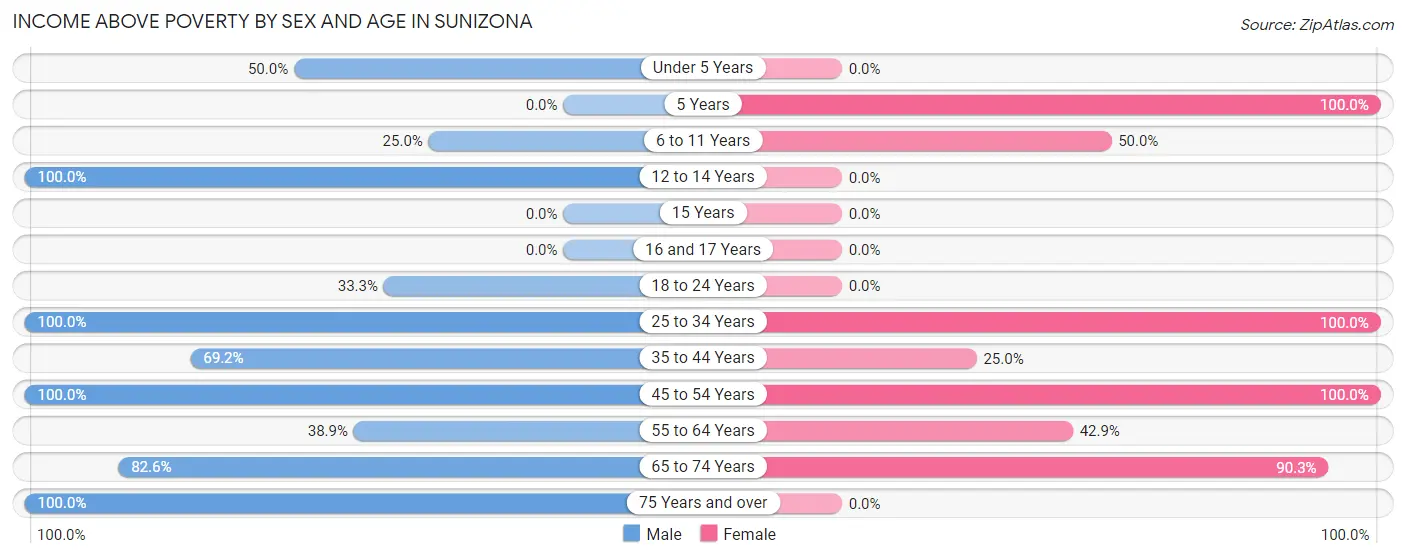
| Age Bracket | Male | Female |
| Under 5 Years | 5 (50.0%) | 0 (0.0%) |
| 5 Years | 0 (0.0%) | 6 (100.0%) |
| 6 to 11 Years | 4 (25.0%) | 6 (50.0%) |
| 12 to 14 Years | 3 (100.0%) | 0 (0.0%) |
| 15 Years | 0 (0.0%) | 0 (0.0%) |
| 16 and 17 Years | 0 (0.0%) | 0 (0.0%) |
| 18 to 24 Years | 2 (33.3%) | 0 (0.0%) |
| 25 to 34 Years | 5 (100.0%) | 5 (100.0%) |
| 35 to 44 Years | 9 (69.2%) | 3 (25.0%) |
| 45 to 54 Years | 3 (100.0%) | 2 (100.0%) |
| 55 to 64 Years | 14 (38.9%) | 9 (42.9%) |
| 65 to 74 Years | 19 (82.6%) | 28 (90.3%) |
| 75 Years and over | 9 (100.0%) | 0 (0.0%) |
| Total | 73 (58.9%) | 59 (63.4%) |
Income Below Poverty Among Married-Couple Families in Sunizona
The poverty statistics for married-couple families in Sunizona show that 46.9% or 15 of the total 32 families live below the poverty line. Families with no children have the highest poverty rate of 83.3%, comprising of 15 families. On the other hand, families with 1 or 2 children have the lowest poverty rate of 0.0%, which includes 0 families.
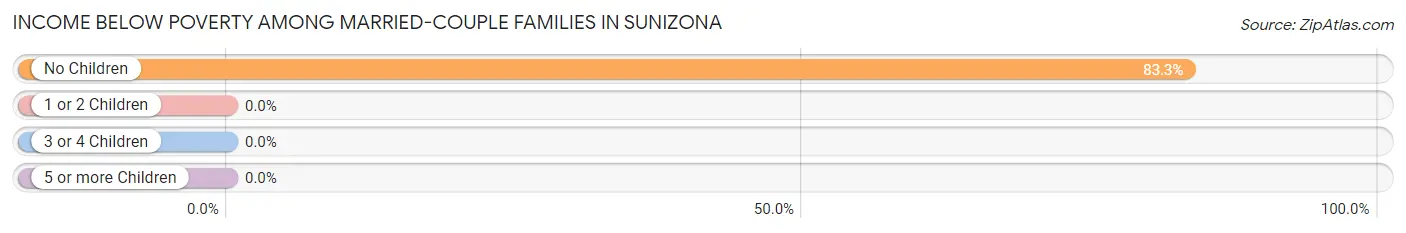
| Children | Above Poverty | Below Poverty |
| No Children | 3 (16.7%) | 15 (83.3%) |
| 1 or 2 Children | 8 (100.0%) | 0 (0.0%) |
| 3 or 4 Children | 6 (100.0%) | 0 (0.0%) |
| 5 or more Children | 0 (0.0%) | 0 (0.0%) |
| Total | 17 (53.1%) | 15 (46.9%) |
Income Below Poverty Among Single-Parent Households in Sunizona
According to the poverty data in Sunizona, 66.7% or 4 single-father households and 100.0% or 6 single-mother households are living below the poverty line. Among single-father households, those with no children have the highest poverty rate, with 4 households (66.7%) experiencing poverty. Likewise, among single-mother households, those with 3 or 4 children have the highest poverty rate, with 6 households (100.0%) falling below the poverty line.
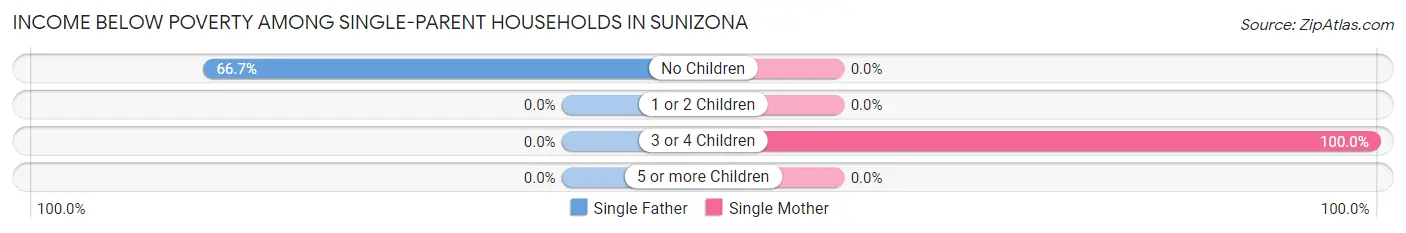
| Children | Single Father | Single Mother |
| No Children | 4 (66.7%) | 0 (0.0%) |
| 1 or 2 Children | 0 (0.0%) | 0 (0.0%) |
| 3 or 4 Children | 0 (0.0%) | 6 (100.0%) |
| 5 or more Children | 0 (0.0%) | 0 (0.0%) |
| Total | 4 (66.7%) | 6 (100.0%) |
Income Below Poverty Among Married-Couple vs Single-Parent Households in Sunizona
The poverty data for Sunizona shows that 15 of the married-couple family households (46.9%) and 10 of the single-parent households (83.3%) are living below the poverty level. Within the married-couple family households, those with no children have the highest poverty rate, with 15 households (83.3%) falling below the poverty line. Among the single-parent households, those with 3 or 4 children have the highest poverty rate, with 6 household (100.0%) living below poverty.
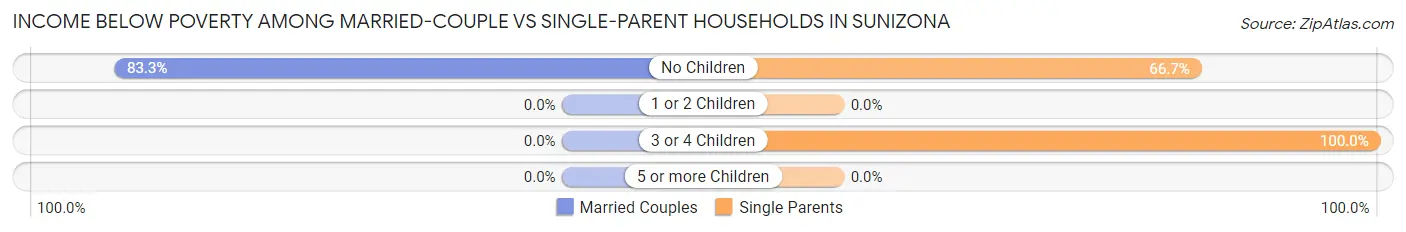
| Children | Married-Couple Families | Single-Parent Households |
| No Children | 15 (83.3%) | 4 (66.7%) |
| 1 or 2 Children | 0 (0.0%) | 0 (0.0%) |
| 3 or 4 Children | 0 (0.0%) | 6 (100.0%) |
| 5 or more Children | 0 (0.0%) | 0 (0.0%) |
| Total | 15 (46.9%) | 10 (83.3%) |
Race in Sunizona
The most populous races in Sunizona are White / Caucasian (188 | 86.6%), Two or more Races (28 | 12.9%), and Hispanic or Latino (27 | 12.4%).
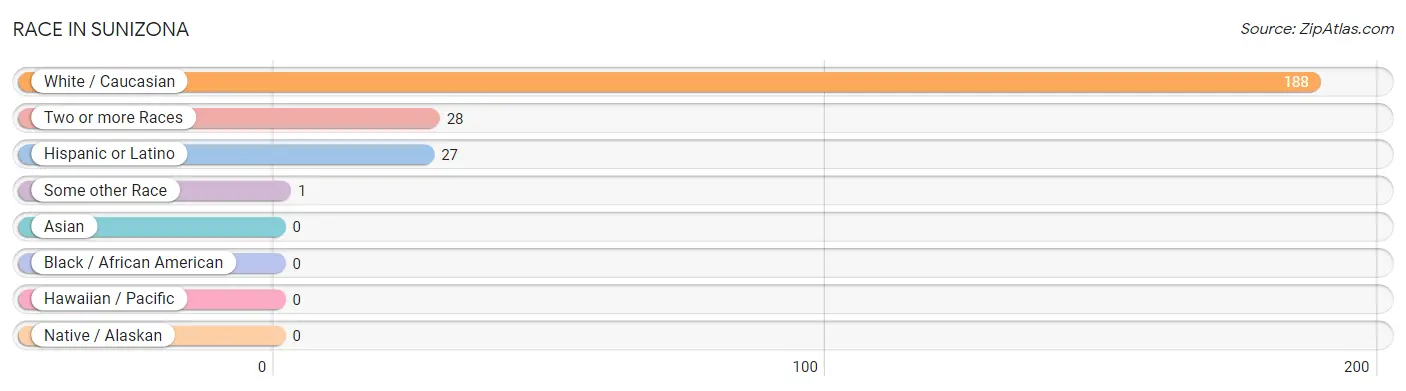
| Race | # Population | % Population |
| Asian | 0 | 0.0% |
| Black / African American | 0 | 0.0% |
| Hawaiian / Pacific | 0 | 0.0% |
| Hispanic or Latino | 27 | 12.4% |
| Native / Alaskan | 0 | 0.0% |
| White / Caucasian | 188 | 86.6% |
| Two or more Races | 28 | 12.9% |
| Some other Race | 1 | 0.5% |
| Total | 217 | 100.0% |
Ancestry in Sunizona
The most populous ancestries reported in Sunizona are English (61 | 28.1%), American (28 | 12.9%), Irish (26 | 12.0%), German (24 | 11.1%), and Mexican (24 | 11.1%), together accounting for 75.1% of all Sunizona residents.
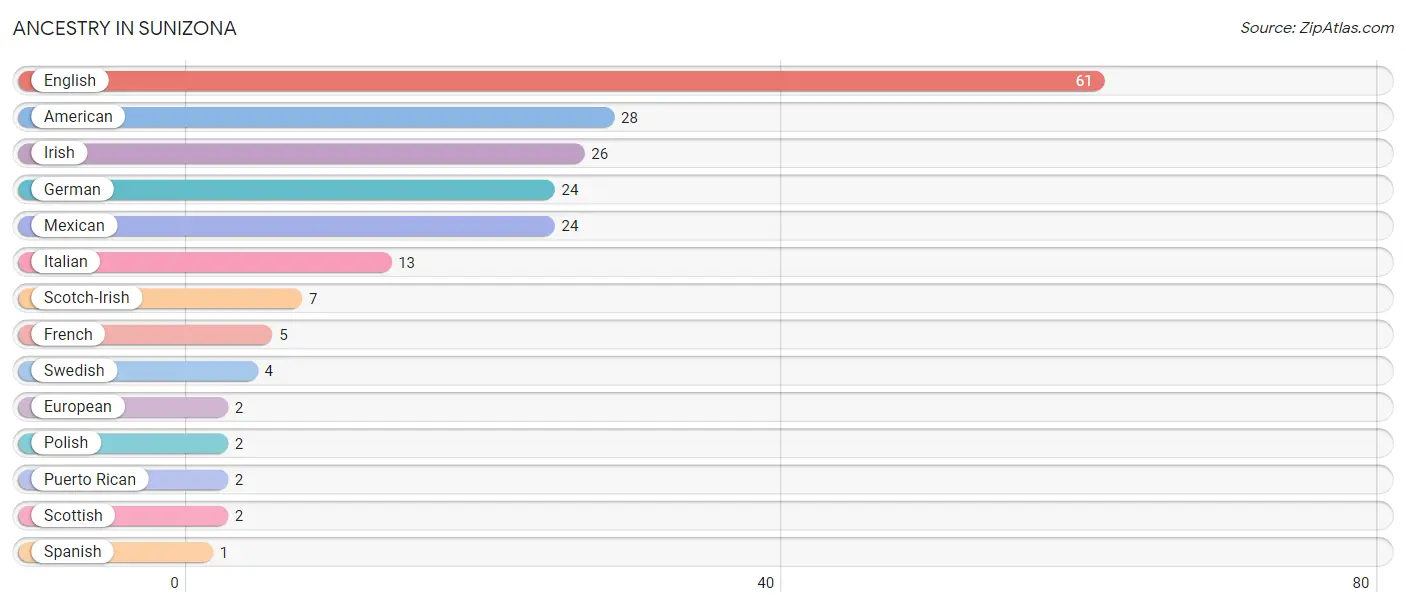
| Ancestry | # Population | % Population |
| American | 28 | 12.9% |
| English | 61 | 28.1% |
| European | 2 | 0.9% |
| French | 5 | 2.3% |
| German | 24 | 11.1% |
| Irish | 26 | 12.0% |
| Italian | 13 | 6.0% |
| Mexican | 24 | 11.1% |
| Polish | 2 | 0.9% |
| Puerto Rican | 2 | 0.9% |
| Scotch-Irish | 7 | 3.2% |
| Scottish | 2 | 0.9% |
| Spanish | 1 | 0.5% |
| Swedish | 4 | 1.8% | View All 14 Rows |
Immigrants in Sunizona
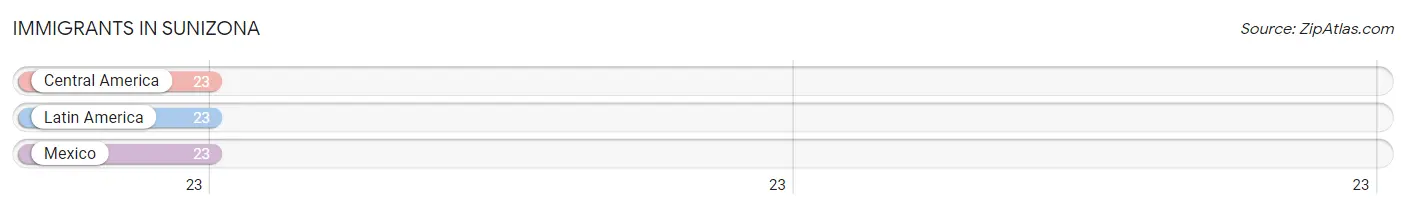
The most numerous immigrant groups reported in Sunizona came from Central America (23 | 10.6%), Latin America (23 | 10.6%), and Mexico (23 | 10.6%), together accounting for 31.8% of all Sunizona residents.
| Immigration Origin | # Population | % Population |
| Central America | 23 | 10.6% |
| Latin America | 23 | 10.6% |
| Mexico | 23 | 10.6% | View All 3 Rows |
Sex and Age in Sunizona
Sex and Age in Sunizona
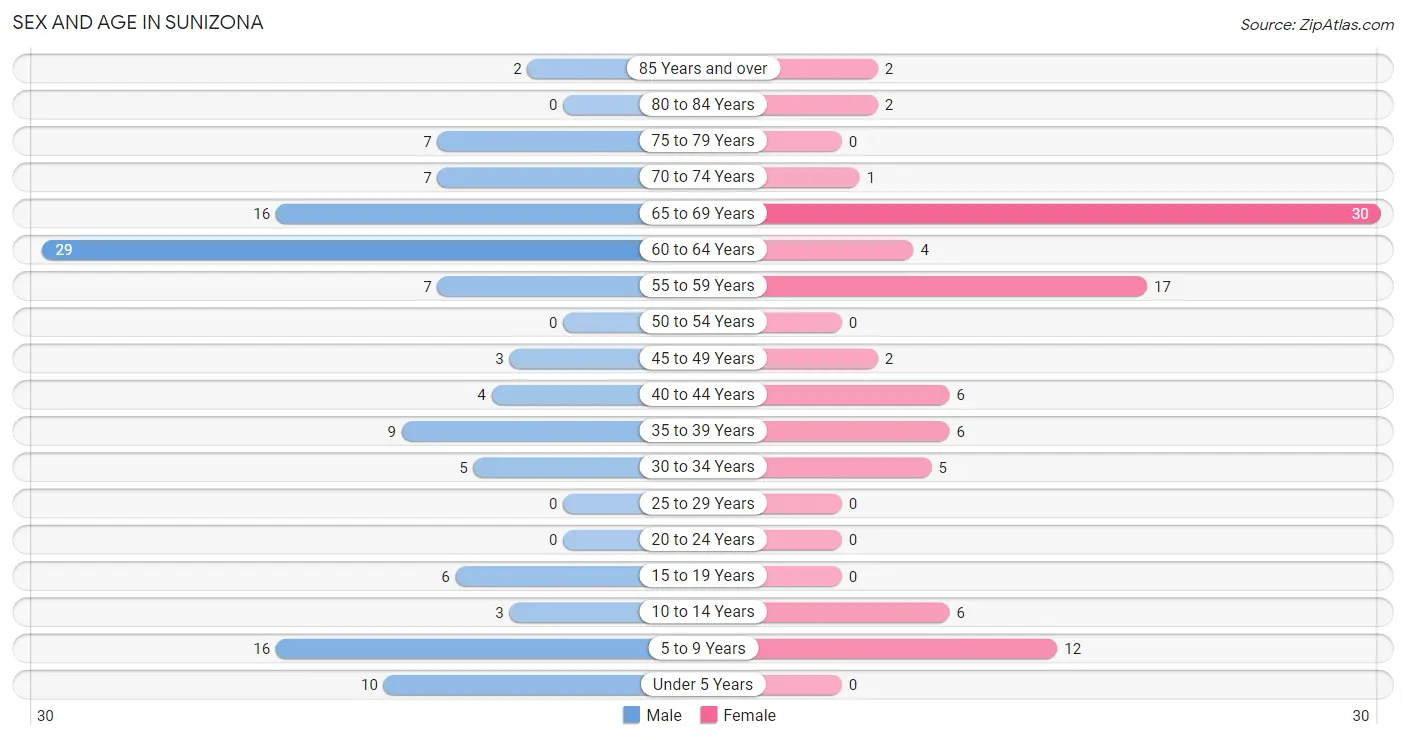
The most populous age groups in Sunizona are 60 to 64 Years (29 | 23.4%) for men and 65 to 69 Years (30 | 32.3%) for women.
| Age Bracket | Male | Female |
| Under 5 Years | 10 (8.1%) | 0 (0.0%) |
| 5 to 9 Years | 16 (12.9%) | 12 (12.9%) |
| 10 to 14 Years | 3 (2.4%) | 6 (6.5%) |
| 15 to 19 Years | 6 (4.8%) | 0 (0.0%) |
| 20 to 24 Years | 0 (0.0%) | 0 (0.0%) |
| 25 to 29 Years | 0 (0.0%) | 0 (0.0%) |
| 30 to 34 Years | 5 (4.0%) | 5 (5.4%) |
| 35 to 39 Years | 9 (7.3%) | 6 (6.5%) |
| 40 to 44 Years | 4 (3.2%) | 6 (6.5%) |
| 45 to 49 Years | 3 (2.4%) | 2 (2.1%) |
| 50 to 54 Years | 0 (0.0%) | 0 (0.0%) |
| 55 to 59 Years | 7 (5.7%) | 17 (18.3%) |
| 60 to 64 Years | 29 (23.4%) | 4 (4.3%) |
| 65 to 69 Years | 16 (12.9%) | 30 (32.3%) |
| 70 to 74 Years | 7 (5.7%) | 1 (1.1%) |
| 75 to 79 Years | 7 (5.7%) | 0 (0.0%) |
| 80 to 84 Years | 0 (0.0%) | 2 (2.1%) |
| 85 Years and over | 2 (1.6%) | 2 (2.1%) |
| Total | 124 (100.0%) | 93 (100.0%) |
Families and Households in Sunizona
Median Family Size in Sunizona
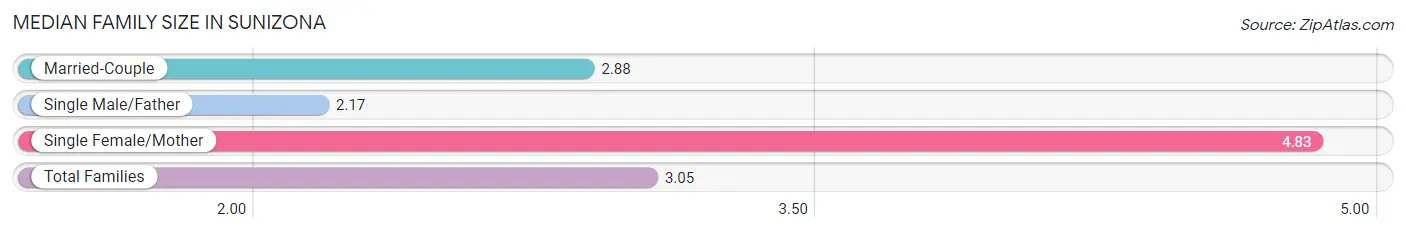
The median family size in Sunizona is 3.05 persons per family, with single female/mother families (6 | 13.6%) accounting for the largest median family size of 4.83 persons per family. On the other hand, single male/father families (6 | 13.6%) represent the smallest median family size with 2.17 persons per family.
| Family Type | # Families | Family Size |
| Married-Couple | 32 (72.7%) | 2.88 |
| Single Male/Father | 6 (13.6%) | 2.17 |
| Single Female/Mother | 6 (13.6%) | 4.83 |
| Total Families | 44 (100.0%) | 3.05 |
Median Household Size in Sunizona
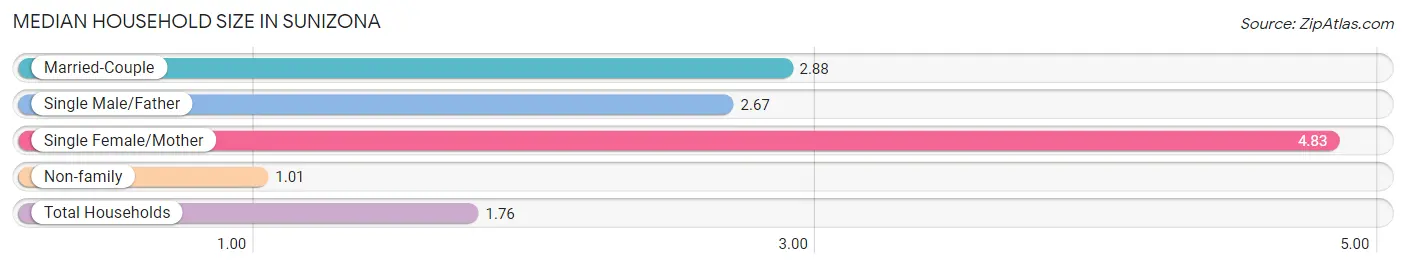
The median household size in Sunizona is 1.76 persons per household, with single female/mother households (6 | 4.9%) accounting for the largest median household size of 4.83 persons per household. non-family households (79 | 64.2%) represent the smallest median household size with 1.01 persons per household.
| Household Type | # Households | Household Size |
| Married-Couple | 32 (26.0%) | 2.88 |
| Single Male/Father | 6 (4.9%) | 2.67 |
| Single Female/Mother | 6 (4.9%) | 4.83 |
| Non-family | 79 (64.2%) | 1.01 |
| Total Households | 123 (100.0%) | 1.76 |
Household Size by Marriage Status in Sunizona
Out of a total of 123 households in Sunizona, 44 (35.8%) are family households, while 79 (64.2%) are nonfamily households. The most numerous type of family households are 2-person households, comprising 20, and the most common type of nonfamily households are 1-person households, comprising 77.
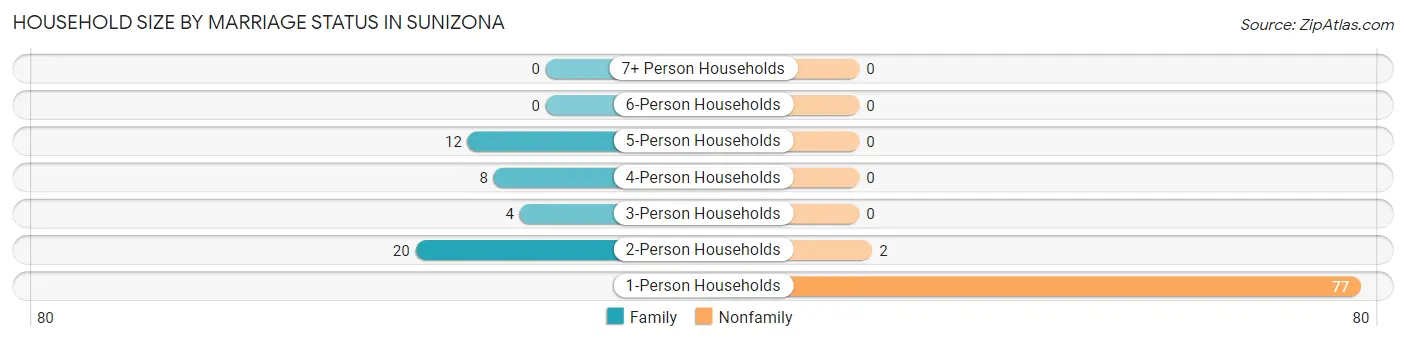
| Household Size | Family Households | Nonfamily Households |
| 1-Person Households | - | 77 (62.6%) |
| 2-Person Households | 20 (16.3%) | 2 (1.6%) |
| 3-Person Households | 4 (3.3%) | 0 (0.0%) |
| 4-Person Households | 8 (6.5%) | 0 (0.0%) |
| 5-Person Households | 12 (9.8%) | 0 (0.0%) |
| 6-Person Households | 0 (0.0%) | 0 (0.0%) |
| 7+ Person Households | 0 (0.0%) | 0 (0.0%) |
| Total | 44 (35.8%) | 79 (64.2%) |
Female Fertility in Sunizona
Fertility by Age in Sunizona
| Age Bracket | Women with Births | Births / 1,000 Women |
| 15 to 19 years | 0 (0.0%) | 0.0 |
| 20 to 34 years | 0 (0.0%) | 0.0 |
| 35 to 50 years | 0 (0.0%) | 0.0 |
| Total | 0 (0.0%) | 0.0 |
Fertility by Age by Marriage Status in Sunizona
| Age Bracket | Married | Unmarried |
| 15 to 19 years | 0 (0.0%) | 0 (0.0%) |
| 20 to 34 years | 0 (0.0%) | 0 (0.0%) |
| 35 to 50 years | 0 (0.0%) | 0 (0.0%) |
| Total | 0 (0.0%) | 0 (0.0%) |
Fertility by Education in Sunizona
| Educational Attainment | Women with Births | Births / 1,000 Women |
| Less than High School | 0 (0.0%) | 0.0 |
| High School Diploma | 0 (0.0%) | 0.0 |
| College or Associate's Degree | 0 (0.0%) | 0.0 |
| Bachelor's Degree | 0 (0.0%) | 0.0 |
| Graduate Degree | 0 (0.0%) | 0.0 |
| Total | 0 (0.0%) | 0.0 |
Fertility by Education by Marriage Status in Sunizona
| Educational Attainment | Married | Unmarried |
| Less than High School | 0 (0.0%) | 0 (0.0%) |
| High School Diploma | 0 (0.0%) | 0 (0.0%) |
| College or Associate's Degree | 0 (0.0%) | 0 (0.0%) |
| Bachelor's Degree | 0 (0.0%) | 0 (0.0%) |
| Graduate Degree | 0 (0.0%) | 0 (0.0%) |
| Total | 0 (0.0%) | 0 (0.0%) |
Employment Characteristics in Sunizona
Employment by Class of Employer in Sunizona
Among the 54 employed individuals in Sunizona, private company employees (25 | 46.3%), not-for-profit organizations (10 | 18.5%), and local government employees (7 | 13.0%) make up the most common classes of employment.
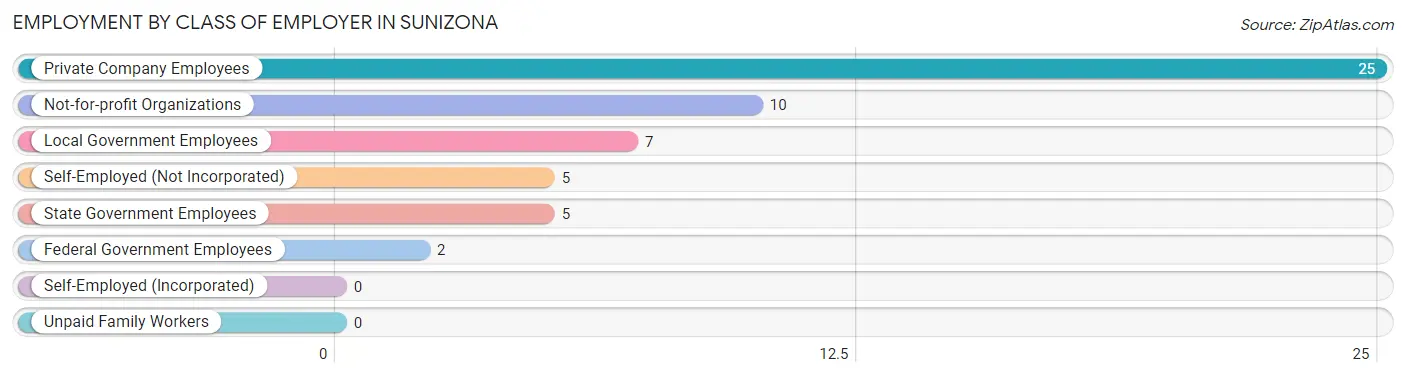
| Employer Class | # Employees | % Employees |
| Private Company Employees | 25 | 46.3% |
| Self-Employed (Incorporated) | 0 | 0.0% |
| Self-Employed (Not Incorporated) | 5 | 9.3% |
| Not-for-profit Organizations | 10 | 18.5% |
| Local Government Employees | 7 | 13.0% |
| State Government Employees | 5 | 9.3% |
| Federal Government Employees | 2 | 3.7% |
| Unpaid Family Workers | 0 | 0.0% |
| Total | 54 | 100.0% |
Employment Status by Age in Sunizona
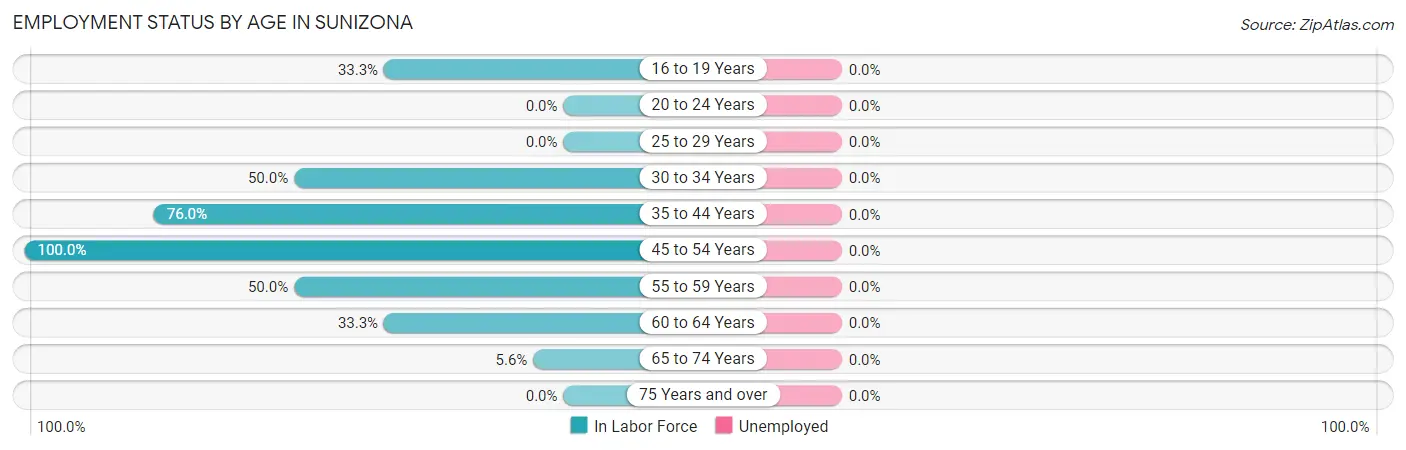
| Age Bracket | In Labor Force | Unemployed |
| 16 to 19 Years | 2 (33.3%) | 0 (0.0%) |
| 20 to 24 Years | 0 (0.0%) | 0 (0.0%) |
| 25 to 29 Years | 0 (0.0%) | 0 (0.0%) |
| 30 to 34 Years | 5 (50.0%) | 0 (0.0%) |
| 35 to 44 Years | 19 (76.0%) | 0 (0.0%) |
| 45 to 54 Years | 5 (100.0%) | 0 (0.0%) |
| 55 to 59 Years | 12 (50.0%) | 0 (0.0%) |
| 60 to 64 Years | 11 (33.3%) | 0 (0.0%) |
| 65 to 74 Years | 3 (5.6%) | 0 (0.0%) |
| 75 Years and over | 0 (0.0%) | 0 (0.0%) |
| Total | 57 (33.5%) | 0 (0.0%) |
Employment Status by Educational Attainment in Sunizona
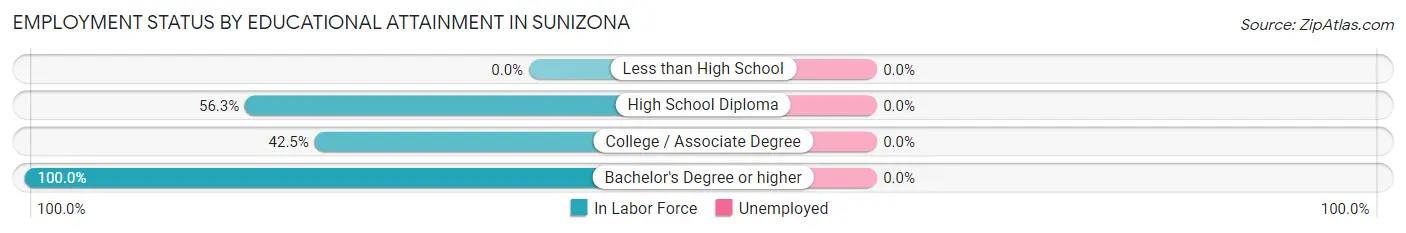
| Educational Attainment | In Labor Force | Unemployed |
| Less than High School | 0 (0.0%) | 0 (0.0%) |
| High School Diploma | 27 (56.3%) | 0 (0.0%) |
| College / Associate Degree | 17 (42.5%) | 0 (0.0%) |
| Bachelor's Degree or higher | 8 (100.0%) | 0 (0.0%) |
| Total | 52 (53.6%) | 0 (0.0%) |
Employment Occupations by Sex in Sunizona
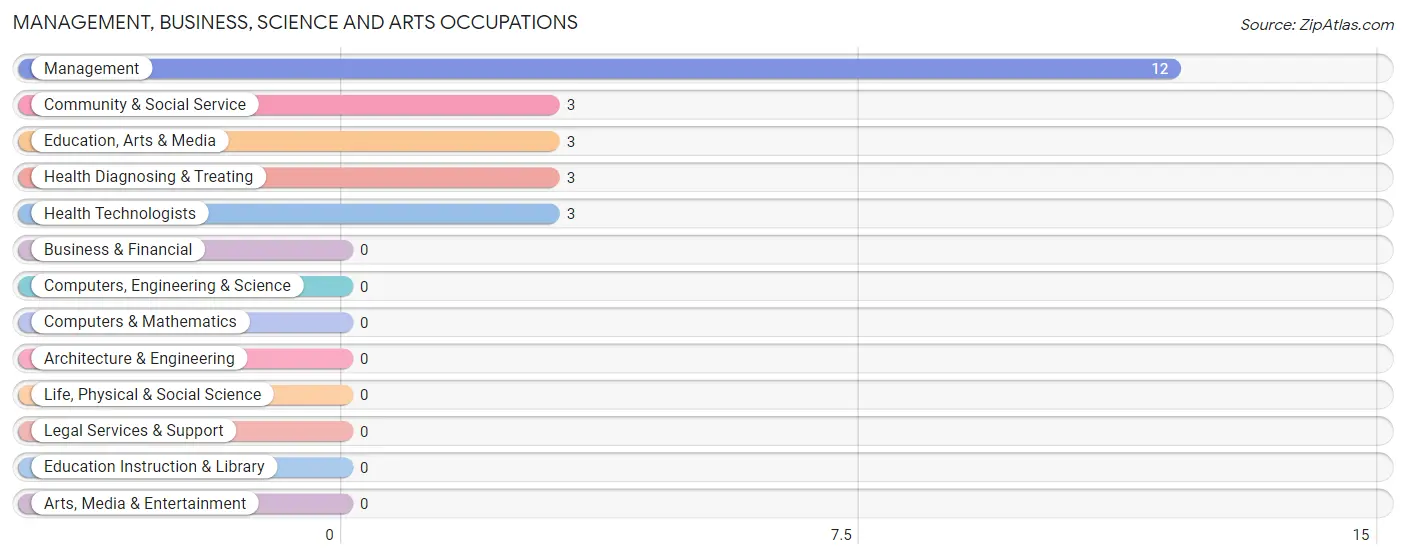
Management, Business, Science and Arts Occupations
The most common Management, Business, Science and Arts occupations in Sunizona are Management (12 | 21.0%), Community & Social Service (3 | 5.3%), Education, Arts & Media (3 | 5.3%), Health Diagnosing & Treating (3 | 5.3%), and Health Technologists (3 | 5.3%).
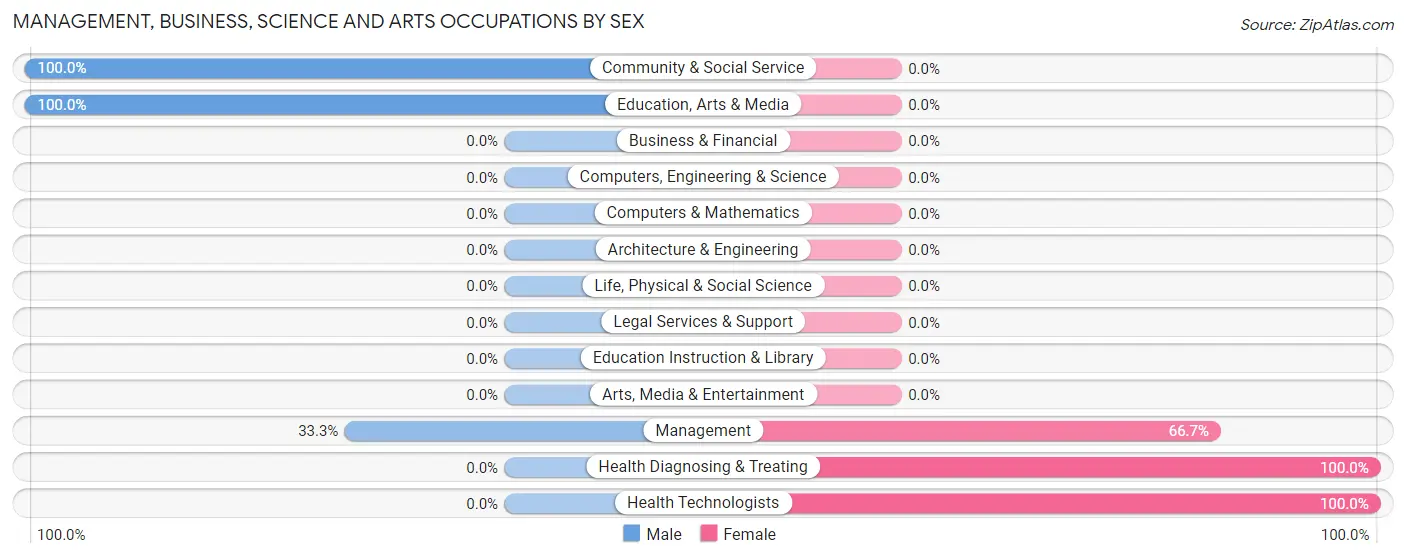
Management, Business, Science and Arts Occupations by Sex
Within the Management, Business, Science and Arts occupations in Sunizona, the most male-oriented occupations are Community & Social Service (100.0%), Education, Arts & Media (100.0%), and Management (33.3%), while the most female-oriented occupations are Health Diagnosing & Treating (100.0%), Health Technologists (100.0%), and Management (66.7%).
| Occupation | Male | Female |
| Management | 4 (33.3%) | 8 (66.7%) |
| Business & Financial | 0 (0.0%) | 0 (0.0%) |
| Computers, Engineering & Science | 0 (0.0%) | 0 (0.0%) |
| Computers & Mathematics | 0 (0.0%) | 0 (0.0%) |
| Architecture & Engineering | 0 (0.0%) | 0 (0.0%) |
| Life, Physical & Social Science | 0 (0.0%) | 0 (0.0%) |
| Community & Social Service | 3 (100.0%) | 0 (0.0%) |
| Education, Arts & Media | 3 (100.0%) | 0 (0.0%) |
| Legal Services & Support | 0 (0.0%) | 0 (0.0%) |
| Education Instruction & Library | 0 (0.0%) | 0 (0.0%) |
| Arts, Media & Entertainment | 0 (0.0%) | 0 (0.0%) |
| Health Diagnosing & Treating | 0 (0.0%) | 3 (100.0%) |
| Health Technologists | 0 (0.0%) | 3 (100.0%) |
| Total (Category) | 7 (38.9%) | 11 (61.1%) |
| Total (Overall) | 34 (59.7%) | 23 (40.4%) |
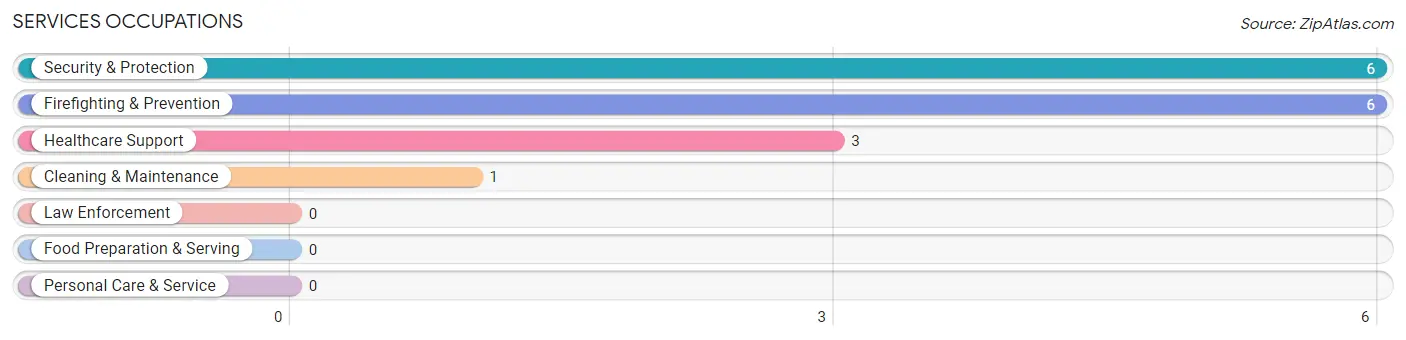
Services Occupations
The most common Services occupations in Sunizona are Security & Protection (6 | 10.5%), Firefighting & Prevention (6 | 10.5%), Healthcare Support (3 | 5.3%), and Cleaning & Maintenance (1 | 1.8%).
Services Occupations by Sex
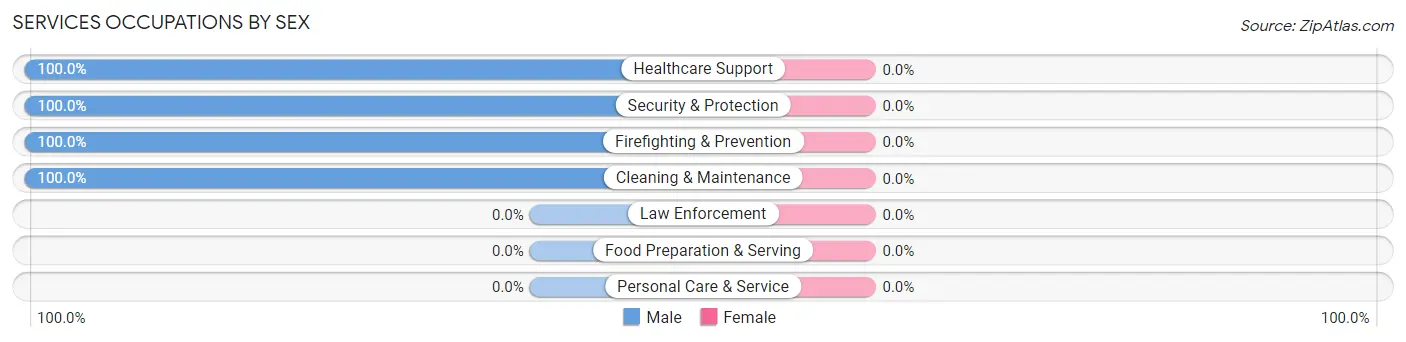
| Occupation | Male | Female |
| Healthcare Support | 3 (100.0%) | 0 (0.0%) |
| Security & Protection | 6 (100.0%) | 0 (0.0%) |
| Firefighting & Prevention | 6 (100.0%) | 0 (0.0%) |
| Law Enforcement | 0 (0.0%) | 0 (0.0%) |
| Food Preparation & Serving | 0 (0.0%) | 0 (0.0%) |
| Cleaning & Maintenance | 1 (100.0%) | 0 (0.0%) |
| Personal Care & Service | 0 (0.0%) | 0 (0.0%) |
| Total (Category) | 10 (100.0%) | 0 (0.0%) |
| Total (Overall) | 34 (59.7%) | 23 (40.4%) |
Sales and Office Occupations
The most common Sales and Office occupations in Sunizona are , and Office & Administration (12 | 21.0%).
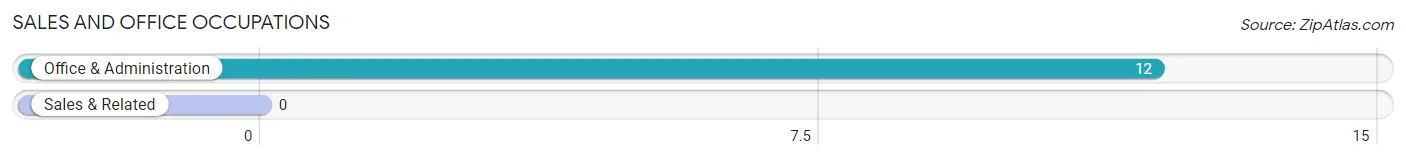
Sales and Office Occupations by Sex
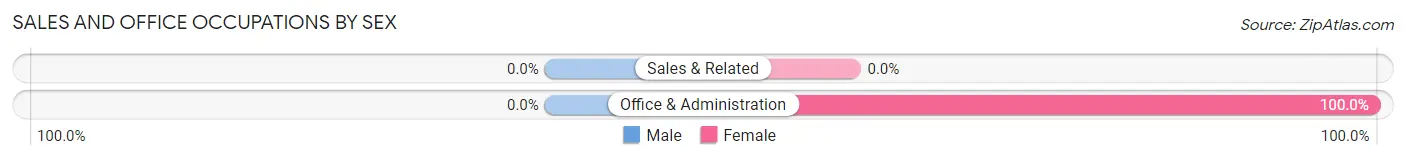
| Occupation | Male | Female |
| Sales & Related | 0 (0.0%) | 0 (0.0%) |
| Office & Administration | 0 (0.0%) | 12 (100.0%) |
| Total (Category) | 0 (0.0%) | 12 (100.0%) |
| Total (Overall) | 34 (59.7%) | 23 (40.4%) |
Natural Resources, Construction and Maintenance Occupations
The most common Natural Resources, Construction and Maintenance occupations in Sunizona are , and Construction & Extraction (2 | 3.5%).
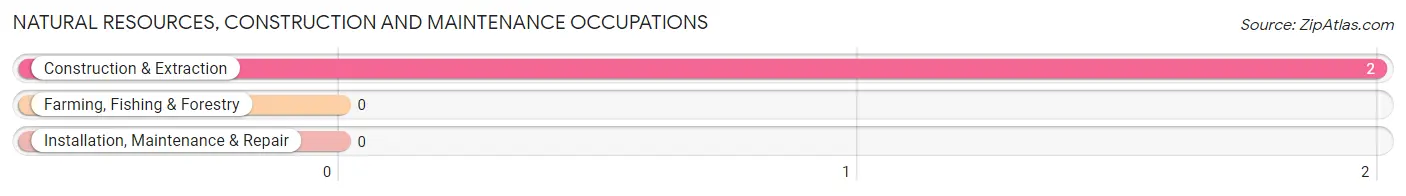
Natural Resources, Construction and Maintenance Occupations by Sex
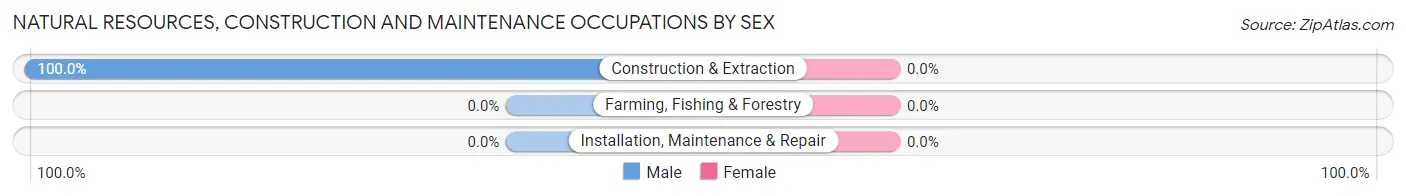
| Occupation | Male | Female |
| Farming, Fishing & Forestry | 0 (0.0%) | 0 (0.0%) |
| Construction & Extraction | 2 (100.0%) | 0 (0.0%) |
| Installation, Maintenance & Repair | 0 (0.0%) | 0 (0.0%) |
| Total (Category) | 2 (100.0%) | 0 (0.0%) |
| Total (Overall) | 34 (59.7%) | 23 (40.4%) |
Production, Transportation and Moving Occupations
The most common Production, Transportation and Moving occupations in Sunizona are Material Moving (10 | 17.5%), and Production (5 | 8.8%).
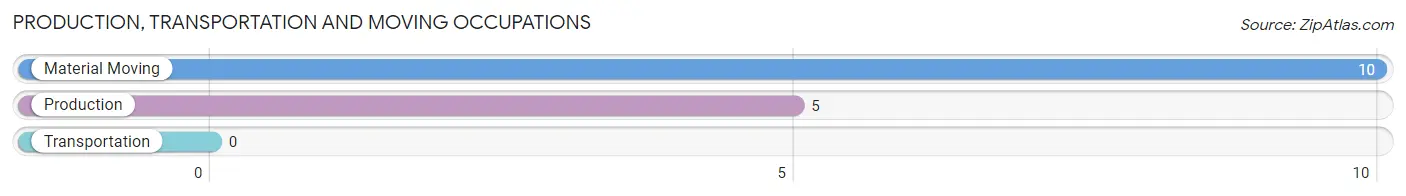
Production, Transportation and Moving Occupations by Sex
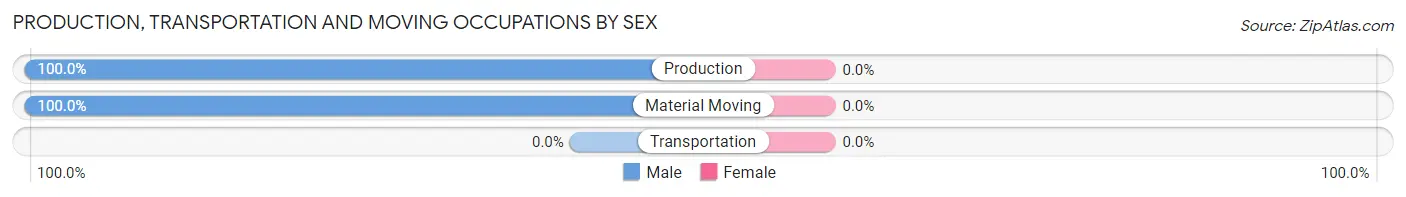
| Occupation | Male | Female |
| Production | 5 (100.0%) | 0 (0.0%) |
| Transportation | 0 (0.0%) | 0 (0.0%) |
| Material Moving | 10 (100.0%) | 0 (0.0%) |
| Total (Category) | 15 (100.0%) | 0 (0.0%) |
| Total (Overall) | 34 (59.7%) | 23 (40.4%) |
Employment Industries by Sex in Sunizona
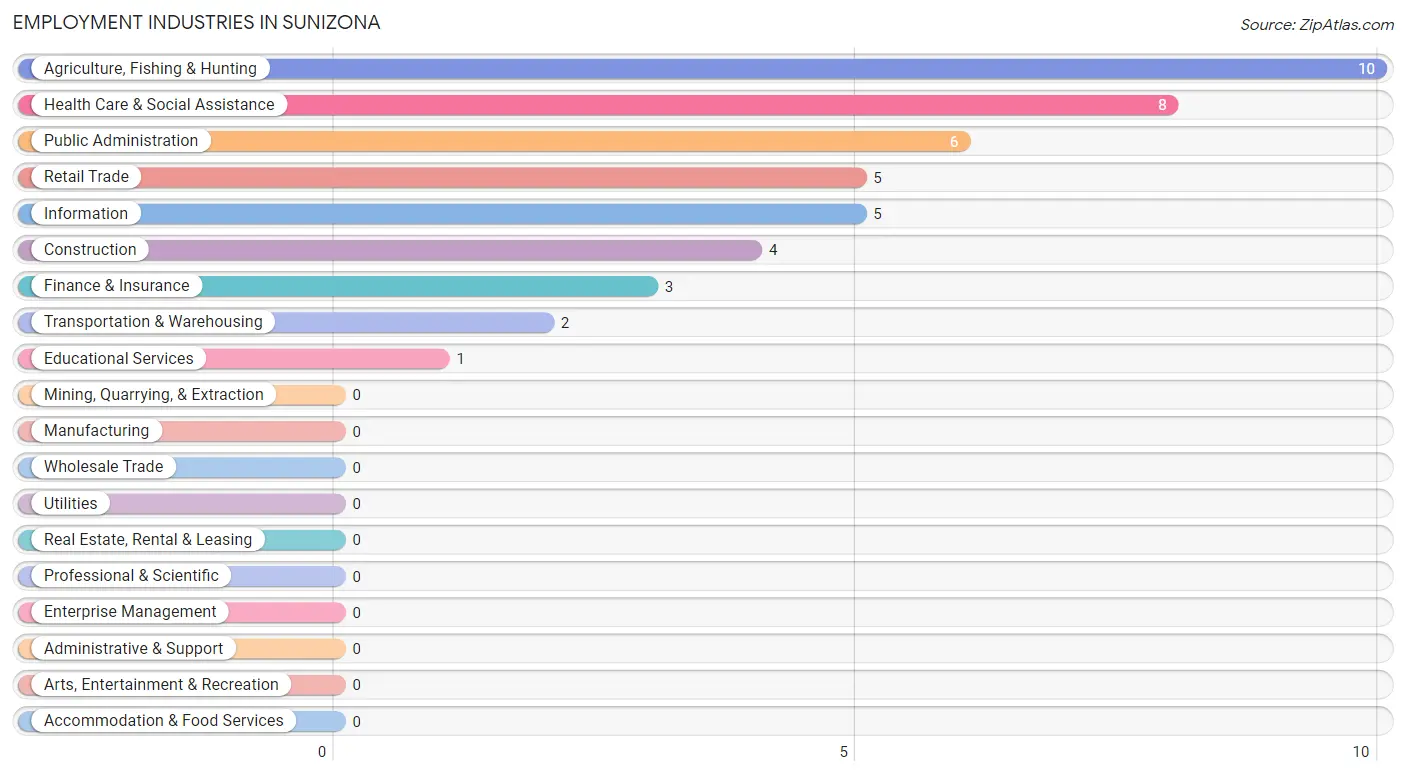
Employment Industries in Sunizona
The major employment industries in Sunizona include Agriculture, Fishing & Hunting (10 | 17.5%), Health Care & Social Assistance (8 | 14.0%), Public Administration (6 | 10.5%), Retail Trade (5 | 8.8%), and Information (5 | 8.8%).
Employment Industries by Sex in Sunizona
The Sunizona industries that see more men than women are Construction (100.0%), Retail Trade (100.0%), and Educational Services (100.0%), whereas the industries that tend to have a higher number of women are Transportation & Warehousing (100.0%), Information (100.0%), and Finance & Insurance (100.0%).
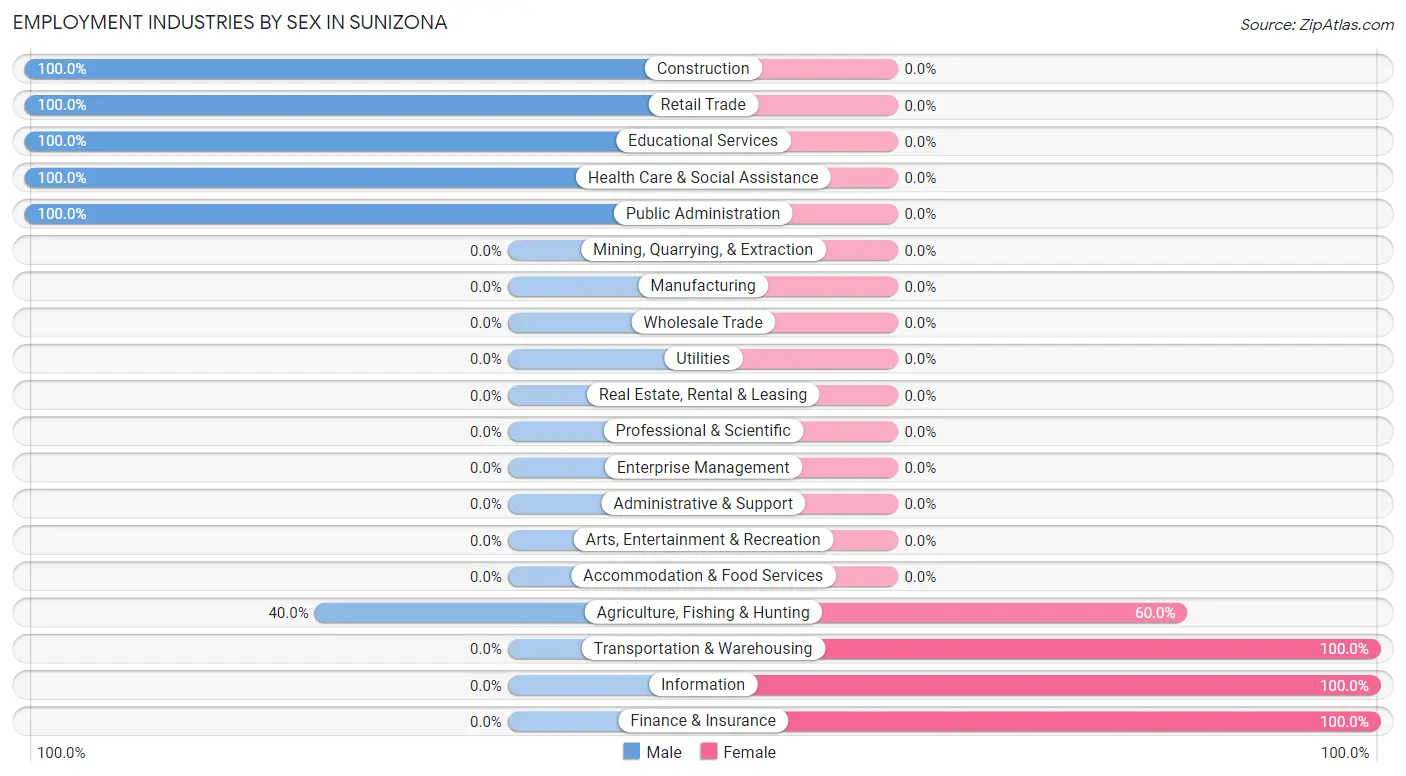
| Industry | Male | Female |
| Agriculture, Fishing & Hunting | 4 (40.0%) | 6 (60.0%) |
| Mining, Quarrying, & Extraction | 0 (0.0%) | 0 (0.0%) |
| Construction | 4 (100.0%) | 0 (0.0%) |
| Manufacturing | 0 (0.0%) | 0 (0.0%) |
| Wholesale Trade | 0 (0.0%) | 0 (0.0%) |
| Retail Trade | 5 (100.0%) | 0 (0.0%) |
| Transportation & Warehousing | 0 (0.0%) | 2 (100.0%) |
| Utilities | 0 (0.0%) | 0 (0.0%) |
| Information | 0 (0.0%) | 5 (100.0%) |
| Finance & Insurance | 0 (0.0%) | 3 (100.0%) |
| Real Estate, Rental & Leasing | 0 (0.0%) | 0 (0.0%) |
| Professional & Scientific | 0 (0.0%) | 0 (0.0%) |
| Enterprise Management | 0 (0.0%) | 0 (0.0%) |
| Administrative & Support | 0 (0.0%) | 0 (0.0%) |
| Educational Services | 1 (100.0%) | 0 (0.0%) |
| Health Care & Social Assistance | 8 (100.0%) | 0 (0.0%) |
| Arts, Entertainment & Recreation | 0 (0.0%) | 0 (0.0%) |
| Accommodation & Food Services | 0 (0.0%) | 0 (0.0%) |
| Public Administration | 6 (100.0%) | 0 (0.0%) |
| Total | 34 (59.7%) | 23 (40.4%) |
Education in Sunizona
School Enrollment in Sunizona
The most common levels of schooling among the 35 students in Sunizona are elementary school (28 | 80.0%), high school (4 | 11.4%), and middle school (3 | 8.6%).
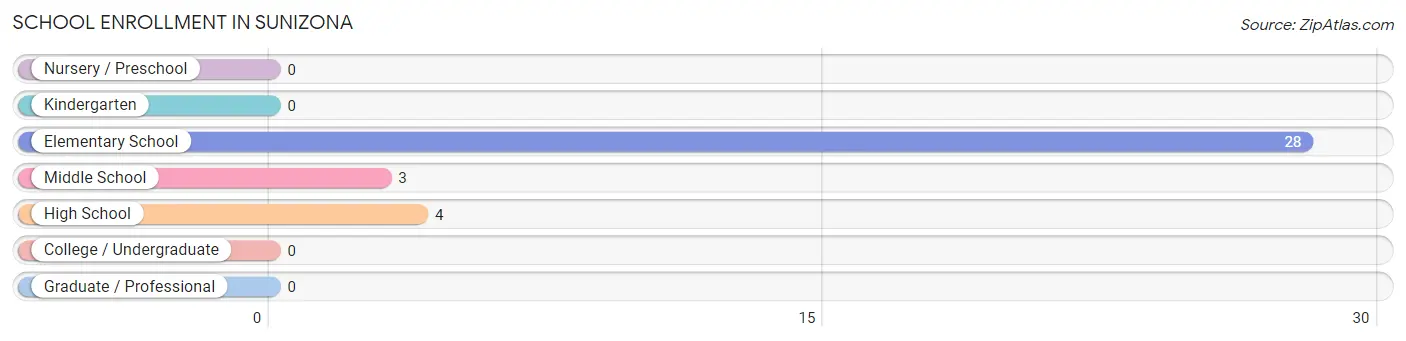
| School Level | # Students | % Students |
| Nursery / Preschool | 0 | 0.0% |
| Kindergarten | 0 | 0.0% |
| Elementary School | 28 | 80.0% |
| Middle School | 3 | 8.6% |
| High School | 4 | 11.4% |
| College / Undergraduate | 0 | 0.0% |
| Graduate / Professional | 0 | 0.0% |
| Total | 35 | 100.0% |
School Enrollment by Age by Funding Source in Sunizona
Out of a total of 35 students who are enrolled in schools in Sunizona, 9 (25.7%) attend a private institution, while the remaining 26 (74.3%) are enrolled in public schools. The age group of 10 to 14 year olds has the highest likelihood of being enrolled in private schools, with 3 (33.3% in the age bracket) enrolled. Conversely, the age group of 18 to 19 year olds has the lowest likelihood of being enrolled in a private school, with 4 (100.0% in the age bracket) attending a public institution.
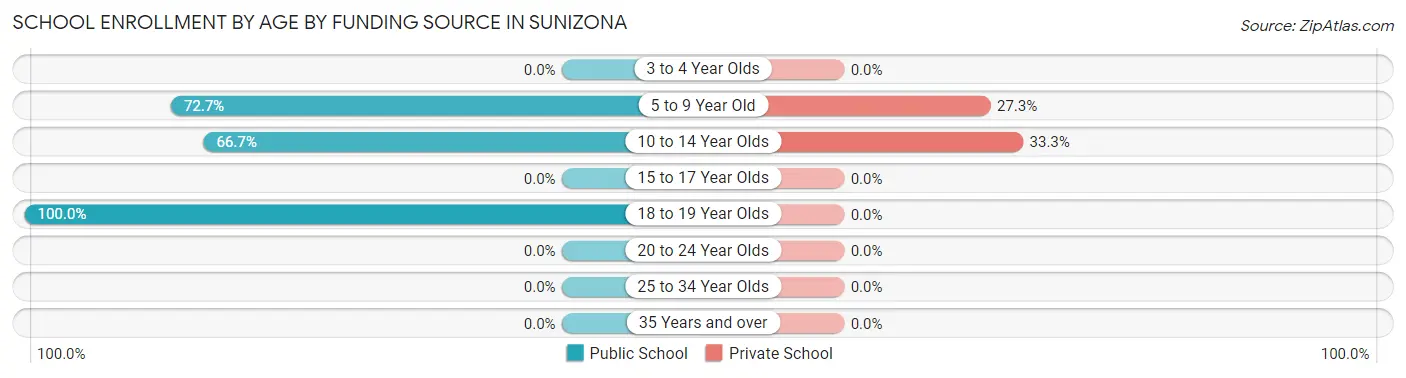
| Age Bracket | Public School | Private School |
| 3 to 4 Year Olds | 0 (0.0%) | 0 (0.0%) |
| 5 to 9 Year Old | 16 (72.7%) | 6 (27.3%) |
| 10 to 14 Year Olds | 6 (66.7%) | 3 (33.3%) |
| 15 to 17 Year Olds | 0 (0.0%) | 0 (0.0%) |
| 18 to 19 Year Olds | 4 (100.0%) | 0 (0.0%) |
| 20 to 24 Year Olds | 0 (0.0%) | 0 (0.0%) |
| 25 to 34 Year Olds | 0 (0.0%) | 0 (0.0%) |
| 35 Years and over | 0 (0.0%) | 0 (0.0%) |
| Total | 26 (74.3%) | 9 (25.7%) |
Educational Attainment by Field of Study in Sunizona
Engineering (9 | 40.9%), visual & performing arts (5 | 22.7%), liberal arts & history (3 | 13.6%), physical & health sciences (2 | 9.1%), and arts & humanities (2 | 9.1%) are the most common fields of study among 22 individuals in Sunizona who have obtained a bachelor's degree or higher.
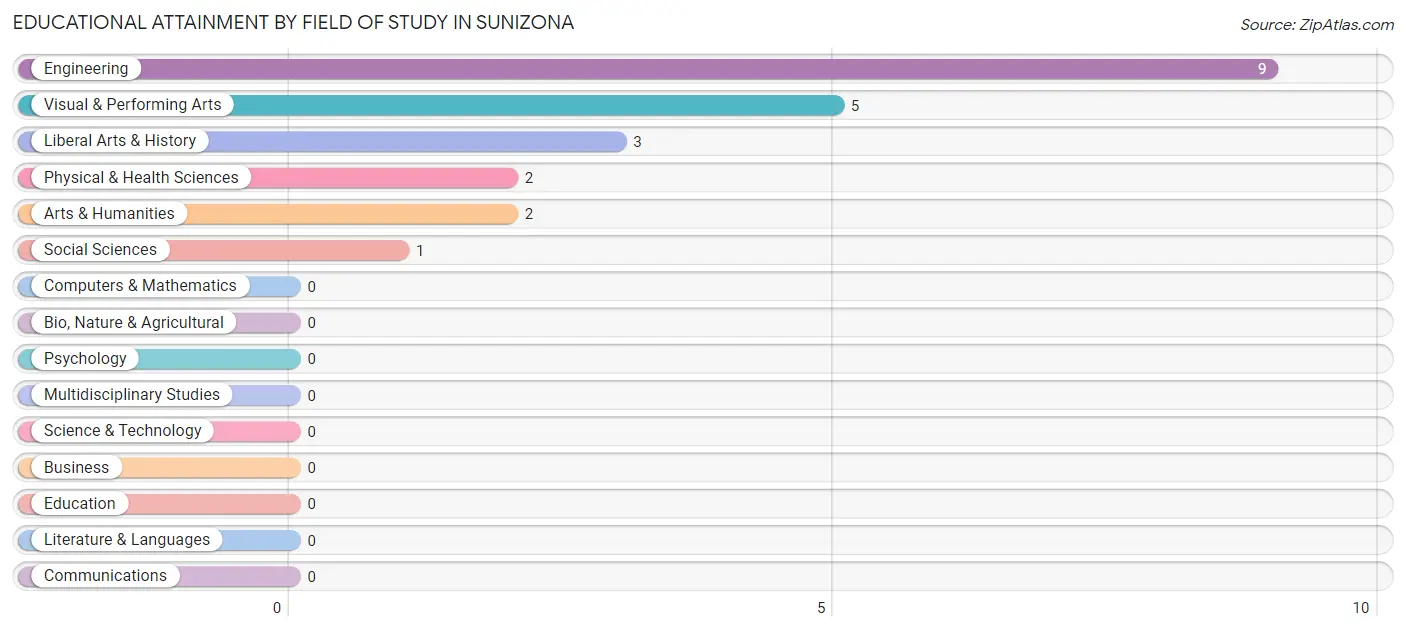
| Field of Study | # Graduates | % Graduates |
| Computers & Mathematics | 0 | 0.0% |
| Bio, Nature & Agricultural | 0 | 0.0% |
| Physical & Health Sciences | 2 | 9.1% |
| Psychology | 0 | 0.0% |
| Social Sciences | 1 | 4.5% |
| Engineering | 9 | 40.9% |
| Multidisciplinary Studies | 0 | 0.0% |
| Science & Technology | 0 | 0.0% |
| Business | 0 | 0.0% |
| Education | 0 | 0.0% |
| Literature & Languages | 0 | 0.0% |
| Liberal Arts & History | 3 | 13.6% |
| Visual & Performing Arts | 5 | 22.7% |
| Communications | 0 | 0.0% |
| Arts & Humanities | 2 | 9.1% |
| Total | 22 | 100.0% |
Transportation & Commute in Sunizona
Vehicle Availability by Sex in Sunizona
The most prevalent vehicle ownership categories in Sunizona are males with 2 vehicles (18, accounting for 58.1%) and females with 2 vehicles (18, making up 78.3%).
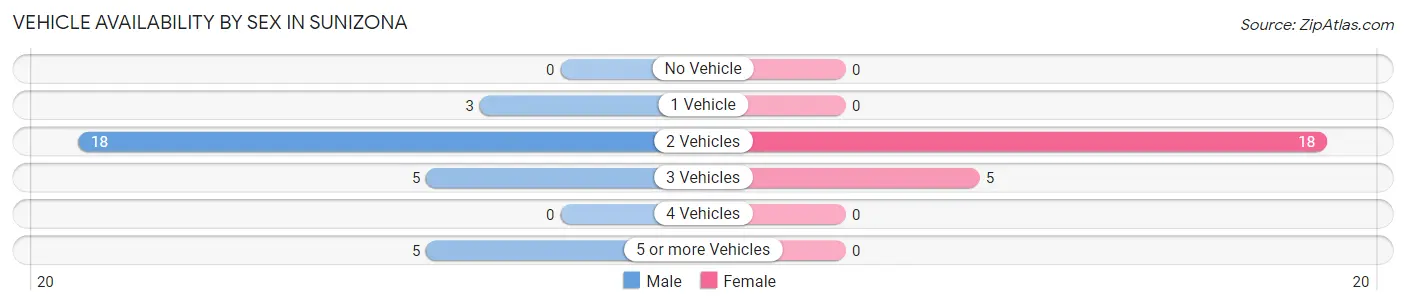
| Vehicles Available | Male | Female |
| No Vehicle | 0 (0.0%) | 0 (0.0%) |
| 1 Vehicle | 3 (9.7%) | 0 (0.0%) |
| 2 Vehicles | 18 (58.1%) | 18 (78.3%) |
| 3 Vehicles | 5 (16.1%) | 5 (21.7%) |
| 4 Vehicles | 0 (0.0%) | 0 (0.0%) |
| 5 or more Vehicles | 5 (16.1%) | 0 (0.0%) |
| Total | 31 (100.0%) | 23 (100.0%) |
Commute Time in Sunizona
The most frequently occuring commute durations in Sunizona are 20 to 24 minutes (18 commuters, 39.1%), 45 to 59 minutes (9 commuters, 19.6%), and 15 to 19 minutes (7 commuters, 15.2%).
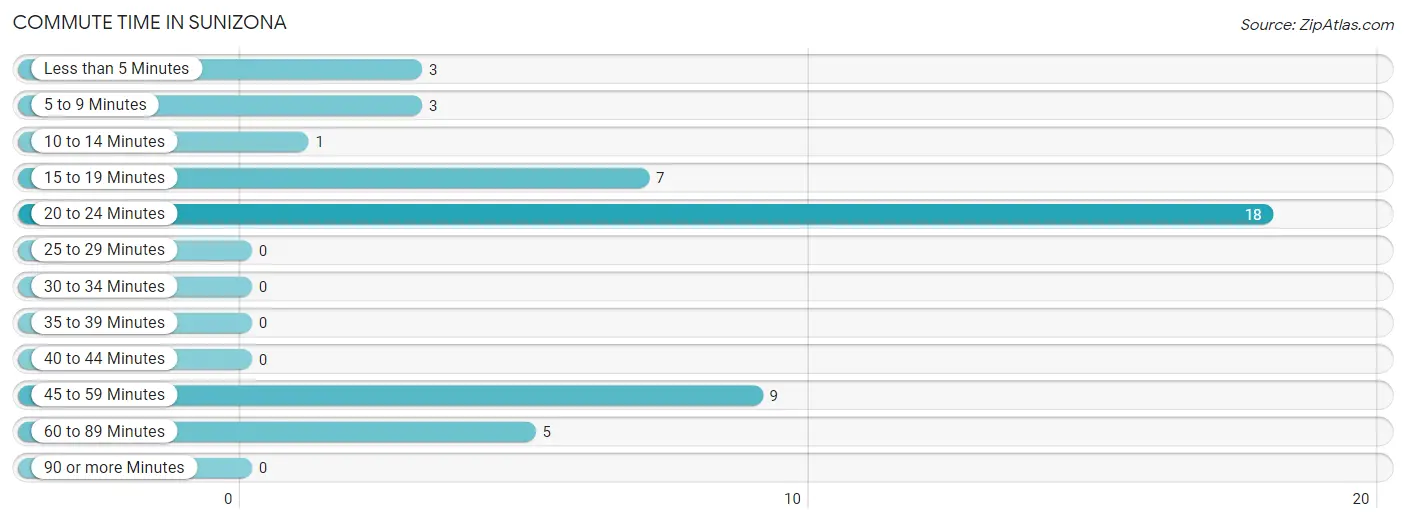
| Commute Time | # Commuters | % Commuters |
| Less than 5 Minutes | 3 | 6.5% |
| 5 to 9 Minutes | 3 | 6.5% |
| 10 to 14 Minutes | 1 | 2.2% |
| 15 to 19 Minutes | 7 | 15.2% |
| 20 to 24 Minutes | 18 | 39.1% |
| 25 to 29 Minutes | 0 | 0.0% |
| 30 to 34 Minutes | 0 | 0.0% |
| 35 to 39 Minutes | 0 | 0.0% |
| 40 to 44 Minutes | 0 | 0.0% |
| 45 to 59 Minutes | 9 | 19.6% |
| 60 to 89 Minutes | 5 | 10.9% |
| 90 or more Minutes | 0 | 0.0% |
Commute Time by Sex in Sunizona
The most common commute times in Sunizona are 20 to 24 minutes (12 commuters, 46.2%) for males and 15 to 19 minutes (7 commuters, 35.0%) for females.
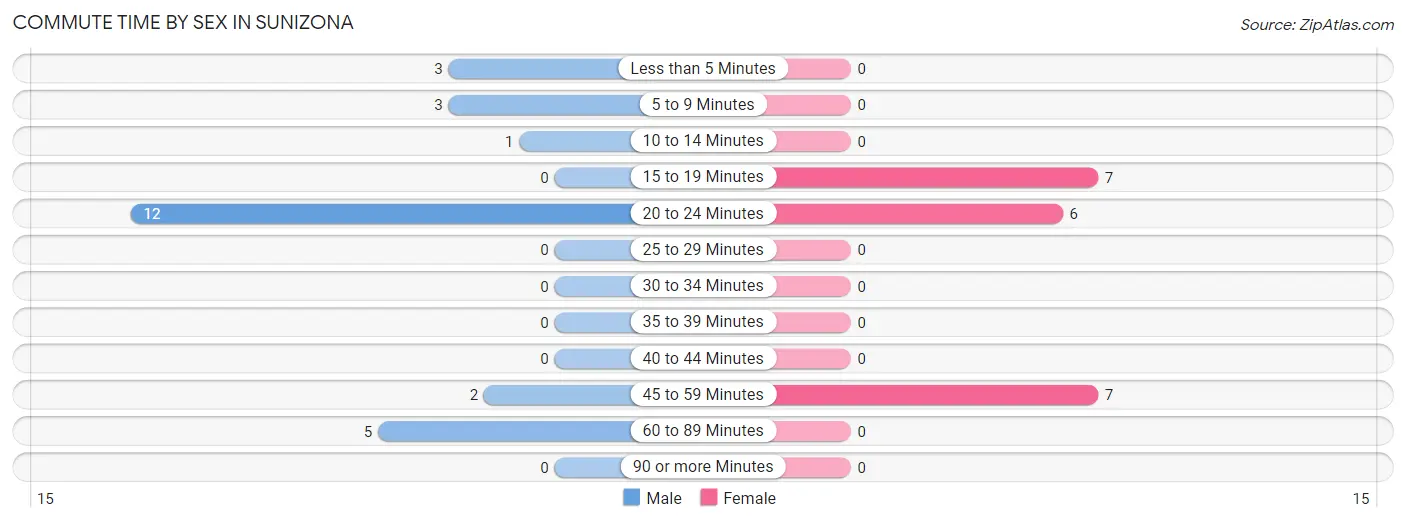
| Commute Time | Male | Female |
| Less than 5 Minutes | 3 (11.5%) | 0 (0.0%) |
| 5 to 9 Minutes | 3 (11.5%) | 0 (0.0%) |
| 10 to 14 Minutes | 1 (3.8%) | 0 (0.0%) |
| 15 to 19 Minutes | 0 (0.0%) | 7 (35.0%) |
| 20 to 24 Minutes | 12 (46.2%) | 6 (30.0%) |
| 25 to 29 Minutes | 0 (0.0%) | 0 (0.0%) |
| 30 to 34 Minutes | 0 (0.0%) | 0 (0.0%) |
| 35 to 39 Minutes | 0 (0.0%) | 0 (0.0%) |
| 40 to 44 Minutes | 0 (0.0%) | 0 (0.0%) |
| 45 to 59 Minutes | 2 (7.7%) | 7 (35.0%) |
| 60 to 89 Minutes | 5 (19.2%) | 0 (0.0%) |
| 90 or more Minutes | 0 (0.0%) | 0 (0.0%) |
Time of Departure to Work by Sex in Sunizona
The most frequent times of departure to work in Sunizona are 7:00 AM to 7:29 AM (11, 42.3%) for males and 7:00 AM to 7:29 AM (9, 45.0%) for females.
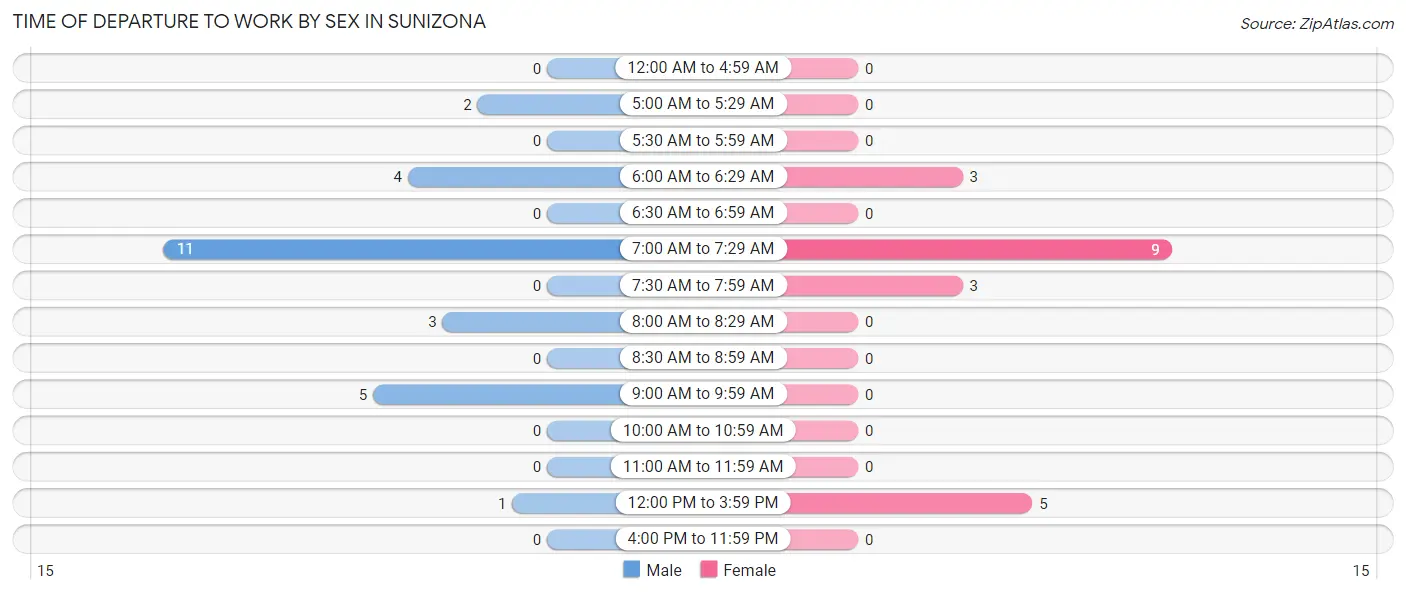
| Time of Departure | Male | Female |
| 12:00 AM to 4:59 AM | 0 (0.0%) | 0 (0.0%) |
| 5:00 AM to 5:29 AM | 2 (7.7%) | 0 (0.0%) |
| 5:30 AM to 5:59 AM | 0 (0.0%) | 0 (0.0%) |
| 6:00 AM to 6:29 AM | 4 (15.4%) | 3 (15.0%) |
| 6:30 AM to 6:59 AM | 0 (0.0%) | 0 (0.0%) |
| 7:00 AM to 7:29 AM | 11 (42.3%) | 9 (45.0%) |
| 7:30 AM to 7:59 AM | 0 (0.0%) | 3 (15.0%) |
| 8:00 AM to 8:29 AM | 3 (11.5%) | 0 (0.0%) |
| 8:30 AM to 8:59 AM | 0 (0.0%) | 0 (0.0%) |
| 9:00 AM to 9:59 AM | 5 (19.2%) | 0 (0.0%) |
| 10:00 AM to 10:59 AM | 0 (0.0%) | 0 (0.0%) |
| 11:00 AM to 11:59 AM | 0 (0.0%) | 0 (0.0%) |
| 12:00 PM to 3:59 PM | 1 (3.8%) | 5 (25.0%) |
| 4:00 PM to 11:59 PM | 0 (0.0%) | 0 (0.0%) |
| Total | 26 (100.0%) | 20 (100.0%) |
Housing Occupancy in Sunizona
Occupancy by Ownership in Sunizona
Of the total 123 dwellings in Sunizona, owner-occupied units account for 102 (82.9%), while renter-occupied units make up 21 (17.1%).
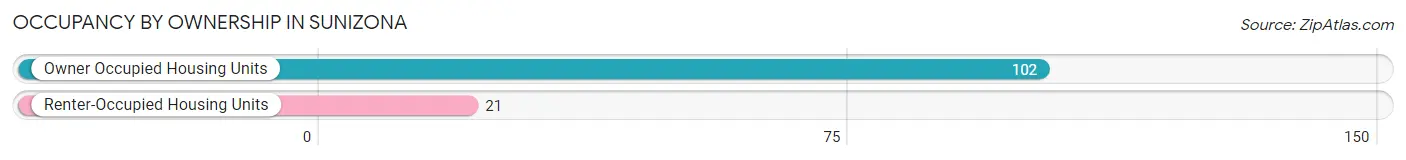
| Occupancy | # Housing Units | % Housing Units |
| Owner Occupied Housing Units | 102 | 82.9% |
| Renter-Occupied Housing Units | 21 | 17.1% |
| Total Occupied Housing Units | 123 | 100.0% |
Occupancy by Household Size in Sunizona
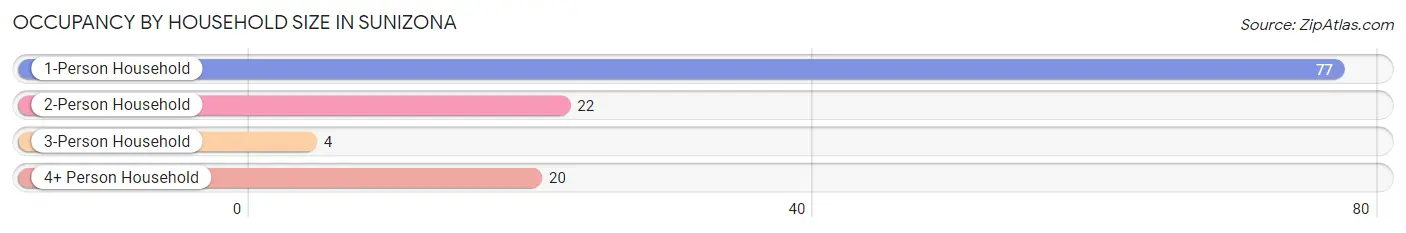
| Household Size | # Housing Units | % Housing Units |
| 1-Person Household | 77 | 62.6% |
| 2-Person Household | 22 | 17.9% |
| 3-Person Household | 4 | 3.3% |
| 4+ Person Household | 20 | 16.3% |
| Total Housing Units | 123 | 100.0% |
Occupancy by Ownership by Household Size in Sunizona
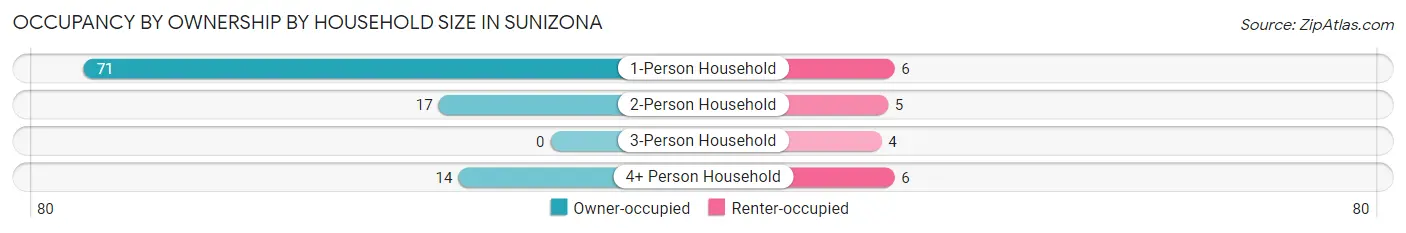
| Household Size | Owner-occupied | Renter-occupied |
| 1-Person Household | 71 (92.2%) | 6 (7.8%) |
| 2-Person Household | 17 (77.3%) | 5 (22.7%) |
| 3-Person Household | 0 (0.0%) | 4 (100.0%) |
| 4+ Person Household | 14 (70.0%) | 6 (30.0%) |
| Total Housing Units | 102 (82.9%) | 21 (17.1%) |
Occupancy by Educational Attainment in Sunizona
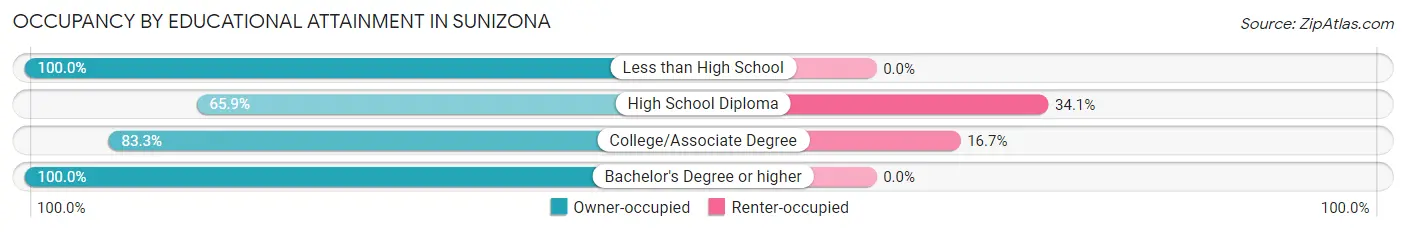
| Household Size | Owner-occupied | Renter-occupied |
| Less than High School | 26 (100.0%) | 0 (0.0%) |
| High School Diploma | 29 (65.9%) | 15 (34.1%) |
| College/Associate Degree | 30 (83.3%) | 6 (16.7%) |
| Bachelor's Degree or higher | 17 (100.0%) | 0 (0.0%) |
Occupancy by Age of Householder in Sunizona
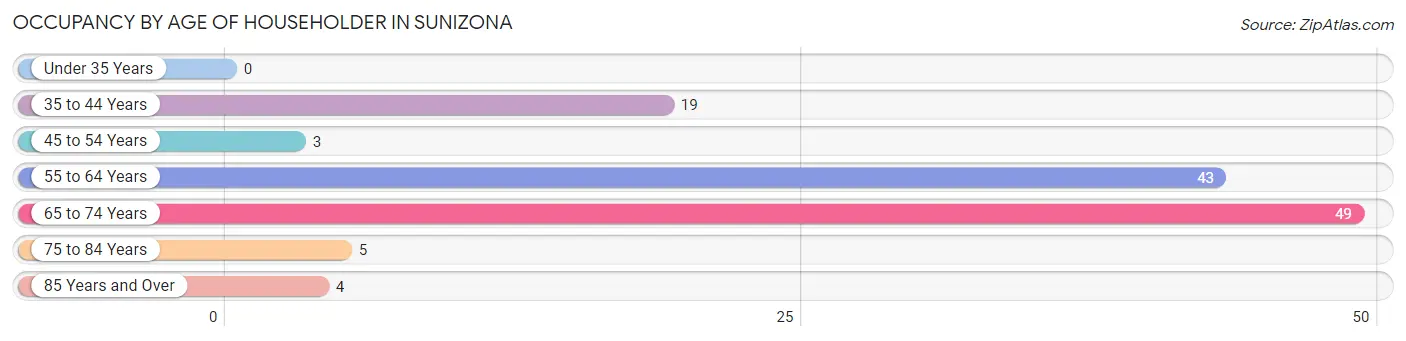
| Age Bracket | # Households | % Households |
| Under 35 Years | 0 | 0.0% |
| 35 to 44 Years | 19 | 15.4% |
| 45 to 54 Years | 3 | 2.4% |
| 55 to 64 Years | 43 | 35.0% |
| 65 to 74 Years | 49 | 39.8% |
| 75 to 84 Years | 5 | 4.1% |
| 85 Years and Over | 4 | 3.3% |
| Total | 123 | 100.0% |
Housing Finances in Sunizona
Median Income by Occupancy in Sunizona
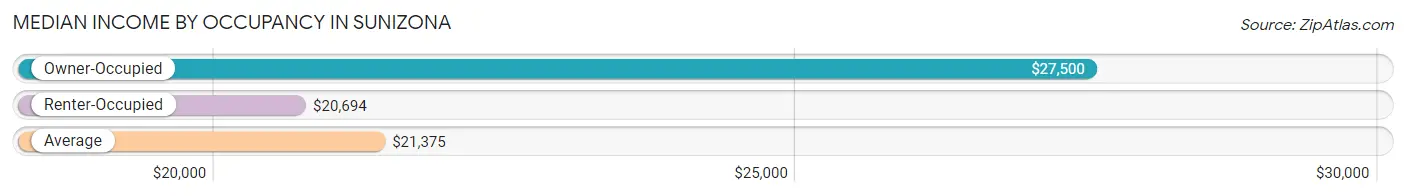
| Occupancy Type | # Households | Median Income |
| Owner-Occupied | 102 (82.9%) | $27,500 |
| Renter-Occupied | 21 (17.1%) | $20,694 |
| Average | 123 (100.0%) | $21,375 |
Occupancy by Householder Income Bracket in Sunizona
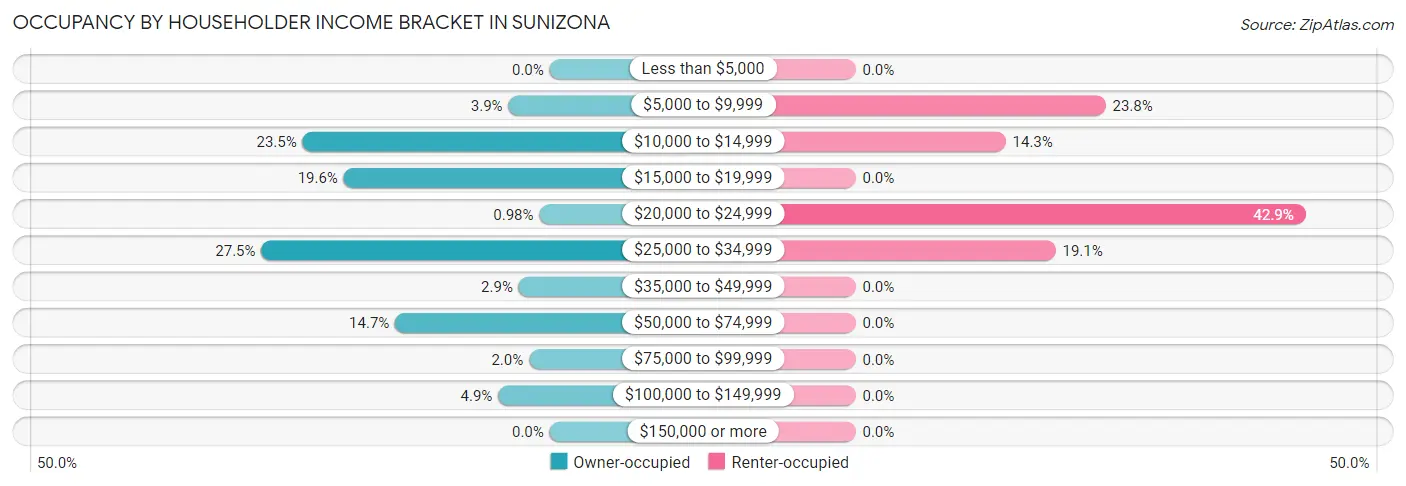
| Income Bracket | Owner-occupied | Renter-occupied |
| Less than $5,000 | 0 (0.0%) | 0 (0.0%) |
| $5,000 to $9,999 | 4 (3.9%) | 5 (23.8%) |
| $10,000 to $14,999 | 24 (23.5%) | 3 (14.3%) |
| $15,000 to $19,999 | 20 (19.6%) | 0 (0.0%) |
| $20,000 to $24,999 | 1 (1.0%) | 9 (42.9%) |
| $25,000 to $34,999 | 28 (27.5%) | 4 (19.1%) |
| $35,000 to $49,999 | 3 (2.9%) | 0 (0.0%) |
| $50,000 to $74,999 | 15 (14.7%) | 0 (0.0%) |
| $75,000 to $99,999 | 2 (2.0%) | 0 (0.0%) |
| $100,000 to $149,999 | 5 (4.9%) | 0 (0.0%) |
| $150,000 or more | 0 (0.0%) | 0 (0.0%) |
| Total | 102 (100.0%) | 21 (100.0%) |
Monthly Housing Cost Tiers in Sunizona
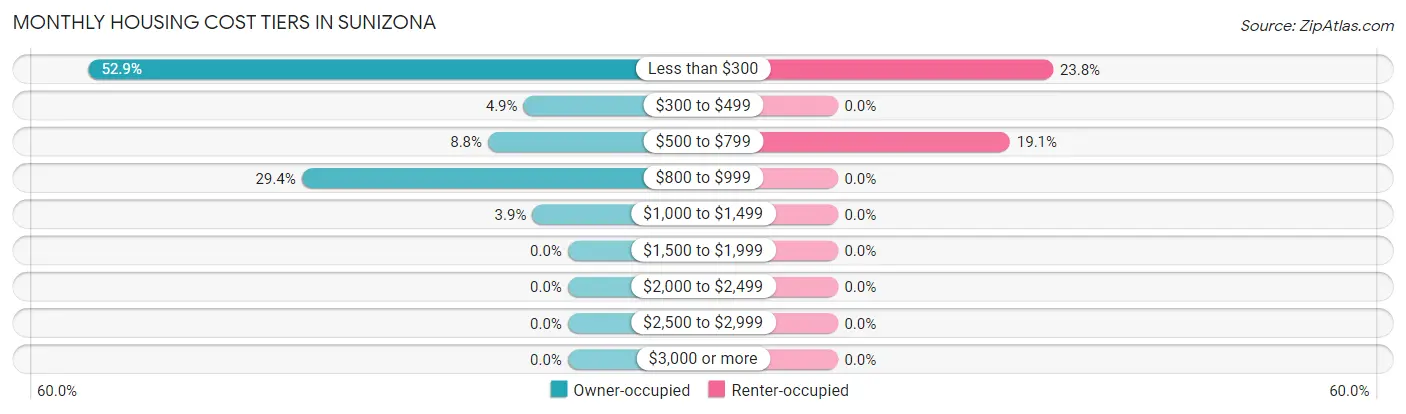
| Monthly Cost | Owner-occupied | Renter-occupied |
| Less than $300 | 54 (52.9%) | 5 (23.8%) |
| $300 to $499 | 5 (4.9%) | 0 (0.0%) |
| $500 to $799 | 9 (8.8%) | 4 (19.1%) |
| $800 to $999 | 30 (29.4%) | 0 (0.0%) |
| $1,000 to $1,499 | 4 (3.9%) | 0 (0.0%) |
| $1,500 to $1,999 | 0 (0.0%) | 0 (0.0%) |
| $2,000 to $2,499 | 0 (0.0%) | 0 (0.0%) |
| $2,500 to $2,999 | 0 (0.0%) | 0 (0.0%) |
| $3,000 or more | 0 (0.0%) | 0 (0.0%) |
| Total | 102 (100.0%) | 21 (100.0%) |
Physical Housing Characteristics in Sunizona
Housing Structures in Sunizona
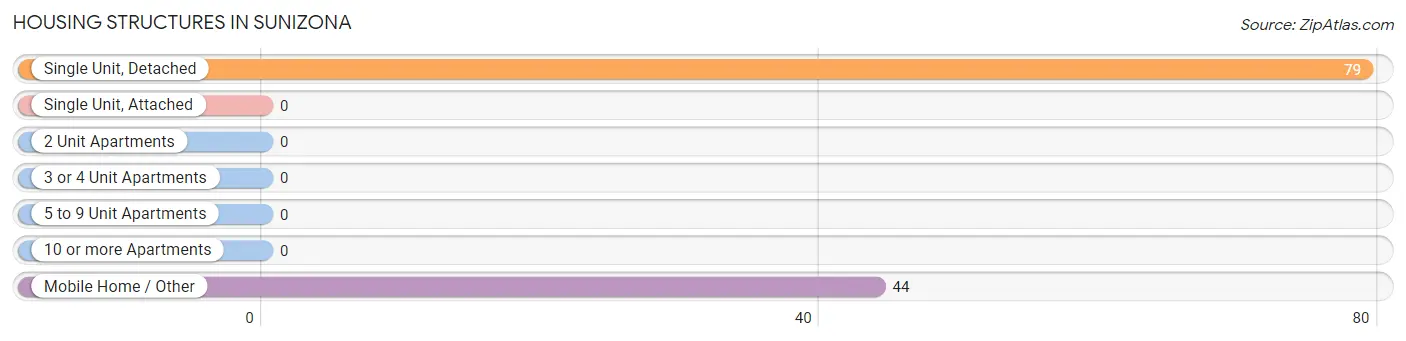
| Structure Type | # Housing Units | % Housing Units |
| Single Unit, Detached | 79 | 64.2% |
| Single Unit, Attached | 0 | 0.0% |
| 2 Unit Apartments | 0 | 0.0% |
| 3 or 4 Unit Apartments | 0 | 0.0% |
| 5 to 9 Unit Apartments | 0 | 0.0% |
| 10 or more Apartments | 0 | 0.0% |
| Mobile Home / Other | 44 | 35.8% |
| Total | 123 | 100.0% |
Housing Structures by Occupancy in Sunizona
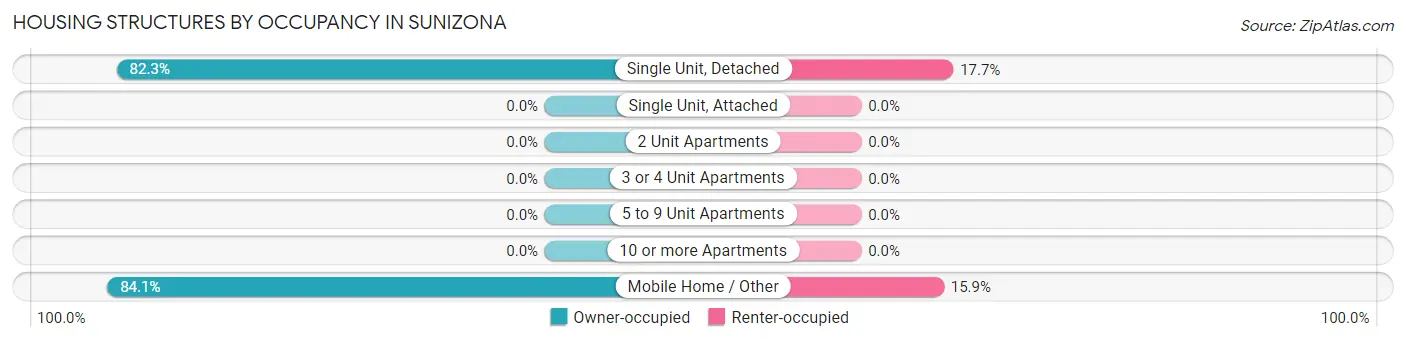
| Structure Type | Owner-occupied | Renter-occupied |
| Single Unit, Detached | 65 (82.3%) | 14 (17.7%) |
| Single Unit, Attached | 0 (0.0%) | 0 (0.0%) |
| 2 Unit Apartments | 0 (0.0%) | 0 (0.0%) |
| 3 or 4 Unit Apartments | 0 (0.0%) | 0 (0.0%) |
| 5 to 9 Unit Apartments | 0 (0.0%) | 0 (0.0%) |
| 10 or more Apartments | 0 (0.0%) | 0 (0.0%) |
| Mobile Home / Other | 37 (84.1%) | 7 (15.9%) |
| Total | 102 (82.9%) | 21 (17.1%) |
Housing Structures by Number of Rooms in Sunizona
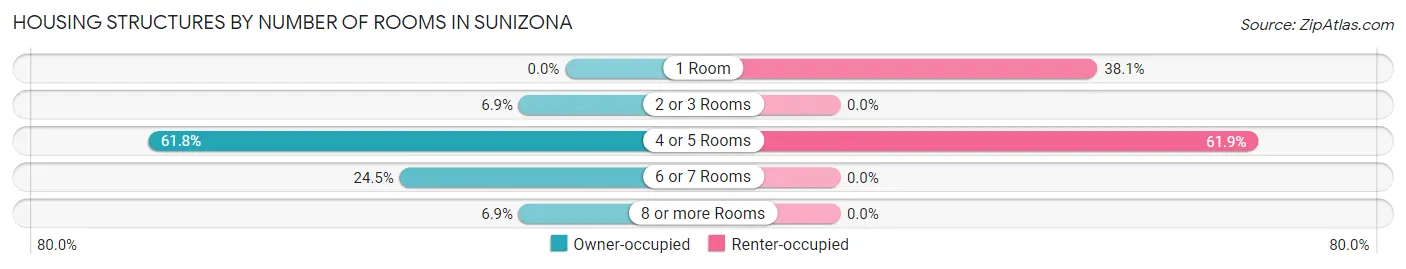
| Number of Rooms | Owner-occupied | Renter-occupied |
| 1 Room | 0 (0.0%) | 8 (38.1%) |
| 2 or 3 Rooms | 7 (6.9%) | 0 (0.0%) |
| 4 or 5 Rooms | 63 (61.8%) | 13 (61.9%) |
| 6 or 7 Rooms | 25 (24.5%) | 0 (0.0%) |
| 8 or more Rooms | 7 (6.9%) | 0 (0.0%) |
| Total | 102 (100.0%) | 21 (100.0%) |
Housing Structure by Heating Type in Sunizona
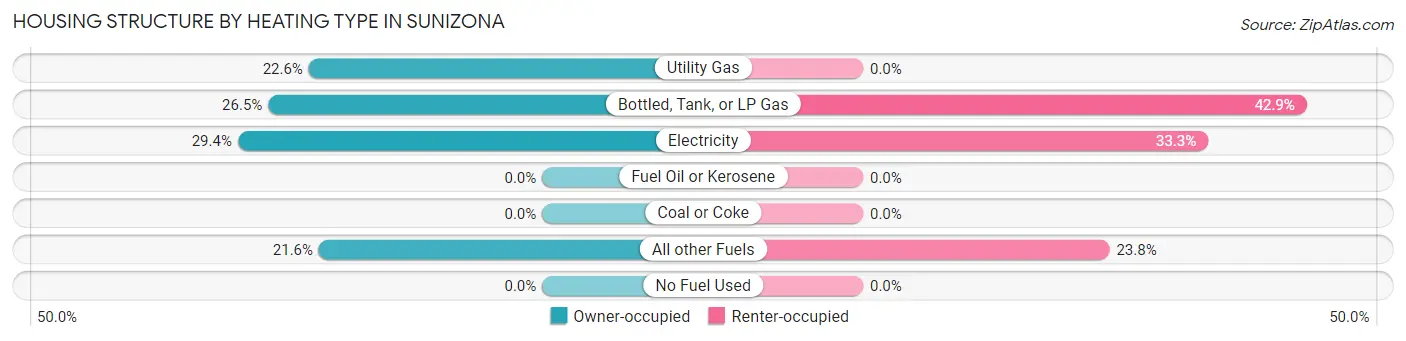
| Heating Type | Owner-occupied | Renter-occupied |
| Utility Gas | 23 (22.6%) | 0 (0.0%) |
| Bottled, Tank, or LP Gas | 27 (26.5%) | 9 (42.9%) |
| Electricity | 30 (29.4%) | 7 (33.3%) |
| Fuel Oil or Kerosene | 0 (0.0%) | 0 (0.0%) |
| Coal or Coke | 0 (0.0%) | 0 (0.0%) |
| All other Fuels | 22 (21.6%) | 5 (23.8%) |
| No Fuel Used | 0 (0.0%) | 0 (0.0%) |
| Total | 102 (100.0%) | 21 (100.0%) |
Household Vehicle Usage in Sunizona
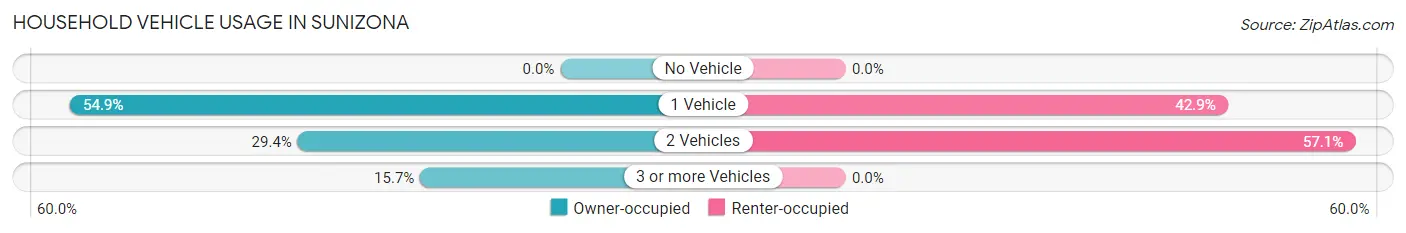
| Vehicles per Household | Owner-occupied | Renter-occupied |
| No Vehicle | 0 (0.0%) | 0 (0.0%) |
| 1 Vehicle | 56 (54.9%) | 9 (42.9%) |
| 2 Vehicles | 30 (29.4%) | 12 (57.1%) |
| 3 or more Vehicles | 16 (15.7%) | 0 (0.0%) |
| Total | 102 (100.0%) | 21 (100.0%) |
Real Estate & Mortgages in Sunizona
Real Estate and Mortgage Overview in Sunizona
| Characteristic | Without Mortgage | With Mortgage |
| Housing Units | 60 | 42 |
| Median Property Value | $42,100 | $0 |
| Median Household Income | $15,781 | $0 |
| Monthly Housing Costs | $179 | $0 |
| Real Estate Taxes | $700 | $0 |
Property Value by Mortgage Status in Sunizona
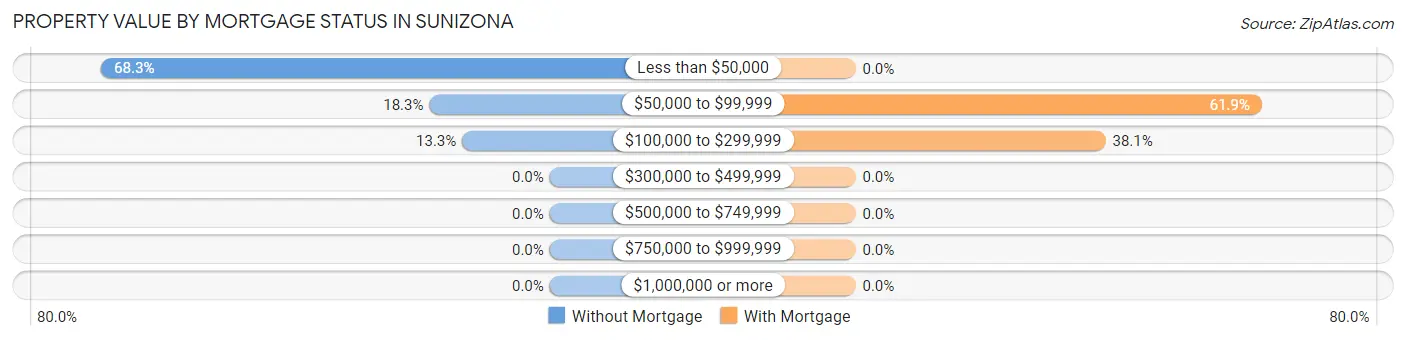
| Property Value | Without Mortgage | With Mortgage |
| Less than $50,000 | 41 (68.3%) | 0 (0.0%) |
| $50,000 to $99,999 | 11 (18.3%) | 26 (61.9%) |
| $100,000 to $299,999 | 8 (13.3%) | 16 (38.1%) |
| $300,000 to $499,999 | 0 (0.0%) | 0 (0.0%) |
| $500,000 to $749,999 | 0 (0.0%) | 0 (0.0%) |
| $750,000 to $999,999 | 0 (0.0%) | 0 (0.0%) |
| $1,000,000 or more | 0 (0.0%) | 0 (0.0%) |
| Total | 60 (100.0%) | 42 (100.0%) |
Household Income by Mortgage Status in Sunizona
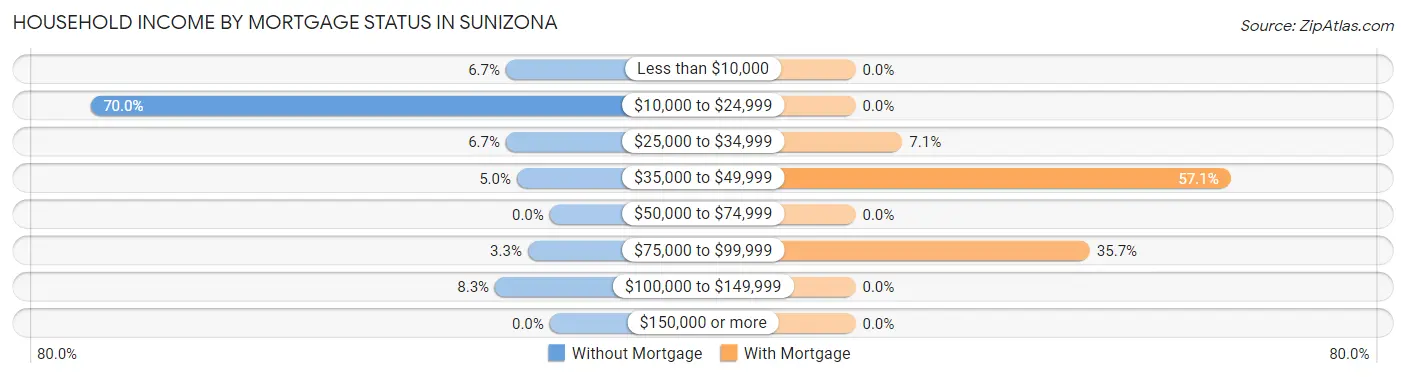
| Household Income | Without Mortgage | With Mortgage |
| Less than $10,000 | 4 (6.7%) | 0 (0.0%) |
| $10,000 to $24,999 | 42 (70.0%) | 0 (0.0%) |
| $25,000 to $34,999 | 4 (6.7%) | 3 (7.1%) |
| $35,000 to $49,999 | 3 (5.0%) | 24 (57.1%) |
| $50,000 to $74,999 | 0 (0.0%) | 0 (0.0%) |
| $75,000 to $99,999 | 2 (3.3%) | 15 (35.7%) |
| $100,000 to $149,999 | 5 (8.3%) | 0 (0.0%) |
| $150,000 or more | 0 (0.0%) | 0 (0.0%) |
| Total | 60 (100.0%) | 42 (100.0%) |
Property Value to Household Income Ratio in Sunizona
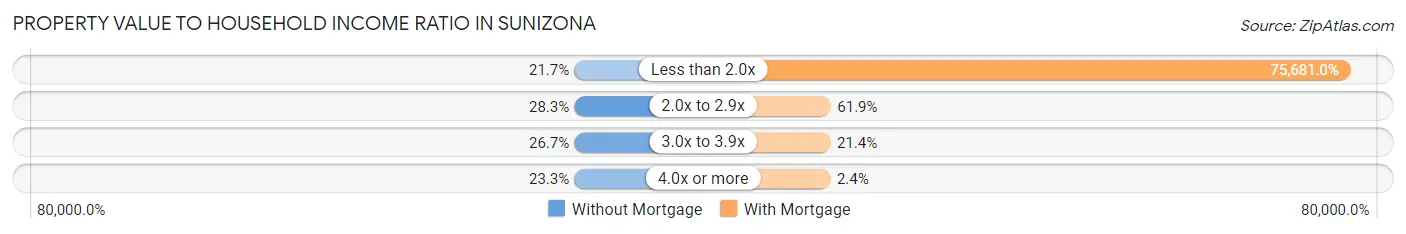
| Value-to-Income Ratio | Without Mortgage | With Mortgage |
| Less than 2.0x | 13 (21.7%) | 31,786 (75,680.9%) |
| 2.0x to 2.9x | 17 (28.3%) | 26 (61.9%) |
| 3.0x to 3.9x | 16 (26.7%) | 9 (21.4%) |
| 4.0x or more | 14 (23.3%) | 1 (2.4%) |
| Total | 60 (100.0%) | 42 (100.0%) |
Real Estate Taxes by Mortgage Status in Sunizona
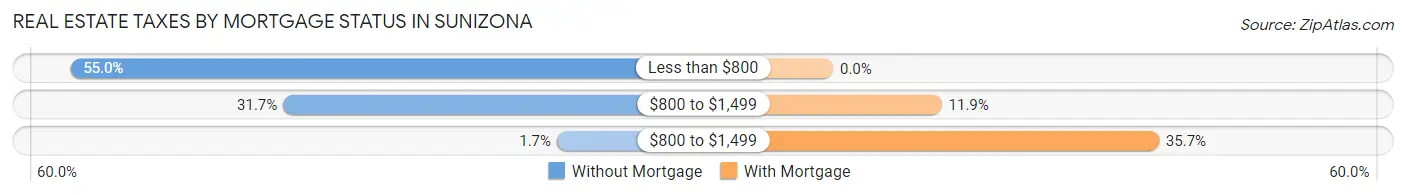
| Property Taxes | Without Mortgage | With Mortgage |
| Less than $800 | 33 (55.0%) | 0 (0.0%) |
| $800 to $1,499 | 19 (31.7%) | 5 (11.9%) |
| $800 to $1,499 | 1 (1.7%) | 15 (35.7%) |
| Total | 60 (100.0%) | 42 (100.0%) |
Health & Disability in Sunizona
Health Insurance Coverage by Age in Sunizona
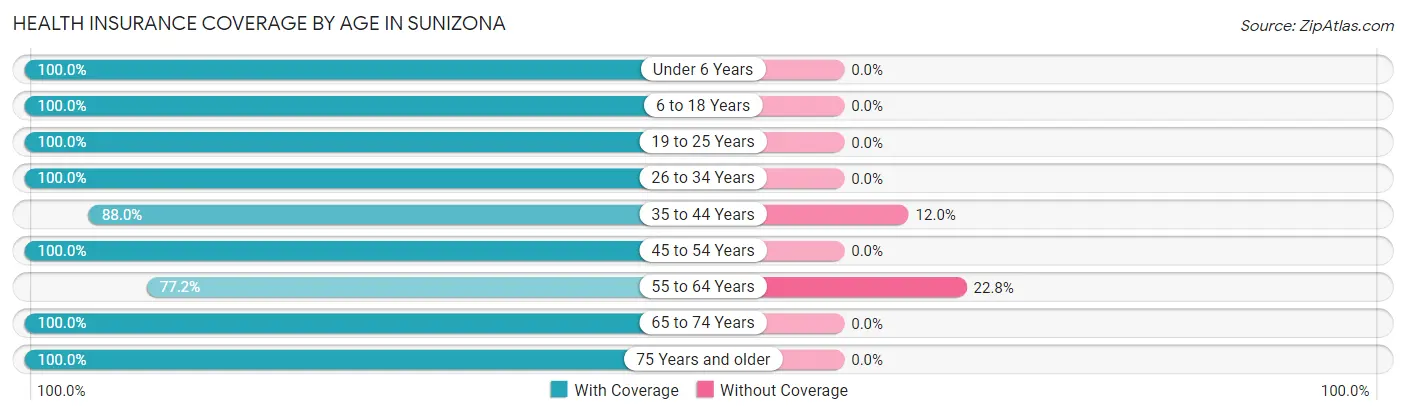
| Age Bracket | With Coverage | Without Coverage |
| Under 6 Years | 16 (100.0%) | 0 (0.0%) |
| 6 to 18 Years | 35 (100.0%) | 0 (0.0%) |
| 19 to 25 Years | 2 (100.0%) | 0 (0.0%) |
| 26 to 34 Years | 10 (100.0%) | 0 (0.0%) |
| 35 to 44 Years | 22 (88.0%) | 3 (12.0%) |
| 45 to 54 Years | 5 (100.0%) | 0 (0.0%) |
| 55 to 64 Years | 44 (77.2%) | 13 (22.8%) |
| 65 to 74 Years | 54 (100.0%) | 0 (0.0%) |
| 75 Years and older | 13 (100.0%) | 0 (0.0%) |
| Total | 201 (92.6%) | 16 (7.4%) |
Health Insurance Coverage by Citizenship Status in Sunizona
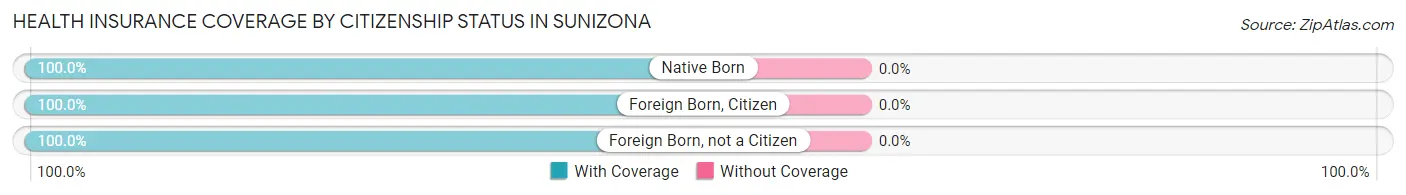
| Citizenship Status | With Coverage | Without Coverage |
| Native Born | 16 (100.0%) | 0 (0.0%) |
| Foreign Born, Citizen | 35 (100.0%) | 0 (0.0%) |
| Foreign Born, not a Citizen | 2 (100.0%) | 0 (0.0%) |
Health Insurance Coverage by Household Income in Sunizona
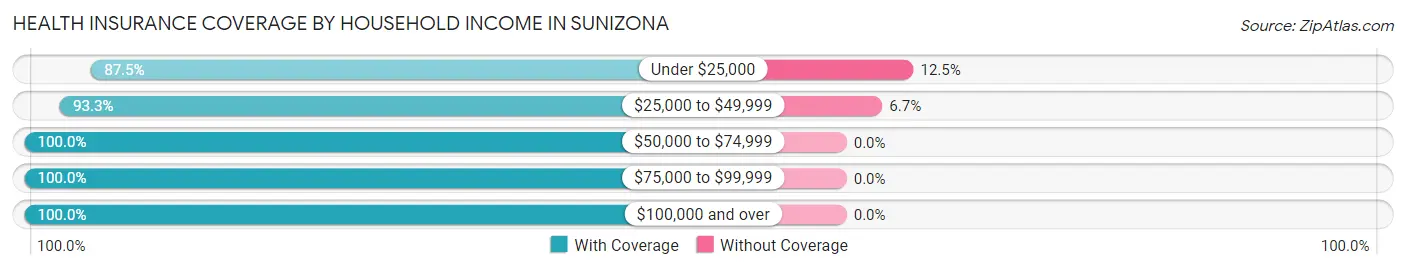
| Household Income | With Coverage | Without Coverage |
| Under $25,000 | 91 (87.5%) | 13 (12.5%) |
| $25,000 to $49,999 | 42 (93.3%) | 3 (6.7%) |
| $50,000 to $74,999 | 50 (100.0%) | 0 (0.0%) |
| $75,000 to $99,999 | 3 (100.0%) | 0 (0.0%) |
| $100,000 and over | 15 (100.0%) | 0 (0.0%) |
Public vs Private Health Insurance Coverage by Age in Sunizona
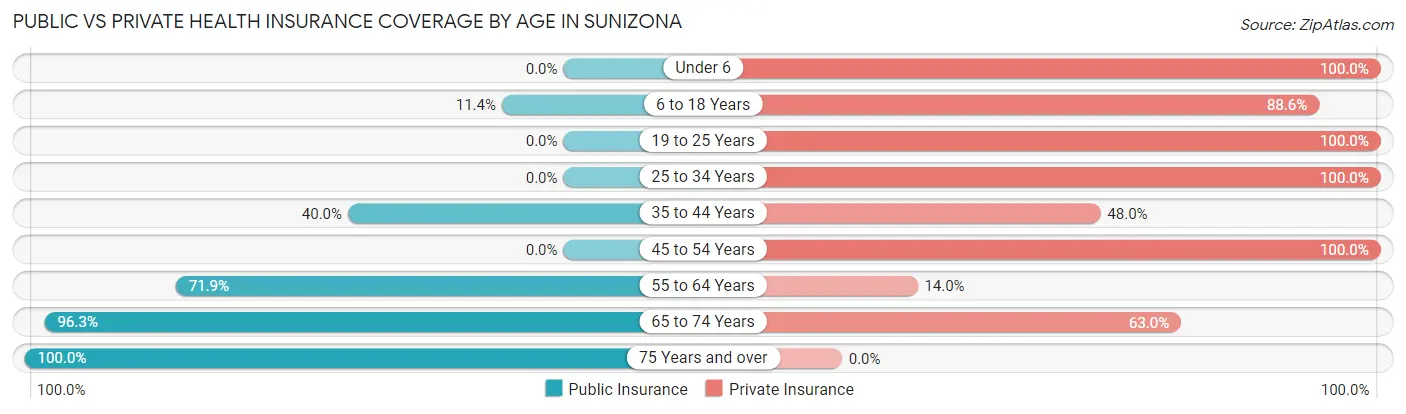
| Age Bracket | Public Insurance | Private Insurance |
| Under 6 | 0 (0.0%) | 16 (100.0%) |
| 6 to 18 Years | 4 (11.4%) | 31 (88.6%) |
| 19 to 25 Years | 0 (0.0%) | 2 (100.0%) |
| 25 to 34 Years | 0 (0.0%) | 10 (100.0%) |
| 35 to 44 Years | 10 (40.0%) | 12 (48.0%) |
| 45 to 54 Years | 0 (0.0%) | 5 (100.0%) |
| 55 to 64 Years | 41 (71.9%) | 8 (14.0%) |
| 65 to 74 Years | 52 (96.3%) | 34 (63.0%) |
| 75 Years and over | 13 (100.0%) | 0 (0.0%) |
| Total | 120 (55.3%) | 118 (54.4%) |
Disability Status by Sex by Age in Sunizona
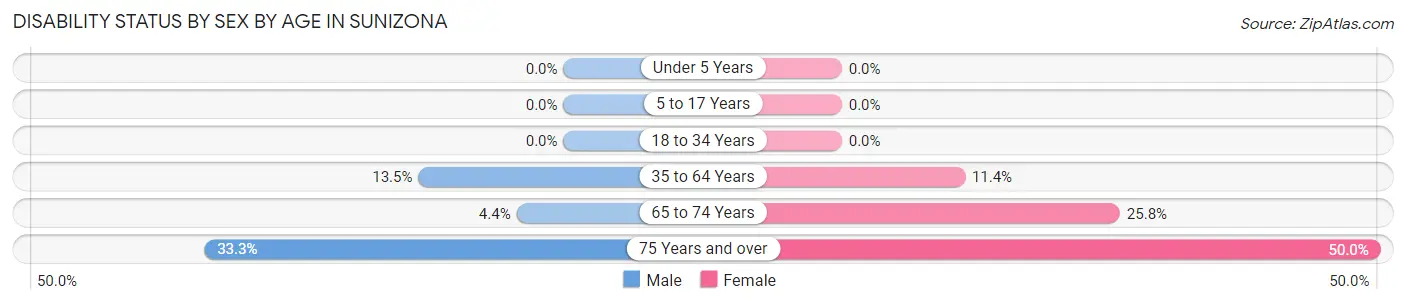
| Age Bracket | Male | Female |
| Under 5 Years | 0 (0.0%) | 0 (0.0%) |
| 5 to 17 Years | 0 (0.0%) | 0 (0.0%) |
| 18 to 34 Years | 0 (0.0%) | 0 (0.0%) |
| 35 to 64 Years | 7 (13.5%) | 4 (11.4%) |
| 65 to 74 Years | 1 (4.3%) | 8 (25.8%) |
| 75 Years and over | 3 (33.3%) | 2 (50.0%) |
Disability Class by Sex by Age in Sunizona
Disability Class: Hearing Difficulty
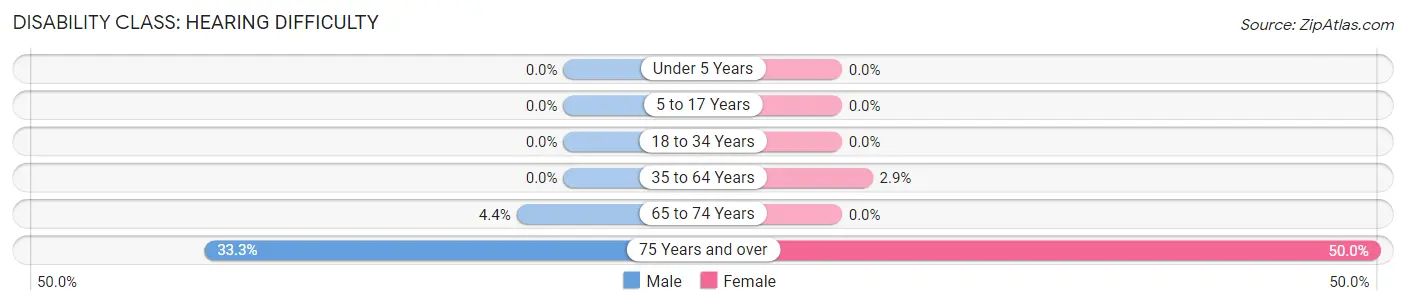
| Age Bracket | Male | Female |
| Under 5 Years | 0 (0.0%) | 0 (0.0%) |
| 5 to 17 Years | 0 (0.0%) | 0 (0.0%) |
| 18 to 34 Years | 0 (0.0%) | 0 (0.0%) |
| 35 to 64 Years | 0 (0.0%) | 1 (2.9%) |
| 65 to 74 Years | 1 (4.3%) | 0 (0.0%) |
| 75 Years and over | 3 (33.3%) | 2 (50.0%) |
Disability Class: Vision Difficulty
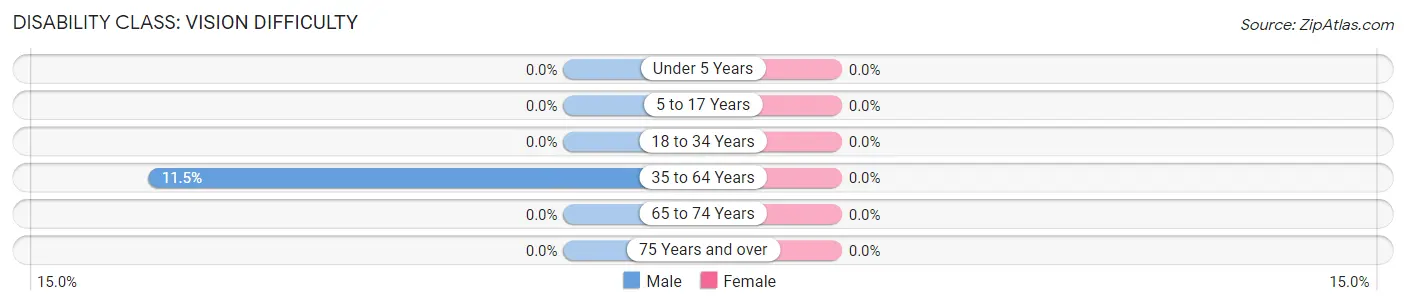
| Age Bracket | Male | Female |
| Under 5 Years | 0 (0.0%) | 0 (0.0%) |
| 5 to 17 Years | 0 (0.0%) | 0 (0.0%) |
| 18 to 34 Years | 0 (0.0%) | 0 (0.0%) |
| 35 to 64 Years | 6 (11.5%) | 0 (0.0%) |
| 65 to 74 Years | 0 (0.0%) | 0 (0.0%) |
| 75 Years and over | 0 (0.0%) | 0 (0.0%) |
Disability Class: Cognitive Difficulty
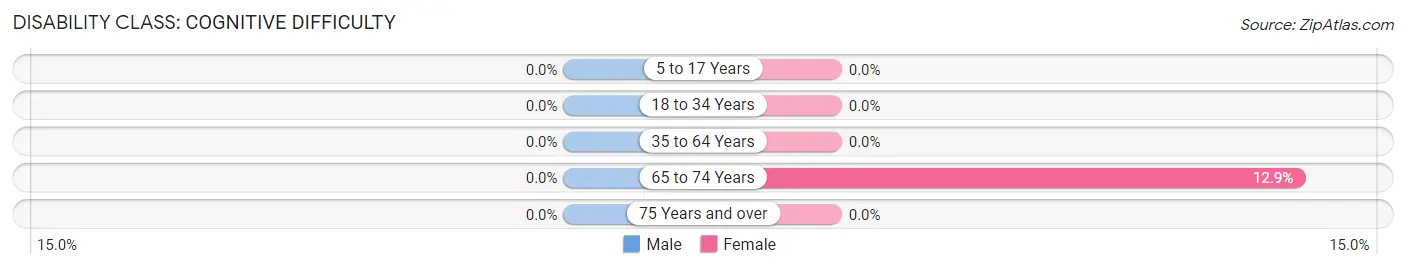
| Age Bracket | Male | Female |
| 5 to 17 Years | 0 (0.0%) | 0 (0.0%) |
| 18 to 34 Years | 0 (0.0%) | 0 (0.0%) |
| 35 to 64 Years | 0 (0.0%) | 0 (0.0%) |
| 65 to 74 Years | 0 (0.0%) | 4 (12.9%) |
| 75 Years and over | 0 (0.0%) | 0 (0.0%) |
Disability Class: Ambulatory Difficulty
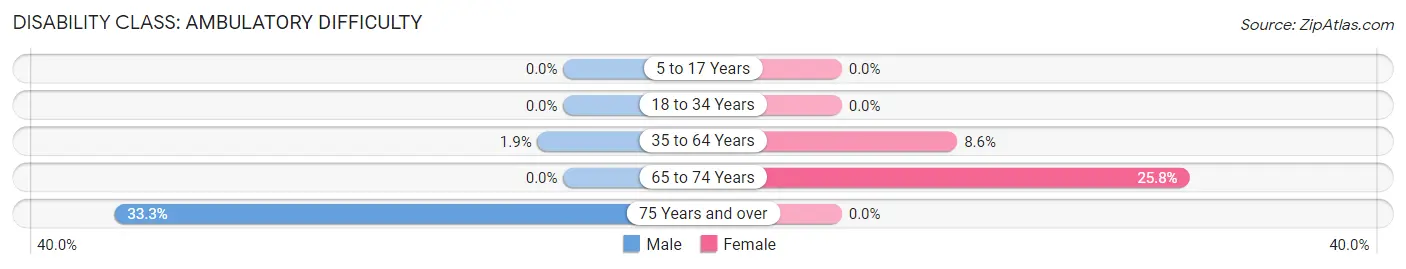
| Age Bracket | Male | Female |
| 5 to 17 Years | 0 (0.0%) | 0 (0.0%) |
| 18 to 34 Years | 0 (0.0%) | 0 (0.0%) |
| 35 to 64 Years | 1 (1.9%) | 3 (8.6%) |
| 65 to 74 Years | 0 (0.0%) | 8 (25.8%) |
| 75 Years and over | 3 (33.3%) | 0 (0.0%) |
Disability Class: Self-Care Difficulty
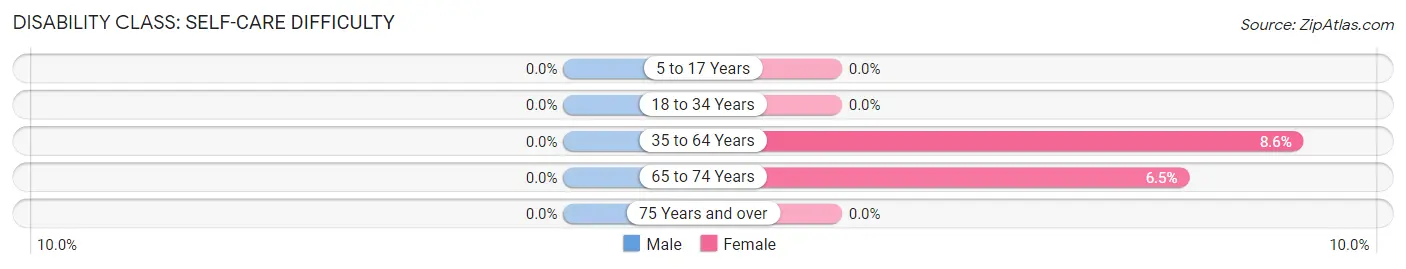
| Age Bracket | Male | Female |
| 5 to 17 Years | 0 (0.0%) | 0 (0.0%) |
| 18 to 34 Years | 0 (0.0%) | 0 (0.0%) |
| 35 to 64 Years | 0 (0.0%) | 3 (8.6%) |
| 65 to 74 Years | 0 (0.0%) | 2 (6.5%) |
| 75 Years and over | 0 (0.0%) | 0 (0.0%) |
Technology Access in Sunizona
Computing Device Access in Sunizona
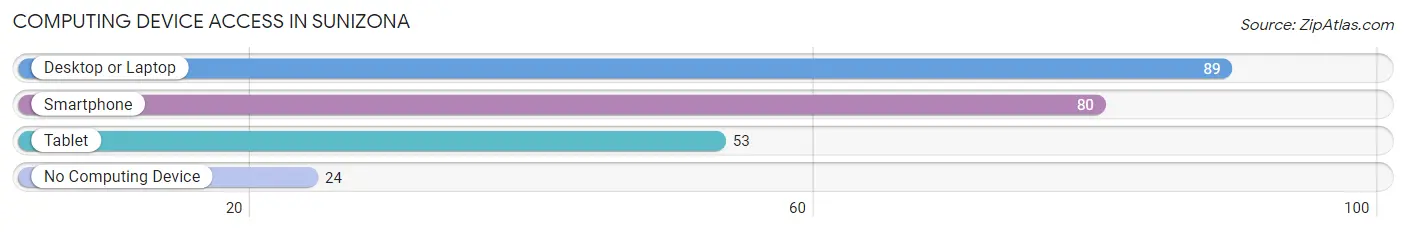
| Device Type | # Households | % Households |
| Desktop or Laptop | 89 | 72.4% |
| Smartphone | 80 | 65.0% |
| Tablet | 53 | 43.1% |
| No Computing Device | 24 | 19.5% |
| Total | 123 | 100.0% |
Internet Access in Sunizona
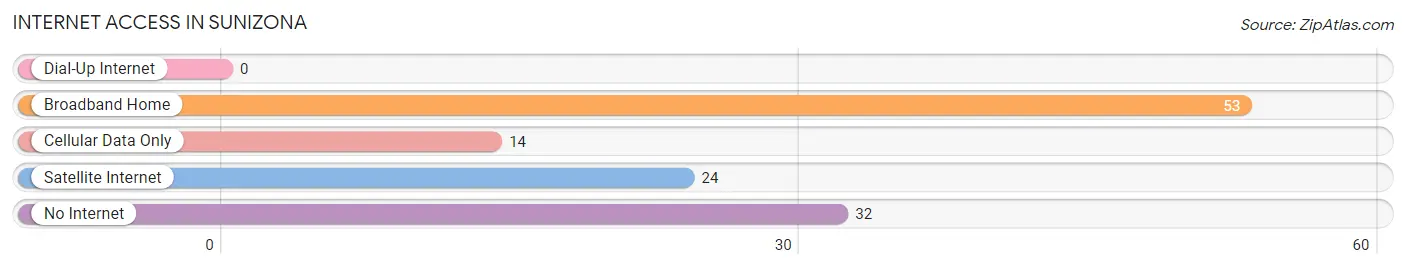
| Internet Type | # Households | % Households |
| Dial-Up Internet | 0 | 0.0% |
| Broadband Home | 53 | 43.1% |
| Cellular Data Only | 14 | 11.4% |
| Satellite Internet | 24 | 19.5% |
| No Internet | 32 | 26.0% |
| Total | 123 | 100.0% |
Sunizona Summary
History
Sunizona is a small unincorporated community located in Cochise County, Arizona. It is situated in the San Pedro Valley, approximately 20 miles east of the city of Sierra Vista. The area was first settled in the late 1800s by ranchers and farmers, and the town was officially established in 1912.
The town was named after the Sunizona Ranch, which was owned by the prominent local rancher, John W. Smith. Smith was a prominent figure in the area, and he was instrumental in the development of the town. He was also responsible for the construction of the first school in Sunizona, which opened in 1913.
The town grew slowly over the years, and by the 1950s, it had a population of around 200 people. The town was primarily supported by the local ranching and farming industry, and it was also home to a few small businesses.
Geography
Sunizona is located in the San Pedro Valley, which is part of the larger Chihuahuan Desert. The area is characterized by its dry climate and sparse vegetation. The town is situated at an elevation of 4,000 feet, and it is surrounded by the Huachuca Mountains to the west and the Dragoon Mountains to the east.
The town is located approximately 20 miles east of the city of Sierra Vista, and it is also close to the Coronado National Forest. The area is known for its scenic beauty, and it is a popular destination for outdoor activities such as hiking, camping, and bird watching.
Economy
The economy of Sunizona is primarily supported by the local ranching and farming industry. The town is home to several small businesses, including a grocery store, a gas station, and a few restaurants.
The town is also home to a few small manufacturing companies, which produce a variety of products such as furniture, clothing, and electronics. The town is also home to a few small service-based businesses, such as auto repair shops and hair salons.
Demographics
As of the 2010 census, the population of Sunizona was 1,093. The town is predominantly white, with a small Hispanic population. The median household income is $37,000, and the median home value is $125,000. The town has a low unemployment rate, and the majority of the population is employed in the local ranching and farming industry.
Common Questions
What is Per Capita Income in Sunizona?
Per Capita income in Sunizona is $17,641.
What is the Median Household income in Sunizona?
Median Household Income in Sunizona is $21,375.
What is Inequality or Gini Index in Sunizona?
Inequality or Gini Index in Sunizona is 0.40.
What is the Total Population of Sunizona?
Total Population of Sunizona is 217.
What is the Total Male Population of Sunizona?
Total Male Population of Sunizona is 124.
What is the Total Female Population of Sunizona?
Total Female Population of Sunizona is 93.
What is the Ratio of Males per 100 Females in Sunizona?
There are 133.33 Males per 100 Females in Sunizona.
What is the Ratio of Females per 100 Males in Sunizona?
There are 75.00 Females per 100 Males in Sunizona.
What is the Median Population Age in Sunizona?
Median Population Age in Sunizona is 58.8 Years.
What is the Average Family Size in Sunizona
Average Family Size in Sunizona is 3.0 People.
What is the Average Household Size in Sunizona
Average Household Size in Sunizona is 1.8 People.
How Large is the Labor Force in Sunizona?
There are 57 People in the Labor Forcein in Sunizona.
What is the Percentage of People in the Labor Force in Sunizona?
33.5% of People are in the Labor Force in Sunizona.