Zip Codes with the Highest Percentage of Population Employed in Security & Protection in Arizona
RELATED REPORTS & OPTIONS
Security & Protection
Arizona
Compare Zip Codes
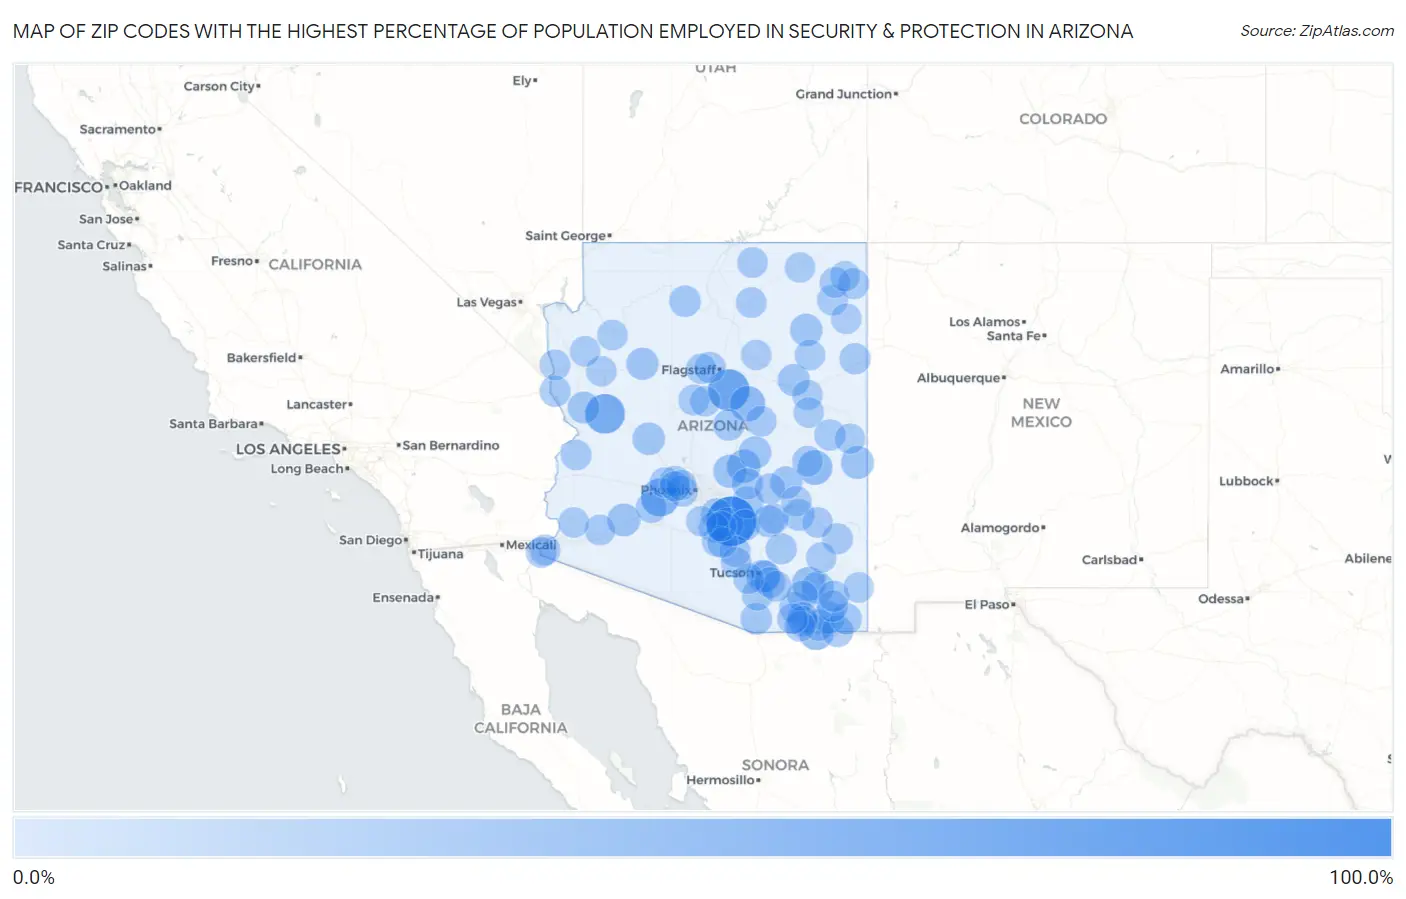
Map of Zip Codes with the Highest Percentage of Population Employed in Security & Protection in Arizona
0.0%
100.0%
Zip Codes with the Highest Percentage of Population Employed in Security & Protection in Arizona
| Zip Code | % Employed | vs State | vs National | |
| 1. | 85191 | 100.0% | 2.5%(+97.5)#1 | 2.1%(+97.9)#13 |
| 2. | 86038 | 59.4% | 2.5%(+56.9)#2 | 2.1%(+57.2)#27 |
| 3. | 85360 | 50.0% | 2.5%(+47.5)#3 | 2.1%(+47.9)#37 |
| 4. | 85343 | 42.1% | 2.5%(+39.7)#4 | 2.1%(+40.0)#51 |
| 5. | 86024 | 28.7% | 2.5%(+26.2)#5 | 2.1%(+26.5)#104 |
| 6. | 85620 | 26.3% | 2.5%(+23.9)#6 | 2.1%(+24.2)#119 |
| 7. | 85926 | 25.2% | 2.5%(+22.8)#7 | 2.1%(+23.1)#129 |
| 8. | 85609 | 19.9% | 2.5%(+17.5)#8 | 2.1%(+17.8)#200 |
| 9. | 85553 | 18.7% | 2.5%(+16.3)#9 | 2.1%(+16.6)#232 |
| 10. | 85264 | 18.2% | 2.5%(+15.8)#10 | 2.1%(+16.1)#242 |
| 11. | 85920 | 16.5% | 2.5%(+14.0)#11 | 2.1%(+14.3)#298 |
| 12. | 85333 | 15.7% | 2.5%(+13.2)#12 | 2.1%(+13.5)#331 |
| 13. | 85707 | 14.6% | 2.5%(+12.2)#13 | 2.1%(+12.5)#380 |
| 14. | 86034 | 14.6% | 2.5%(+12.1)#14 | 2.1%(+12.4)#386 |
| 15. | 85332 | 14.5% | 2.5%(+12.1)#15 | 2.1%(+12.4)#387 |
| 16. | 85554 | 14.4% | 2.5%(+11.9)#16 | 2.1%(+12.2)#393 |
| 17. | 85606 | 14.0% | 2.5%(+11.5)#17 | 2.1%(+11.8)#423 |
| 18. | 85550 | 13.4% | 2.5%(+10.9)#18 | 2.1%(+11.3)#455 |
| 19. | 86337 | 13.1% | 2.5%(+10.6)#19 | 2.1%(+10.9)#474 |
| 20. | 86032 | 13.0% | 2.5%(+10.5)#20 | 2.1%(+10.8)#478 |
| 21. | 85128 | 12.9% | 2.5%(+10.4)#21 | 2.1%(+10.7)#482 |
| 22. | 85617 | 11.9% | 2.5%(+9.40)#22 | 2.1%(+9.70)#562 |
| 23. | 86438 | 11.5% | 2.5%(+9.06)#23 | 2.1%(+9.36)#600 |
| 24. | 85135 | 10.8% | 2.5%(+8.34)#24 | 2.1%(+8.64)#666 |
| 25. | 85173 | 10.6% | 2.5%(+8.15)#25 | 2.1%(+8.45)#692 |
| 26. | 85530 | 10.5% | 2.5%(+8.02)#26 | 2.1%(+8.33)#708 |
| 27. | 85603 | 10.4% | 2.5%(+7.98)#27 | 2.1%(+8.28)#718 |
| 28. | 85648 | 9.9% | 2.5%(+7.48)#28 | 2.1%(+7.78)#778 |
| 29. | 86023 | 9.8% | 2.5%(+7.39)#29 | 2.1%(+7.70)#786 |
| 30. | 85626 | 9.6% | 2.5%(+7.16)#30 | 2.1%(+7.46)#820 |
| 31. | 85607 | 9.1% | 2.5%(+6.61)#31 | 2.1%(+6.91)#901 |
| 32. | 85544 | 9.0% | 2.5%(+6.55)#32 | 2.1%(+6.85)#912 |
| 33. | 85708 | 8.7% | 2.5%(+6.22)#33 | 2.1%(+6.52)#972 |
| 34. | 85610 | 8.6% | 2.5%(+6.13)#34 | 2.1%(+6.44)#988 |
| 35. | 85616 | 8.6% | 2.5%(+6.13)#35 | 2.1%(+6.43)#989 |
| 36. | 85545 | 8.5% | 2.5%(+6.02)#36 | 2.1%(+6.33)#1,014 |
| 37. | 85940 | 8.4% | 2.5%(+5.95)#37 | 2.1%(+6.25)#1,037 |
| 38. | 85123 | 8.3% | 2.5%(+5.89)#38 | 2.1%(+6.19)#1,059 |
| 39. | 85629 | 8.2% | 2.5%(+5.78)#39 | 2.1%(+6.08)#1,088 |
| 40. | 85630 | 8.1% | 2.5%(+5.61)#40 | 2.1%(+5.91)#1,146 |
| 41. | 85132 | 8.0% | 2.5%(+5.57)#41 | 2.1%(+5.87)#1,163 |
| 42. | 85631 | 8.0% | 2.5%(+5.53)#42 | 2.1%(+5.84)#1,174 |
| 43. | 85625 | 8.0% | 2.5%(+5.53)#43 | 2.1%(+5.83)#1,175 |
| 44. | 86506 | 7.9% | 2.5%(+5.44)#44 | 2.1%(+5.74)#1,206 |
| 45. | 86015 | 7.8% | 2.5%(+5.33)#45 | 2.1%(+5.63)#1,247 |
| 46. | 86440 | 7.5% | 2.5%(+5.04)#46 | 2.1%(+5.34)#1,338 |
| 47. | 85145 | 7.3% | 2.5%(+4.85)#47 | 2.1%(+5.15)#1,400 |
| 48. | 85322 | 6.9% | 2.5%(+4.47)#48 | 2.1%(+4.77)#1,567 |
| 49. | 85635 | 6.8% | 2.5%(+4.37)#49 | 2.1%(+4.68)#1,619 |
| 50. | 85551 | 6.7% | 2.5%(+4.25)#50 | 2.1%(+4.55)#1,688 |
| 51. | 85329 | 6.6% | 2.5%(+4.17)#51 | 2.1%(+4.47)#1,728 |
| 52. | 86503 | 6.3% | 2.5%(+3.85)#52 | 2.1%(+4.16)#1,897 |
| 53. | 86331 | 6.2% | 2.5%(+3.77)#53 | 2.1%(+4.07)#1,942 |
| 54. | 85650 | 6.2% | 2.5%(+3.75)#54 | 2.1%(+4.05)#1,956 |
| 55. | 86507 | 6.2% | 2.5%(+3.72)#55 | 2.1%(+4.02)#1,967 |
| 56. | 86429 | 6.1% | 2.5%(+3.64)#56 | 2.1%(+3.95)#2,015 |
| 57. | 86538 | 5.8% | 2.5%(+3.36)#57 | 2.1%(+3.67)#2,197 |
| 58. | 85747 | 5.8% | 2.5%(+3.34)#58 | 2.1%(+3.64)#2,215 |
| 59. | 85147 | 5.8% | 2.5%(+3.33)#59 | 2.1%(+3.63)#2,222 |
| 60. | 85931 | 5.8% | 2.5%(+3.32)#60 | 2.1%(+3.62)#2,240 |
| 61. | 85501 | 5.8% | 2.5%(+3.31)#61 | 2.1%(+3.61)#2,244 |
| 62. | 86053 | 5.7% | 2.5%(+3.22)#62 | 2.1%(+3.52)#2,307 |
| 63. | 85641 | 5.6% | 2.5%(+3.14)#63 | 2.1%(+3.44)#2,377 |
| 64. | 85941 | 5.6% | 2.5%(+3.13)#64 | 2.1%(+3.43)#2,385 |
| 65. | 85350 | 5.6% | 2.5%(+3.10)#65 | 2.1%(+3.40)#2,416 |
| 66. | 85615 | 5.6% | 2.5%(+3.10)#66 | 2.1%(+3.40)#2,417 |
| 67. | 86045 | 5.5% | 2.5%(+3.03)#67 | 2.1%(+3.34)#2,465 |
| 68. | 85347 | 5.5% | 2.5%(+3.02)#68 | 2.1%(+3.33)#2,474 |
| 69. | 85613 | 5.4% | 2.5%(+2.93)#69 | 2.1%(+3.23)#2,560 |
| 70. | 85344 | 5.3% | 2.5%(+2.88)#70 | 2.1%(+3.19)#2,599 |
| 71. | 85757 | 5.3% | 2.5%(+2.82)#71 | 2.1%(+3.12)#2,660 |
| 72. | 85336 | 5.2% | 2.5%(+2.75)#72 | 2.1%(+3.05)#2,712 |
| 73. | 85653 | 5.2% | 2.5%(+2.70)#73 | 2.1%(+3.00)#2,759 |
| 74. | 85396 | 5.1% | 2.5%(+2.63)#74 | 2.1%(+2.94)#2,824 |
| 75. | 86434 | 5.1% | 2.5%(+2.63)#75 | 2.1%(+2.93)#2,835 |
| 76. | 85543 | 5.0% | 2.5%(+2.57)#76 | 2.1%(+2.87)#2,905 |
| 77. | 85355 | 5.0% | 2.5%(+2.54)#77 | 2.1%(+2.84)#2,942 |
| 78. | 86540 | 4.9% | 2.5%(+2.47)#78 | 2.1%(+2.77)#3,025 |
| 79. | 85122 | 4.9% | 2.5%(+2.44)#79 | 2.1%(+2.74)#3,063 |
| 80. | 86401 | 4.9% | 2.5%(+2.42)#80 | 2.1%(+2.72)#3,087 |
| 81. | 85131 | 4.7% | 2.5%(+2.26)#81 | 2.1%(+2.56)#3,292 |
| 82. | 86031 | 4.7% | 2.5%(+2.20)#82 | 2.1%(+2.51)#3,356 |
| 83. | 86325 | 4.6% | 2.5%(+2.16)#83 | 2.1%(+2.46)#3,419 |
| 84. | 85632 | 4.6% | 2.5%(+2.15)#84 | 2.1%(+2.45)#3,437 |
| 85. | 86035 | 4.6% | 2.5%(+2.11)#85 | 2.1%(+2.41)#3,505 |
| 86. | 86018 | 4.5% | 2.5%(+2.08)#86 | 2.1%(+2.38)#3,562 |
| 87. | 86547 | 4.5% | 2.5%(+2.08)#87 | 2.1%(+2.38)#3,567 |
| 88. | 85138 | 4.4% | 2.5%(+1.95)#88 | 2.1%(+2.26)#3,761 |
| 89. | 85307 | 4.4% | 2.5%(+1.93)#89 | 2.1%(+2.23)#3,808 |
| 90. | 86025 | 4.4% | 2.5%(+1.92)#90 | 2.1%(+2.22)#3,825 |
| 91. | 85192 | 4.3% | 2.5%(+1.87)#91 | 2.1%(+2.17)#3,908 |
| 92. | 86409 | 4.3% | 2.5%(+1.86)#92 | 2.1%(+2.17)#3,909 |
| 93. | 86033 | 4.3% | 2.5%(+1.86)#93 | 2.1%(+2.17)#3,910 |
| 94. | 85365 | 4.2% | 2.5%(+1.80)#94 | 2.1%(+2.10)#4,027 |
| 95. | 85194 | 4.2% | 2.5%(+1.76)#95 | 2.1%(+2.06)#4,106 |
| 96. | 85542 | 4.1% | 2.5%(+1.67)#96 | 2.1%(+1.98)#4,256 |
| 97. | 85937 | 4.1% | 2.5%(+1.67)#97 | 2.1%(+1.97)#4,268 |
| 98. | 85643 | 4.1% | 2.5%(+1.66)#98 | 2.1%(+1.96)#4,277 |
| 99. | 85938 | 4.1% | 2.5%(+1.65)#99 | 2.1%(+1.96)#4,286 |
| 100. | 85340 | 4.0% | 2.5%(+1.57)#100 | 2.1%(+1.88)#4,445 |
Common Questions
What are the Top 10 Zip Codes with the Highest Percentage of Population Employed in Security & Protection in Arizona?
Top 10 Zip Codes with the Highest Percentage of Population Employed in Security & Protection in Arizona are:
What zip code has the Highest Percentage of Population Employed in Security & Protection in Arizona?
85191 has the Highest Percentage of Population Employed in Security & Protection in Arizona with 100.0%.
What is the Percentage of Population Employed in Security & Protection in the State of Arizona?
Percentage of Population Employed in Security & Protection in Arizona is 2.5%.
What is the Percentage of Population Employed in Security & Protection in the United States?
Percentage of Population Employed in Security & Protection in the United States is 2.1%.