Zip Codes with the Highest Percentage of Population Employed in Security & Protection in Phoenix, AZ
RELATED REPORTS & OPTIONS
Security & Protection
Phoenix
Compare Zip Codes
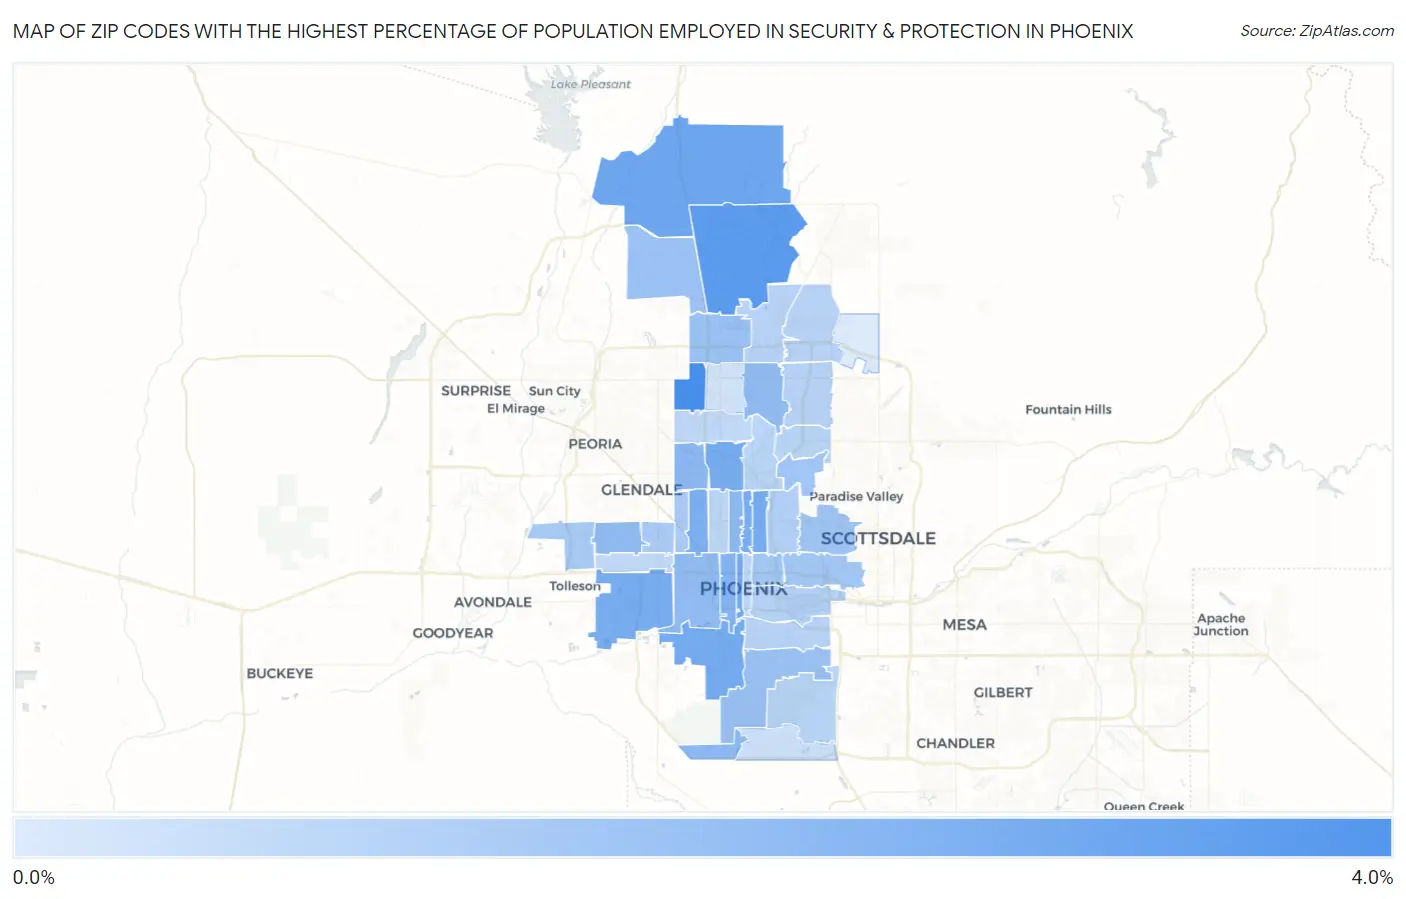
Map of Zip Codes with the Highest Percentage of Population Employed in Security & Protection in Phoenix
0.52%
3.3%
Zip Codes with the Highest Percentage of Population Employed in Security & Protection in Phoenix, AZ
| Zip Code | % Employed | vs State | vs National | |
| 1. | 85053 | 3.3% | 2.5%(+0.850)#126 | 2.1%(+1.15)#6,237 |
| 2. | 85085 | 3.0% | 2.5%(+0.523)#148 | 2.1%(+0.826)#7,322 |
| 3. | 85086 | 2.6% | 2.5%(+0.101)#172 | 2.1%(+0.405)#9,236 |
| 4. | 85003 | 2.5% | 2.5%(+0.039)#177 | 2.1%(+0.343)#9,557 |
| 5. | 85041 | 2.4% | 2.5%(-0.019)#184 | 2.1%(+0.285)#9,882 |
| 6. | 85014 | 2.4% | 2.5%(-0.038)#185 | 2.1%(+0.266)#9,984 |
| 7. | 85021 | 2.4% | 2.5%(-0.072)#188 | 2.1%(+0.231)#10,167 |
| 8. | 85043 | 2.4% | 2.5%(-0.073)#189 | 2.1%(+0.230)#10,173 |
| 9. | 85012 | 2.3% | 2.5%(-0.129)#191 | 2.1%(+0.175)#10,501 |
| 10. | 85017 | 2.3% | 2.5%(-0.202)#199 | 2.1%(+0.102)#10,944 |
| 11. | 85007 | 2.2% | 2.5%(-0.268)#202 | 2.1%(+0.035)#11,348 |
| 12. | 85013 | 2.0% | 2.5%(-0.425)#216 | 2.1%(-0.121)#12,377 |
| 13. | 85051 | 2.0% | 2.5%(-0.437)#217 | 2.1%(-0.133)#12,459 |
| 14. | 85045 | 2.0% | 2.5%(-0.492)#220 | 2.1%(-0.189)#12,829 |
| 15. | 85033 | 1.9% | 2.5%(-0.512)#222 | 2.1%(-0.208)#12,951 |
| 16. | 85009 | 1.9% | 2.5%(-0.531)#227 | 2.1%(-0.227)#13,074 |
| 17. | 85022 | 1.9% | 2.5%(-0.536)#228 | 2.1%(-0.232)#13,104 |
| 18. | 85027 | 1.7% | 2.5%(-0.708)#245 | 2.1%(-0.404)#14,351 |
| 19. | 85083 | 1.7% | 2.5%(-0.715)#247 | 2.1%(-0.411)#14,411 |
| 20. | 85042 | 1.7% | 2.5%(-0.738)#251 | 2.1%(-0.434)#14,567 |
| 21. | 85018 | 1.6% | 2.5%(-0.814)#257 | 2.1%(-0.510)#15,126 |
| 22. | 85008 | 1.6% | 2.5%(-0.861)#262 | 2.1%(-0.558)#15,477 |
| 23. | 85006 | 1.6% | 2.5%(-0.878)#263 | 2.1%(-0.574)#15,617 |
| 24. | 85037 | 1.5% | 2.5%(-0.942)#271 | 2.1%(-0.638)#16,106 |
| 25. | 85031 | 1.4% | 2.5%(-1.00)#275 | 2.1%(-0.700)#16,594 |
| 26. | 85019 | 1.4% | 2.5%(-1.01)#277 | 2.1%(-0.711)#16,682 |
| 27. | 85016 | 1.3% | 2.5%(-1.19)#288 | 2.1%(-0.885)#18,036 |
| 28. | 85034 | 1.2% | 2.5%(-1.23)#291 | 2.1%(-0.929)#18,359 |
| 29. | 85032 | 1.2% | 2.5%(-1.24)#293 | 2.1%(-0.938)#18,430 |
| 30. | 85050 | 1.2% | 2.5%(-1.24)#295 | 2.1%(-0.940)#18,450 |
| 31. | 85040 | 1.2% | 2.5%(-1.25)#297 | 2.1%(-0.949)#18,503 |
| 32. | 85024 | 1.2% | 2.5%(-1.27)#299 | 2.1%(-0.971)#18,685 |
| 33. | 85028 | 1.2% | 2.5%(-1.29)#301 | 2.1%(-0.988)#18,816 |
| 34. | 85020 | 1.2% | 2.5%(-1.30)#302 | 2.1%(-0.996)#18,878 |
| 35. | 85044 | 1.1% | 2.5%(-1.30)#303 | 2.1%(-0.999)#18,899 |
| 36. | 85004 | 1.1% | 2.5%(-1.33)#305 | 2.1%(-1.03)#19,106 |
| 37. | 85015 | 1.1% | 2.5%(-1.36)#306 | 2.1%(-1.06)#19,351 |
| 38. | 85029 | 1.0% | 2.5%(-1.42)#307 | 2.1%(-1.11)#19,759 |
| 39. | 85035 | 1.0% | 2.5%(-1.44)#308 | 2.1%(-1.13)#19,902 |
| 40. | 85048 | 0.82% | 2.5%(-1.63)#317 | 2.1%(-1.32)#21,269 |
| 41. | 85023 | 0.74% | 2.5%(-1.71)#324 | 2.1%(-1.40)#21,780 |
| 42. | 85054 | 0.52% | 2.5%(-1.94)#328 | 2.1%(-1.63)#23,152 |
1
Common Questions
What are the Top 10 Zip Codes with the Highest Percentage of Population Employed in Security & Protection in Phoenix, AZ?
Top 10 Zip Codes with the Highest Percentage of Population Employed in Security & Protection in Phoenix, AZ are:
What zip code has the Highest Percentage of Population Employed in Security & Protection in Phoenix, AZ?
85053 has the Highest Percentage of Population Employed in Security & Protection in Phoenix, AZ with 3.3%.
What is the Percentage of Population Employed in Security & Protection in Phoenix, AZ?
Percentage of Population Employed in Security & Protection in Phoenix is 1.6%.
What is the Percentage of Population Employed in Security & Protection in Arizona?
Percentage of Population Employed in Security & Protection in Arizona is 2.5%.
What is the Percentage of Population Employed in Security & Protection in the United States?
Percentage of Population Employed in Security & Protection in the United States is 2.1%.