Bisbee, AZ Map & Demographics
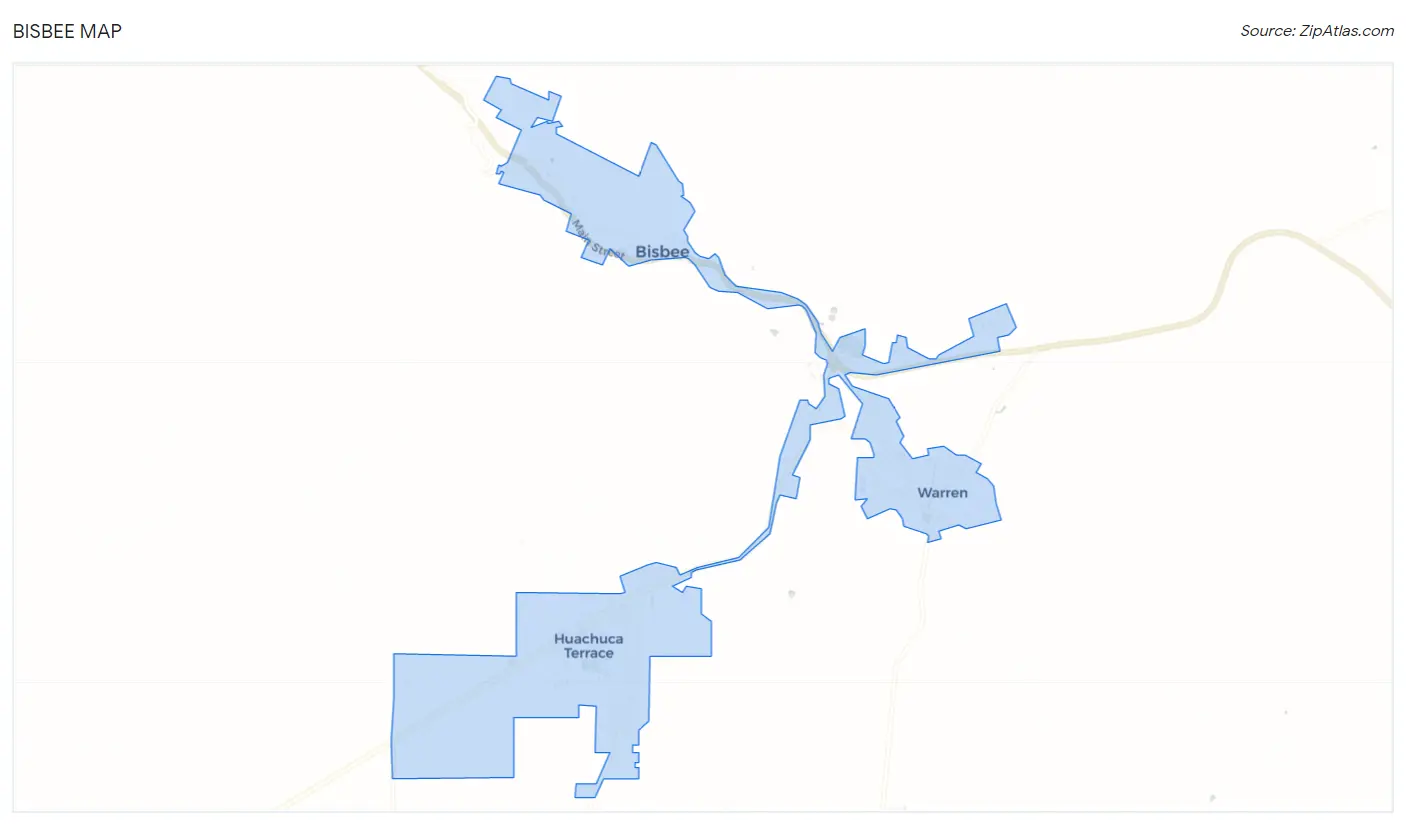
Bisbee Map
Bisbee Overview
$31,643
PER CAPITA INCOME
$70,357
AVG FAMILY INCOME
$43,512
AVG HOUSEHOLD INCOME
29.4%
WAGE / INCOME GAP [ % ]
70.6¢/ $1
WAGE / INCOME GAP [ $ ]
0.44
INEQUALITY / GINI INDEX
4,972
TOTAL POPULATION
2,472
MALE POPULATION
2,500
FEMALE POPULATION
98.88
MALES / 100 FEMALES
101.13
FEMALES / 100 MALES
60.0
MEDIAN AGE
2.9
AVG FAMILY SIZE
1.8
AVG HOUSEHOLD SIZE
1,735
LABOR FORCE [ PEOPLE ]
38.7%
PERCENT IN LABOR FORCE
4.3%
UNEMPLOYMENT RATE
Bisbee Zip Codes
Bisbee Area Codes
Income in Bisbee
Income Overview in Bisbee
Per Capita Income in Bisbee is $31,643, while median incomes of families and households are $70,357 and $43,512 respectively.
| Characteristic | Number | Measure |
| Per Capita Income | 4,972 | $31,643 |
| Median Family Income | 946 | $70,357 |
| Mean Family Income | 946 | $83,019 |
| Median Household Income | 2,602 | $43,512 |
| Mean Household Income | 2,602 | $56,495 |
| Income Deficit | 946 | $0 |
| Wage / Income Gap (%) | 4,972 | 29.44% |
| Wage / Income Gap ($) | 4,972 | 70.56¢ per $1 |
| Gini / Inequality Index | 4,972 | 0.44 |
Earnings by Sex in Bisbee
Average Earnings in Bisbee are $28,514, $29,654 for men and $20,924 for women, a difference of 29.4%.
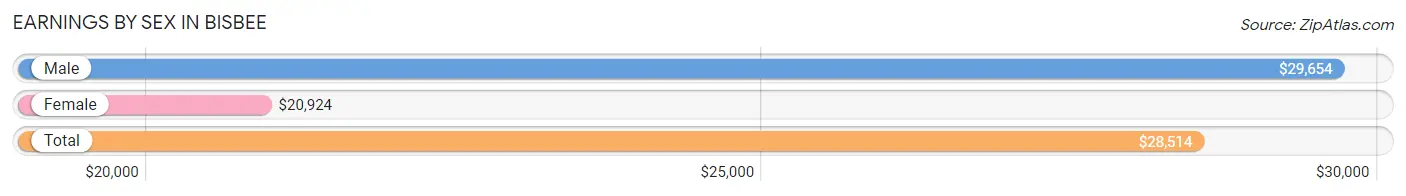
| Sex | Number | Average Earnings |
| Male | 1,198 (57.2%) | $29,654 |
| Female | 895 (42.8%) | $20,924 |
| Total | 2,093 (100.0%) | $28,514 |
Earnings by Sex by Income Bracket in Bisbee
The most common earnings brackets in Bisbee are $25,000 to $29,999 for men (152 | 12.7%) and $2,499 or less for women (162 | 18.1%).
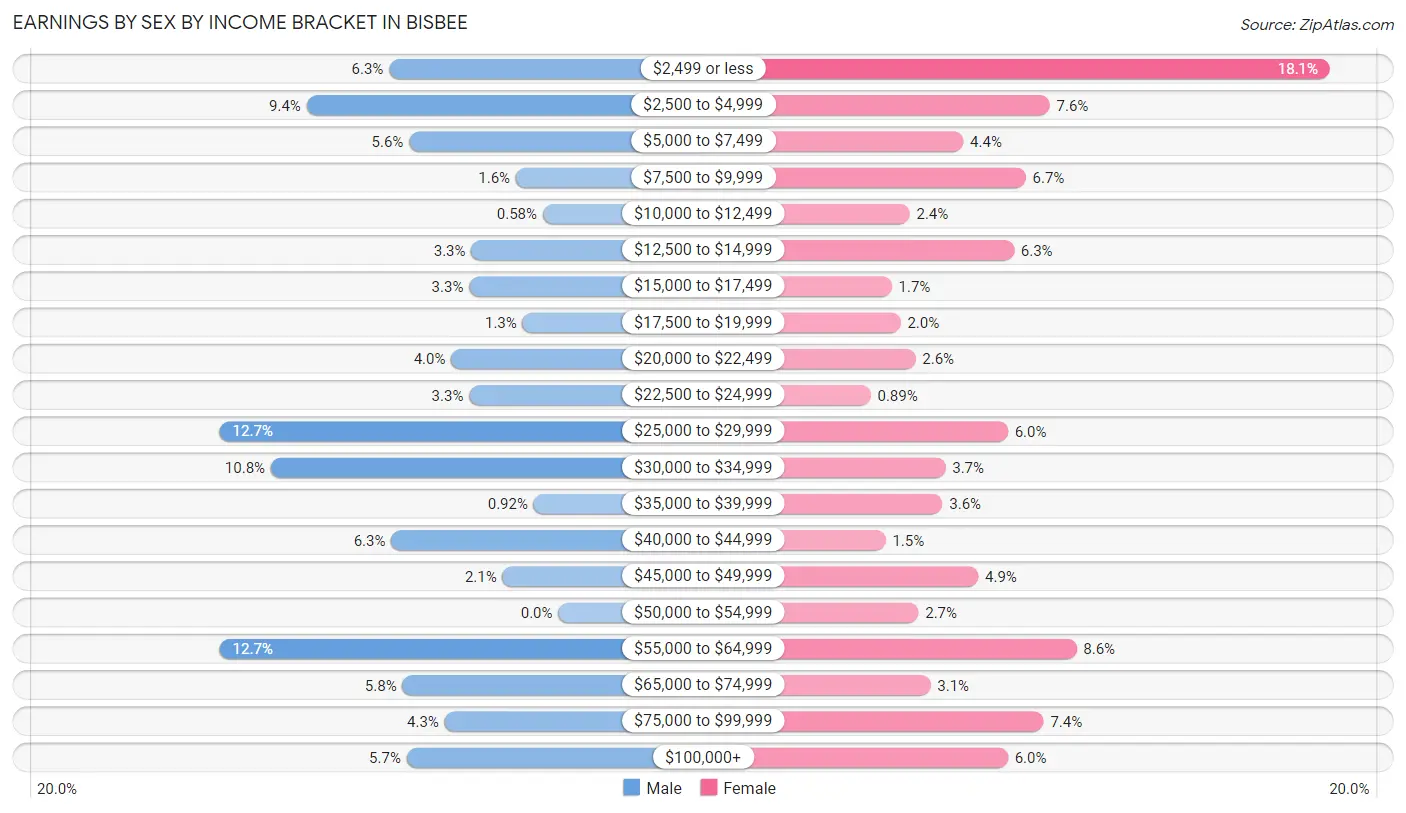
| Income | Male | Female |
| $2,499 or less | 76 (6.3%) | 162 (18.1%) |
| $2,500 to $4,999 | 113 (9.4%) | 68 (7.6%) |
| $5,000 to $7,499 | 67 (5.6%) | 39 (4.4%) |
| $7,500 to $9,999 | 19 (1.6%) | 60 (6.7%) |
| $10,000 to $12,499 | 7 (0.6%) | 21 (2.4%) |
| $12,500 to $14,999 | 39 (3.3%) | 56 (6.3%) |
| $15,000 to $17,499 | 40 (3.3%) | 15 (1.7%) |
| $17,500 to $19,999 | 16 (1.3%) | 18 (2.0%) |
| $20,000 to $22,499 | 48 (4.0%) | 23 (2.6%) |
| $22,500 to $24,999 | 40 (3.3%) | 8 (0.9%) |
| $25,000 to $29,999 | 152 (12.7%) | 54 (6.0%) |
| $30,000 to $34,999 | 129 (10.8%) | 33 (3.7%) |
| $35,000 to $39,999 | 11 (0.9%) | 32 (3.6%) |
| $40,000 to $44,999 | 75 (6.3%) | 13 (1.5%) |
| $45,000 to $49,999 | 25 (2.1%) | 44 (4.9%) |
| $50,000 to $54,999 | 0 (0.0%) | 24 (2.7%) |
| $55,000 to $64,999 | 152 (12.7%) | 77 (8.6%) |
| $65,000 to $74,999 | 70 (5.8%) | 28 (3.1%) |
| $75,000 to $99,999 | 51 (4.3%) | 66 (7.4%) |
| $100,000+ | 68 (5.7%) | 54 (6.0%) |
| Total | 1,198 (100.0%) | 895 (100.0%) |
Earnings by Sex by Educational Attainment in Bisbee
Average earnings in Bisbee are $30,400 for men and $26,250 for women, a difference of 13.7%. Men with an educational attainment of graduate degree enjoy the highest average annual earnings of $66,484, while those with high school diploma education earn the least with $21,917. Women with an educational attainment of graduate degree earn the most with the average annual earnings of $48,750, while those with less than high school education have the smallest earnings of $2,788.
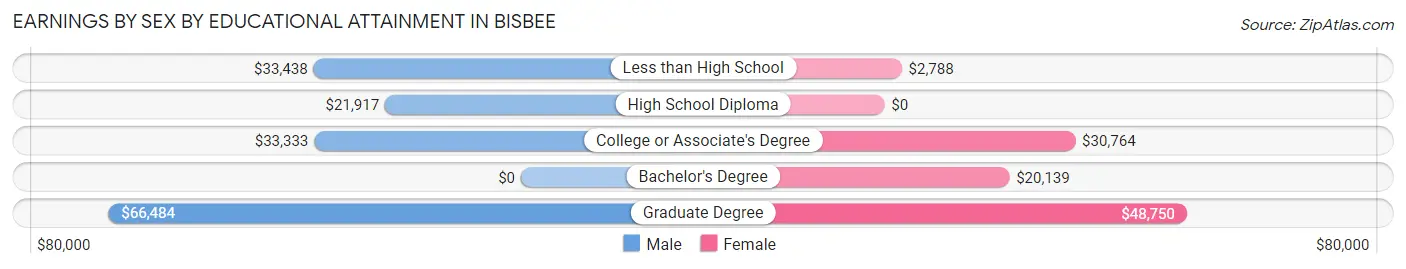
| Educational Attainment | Male Income | Female Income |
| Less than High School | $33,438 | $2,788 |
| High School Diploma | $21,917 | $0 |
| College or Associate's Degree | $33,333 | $30,764 |
| Bachelor's Degree | - | - |
| Graduate Degree | $66,484 | $48,750 |
| Total | $30,400 | $26,250 |
Family Income in Bisbee
Family Income Brackets in Bisbee
According to the Bisbee family income data, there are 173 families falling into the $100,000 to $149,999 income range, which is the most common income bracket and makes up 18.3% of all families. Conversely, the $10,000 to $14,999 income bracket is the least frequent group with only 19 families (2.0%) belonging to this category.
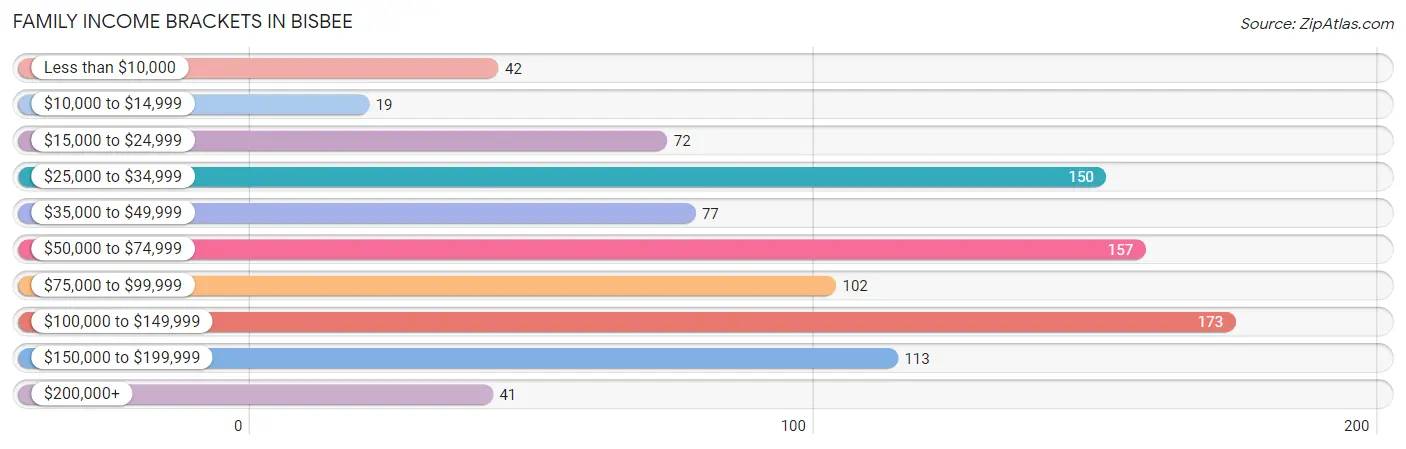
| Income Bracket | # Families | % Families |
| Less than $10,000 | 42 | 4.4% |
| $10,000 to $14,999 | 19 | 2.0% |
| $15,000 to $24,999 | 72 | 7.6% |
| $25,000 to $34,999 | 150 | 15.9% |
| $35,000 to $49,999 | 77 | 8.1% |
| $50,000 to $74,999 | 157 | 16.6% |
| $75,000 to $99,999 | 102 | 10.8% |
| $100,000 to $149,999 | 173 | 18.3% |
| $150,000 to $199,999 | 113 | 11.9% |
| $200,000+ | 41 | 4.3% |
Family Income by Famaliy Size in Bisbee
3-person families (223 | 23.6%) account for the highest median family income in Bisbee with $76,250 per family, while 2-person families (551 | 58.3%) have the highest median income of $34,578 per family member.
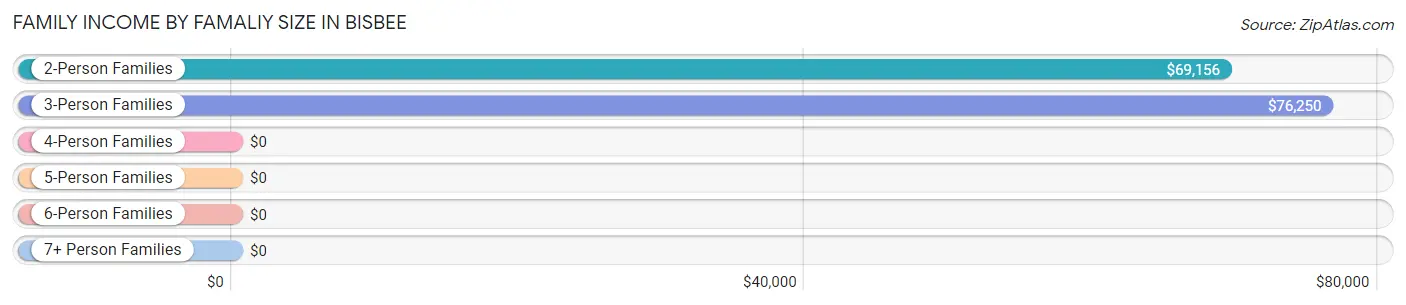
| Income Bracket | # Families | Median Income |
| 2-Person Families | 551 (58.3%) | $69,156 |
| 3-Person Families | 223 (23.6%) | $76,250 |
| 4-Person Families | 82 (8.7%) | $0 |
| 5-Person Families | 53 (5.6%) | $0 |
| 6-Person Families | 18 (1.9%) | $0 |
| 7+ Person Families | 19 (2.0%) | $0 |
| Total | 946 (100.0%) | $70,357 |
Family Income by Number of Earners in Bisbee
The median family income in Bisbee is $70,357, with families comprising 3+ earners (49) having the highest median family income of $140,875, while families with no earners (250) have the lowest median family income of $29,405, accounting for 5.2% and 26.4% of families, respectively.
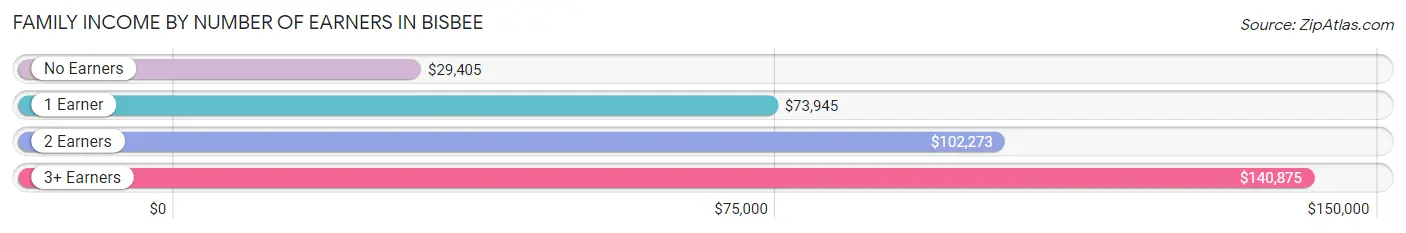
| Number of Earners | # Families | Median Income |
| No Earners | 250 (26.4%) | $29,405 |
| 1 Earner | 377 (39.9%) | $73,945 |
| 2 Earners | 270 (28.5%) | $102,273 |
| 3+ Earners | 49 (5.2%) | $140,875 |
| Total | 946 (100.0%) | $70,357 |
Household Income in Bisbee
Household Income Brackets in Bisbee
With 442 households falling in the category, the $25,000 to $34,999 income range is the most frequent in Bisbee, accounting for 17.0% of all households. In contrast, only 42 households (1.6%) fall into the $200,000+ income bracket, making it the least populous group.
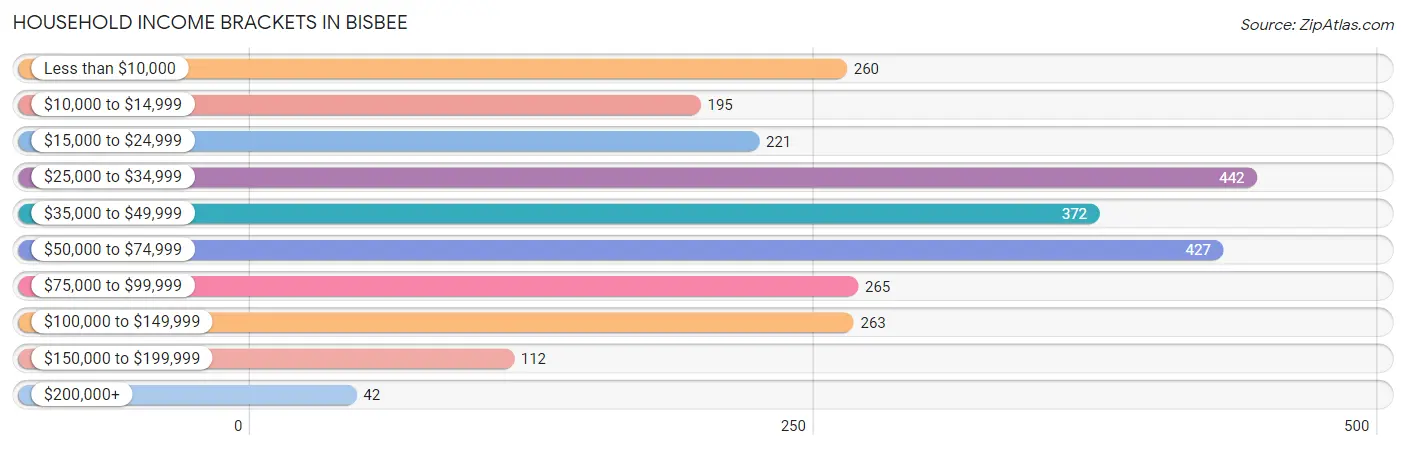
| Income Bracket | # Households | % Households |
| Less than $10,000 | 260 | 10.0% |
| $10,000 to $14,999 | 195 | 7.5% |
| $15,000 to $24,999 | 221 | 8.5% |
| $25,000 to $34,999 | 442 | 17.0% |
| $35,000 to $49,999 | 372 | 14.3% |
| $50,000 to $74,999 | 427 | 16.4% |
| $75,000 to $99,999 | 265 | 10.2% |
| $100,000 to $149,999 | 263 | 10.1% |
| $150,000 to $199,999 | 112 | 4.3% |
| $200,000+ | 42 | 1.6% |
Household Income by Householder Age in Bisbee
The median household income in Bisbee is $43,512, with the highest median household income of $54,323 found in the 45 to 64 years age bracket for the primary householder. A total of 811 households (31.2%) fall into this category. Meanwhile, the 15 to 24 years age bracket for the primary householder has the lowest median household income of $0, with 36 households (1.4%) in this group.
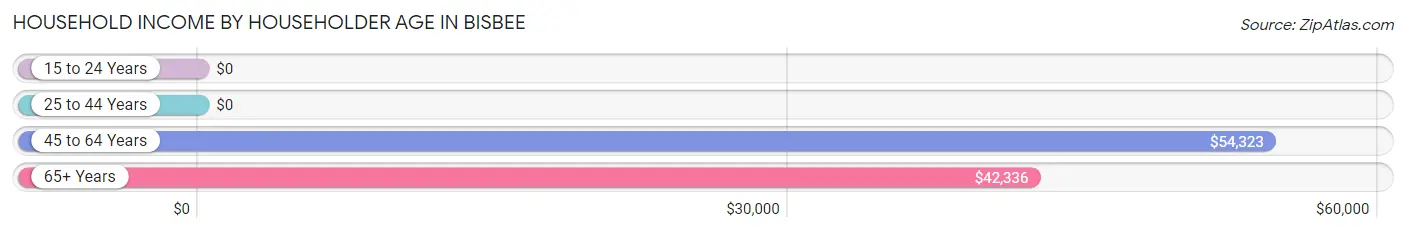
| Income Bracket | # Households | Median Income |
| 15 to 24 Years | 36 (1.4%) | $0 |
| 25 to 44 Years | 324 (12.4%) | $0 |
| 45 to 64 Years | 811 (31.2%) | $54,323 |
| 65+ Years | 1,431 (55.0%) | $42,336 |
| Total | 2,602 (100.0%) | $43,512 |
Poverty in Bisbee
Income Below Poverty by Sex and Age in Bisbee
With 17.9% poverty level for males and 22.3% for females among the residents of Bisbee, under 5 year old males and 16 and 17 year old females are the most vulnerable to poverty, with 15 males (51.7%) and 15 females (100.0%) in their respective age groups living below the poverty level.
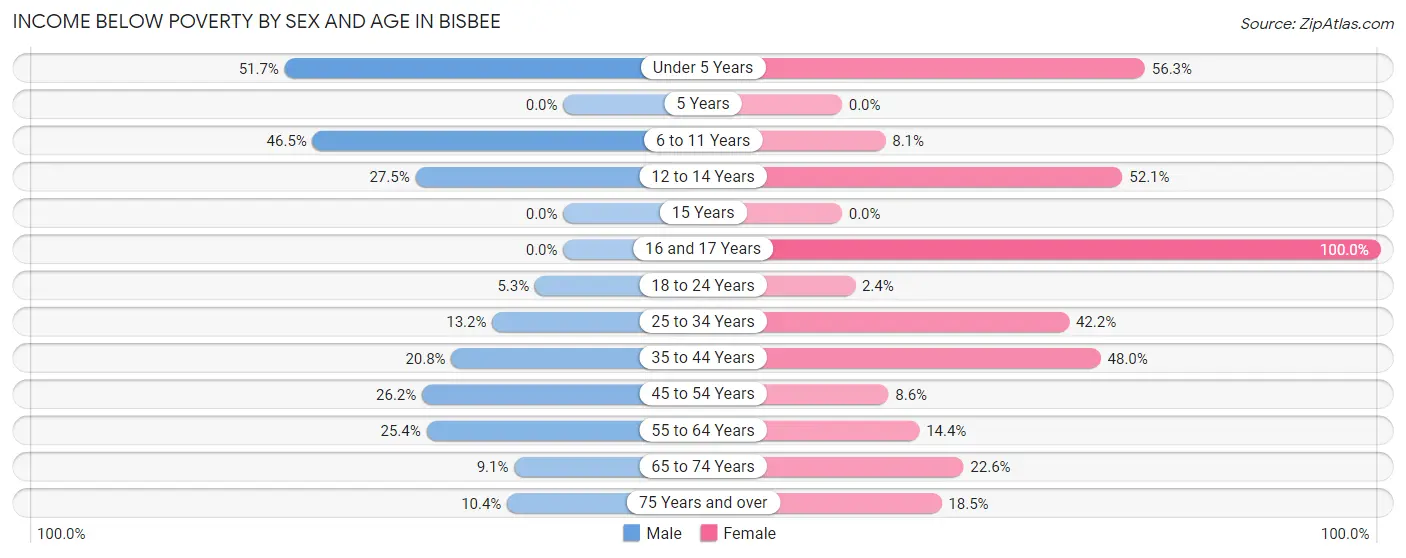
| Age Bracket | Male | Female |
| Under 5 Years | 15 (51.7%) | 18 (56.2%) |
| 5 Years | 0 (0.0%) | 0 (0.0%) |
| 6 to 11 Years | 47 (46.5%) | 13 (8.1%) |
| 12 to 14 Years | 14 (27.5%) | 50 (52.1%) |
| 15 Years | 0 (0.0%) | 0 (0.0%) |
| 16 and 17 Years | 0 (0.0%) | 15 (100.0%) |
| 18 to 24 Years | 7 (5.3%) | 2 (2.4%) |
| 25 to 34 Years | 19 (13.2%) | 70 (42.2%) |
| 35 to 44 Years | 43 (20.8%) | 86 (48.0%) |
| 45 to 54 Years | 86 (26.2%) | 21 (8.6%) |
| 55 to 64 Years | 81 (25.4%) | 74 (14.4%) |
| 65 to 74 Years | 62 (9.1%) | 123 (22.6%) |
| 75 Years and over | 20 (10.4%) | 83 (18.5%) |
| Total | 394 (17.9%) | 555 (22.3%) |
Income Above Poverty by Sex and Age in Bisbee
According to the poverty statistics in Bisbee, males aged 15 years and females aged 5 years are the age groups that are most secure financially, with 100.0% of males and 100.0% of females in these age groups living above the poverty line.
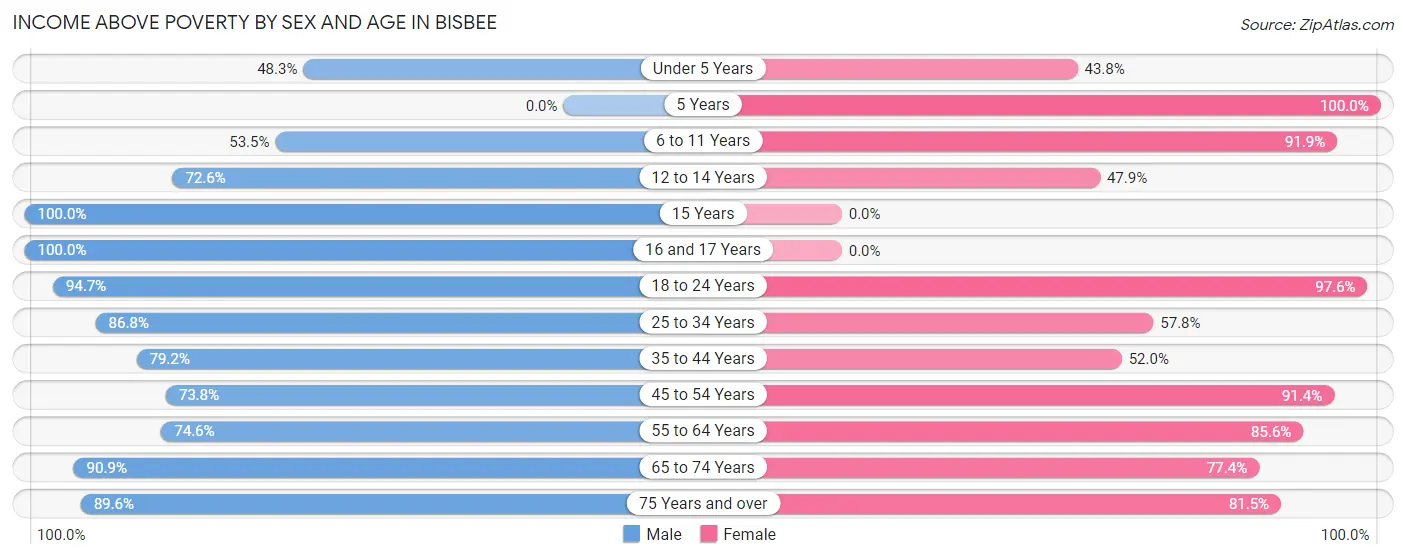
| Age Bracket | Male | Female |
| Under 5 Years | 14 (48.3%) | 14 (43.8%) |
| 5 Years | 0 (0.0%) | 7 (100.0%) |
| 6 to 11 Years | 54 (53.5%) | 148 (91.9%) |
| 12 to 14 Years | 37 (72.6%) | 46 (47.9%) |
| 15 Years | 11 (100.0%) | 0 (0.0%) |
| 16 and 17 Years | 8 (100.0%) | 0 (0.0%) |
| 18 to 24 Years | 126 (94.7%) | 80 (97.6%) |
| 25 to 34 Years | 125 (86.8%) | 96 (57.8%) |
| 35 to 44 Years | 164 (79.2%) | 93 (52.0%) |
| 45 to 54 Years | 242 (73.8%) | 222 (91.4%) |
| 55 to 64 Years | 238 (74.6%) | 441 (85.6%) |
| 65 to 74 Years | 619 (90.9%) | 422 (77.4%) |
| 75 Years and over | 172 (89.6%) | 366 (81.5%) |
| Total | 1,810 (82.1%) | 1,935 (77.7%) |
Income Below Poverty Among Married-Couple Families in Bisbee
The poverty statistics for married-couple families in Bisbee show that 8.5% or 62 of the total 727 families live below the poverty line. Families with 5 or more children have the highest poverty rate of 100.0%, comprising of 19 families. On the other hand, families with 3 or 4 children have the lowest poverty rate of 0.0%, which includes 0 families.
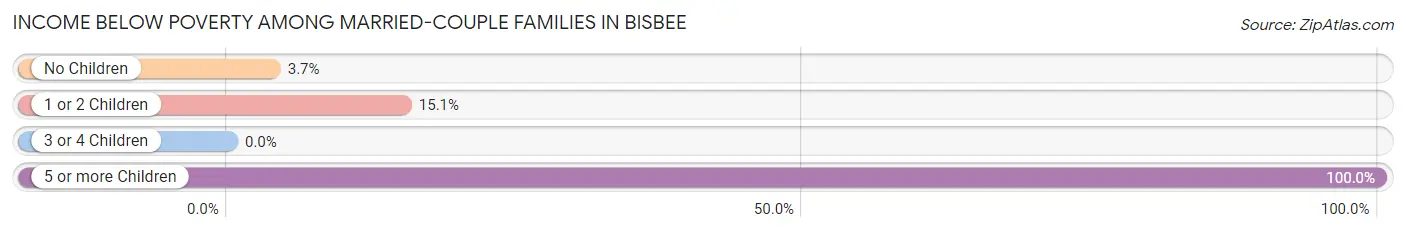
| Children | Above Poverty | Below Poverty |
| No Children | 518 (96.3%) | 20 (3.7%) |
| 1 or 2 Children | 129 (84.9%) | 23 (15.1%) |
| 3 or 4 Children | 18 (100.0%) | 0 (0.0%) |
| 5 or more Children | 0 (0.0%) | 19 (100.0%) |
| Total | 665 (91.5%) | 62 (8.5%) |
Income Below Poverty Among Single-Parent Households in Bisbee
According to the poverty data in Bisbee, 44.0% or 11 single-father households and 26.3% or 51 single-mother households are living below the poverty line. Among single-father households, those with no children have the highest poverty rate, with 11 households (44.0%) experiencing poverty. Likewise, among single-mother households, those with 1 or 2 children have the highest poverty rate, with 30 households (38.0%) falling below the poverty line.
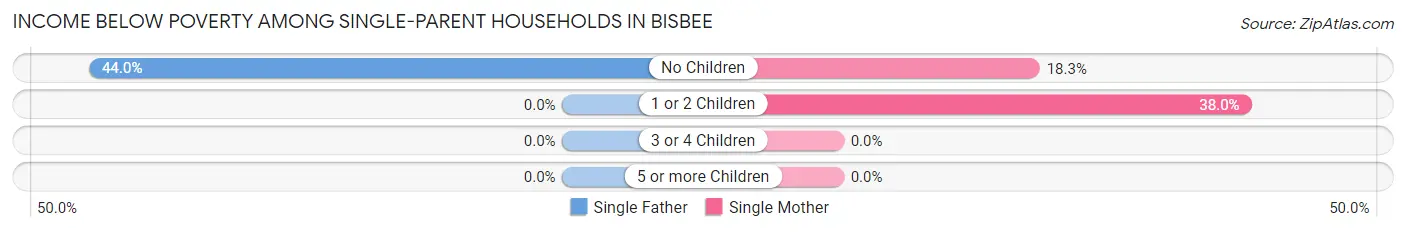
| Children | Single Father | Single Mother |
| No Children | 11 (44.0%) | 21 (18.3%) |
| 1 or 2 Children | 0 (0.0%) | 30 (38.0%) |
| 3 or 4 Children | 0 (0.0%) | 0 (0.0%) |
| 5 or more Children | 0 (0.0%) | 0 (0.0%) |
| Total | 11 (44.0%) | 51 (26.3%) |
Income Below Poverty Among Married-Couple vs Single-Parent Households in Bisbee
The poverty data for Bisbee shows that 62 of the married-couple family households (8.5%) and 62 of the single-parent households (28.3%) are living below the poverty level. Within the married-couple family households, those with 5 or more children have the highest poverty rate, with 19 households (100.0%) falling below the poverty line. Among the single-parent households, those with 1 or 2 children have the highest poverty rate, with 30 household (38.0%) living below poverty.
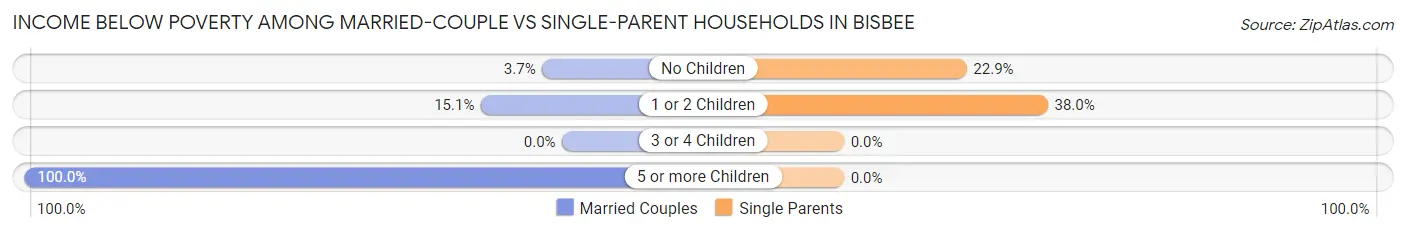
| Children | Married-Couple Families | Single-Parent Households |
| No Children | 20 (3.7%) | 32 (22.9%) |
| 1 or 2 Children | 23 (15.1%) | 30 (38.0%) |
| 3 or 4 Children | 0 (0.0%) | 0 (0.0%) |
| 5 or more Children | 19 (100.0%) | 0 (0.0%) |
| Total | 62 (8.5%) | 62 (28.3%) |
Race in Bisbee
The most populous races in Bisbee are White / Caucasian (3,846 | 77.3%), Hispanic or Latino (1,356 | 27.3%), and Two or more Races (779 | 15.7%).
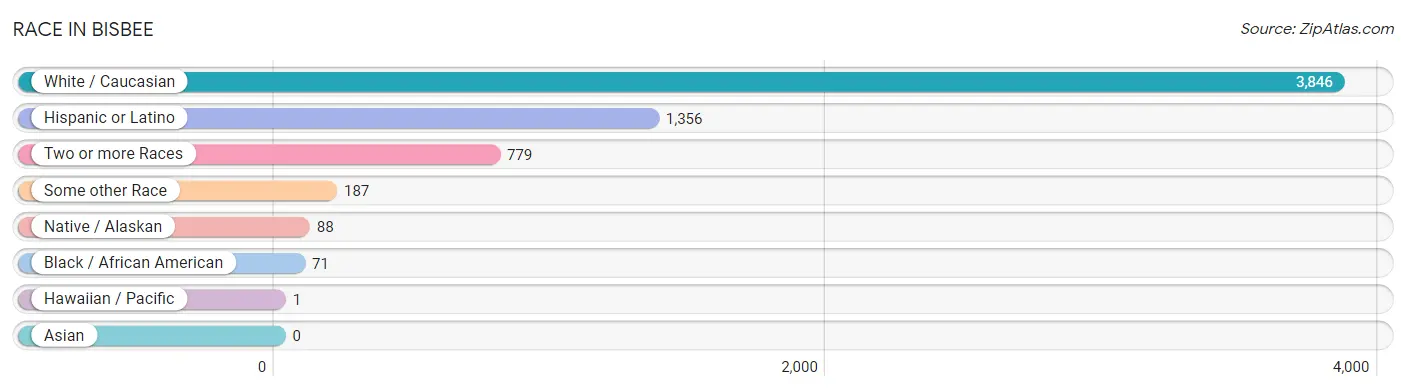
| Race | # Population | % Population |
| Asian | 0 | 0.0% |
| Black / African American | 71 | 1.4% |
| Hawaiian / Pacific | 1 | 0.0% |
| Hispanic or Latino | 1,356 | 27.3% |
| Native / Alaskan | 88 | 1.8% |
| White / Caucasian | 3,846 | 77.3% |
| Two or more Races | 779 | 15.7% |
| Some other Race | 187 | 3.8% |
| Total | 4,972 | 100.0% |
Ancestry in Bisbee
The most populous ancestries reported in Bisbee are Mexican (1,233 | 24.8%), German (1,213 | 24.4%), Irish (803 | 16.2%), English (606 | 12.2%), and American (194 | 3.9%), together accounting for 81.4% of all Bisbee residents.
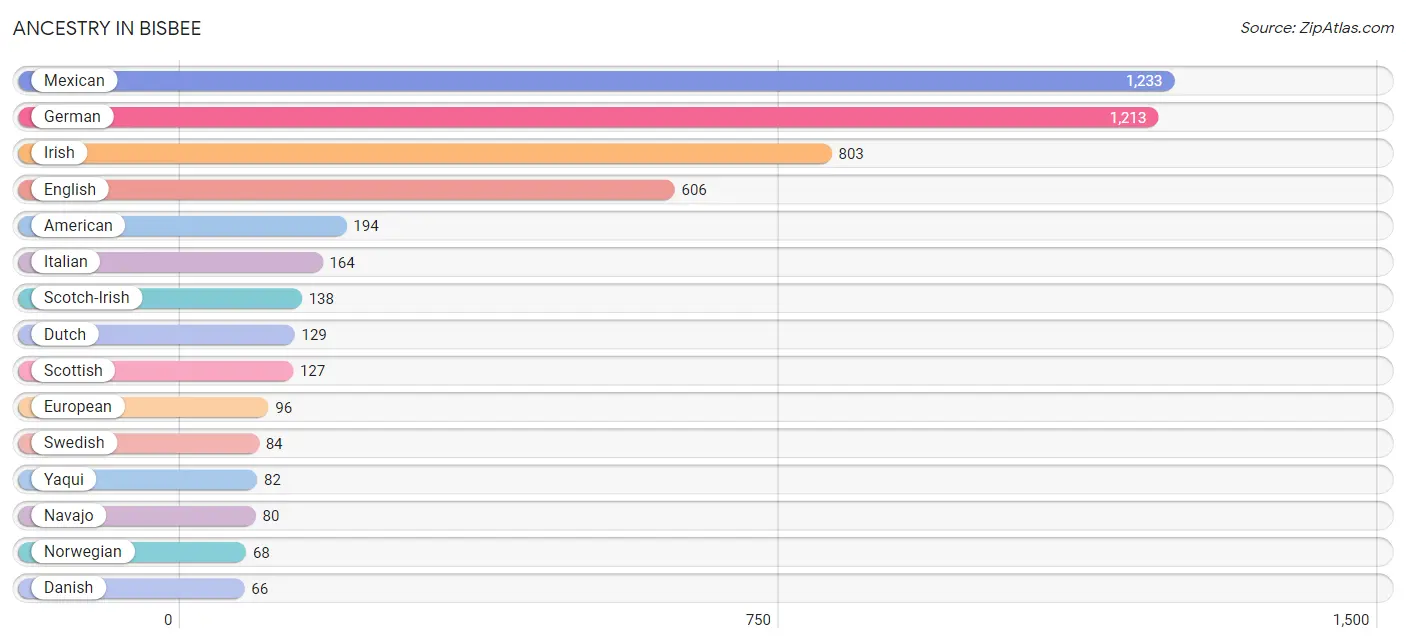
| Ancestry | # Population | % Population |
| American | 194 | 3.9% |
| Austrian | 31 | 0.6% |
| Belgian | 37 | 0.7% |
| British | 19 | 0.4% |
| Burmese | 28 | 0.6% |
| Canadian | 12 | 0.2% |
| Central American | 36 | 0.7% |
| Cherokee | 23 | 0.5% |
| Choctaw | 27 | 0.5% |
| Czech | 22 | 0.4% |
| Danish | 66 | 1.3% |
| Dutch | 129 | 2.6% |
| Eastern European | 43 | 0.9% |
| English | 606 | 12.2% |
| European | 96 | 1.9% |
| Finnish | 33 | 0.7% |
| French | 36 | 0.7% |
| French Canadian | 30 | 0.6% |
| German | 1,213 | 24.4% |
| Hungarian | 42 | 0.8% |
| Irish | 803 | 16.2% |
| Italian | 164 | 3.3% |
| Latvian | 19 | 0.4% |
| Mexican | 1,233 | 24.8% |
| Native Hawaiian | 1 | 0.0% |
| Navajo | 80 | 1.6% |
| Nicaraguan | 16 | 0.3% |
| Northern European | 10 | 0.2% |
| Norwegian | 68 | 1.4% |
| Panamanian | 20 | 0.4% |
| Polish | 34 | 0.7% |
| Russian | 41 | 0.8% |
| Scandinavian | 33 | 0.7% |
| Scotch-Irish | 138 | 2.8% |
| Scottish | 127 | 2.5% |
| Serbian | 10 | 0.2% |
| Spanish American | 19 | 0.4% |
| Subsaharan African | 12 | 0.2% |
| Swedish | 84 | 1.7% |
| Tohono O'Odham | 15 | 0.3% |
| Welsh | 14 | 0.3% |
| Yaqui | 82 | 1.7% |
| Yugoslavian | 10 | 0.2% | View All 43 Rows |
Immigrants in Bisbee
The most numerous immigrant groups reported in Bisbee came from Central America (245 | 4.9%), Latin America (245 | 4.9%), Mexico (245 | 4.9%), Europe (88 | 1.8%), and Northern Europe (49 | 1.0%), together accounting for 17.5% of all Bisbee residents.
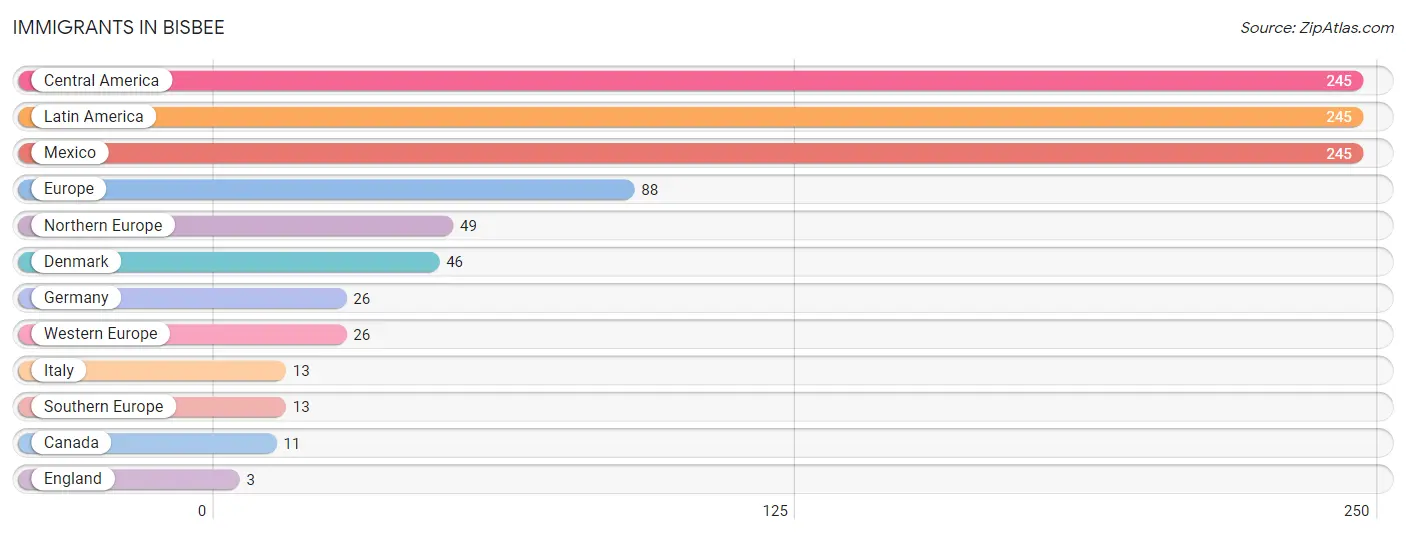
| Immigration Origin | # Population | % Population |
| Canada | 11 | 0.2% |
| Central America | 245 | 4.9% |
| Denmark | 46 | 0.9% |
| England | 3 | 0.1% |
| Europe | 88 | 1.8% |
| Germany | 26 | 0.5% |
| Italy | 13 | 0.3% |
| Latin America | 245 | 4.9% |
| Mexico | 245 | 4.9% |
| Northern Europe | 49 | 1.0% |
| Southern Europe | 13 | 0.3% |
| Western Europe | 26 | 0.5% | View All 12 Rows |
Sex and Age in Bisbee
Sex and Age in Bisbee
The most populous age groups in Bisbee are 70 to 74 Years (357 | 14.4%) for men and 60 to 64 Years (344 | 13.8%) for women.
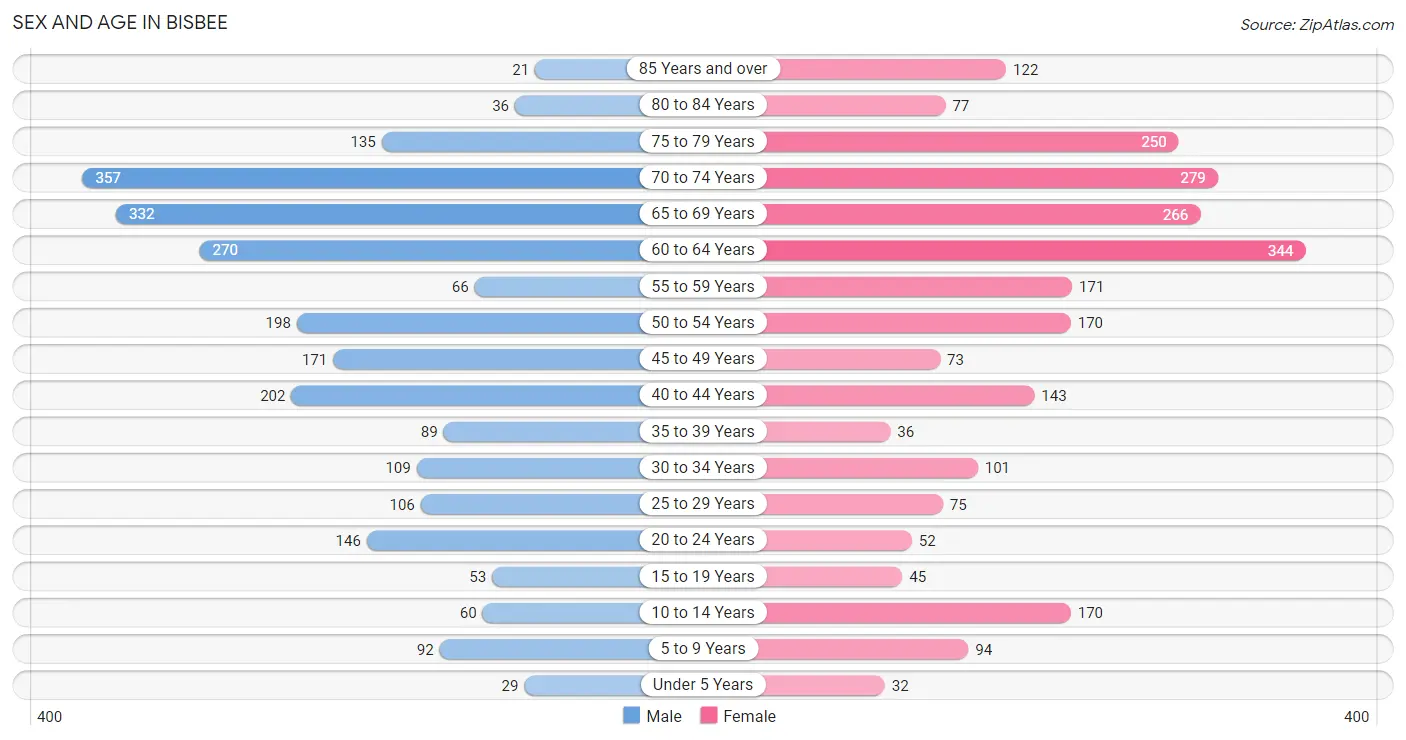
| Age Bracket | Male | Female |
| Under 5 Years | 29 (1.2%) | 32 (1.3%) |
| 5 to 9 Years | 92 (3.7%) | 94 (3.8%) |
| 10 to 14 Years | 60 (2.4%) | 170 (6.8%) |
| 15 to 19 Years | 53 (2.1%) | 45 (1.8%) |
| 20 to 24 Years | 146 (5.9%) | 52 (2.1%) |
| 25 to 29 Years | 106 (4.3%) | 75 (3.0%) |
| 30 to 34 Years | 109 (4.4%) | 101 (4.0%) |
| 35 to 39 Years | 89 (3.6%) | 36 (1.4%) |
| 40 to 44 Years | 202 (8.2%) | 143 (5.7%) |
| 45 to 49 Years | 171 (6.9%) | 73 (2.9%) |
| 50 to 54 Years | 198 (8.0%) | 170 (6.8%) |
| 55 to 59 Years | 66 (2.7%) | 171 (6.8%) |
| 60 to 64 Years | 270 (10.9%) | 344 (13.8%) |
| 65 to 69 Years | 332 (13.4%) | 266 (10.6%) |
| 70 to 74 Years | 357 (14.4%) | 279 (11.2%) |
| 75 to 79 Years | 135 (5.5%) | 250 (10.0%) |
| 80 to 84 Years | 36 (1.5%) | 77 (3.1%) |
| 85 Years and over | 21 (0.9%) | 122 (4.9%) |
| Total | 2,472 (100.0%) | 2,500 (100.0%) |
Families and Households in Bisbee
Median Family Size in Bisbee
The median family size in Bisbee is 2.91 persons per family, with married-couple families (727 | 76.8%) accounting for the largest median family size of 3.02 persons per family. On the other hand, single male/father families (25 | 2.6%) represent the smallest median family size with 2.36 persons per family.
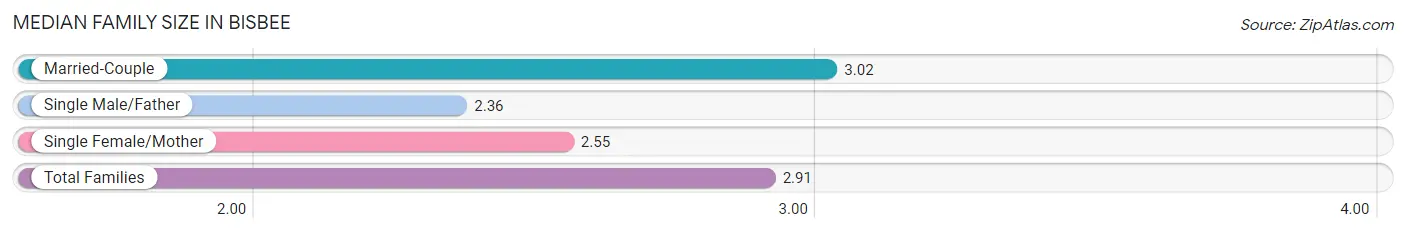
| Family Type | # Families | Family Size |
| Married-Couple | 727 (76.8%) | 3.02 |
| Single Male/Father | 25 (2.6%) | 2.36 |
| Single Female/Mother | 194 (20.5%) | 2.55 |
| Total Families | 946 (100.0%) | 2.91 |
Median Household Size in Bisbee
The median household size in Bisbee is 1.78 persons per household, with single male/father households (25 | 1.0%) accounting for the largest median household size of 3.04 persons per household. non-family households (1,656 | 63.6%) represent the smallest median household size with 1.12 persons per household.
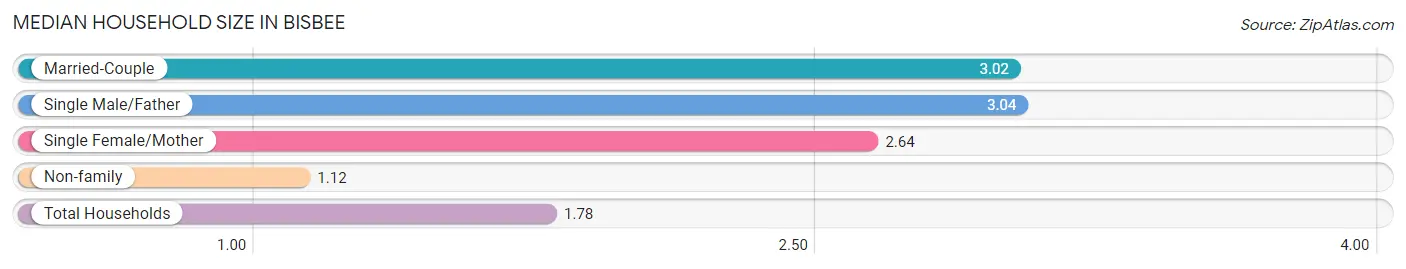
| Household Type | # Households | Household Size |
| Married-Couple | 727 (27.9%) | 3.02 |
| Single Male/Father | 25 (1.0%) | 3.04 |
| Single Female/Mother | 194 (7.5%) | 2.64 |
| Non-family | 1,656 (63.6%) | 1.12 |
| Total Households | 2,602 (100.0%) | 1.78 |
Household Size by Marriage Status in Bisbee
Out of a total of 2,602 households in Bisbee, 946 (36.4%) are family households, while 1,656 (63.6%) are nonfamily households. The most numerous type of family households are 2-person households, comprising 540, and the most common type of nonfamily households are 1-person households, comprising 1,511.
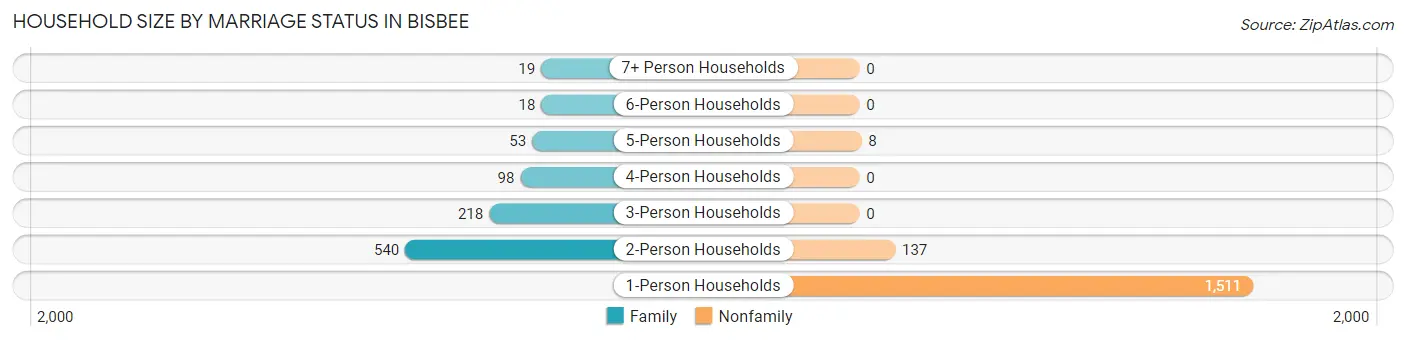
| Household Size | Family Households | Nonfamily Households |
| 1-Person Households | - | 1,511 (58.1%) |
| 2-Person Households | 540 (20.7%) | 137 (5.3%) |
| 3-Person Households | 218 (8.4%) | 0 (0.0%) |
| 4-Person Households | 98 (3.8%) | 0 (0.0%) |
| 5-Person Households | 53 (2.0%) | 8 (0.3%) |
| 6-Person Households | 18 (0.7%) | 0 (0.0%) |
| 7+ Person Households | 19 (0.7%) | 0 (0.0%) |
| Total | 946 (36.4%) | 1,656 (63.6%) |
Female Fertility in Bisbee
Fertility by Age in Bisbee
| Age Bracket | Women with Births | Births / 1,000 Women |
| 15 to 19 years | 0 (0.0%) | 0.0 |
| 20 to 34 years | 0 (0.0%) | 0.0 |
| 35 to 50 years | 0 (0.0%) | 0.0 |
| Total | 0 (0.0%) | 0.0 |
Fertility by Age by Marriage Status in Bisbee
| Age Bracket | Married | Unmarried |
| 15 to 19 years | 0 (0.0%) | 0 (0.0%) |
| 20 to 34 years | 0 (0.0%) | 0 (0.0%) |
| 35 to 50 years | 0 (0.0%) | 0 (0.0%) |
| Total | 0 (0.0%) | 0 (0.0%) |
Fertility by Education in Bisbee
| Educational Attainment | Women with Births | Births / 1,000 Women |
| Less than High School | 0 (0.0%) | 0.0 |
| High School Diploma | 0 (0.0%) | 0.0 |
| College or Associate's Degree | 0 (0.0%) | 0.0 |
| Bachelor's Degree | 0 (0.0%) | 0.0 |
| Graduate Degree | 0 (0.0%) | 0.0 |
| Total | 0 (0.0%) | 0.0 |
Fertility by Education by Marriage Status in Bisbee
| Educational Attainment | Married | Unmarried |
| Less than High School | 0 (0.0%) | 0 (0.0%) |
| High School Diploma | 0 (0.0%) | 0 (0.0%) |
| College or Associate's Degree | 0 (0.0%) | 0 (0.0%) |
| Bachelor's Degree | 0 (0.0%) | 0 (0.0%) |
| Graduate Degree | 0 (0.0%) | 0 (0.0%) |
| Total | 0 (0.0%) | 0 (0.0%) |
Employment Characteristics in Bisbee
Employment by Class of Employer in Bisbee
Among the 1,636 employed individuals in Bisbee, private company employees (552 | 33.7%), local government employees (289 | 17.7%), and self-employed (not incorporated) (258 | 15.8%) make up the most common classes of employment.
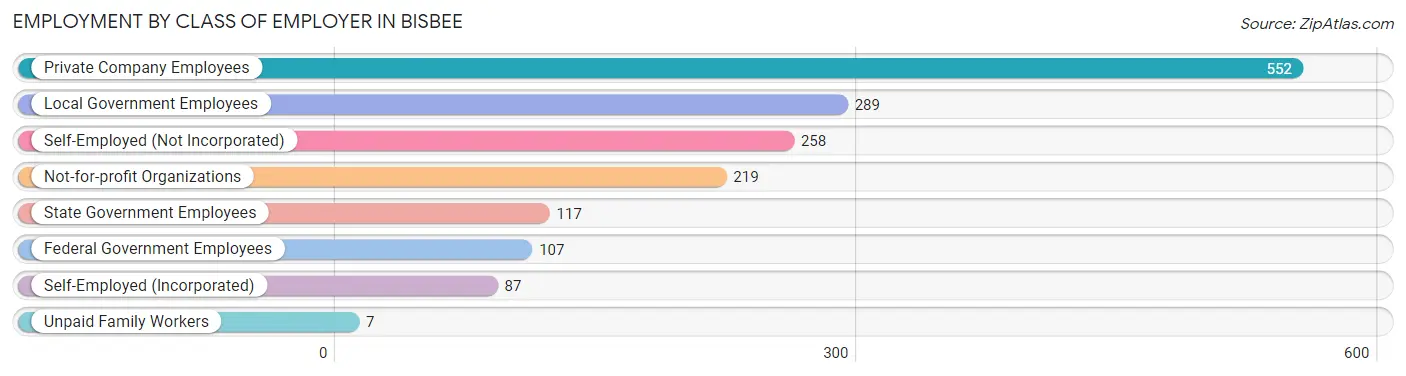
| Employer Class | # Employees | % Employees |
| Private Company Employees | 552 | 33.7% |
| Self-Employed (Incorporated) | 87 | 5.3% |
| Self-Employed (Not Incorporated) | 258 | 15.8% |
| Not-for-profit Organizations | 219 | 13.4% |
| Local Government Employees | 289 | 17.7% |
| State Government Employees | 117 | 7.1% |
| Federal Government Employees | 107 | 6.5% |
| Unpaid Family Workers | 7 | 0.4% |
| Total | 1,636 | 100.0% |
Employment Status by Age in Bisbee
According to the labor force statistics for Bisbee, out of the total population over 16 years of age (4,484), 38.7% or 1,735 individuals are in the labor force, with 4.3% or 75 of them unemployed. The age group with the highest labor force participation rate is 20 to 24 years, with 73.2% or 145 individuals in the labor force. Within the labor force, the 25 to 29 years age range has the highest percentage of unemployed individuals, with 20.9% or 18 of them being unemployed.
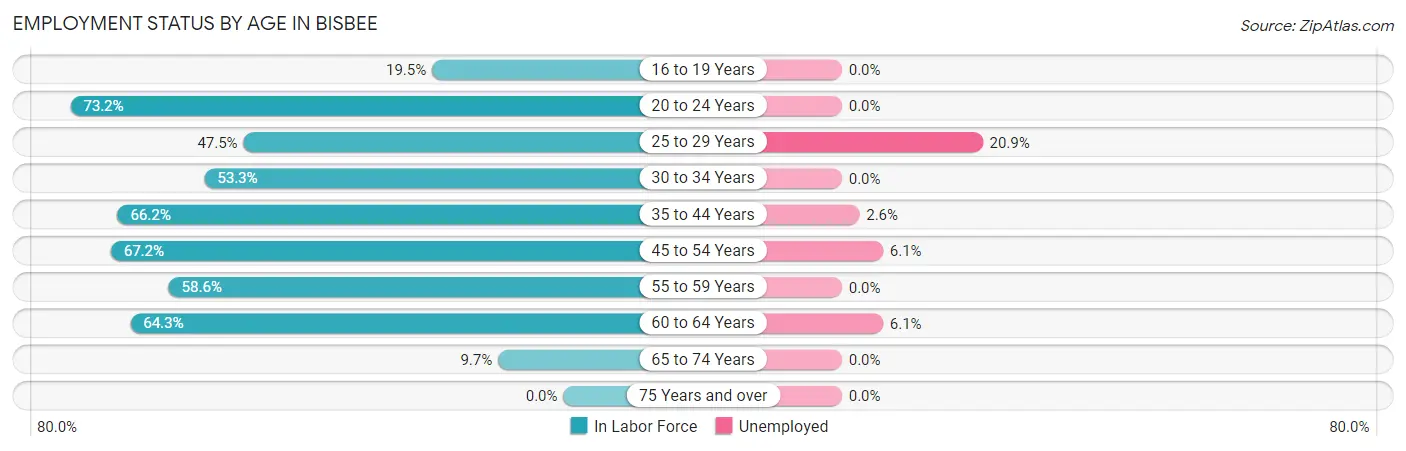
| Age Bracket | In Labor Force | Unemployed |
| 16 to 19 Years | 17 (19.5%) | 0 (0.0%) |
| 20 to 24 Years | 145 (73.2%) | 0 (0.0%) |
| 25 to 29 Years | 86 (47.5%) | 18 (20.9%) |
| 30 to 34 Years | 112 (53.3%) | 0 (0.0%) |
| 35 to 44 Years | 311 (66.2%) | 8 (2.6%) |
| 45 to 54 Years | 411 (67.2%) | 25 (6.1%) |
| 55 to 59 Years | 139 (58.6%) | 0 (0.0%) |
| 60 to 64 Years | 395 (64.3%) | 24 (6.1%) |
| 65 to 74 Years | 120 (9.7%) | 0 (0.0%) |
| 75 Years and over | 0 (0.0%) | 0 (0.0%) |
| Total | 1,735 (38.7%) | 75 (4.3%) |
Employment Status by Educational Attainment in Bisbee
According to labor force statistics for Bisbee, 62.6% of individuals (1,455) out of the total population between 25 and 64 years of age (2,324) are in the labor force, with 5.2% or 76 of them being unemployed. The group with the highest labor force participation rate are those with the educational attainment of college / associate degree, with 71.7% or 719 individuals in the labor force. Within the labor force, individuals with high school diploma education have the highest percentage of unemployment, with 10.7% or 25 of them being unemployed.
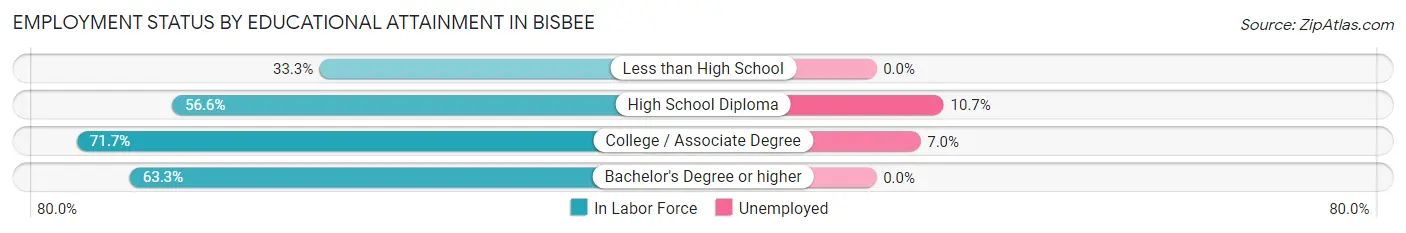
| Educational Attainment | In Labor Force | Unemployed |
| Less than High School | 82 (33.3%) | 0 (0.0%) |
| High School Diploma | 233 (56.6%) | 44 (10.7%) |
| College / Associate Degree | 719 (71.7%) | 70 (7.0%) |
| Bachelor's Degree or higher | 420 (63.3%) | 0 (0.0%) |
| Total | 1,455 (62.6%) | 121 (5.2%) |
Employment Occupations by Sex in Bisbee
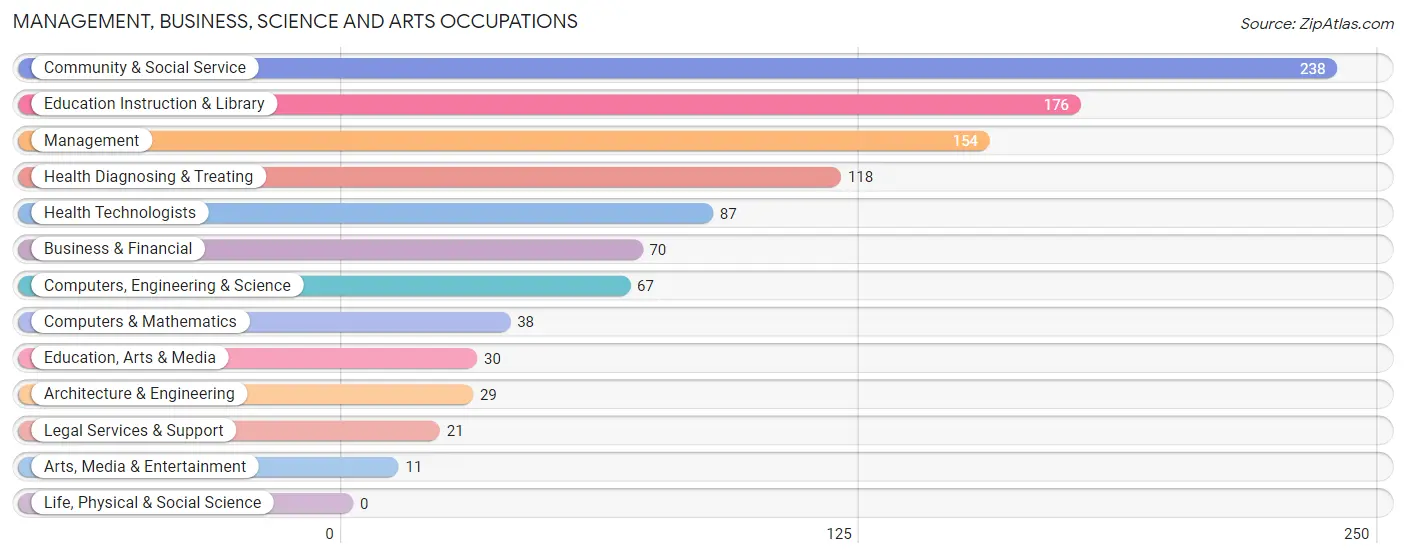
Management, Business, Science and Arts Occupations
The most common Management, Business, Science and Arts occupations in Bisbee are Community & Social Service (238 | 14.3%), Education Instruction & Library (176 | 10.6%), Management (154 | 9.3%), Health Diagnosing & Treating (118 | 7.1%), and Health Technologists (87 | 5.2%).
Management, Business, Science and Arts Occupations by Sex
Within the Management, Business, Science and Arts occupations in Bisbee, the most male-oriented occupations are Architecture & Engineering (100.0%), Education, Arts & Media (100.0%), and Arts, Media & Entertainment (100.0%), while the most female-oriented occupations are Health Technologists (100.0%), Computers & Mathematics (86.8%), and Education Instruction & Library (75.0%).
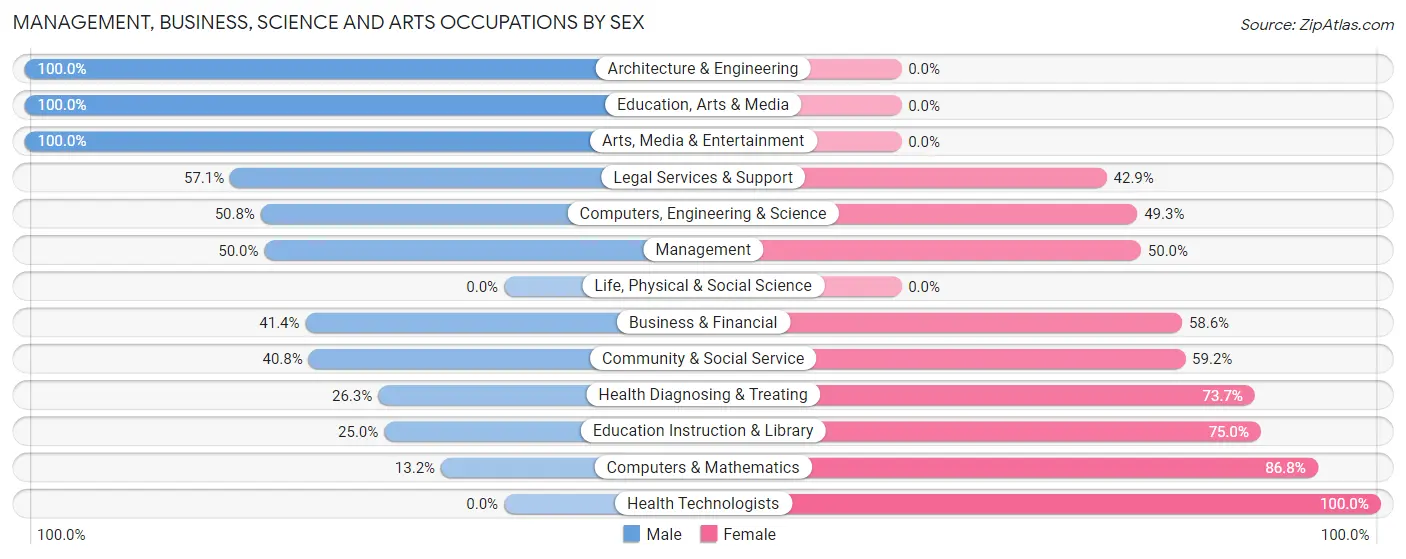
| Occupation | Male | Female |
| Management | 77 (50.0%) | 77 (50.0%) |
| Business & Financial | 29 (41.4%) | 41 (58.6%) |
| Computers, Engineering & Science | 34 (50.7%) | 33 (49.2%) |
| Computers & Mathematics | 5 (13.2%) | 33 (86.8%) |
| Architecture & Engineering | 29 (100.0%) | 0 (0.0%) |
| Life, Physical & Social Science | 0 (0.0%) | 0 (0.0%) |
| Community & Social Service | 97 (40.8%) | 141 (59.2%) |
| Education, Arts & Media | 30 (100.0%) | 0 (0.0%) |
| Legal Services & Support | 12 (57.1%) | 9 (42.9%) |
| Education Instruction & Library | 44 (25.0%) | 132 (75.0%) |
| Arts, Media & Entertainment | 11 (100.0%) | 0 (0.0%) |
| Health Diagnosing & Treating | 31 (26.3%) | 87 (73.7%) |
| Health Technologists | 0 (0.0%) | 87 (100.0%) |
| Total (Category) | 268 (41.4%) | 379 (58.6%) |
| Total (Overall) | 926 (55.7%) | 735 (44.3%) |
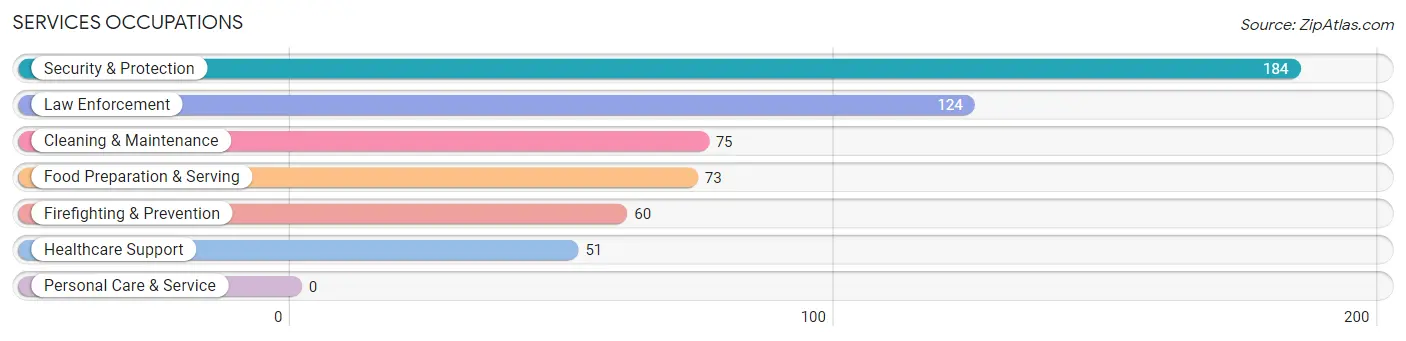
Services Occupations
The most common Services occupations in Bisbee are Security & Protection (184 | 11.1%), Law Enforcement (124 | 7.5%), Cleaning & Maintenance (75 | 4.5%), Food Preparation & Serving (73 | 4.4%), and Firefighting & Prevention (60 | 3.6%).
Services Occupations by Sex
Within the Services occupations in Bisbee, the most male-oriented occupations are Cleaning & Maintenance (92.0%), Law Enforcement (90.3%), and Security & Protection (89.7%), while the most female-oriented occupations are Healthcare Support (74.5%), Food Preparation & Serving (39.7%), and Firefighting & Prevention (11.7%).
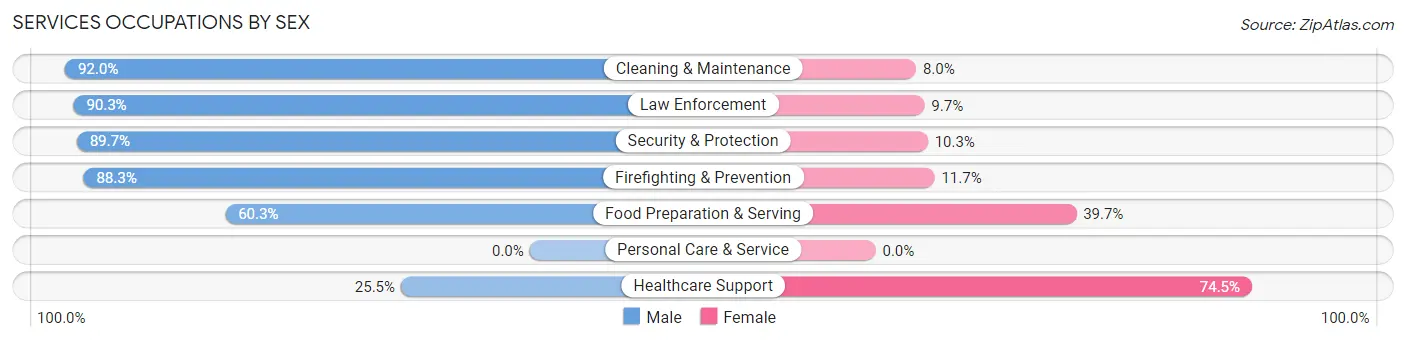
| Occupation | Male | Female |
| Healthcare Support | 13 (25.5%) | 38 (74.5%) |
| Security & Protection | 165 (89.7%) | 19 (10.3%) |
| Firefighting & Prevention | 53 (88.3%) | 7 (11.7%) |
| Law Enforcement | 112 (90.3%) | 12 (9.7%) |
| Food Preparation & Serving | 44 (60.3%) | 29 (39.7%) |
| Cleaning & Maintenance | 69 (92.0%) | 6 (8.0%) |
| Personal Care & Service | 0 (0.0%) | 0 (0.0%) |
| Total (Category) | 291 (76.0%) | 92 (24.0%) |
| Total (Overall) | 926 (55.7%) | 735 (44.3%) |
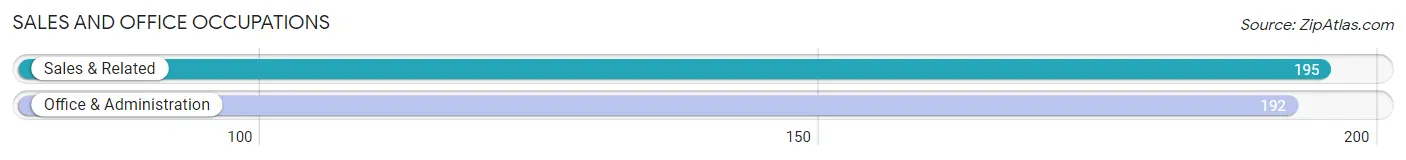
Sales and Office Occupations
The most common Sales and Office occupations in Bisbee are Sales & Related (195 | 11.7%), and Office & Administration (192 | 11.6%).
Sales and Office Occupations by Sex
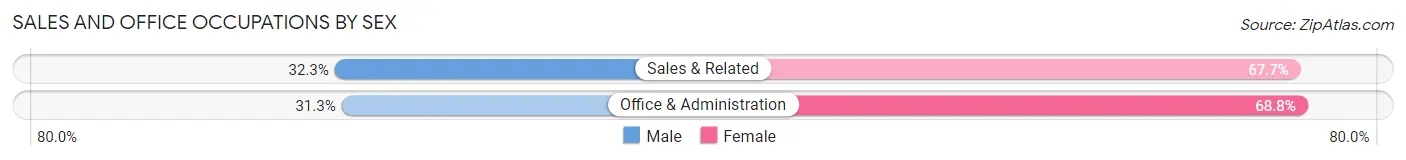
| Occupation | Male | Female |
| Sales & Related | 63 (32.3%) | 132 (67.7%) |
| Office & Administration | 60 (31.2%) | 132 (68.8%) |
| Total (Category) | 123 (31.8%) | 264 (68.2%) |
| Total (Overall) | 926 (55.7%) | 735 (44.3%) |
Natural Resources, Construction and Maintenance Occupations
The most common Natural Resources, Construction and Maintenance occupations in Bisbee are , and Construction & Extraction (152 | 9.1%).

Natural Resources, Construction and Maintenance Occupations by Sex

| Occupation | Male | Female |
| Farming, Fishing & Forestry | 0 (0.0%) | 0 (0.0%) |
| Construction & Extraction | 152 (100.0%) | 0 (0.0%) |
| Installation, Maintenance & Repair | 0 (0.0%) | 0 (0.0%) |
| Total (Category) | 152 (100.0%) | 0 (0.0%) |
| Total (Overall) | 926 (55.7%) | 735 (44.3%) |
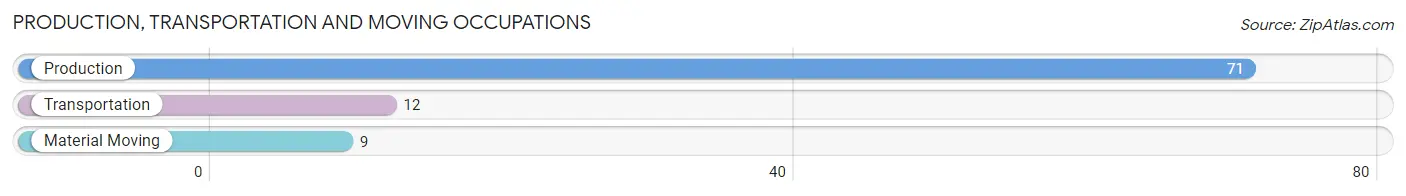
Production, Transportation and Moving Occupations
The most common Production, Transportation and Moving occupations in Bisbee are Production (71 | 4.3%), Transportation (12 | 0.7%), and Material Moving (9 | 0.5%).
Production, Transportation and Moving Occupations by Sex
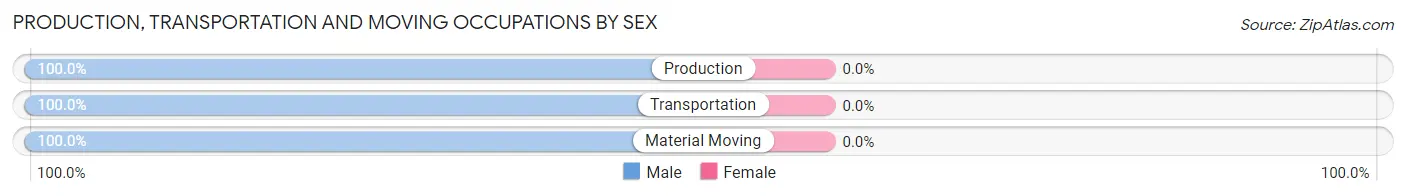
| Occupation | Male | Female |
| Production | 71 (100.0%) | 0 (0.0%) |
| Transportation | 12 (100.0%) | 0 (0.0%) |
| Material Moving | 9 (100.0%) | 0 (0.0%) |
| Total (Category) | 92 (100.0%) | 0 (0.0%) |
| Total (Overall) | 926 (55.7%) | 735 (44.3%) |
Employment Industries by Sex in Bisbee
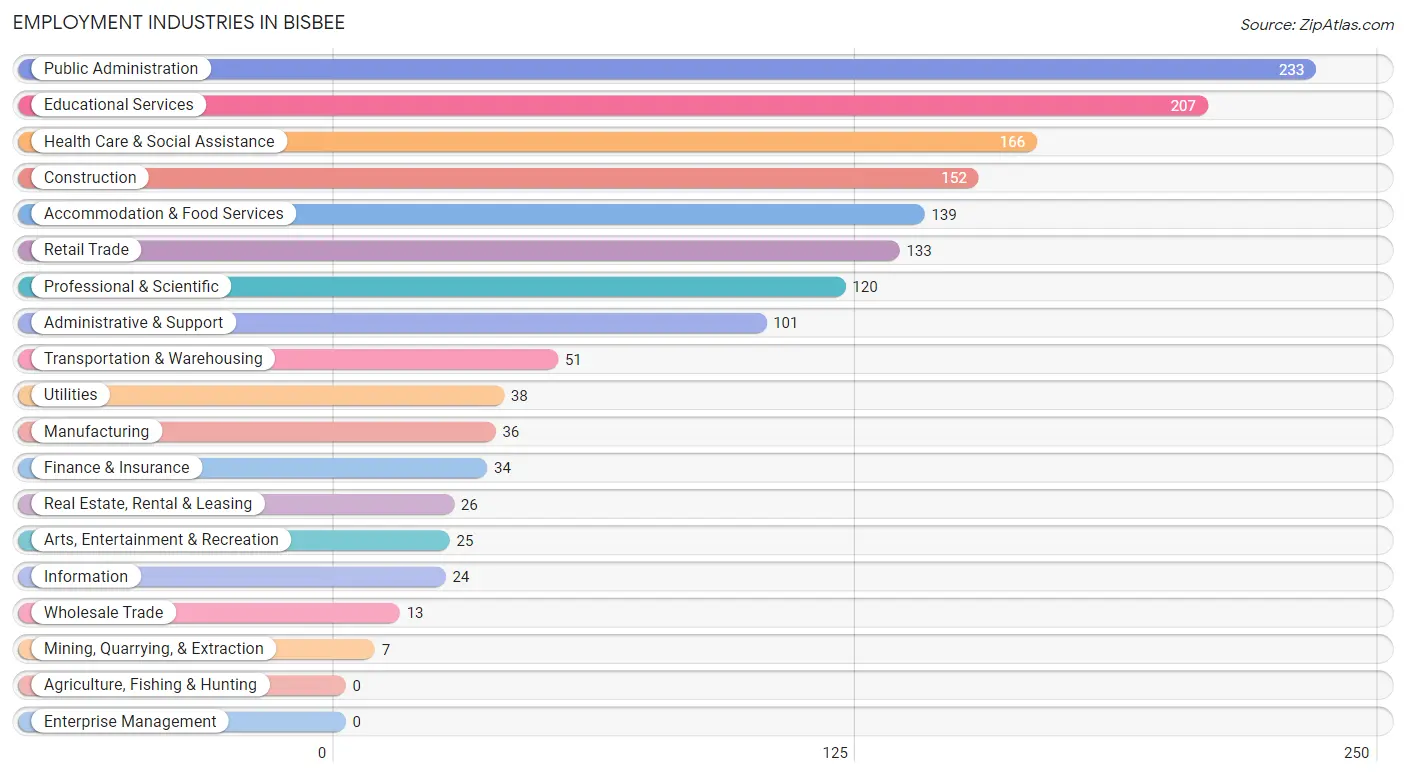
Employment Industries in Bisbee
The major employment industries in Bisbee include Public Administration (233 | 14.0%), Educational Services (207 | 12.5%), Health Care & Social Assistance (166 | 10.0%), Construction (152 | 9.1%), and Accommodation & Food Services (139 | 8.4%).
Employment Industries by Sex in Bisbee
The Bisbee industries that see more men than women are Construction (100.0%), Transportation & Warehousing (100.0%), and Utilities (100.0%), whereas the industries that tend to have a higher number of women are Mining, Quarrying, & Extraction (100.0%), Wholesale Trade (100.0%), and Finance & Insurance (100.0%).
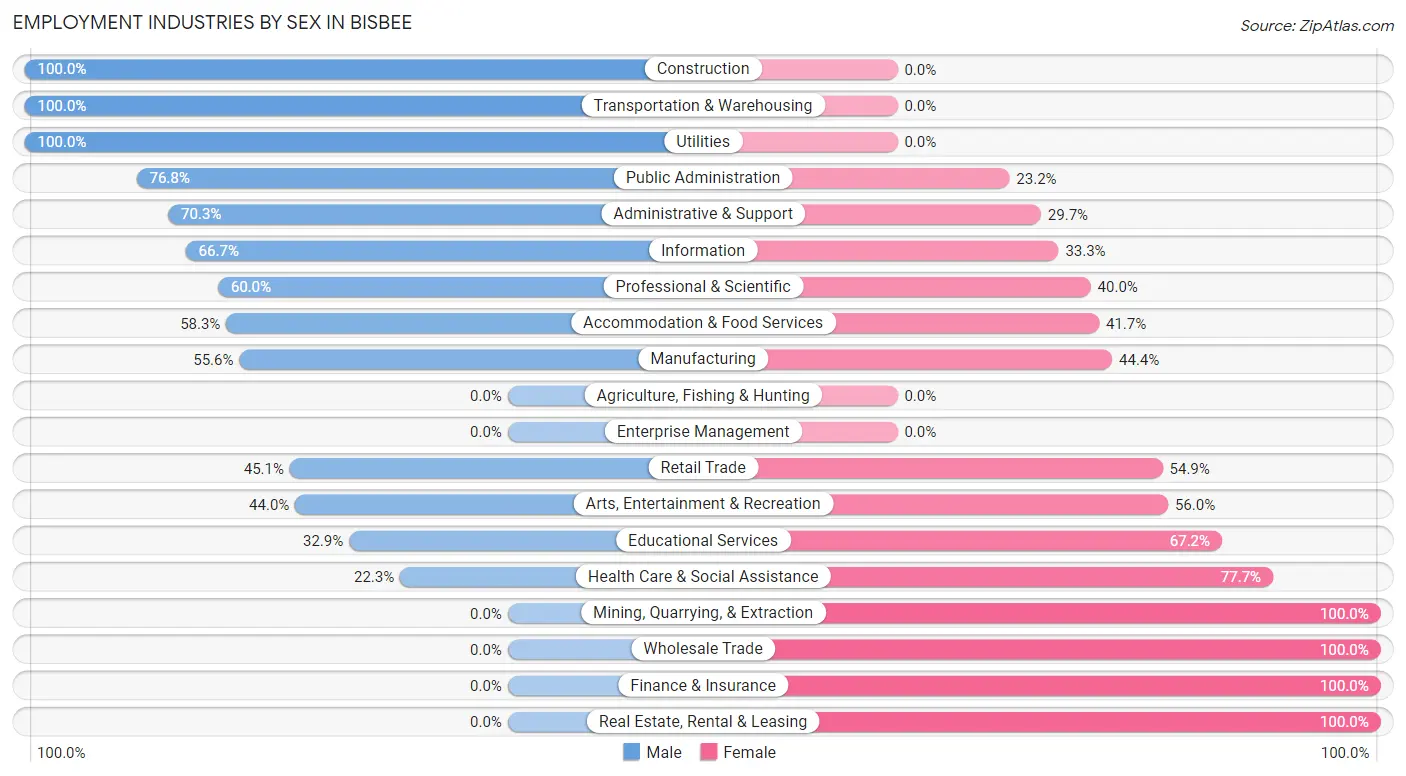
| Industry | Male | Female |
| Agriculture, Fishing & Hunting | 0 (0.0%) | 0 (0.0%) |
| Mining, Quarrying, & Extraction | 0 (0.0%) | 7 (100.0%) |
| Construction | 152 (100.0%) | 0 (0.0%) |
| Manufacturing | 20 (55.6%) | 16 (44.4%) |
| Wholesale Trade | 0 (0.0%) | 13 (100.0%) |
| Retail Trade | 60 (45.1%) | 73 (54.9%) |
| Transportation & Warehousing | 51 (100.0%) | 0 (0.0%) |
| Utilities | 38 (100.0%) | 0 (0.0%) |
| Information | 16 (66.7%) | 8 (33.3%) |
| Finance & Insurance | 0 (0.0%) | 34 (100.0%) |
| Real Estate, Rental & Leasing | 0 (0.0%) | 26 (100.0%) |
| Professional & Scientific | 72 (60.0%) | 48 (40.0%) |
| Enterprise Management | 0 (0.0%) | 0 (0.0%) |
| Administrative & Support | 71 (70.3%) | 30 (29.7%) |
| Educational Services | 68 (32.9%) | 139 (67.1%) |
| Health Care & Social Assistance | 37 (22.3%) | 129 (77.7%) |
| Arts, Entertainment & Recreation | 11 (44.0%) | 14 (56.0%) |
| Accommodation & Food Services | 81 (58.3%) | 58 (41.7%) |
| Public Administration | 179 (76.8%) | 54 (23.2%) |
| Total | 926 (55.7%) | 735 (44.3%) |
Education in Bisbee
School Enrollment in Bisbee
The most common levels of schooling among the 588 students in Bisbee are middle school (203 | 34.5%), elementary school (159 | 27.0%), and college / undergraduate (104 | 17.7%).
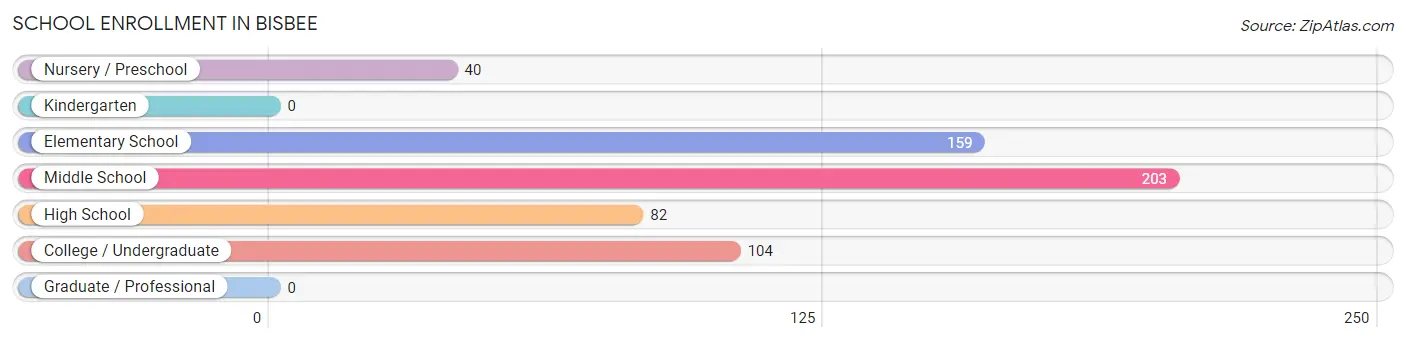
| School Level | # Students | % Students |
| Nursery / Preschool | 40 | 6.8% |
| Kindergarten | 0 | 0.0% |
| Elementary School | 159 | 27.0% |
| Middle School | 203 | 34.5% |
| High School | 82 | 14.0% |
| College / Undergraduate | 104 | 17.7% |
| Graduate / Professional | 0 | 0.0% |
| Total | 588 | 100.0% |
School Enrollment by Age by Funding Source in Bisbee
Out of a total of 588 students who are enrolled in schools in Bisbee, 40 (6.8%) attend a private institution, while the remaining 548 (93.2%) are enrolled in public schools. The age group of 10 to 14 year olds has the highest likelihood of being enrolled in private schools, with 40 (17.4% in the age bracket) enrolled. Conversely, the age group of 5 to 9 year old has the lowest likelihood of being enrolled in a private school, with 186 (100.0% in the age bracket) attending a public institution.
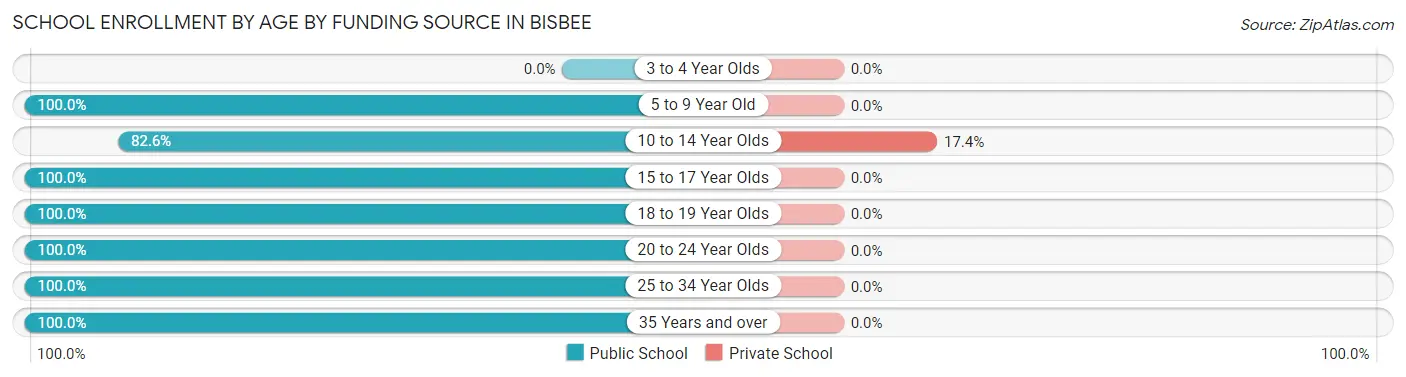
| Age Bracket | Public School | Private School |
| 3 to 4 Year Olds | 0 (0.0%) | 0 (0.0%) |
| 5 to 9 Year Old | 186 (100.0%) | 0 (0.0%) |
| 10 to 14 Year Olds | 190 (82.6%) | 40 (17.4%) |
| 15 to 17 Year Olds | 35 (100.0%) | 0 (0.0%) |
| 18 to 19 Year Olds | 32 (100.0%) | 0 (0.0%) |
| 20 to 24 Year Olds | 60 (100.0%) | 0 (0.0%) |
| 25 to 34 Year Olds | 35 (100.0%) | 0 (0.0%) |
| 35 Years and over | 10 (100.0%) | 0 (0.0%) |
| Total | 548 (93.2%) | 40 (6.8%) |
Educational Attainment by Field of Study in Bisbee
Education (527 | 33.5%), business (147 | 9.3%), literature & languages (131 | 8.3%), visual & performing arts (126 | 8.0%), and arts & humanities (121 | 7.7%) are the most common fields of study among 1,572 individuals in Bisbee who have obtained a bachelor's degree or higher.
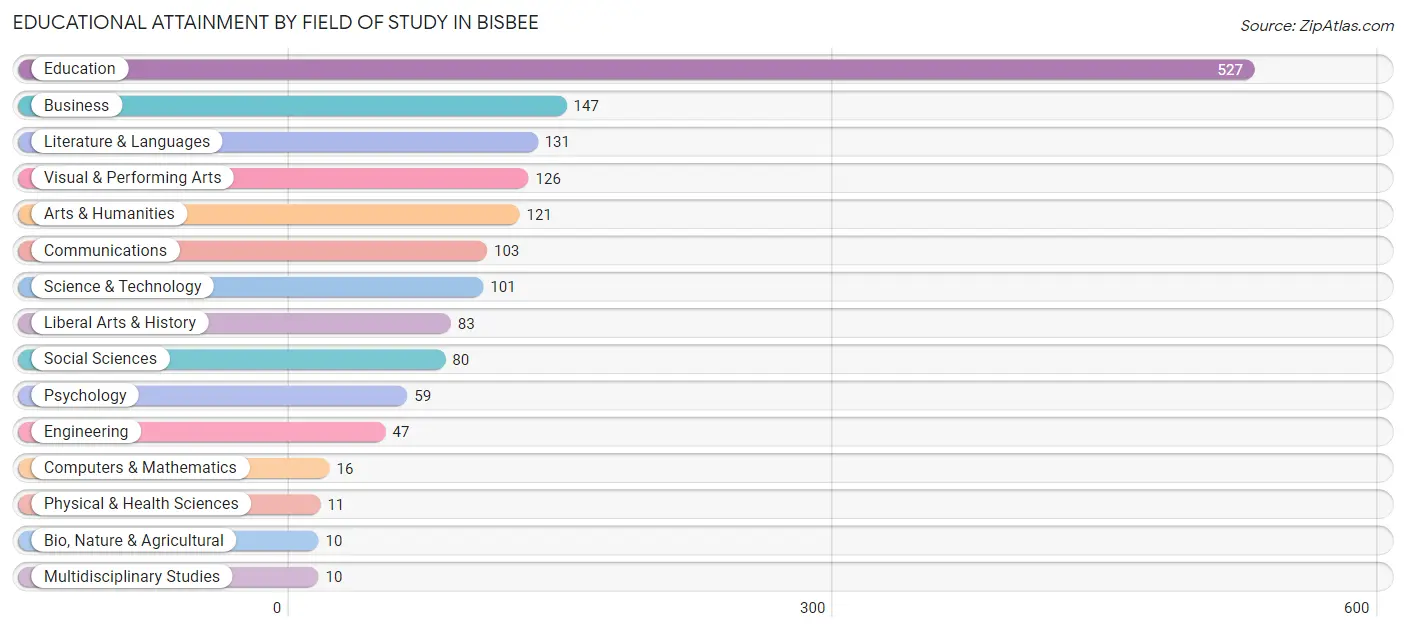
| Field of Study | # Graduates | % Graduates |
| Computers & Mathematics | 16 | 1.0% |
| Bio, Nature & Agricultural | 10 | 0.6% |
| Physical & Health Sciences | 11 | 0.7% |
| Psychology | 59 | 3.7% |
| Social Sciences | 80 | 5.1% |
| Engineering | 47 | 3.0% |
| Multidisciplinary Studies | 10 | 0.6% |
| Science & Technology | 101 | 6.4% |
| Business | 147 | 9.3% |
| Education | 527 | 33.5% |
| Literature & Languages | 131 | 8.3% |
| Liberal Arts & History | 83 | 5.3% |
| Visual & Performing Arts | 126 | 8.0% |
| Communications | 103 | 6.6% |
| Arts & Humanities | 121 | 7.7% |
| Total | 1,572 | 100.0% |
Transportation & Commute in Bisbee
Vehicle Availability by Sex in Bisbee
The most prevalent vehicle ownership categories in Bisbee are males with 2 vehicles (342, accounting for 37.8%) and females with 2 vehicles (276, making up 48.2%).
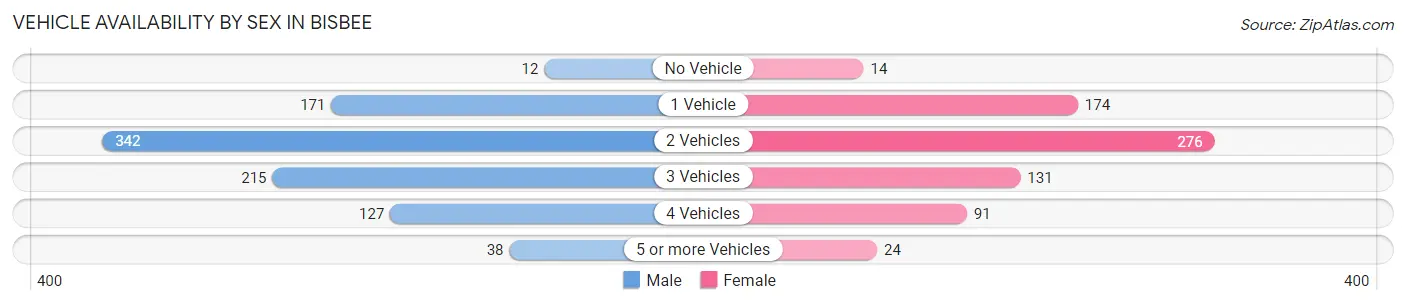
| Vehicles Available | Male | Female |
| No Vehicle | 12 (1.3%) | 14 (2.0%) |
| 1 Vehicle | 171 (18.9%) | 174 (24.5%) |
| 2 Vehicles | 342 (37.8%) | 276 (38.9%) |
| 3 Vehicles | 215 (23.8%) | 131 (18.4%) |
| 4 Vehicles | 127 (14.0%) | 91 (12.8%) |
| 5 or more Vehicles | 38 (4.2%) | 24 (3.4%) |
| Total | 905 (100.0%) | 710 (100.0%) |
Commute Time in Bisbee
The most frequently occuring commute durations in Bisbee are 5 to 9 minutes (483 commuters, 35.1%), 10 to 14 minutes (308 commuters, 22.4%), and 15 to 19 minutes (232 commuters, 16.9%).
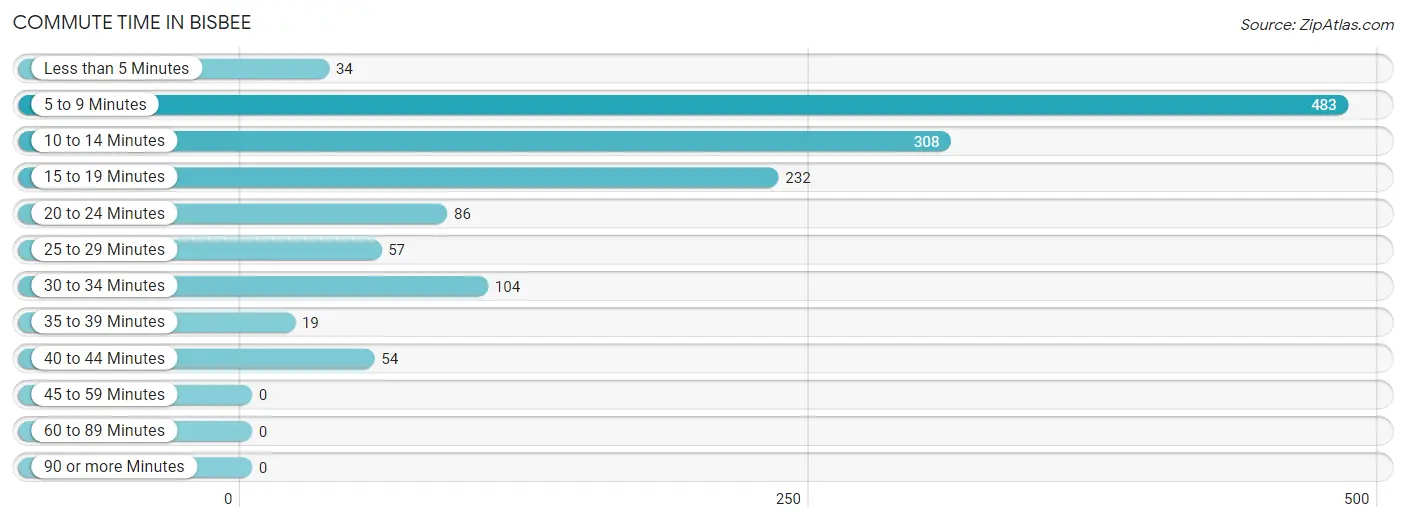
| Commute Time | # Commuters | % Commuters |
| Less than 5 Minutes | 34 | 2.5% |
| 5 to 9 Minutes | 483 | 35.1% |
| 10 to 14 Minutes | 308 | 22.4% |
| 15 to 19 Minutes | 232 | 16.9% |
| 20 to 24 Minutes | 86 | 6.2% |
| 25 to 29 Minutes | 57 | 4.1% |
| 30 to 34 Minutes | 104 | 7.5% |
| 35 to 39 Minutes | 19 | 1.4% |
| 40 to 44 Minutes | 54 | 3.9% |
| 45 to 59 Minutes | 0 | 0.0% |
| 60 to 89 Minutes | 0 | 0.0% |
| 90 or more Minutes | 0 | 0.0% |
Commute Time by Sex in Bisbee
The most common commute times in Bisbee are 5 to 9 minutes (263 commuters, 33.5%) for males and 5 to 9 minutes (220 commuters, 37.2%) for females.
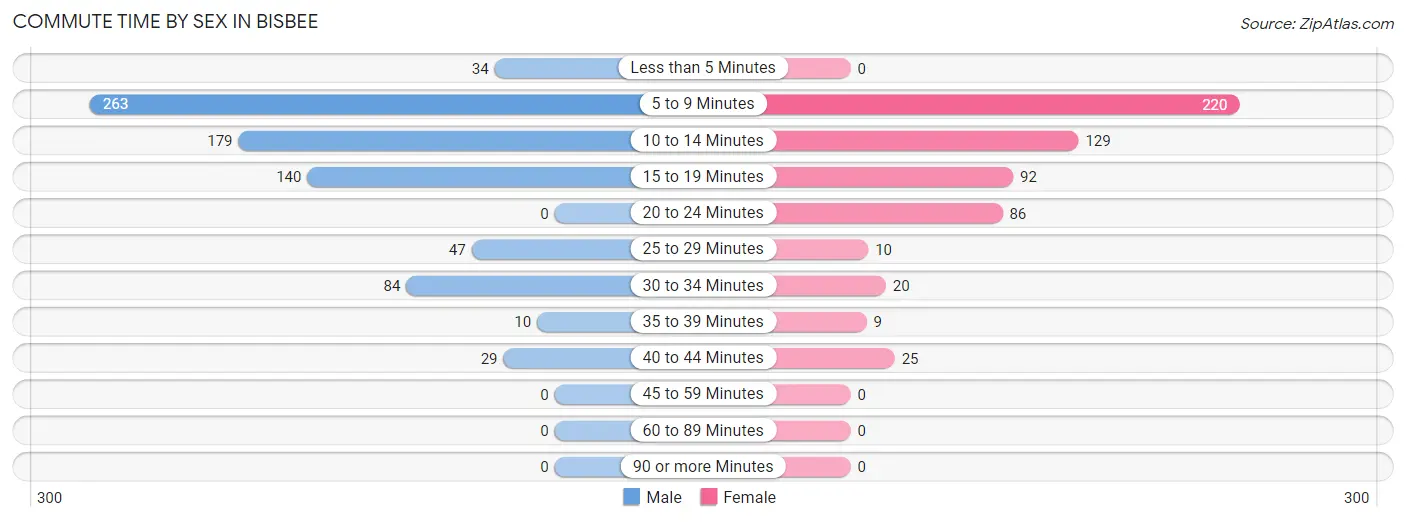
| Commute Time | Male | Female |
| Less than 5 Minutes | 34 (4.3%) | 0 (0.0%) |
| 5 to 9 Minutes | 263 (33.5%) | 220 (37.2%) |
| 10 to 14 Minutes | 179 (22.8%) | 129 (21.8%) |
| 15 to 19 Minutes | 140 (17.8%) | 92 (15.6%) |
| 20 to 24 Minutes | 0 (0.0%) | 86 (14.5%) |
| 25 to 29 Minutes | 47 (6.0%) | 10 (1.7%) |
| 30 to 34 Minutes | 84 (10.7%) | 20 (3.4%) |
| 35 to 39 Minutes | 10 (1.3%) | 9 (1.5%) |
| 40 to 44 Minutes | 29 (3.7%) | 25 (4.2%) |
| 45 to 59 Minutes | 0 (0.0%) | 0 (0.0%) |
| 60 to 89 Minutes | 0 (0.0%) | 0 (0.0%) |
| 90 or more Minutes | 0 (0.0%) | 0 (0.0%) |
Time of Departure to Work by Sex in Bisbee
The most frequent times of departure to work in Bisbee are 8:00 AM to 8:29 AM (191, 24.3%) for males and 9:00 AM to 9:59 AM (103, 17.4%) for females.
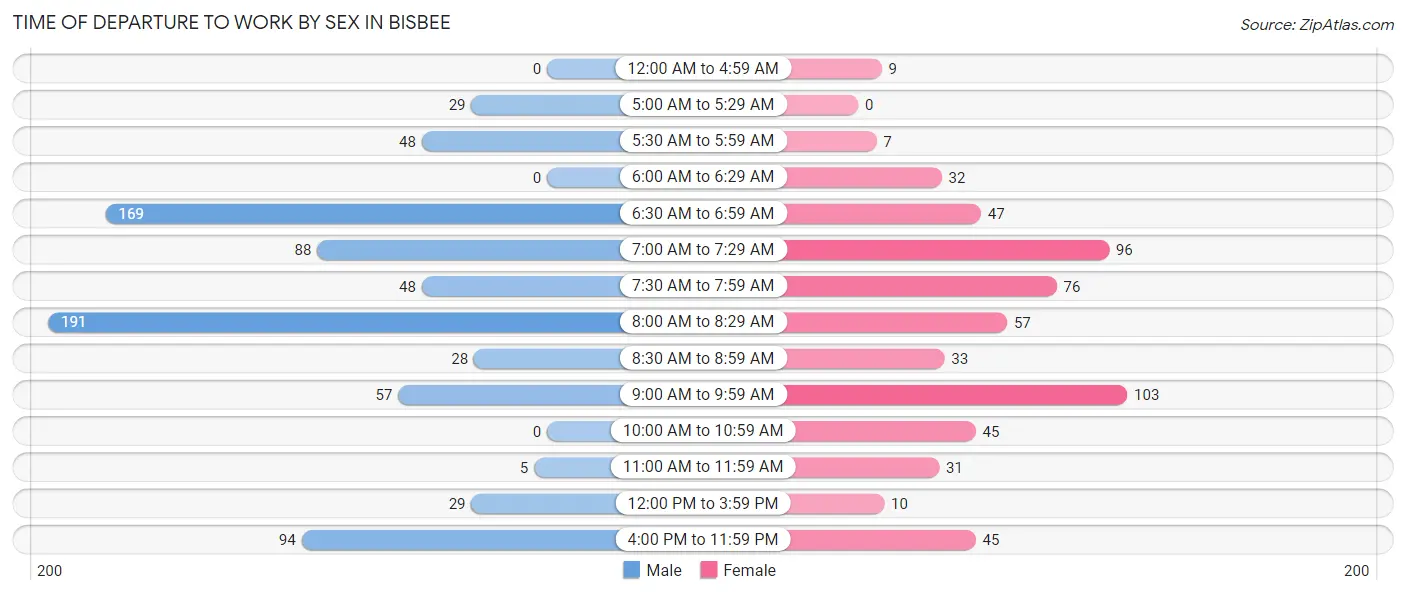
| Time of Departure | Male | Female |
| 12:00 AM to 4:59 AM | 0 (0.0%) | 9 (1.5%) |
| 5:00 AM to 5:29 AM | 29 (3.7%) | 0 (0.0%) |
| 5:30 AM to 5:59 AM | 48 (6.1%) | 7 (1.2%) |
| 6:00 AM to 6:29 AM | 0 (0.0%) | 32 (5.4%) |
| 6:30 AM to 6:59 AM | 169 (21.5%) | 47 (8.0%) |
| 7:00 AM to 7:29 AM | 88 (11.2%) | 96 (16.2%) |
| 7:30 AM to 7:59 AM | 48 (6.1%) | 76 (12.9%) |
| 8:00 AM to 8:29 AM | 191 (24.3%) | 57 (9.6%) |
| 8:30 AM to 8:59 AM | 28 (3.6%) | 33 (5.6%) |
| 9:00 AM to 9:59 AM | 57 (7.2%) | 103 (17.4%) |
| 10:00 AM to 10:59 AM | 0 (0.0%) | 45 (7.6%) |
| 11:00 AM to 11:59 AM | 5 (0.6%) | 31 (5.2%) |
| 12:00 PM to 3:59 PM | 29 (3.7%) | 10 (1.7%) |
| 4:00 PM to 11:59 PM | 94 (12.0%) | 45 (7.6%) |
| Total | 786 (100.0%) | 591 (100.0%) |
Housing Occupancy in Bisbee
Occupancy by Ownership in Bisbee
Of the total 2,602 dwellings in Bisbee, owner-occupied units account for 1,984 (76.2%), while renter-occupied units make up 618 (23.7%).
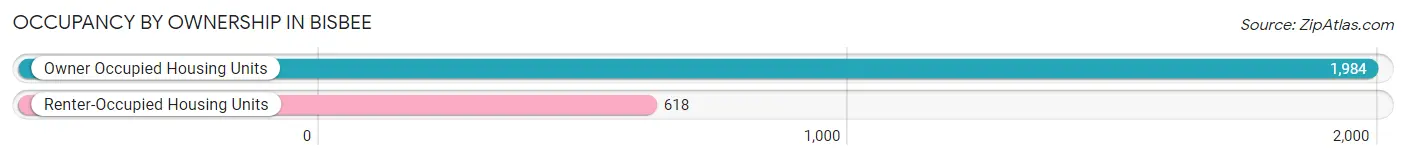
| Occupancy | # Housing Units | % Housing Units |
| Owner Occupied Housing Units | 1,984 | 76.2% |
| Renter-Occupied Housing Units | 618 | 23.7% |
| Total Occupied Housing Units | 2,602 | 100.0% |
Occupancy by Household Size in Bisbee
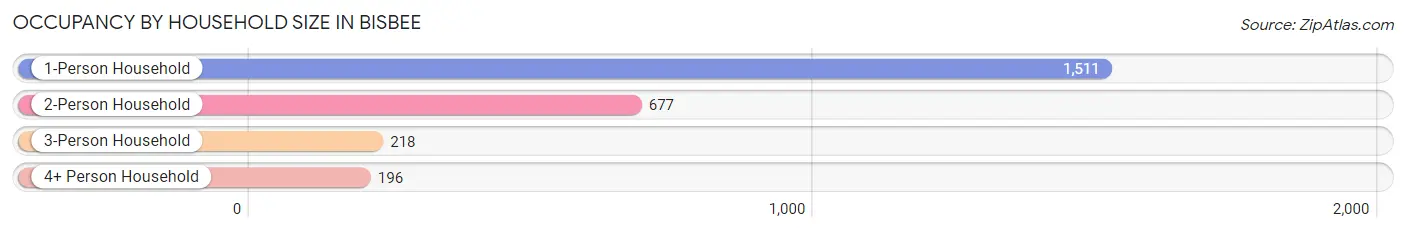
| Household Size | # Housing Units | % Housing Units |
| 1-Person Household | 1,511 | 58.1% |
| 2-Person Household | 677 | 26.0% |
| 3-Person Household | 218 | 8.4% |
| 4+ Person Household | 196 | 7.5% |
| Total Housing Units | 2,602 | 100.0% |
Occupancy by Ownership by Household Size in Bisbee
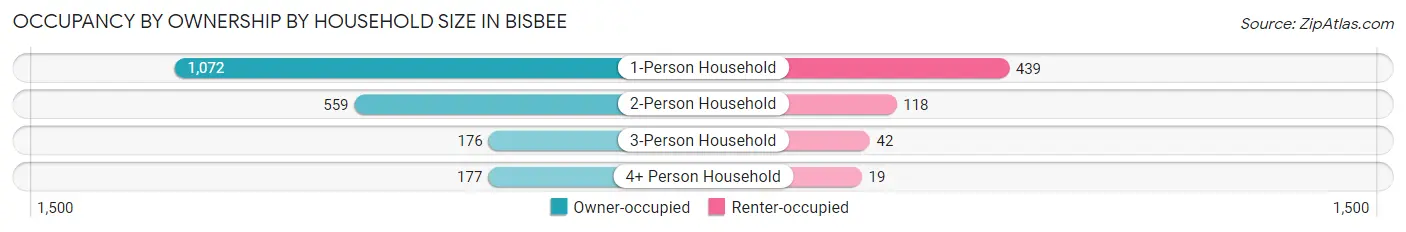
| Household Size | Owner-occupied | Renter-occupied |
| 1-Person Household | 1,072 (71.0%) | 439 (29.0%) |
| 2-Person Household | 559 (82.6%) | 118 (17.4%) |
| 3-Person Household | 176 (80.7%) | 42 (19.3%) |
| 4+ Person Household | 177 (90.3%) | 19 (9.7%) |
| Total Housing Units | 1,984 (76.2%) | 618 (23.7%) |
Occupancy by Educational Attainment in Bisbee
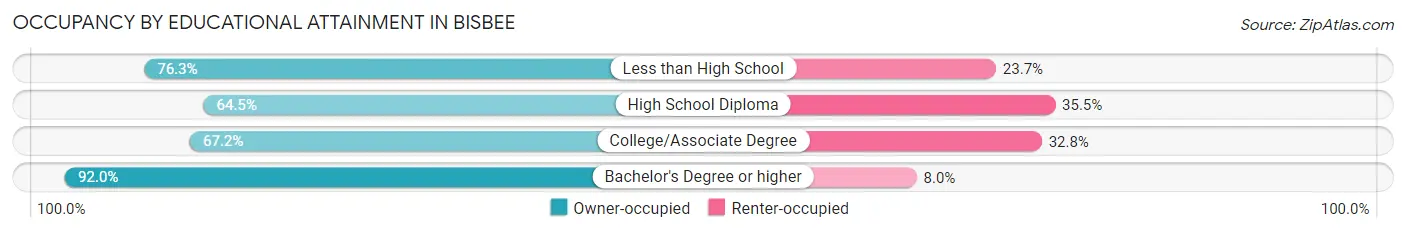
| Household Size | Owner-occupied | Renter-occupied |
| Less than High School | 167 (76.3%) | 52 (23.7%) |
| High School Diploma | 240 (64.5%) | 132 (35.5%) |
| College/Associate Degree | 739 (67.2%) | 361 (32.8%) |
| Bachelor's Degree or higher | 838 (92.0%) | 73 (8.0%) |
Occupancy by Age of Householder in Bisbee
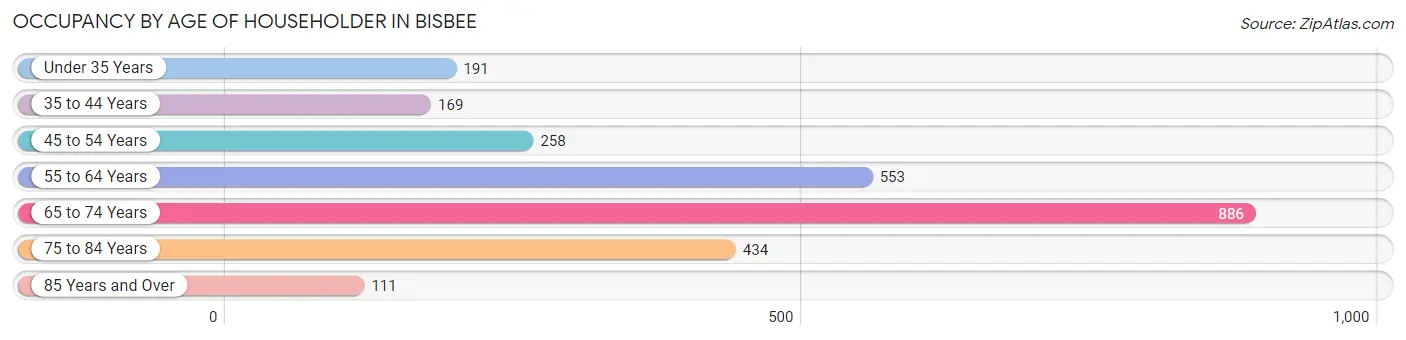
| Age Bracket | # Households | % Households |
| Under 35 Years | 191 | 7.3% |
| 35 to 44 Years | 169 | 6.5% |
| 45 to 54 Years | 258 | 9.9% |
| 55 to 64 Years | 553 | 21.2% |
| 65 to 74 Years | 886 | 34.1% |
| 75 to 84 Years | 434 | 16.7% |
| 85 Years and Over | 111 | 4.3% |
| Total | 2,602 | 100.0% |
Housing Finances in Bisbee
Median Income by Occupancy in Bisbee
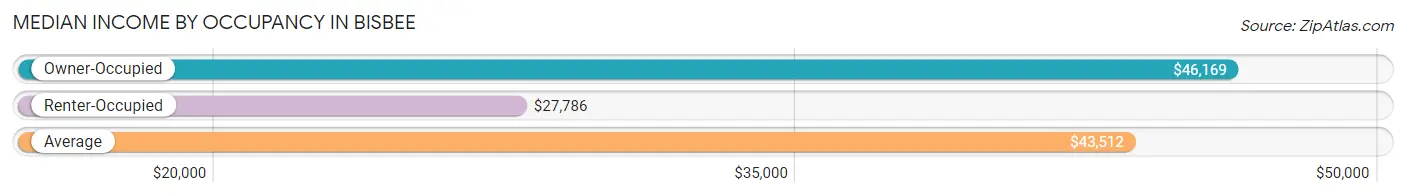
| Occupancy Type | # Households | Median Income |
| Owner-Occupied | 1,984 (76.2%) | $46,169 |
| Renter-Occupied | 618 (23.7%) | $27,786 |
| Average | 2,602 (100.0%) | $43,512 |
Occupancy by Householder Income Bracket in Bisbee
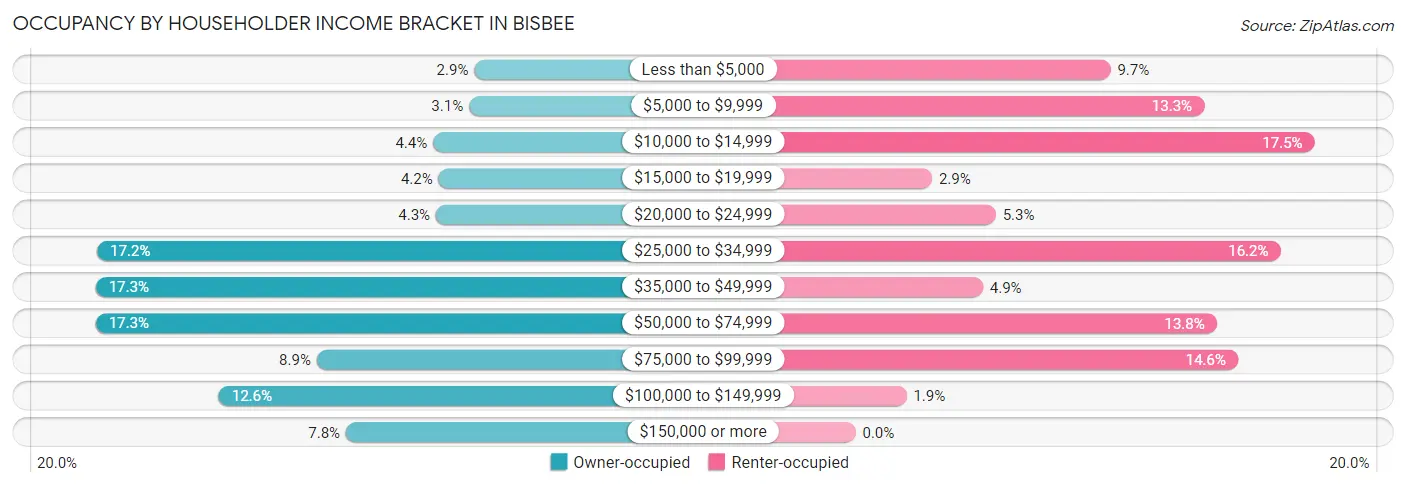
| Income Bracket | Owner-occupied | Renter-occupied |
| Less than $5,000 | 57 (2.9%) | 60 (9.7%) |
| $5,000 to $9,999 | 61 (3.1%) | 82 (13.3%) |
| $10,000 to $14,999 | 88 (4.4%) | 108 (17.5%) |
| $15,000 to $19,999 | 84 (4.2%) | 18 (2.9%) |
| $20,000 to $24,999 | 86 (4.3%) | 33 (5.3%) |
| $25,000 to $34,999 | 342 (17.2%) | 100 (16.2%) |
| $35,000 to $49,999 | 343 (17.3%) | 30 (4.9%) |
| $50,000 to $74,999 | 343 (17.3%) | 85 (13.8%) |
| $75,000 to $99,999 | 176 (8.9%) | 90 (14.6%) |
| $100,000 to $149,999 | 250 (12.6%) | 12 (1.9%) |
| $150,000 or more | 154 (7.8%) | 0 (0.0%) |
| Total | 1,984 (100.0%) | 618 (100.0%) |
Monthly Housing Cost Tiers in Bisbee
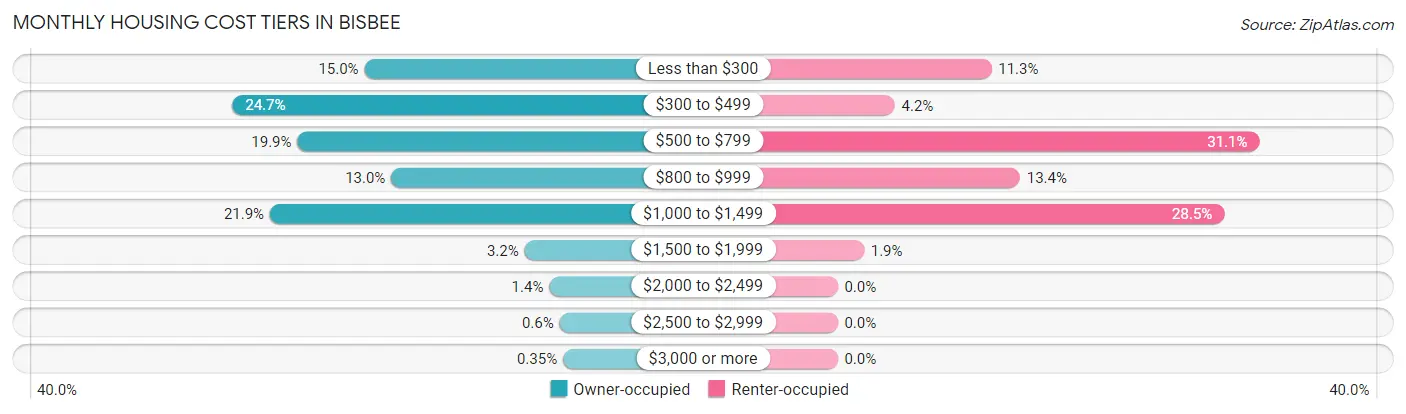
| Monthly Cost | Owner-occupied | Renter-occupied |
| Less than $300 | 297 (15.0%) | 70 (11.3%) |
| $300 to $499 | 490 (24.7%) | 26 (4.2%) |
| $500 to $799 | 395 (19.9%) | 192 (31.1%) |
| $800 to $999 | 258 (13.0%) | 83 (13.4%) |
| $1,000 to $1,499 | 435 (21.9%) | 176 (28.5%) |
| $1,500 to $1,999 | 63 (3.2%) | 12 (1.9%) |
| $2,000 to $2,499 | 27 (1.4%) | 0 (0.0%) |
| $2,500 to $2,999 | 12 (0.6%) | 0 (0.0%) |
| $3,000 or more | 7 (0.4%) | 0 (0.0%) |
| Total | 1,984 (100.0%) | 618 (100.0%) |
Physical Housing Characteristics in Bisbee
Housing Structures in Bisbee
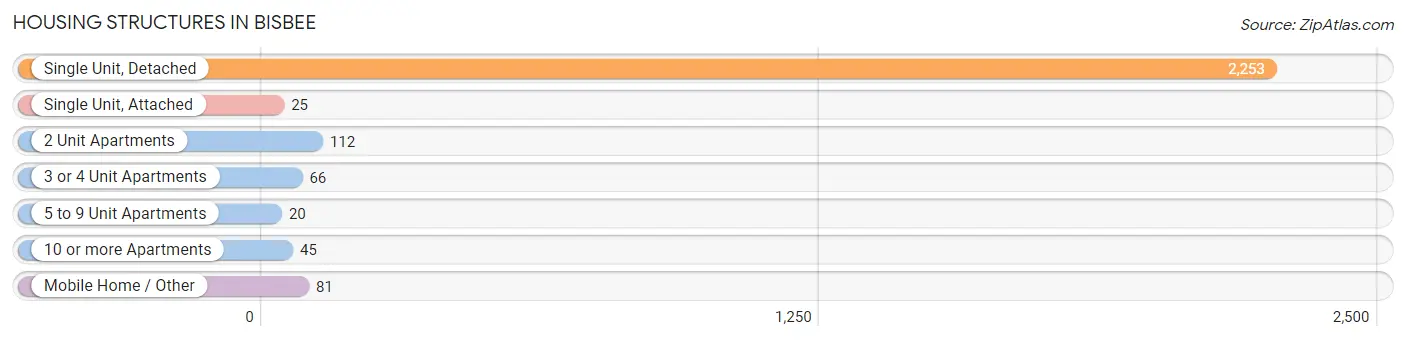
| Structure Type | # Housing Units | % Housing Units |
| Single Unit, Detached | 2,253 | 86.6% |
| Single Unit, Attached | 25 | 1.0% |
| 2 Unit Apartments | 112 | 4.3% |
| 3 or 4 Unit Apartments | 66 | 2.5% |
| 5 to 9 Unit Apartments | 20 | 0.8% |
| 10 or more Apartments | 45 | 1.7% |
| Mobile Home / Other | 81 | 3.1% |
| Total | 2,602 | 100.0% |
Housing Structures by Occupancy in Bisbee
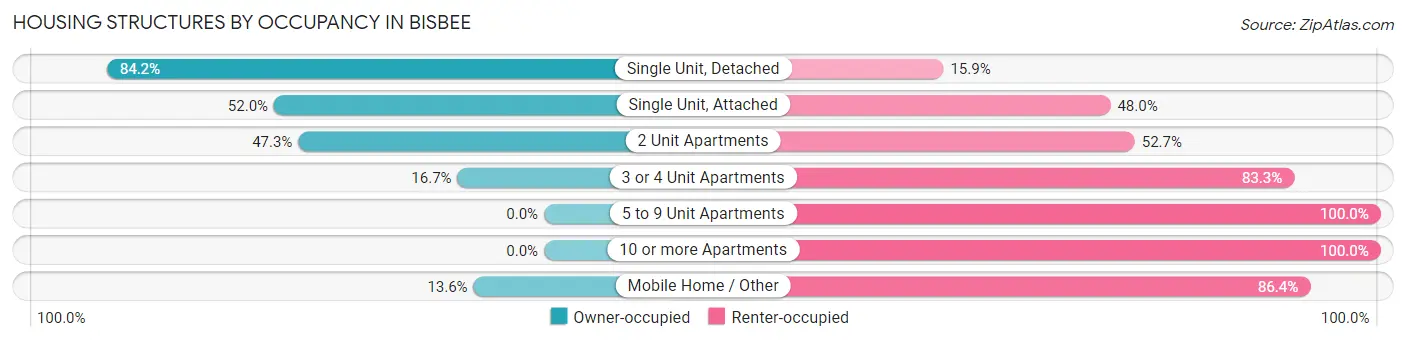
| Structure Type | Owner-occupied | Renter-occupied |
| Single Unit, Detached | 1,896 (84.2%) | 357 (15.9%) |
| Single Unit, Attached | 13 (52.0%) | 12 (48.0%) |
| 2 Unit Apartments | 53 (47.3%) | 59 (52.7%) |
| 3 or 4 Unit Apartments | 11 (16.7%) | 55 (83.3%) |
| 5 to 9 Unit Apartments | 0 (0.0%) | 20 (100.0%) |
| 10 or more Apartments | 0 (0.0%) | 45 (100.0%) |
| Mobile Home / Other | 11 (13.6%) | 70 (86.4%) |
| Total | 1,984 (76.2%) | 618 (23.7%) |
Housing Structures by Number of Rooms in Bisbee
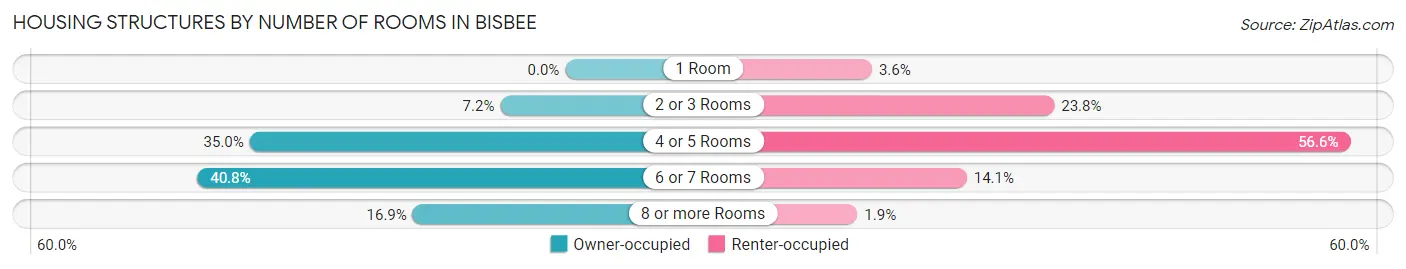
| Number of Rooms | Owner-occupied | Renter-occupied |
| 1 Room | 0 (0.0%) | 22 (3.6%) |
| 2 or 3 Rooms | 143 (7.2%) | 147 (23.8%) |
| 4 or 5 Rooms | 695 (35.0%) | 350 (56.6%) |
| 6 or 7 Rooms | 810 (40.8%) | 87 (14.1%) |
| 8 or more Rooms | 336 (16.9%) | 12 (1.9%) |
| Total | 1,984 (100.0%) | 618 (100.0%) |
Housing Structure by Heating Type in Bisbee
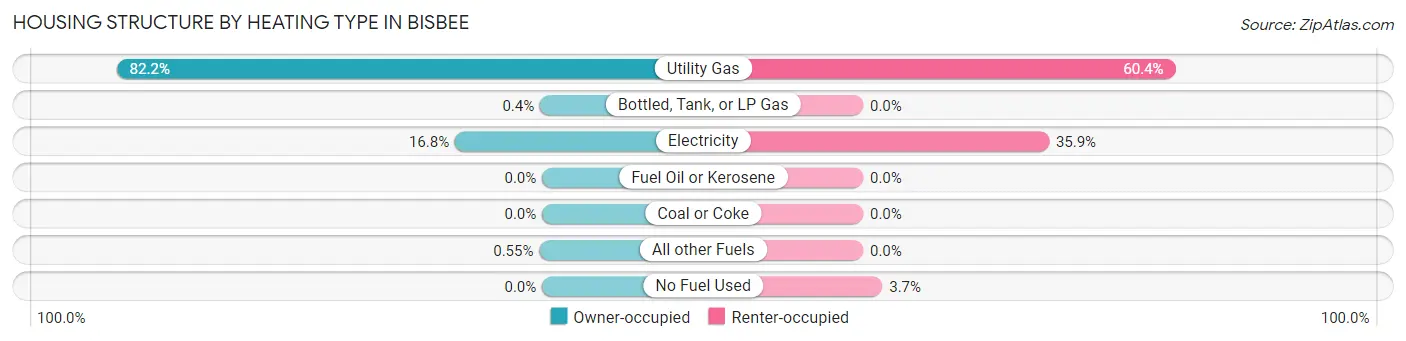
| Heating Type | Owner-occupied | Renter-occupied |
| Utility Gas | 1,631 (82.2%) | 373 (60.4%) |
| Bottled, Tank, or LP Gas | 8 (0.4%) | 0 (0.0%) |
| Electricity | 334 (16.8%) | 222 (35.9%) |
| Fuel Oil or Kerosene | 0 (0.0%) | 0 (0.0%) |
| Coal or Coke | 0 (0.0%) | 0 (0.0%) |
| All other Fuels | 11 (0.5%) | 0 (0.0%) |
| No Fuel Used | 0 (0.0%) | 23 (3.7%) |
| Total | 1,984 (100.0%) | 618 (100.0%) |
Household Vehicle Usage in Bisbee
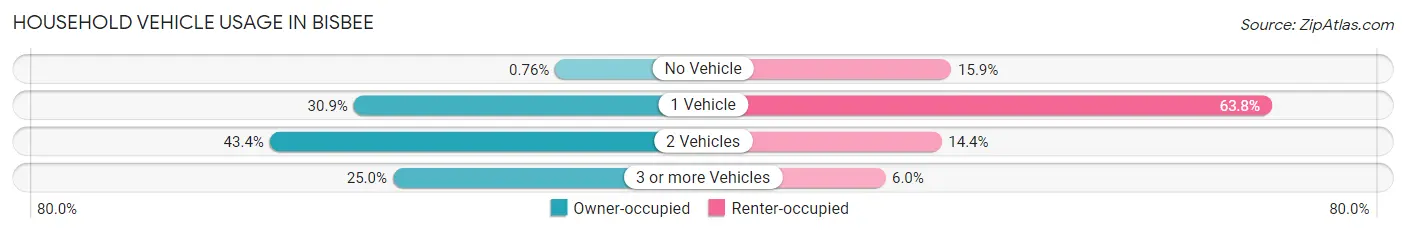
| Vehicles per Household | Owner-occupied | Renter-occupied |
| No Vehicle | 15 (0.8%) | 98 (15.9%) |
| 1 Vehicle | 612 (30.8%) | 394 (63.7%) |
| 2 Vehicles | 861 (43.4%) | 89 (14.4%) |
| 3 or more Vehicles | 496 (25.0%) | 37 (6.0%) |
| Total | 1,984 (100.0%) | 618 (100.0%) |
Real Estate & Mortgages in Bisbee
Real Estate and Mortgage Overview in Bisbee
| Characteristic | Without Mortgage | With Mortgage |
| Housing Units | 987 | 997 |
| Median Property Value | $208,000 | $190,500 |
| Median Household Income | $44,431 | $66 |
| Monthly Housing Costs | $402 | $7 |
| Real Estate Taxes | $1,274 | $19 |
Property Value by Mortgage Status in Bisbee
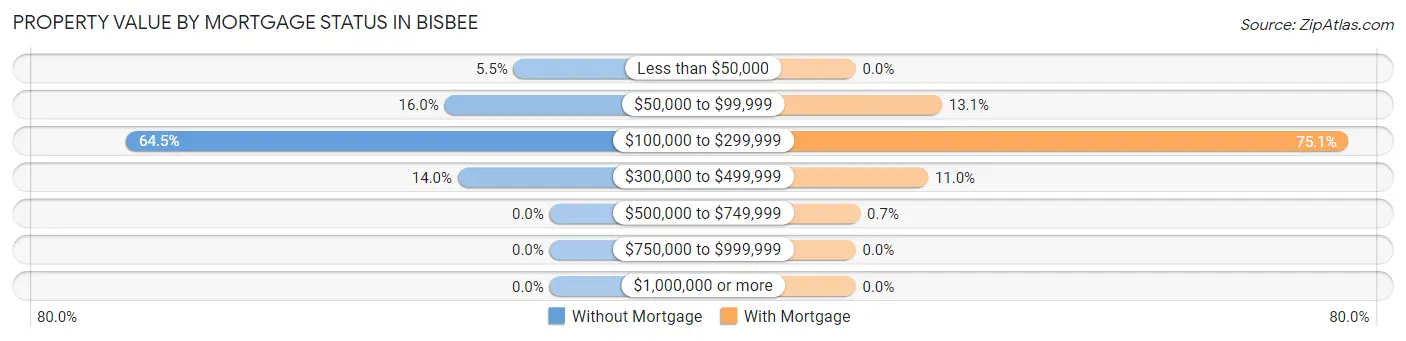
| Property Value | Without Mortgage | With Mortgage |
| Less than $50,000 | 54 (5.5%) | 0 (0.0%) |
| $50,000 to $99,999 | 158 (16.0%) | 131 (13.1%) |
| $100,000 to $299,999 | 637 (64.5%) | 749 (75.1%) |
| $300,000 to $499,999 | 138 (14.0%) | 110 (11.0%) |
| $500,000 to $749,999 | 0 (0.0%) | 7 (0.7%) |
| $750,000 to $999,999 | 0 (0.0%) | 0 (0.0%) |
| $1,000,000 or more | 0 (0.0%) | 0 (0.0%) |
| Total | 987 (100.0%) | 997 (100.0%) |
Household Income by Mortgage Status in Bisbee
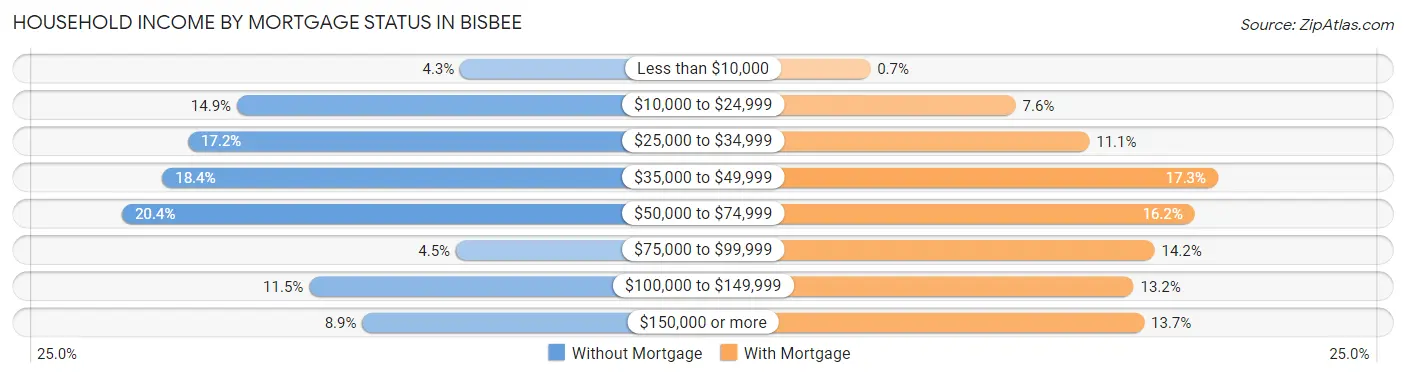
| Household Income | Without Mortgage | With Mortgage |
| Less than $10,000 | 42 (4.3%) | 7 (0.7%) |
| $10,000 to $24,999 | 147 (14.9%) | 76 (7.6%) |
| $25,000 to $34,999 | 170 (17.2%) | 111 (11.1%) |
| $35,000 to $49,999 | 182 (18.4%) | 172 (17.2%) |
| $50,000 to $74,999 | 201 (20.4%) | 161 (16.2%) |
| $75,000 to $99,999 | 44 (4.5%) | 142 (14.2%) |
| $100,000 to $149,999 | 113 (11.5%) | 132 (13.2%) |
| $150,000 or more | 88 (8.9%) | 137 (13.7%) |
| Total | 987 (100.0%) | 997 (100.0%) |
Property Value to Household Income Ratio in Bisbee
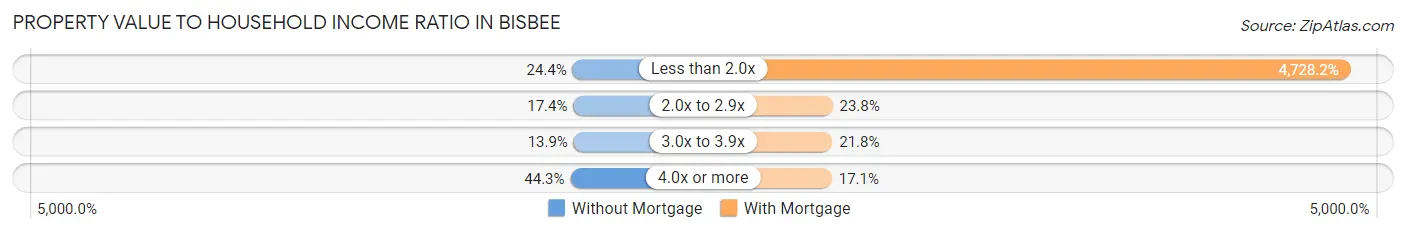
| Value-to-Income Ratio | Without Mortgage | With Mortgage |
| Less than 2.0x | 241 (24.4%) | 47,140 (4,728.2%) |
| 2.0x to 2.9x | 172 (17.4%) | 237 (23.8%) |
| 3.0x to 3.9x | 137 (13.9%) | 217 (21.8%) |
| 4.0x or more | 437 (44.3%) | 170 (17.1%) |
| Total | 987 (100.0%) | 997 (100.0%) |
Real Estate Taxes by Mortgage Status in Bisbee
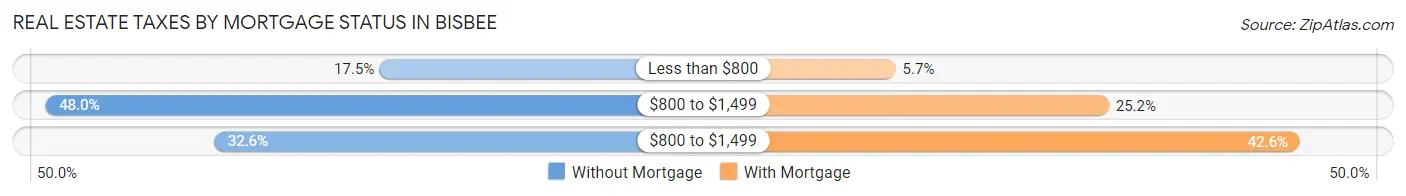
| Property Taxes | Without Mortgage | With Mortgage |
| Less than $800 | 173 (17.5%) | 57 (5.7%) |
| $800 to $1,499 | 474 (48.0%) | 251 (25.2%) |
| $800 to $1,499 | 322 (32.6%) | 425 (42.6%) |
| Total | 987 (100.0%) | 997 (100.0%) |
Health & Disability in Bisbee
Health Insurance Coverage by Age in Bisbee
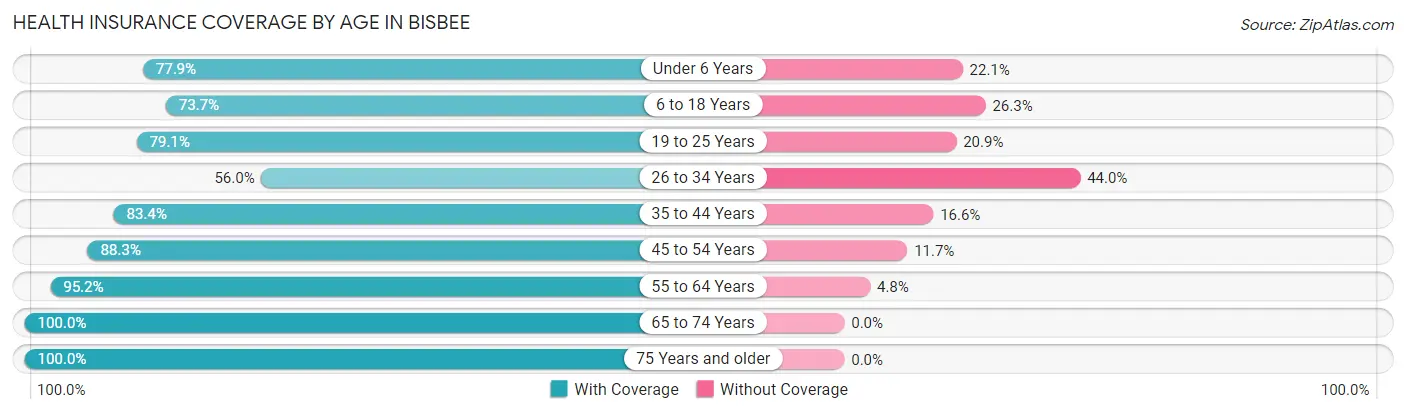
| Age Bracket | With Coverage | Without Coverage |
| Under 6 Years | 53 (77.9%) | 15 (22.1%) |
| 6 to 18 Years | 347 (73.7%) | 124 (26.3%) |
| 19 to 25 Years | 163 (79.1%) | 43 (20.9%) |
| 26 to 34 Years | 163 (56.0%) | 128 (44.0%) |
| 35 to 44 Years | 322 (83.4%) | 64 (16.6%) |
| 45 to 54 Years | 504 (88.3%) | 67 (11.7%) |
| 55 to 64 Years | 794 (95.2%) | 40 (4.8%) |
| 65 to 74 Years | 1,226 (100.0%) | 0 (0.0%) |
| 75 Years and older | 641 (100.0%) | 0 (0.0%) |
| Total | 4,213 (89.7%) | 481 (10.2%) |
Health Insurance Coverage by Citizenship Status in Bisbee
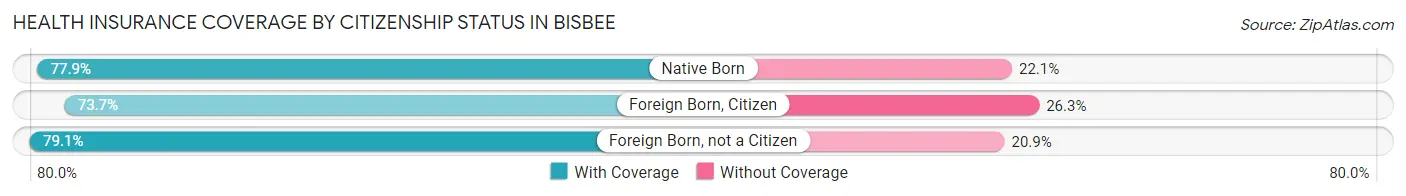
| Citizenship Status | With Coverage | Without Coverage |
| Native Born | 53 (77.9%) | 15 (22.1%) |
| Foreign Born, Citizen | 347 (73.7%) | 124 (26.3%) |
| Foreign Born, not a Citizen | 163 (79.1%) | 43 (20.9%) |
Health Insurance Coverage by Household Income in Bisbee
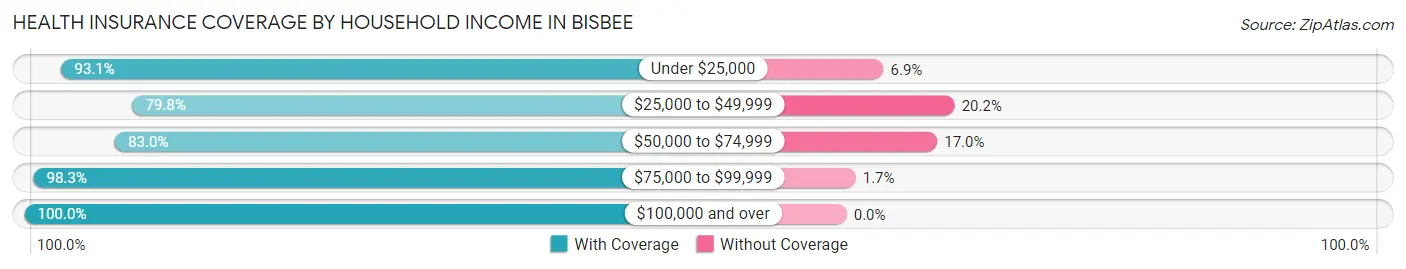
| Household Income | With Coverage | Without Coverage |
| Under $25,000 | 836 (93.1%) | 62 (6.9%) |
| $25,000 to $49,999 | 1,097 (79.8%) | 278 (20.2%) |
| $50,000 to $74,999 | 651 (83.0%) | 133 (17.0%) |
| $75,000 to $99,999 | 467 (98.3%) | 8 (1.7%) |
| $100,000 and over | 1,111 (100.0%) | 0 (0.0%) |
Public vs Private Health Insurance Coverage by Age in Bisbee
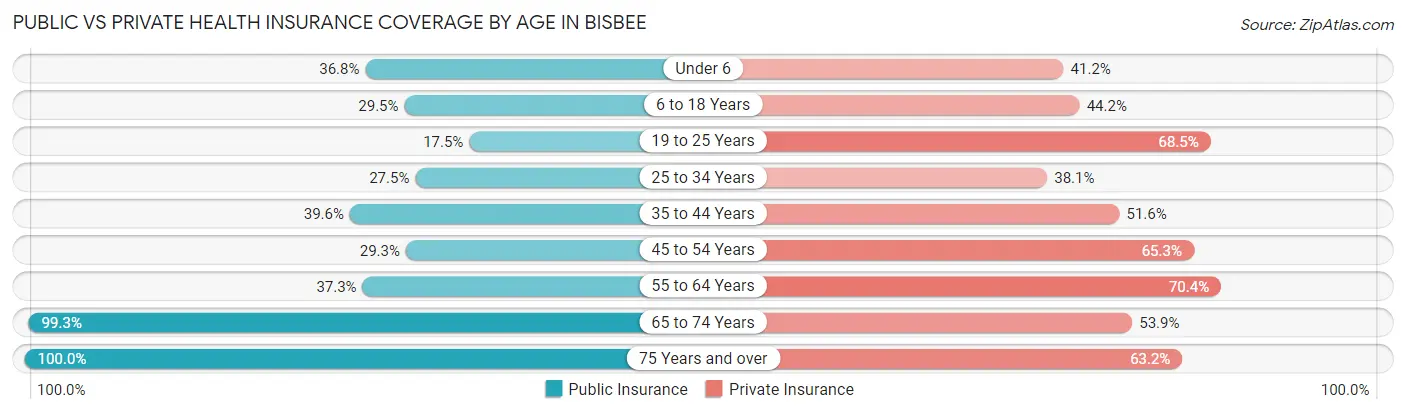
| Age Bracket | Public Insurance | Private Insurance |
| Under 6 | 25 (36.8%) | 28 (41.2%) |
| 6 to 18 Years | 139 (29.5%) | 208 (44.2%) |
| 19 to 25 Years | 36 (17.5%) | 141 (68.4%) |
| 25 to 34 Years | 80 (27.5%) | 111 (38.1%) |
| 35 to 44 Years | 153 (39.6%) | 199 (51.5%) |
| 45 to 54 Years | 167 (29.2%) | 373 (65.3%) |
| 55 to 64 Years | 311 (37.3%) | 587 (70.4%) |
| 65 to 74 Years | 1,217 (99.3%) | 661 (53.9%) |
| 75 Years and over | 641 (100.0%) | 405 (63.2%) |
| Total | 2,769 (59.0%) | 2,713 (57.8%) |
Disability Status by Sex by Age in Bisbee
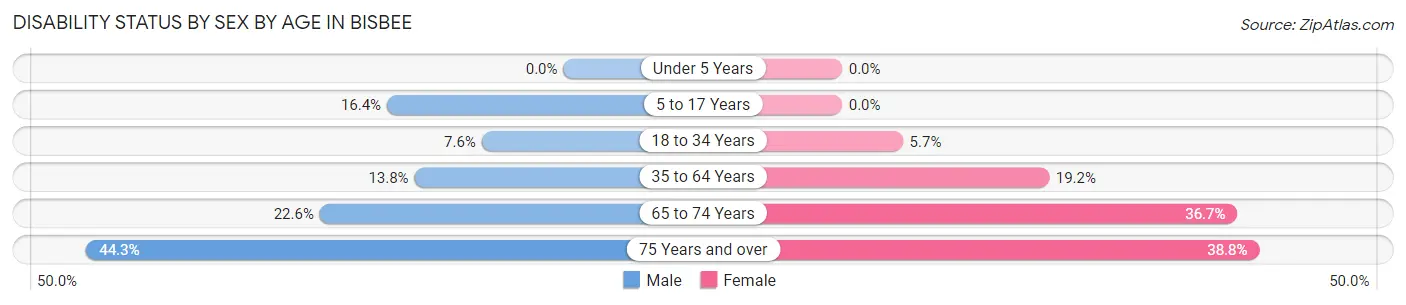
| Age Bracket | Male | Female |
| Under 5 Years | 0 (0.0%) | 0 (0.0%) |
| 5 to 17 Years | 28 (16.4%) | 0 (0.0%) |
| 18 to 34 Years | 21 (7.6%) | 14 (5.7%) |
| 35 to 64 Years | 118 (13.8%) | 180 (19.2%) |
| 65 to 74 Years | 154 (22.6%) | 200 (36.7%) |
| 75 Years and over | 85 (44.3%) | 174 (38.8%) |
Disability Class by Sex by Age in Bisbee
Disability Class: Hearing Difficulty
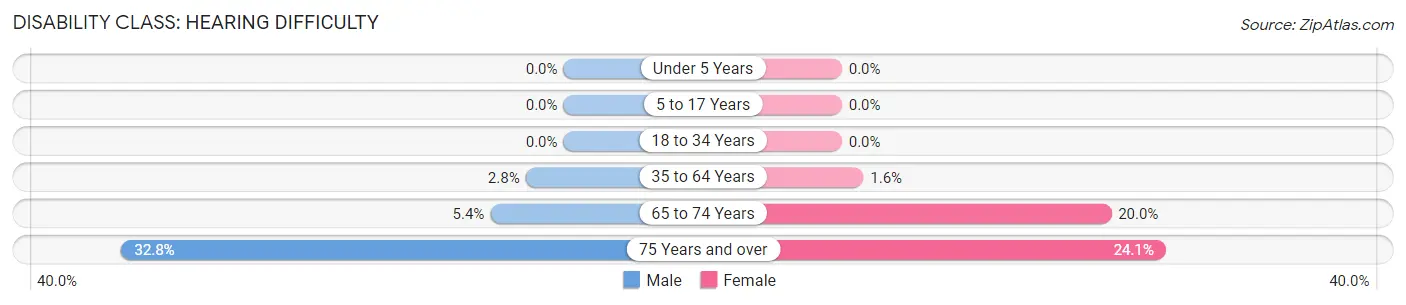
| Age Bracket | Male | Female |
| Under 5 Years | 0 (0.0%) | 0 (0.0%) |
| 5 to 17 Years | 0 (0.0%) | 0 (0.0%) |
| 18 to 34 Years | 0 (0.0%) | 0 (0.0%) |
| 35 to 64 Years | 24 (2.8%) | 15 (1.6%) |
| 65 to 74 Years | 37 (5.4%) | 109 (20.0%) |
| 75 Years and over | 63 (32.8%) | 108 (24.0%) |
Disability Class: Vision Difficulty
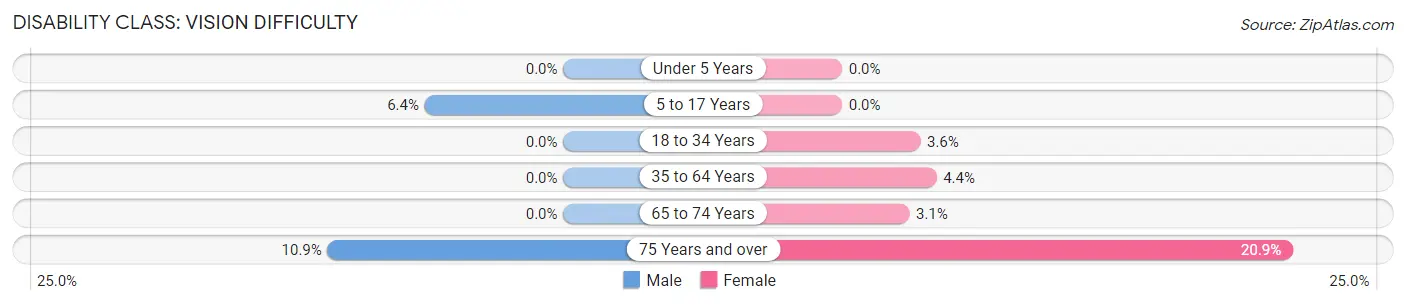
| Age Bracket | Male | Female |
| Under 5 Years | 0 (0.0%) | 0 (0.0%) |
| 5 to 17 Years | 11 (6.4%) | 0 (0.0%) |
| 18 to 34 Years | 0 (0.0%) | 9 (3.6%) |
| 35 to 64 Years | 0 (0.0%) | 41 (4.4%) |
| 65 to 74 Years | 0 (0.0%) | 17 (3.1%) |
| 75 Years and over | 21 (10.9%) | 94 (20.9%) |
Disability Class: Cognitive Difficulty
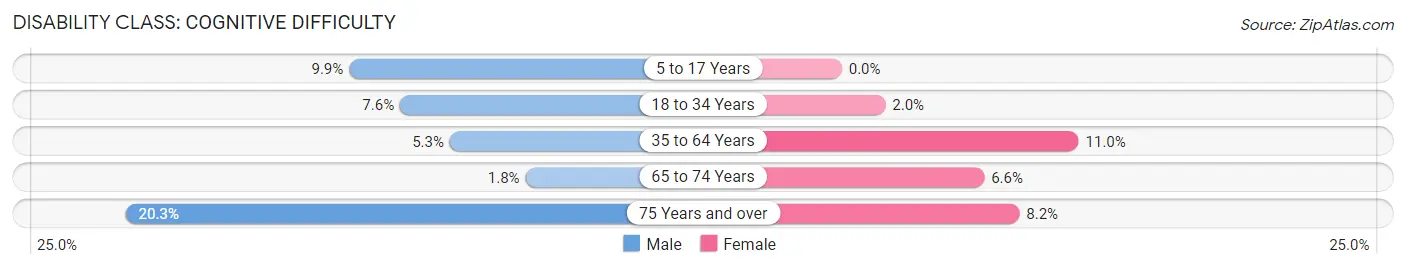
| Age Bracket | Male | Female |
| 5 to 17 Years | 17 (9.9%) | 0 (0.0%) |
| 18 to 34 Years | 21 (7.6%) | 5 (2.0%) |
| 35 to 64 Years | 45 (5.3%) | 103 (11.0%) |
| 65 to 74 Years | 12 (1.8%) | 36 (6.6%) |
| 75 Years and over | 39 (20.3%) | 37 (8.2%) |
Disability Class: Ambulatory Difficulty
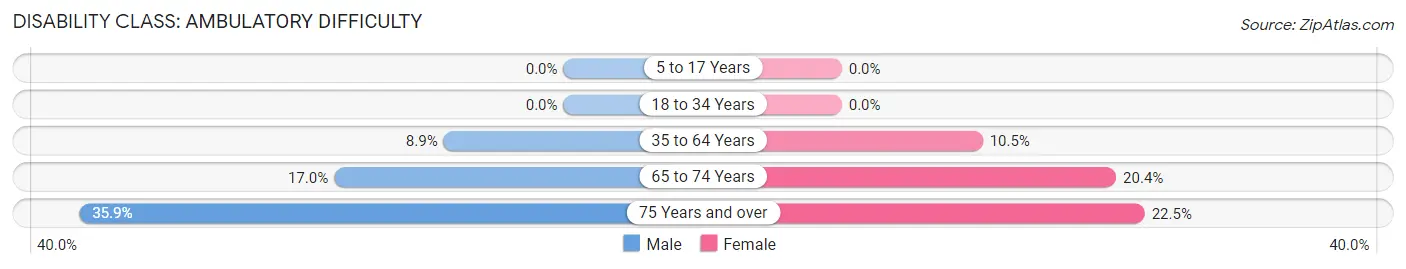
| Age Bracket | Male | Female |
| 5 to 17 Years | 0 (0.0%) | 0 (0.0%) |
| 18 to 34 Years | 0 (0.0%) | 0 (0.0%) |
| 35 to 64 Years | 76 (8.9%) | 98 (10.5%) |
| 65 to 74 Years | 116 (17.0%) | 111 (20.4%) |
| 75 Years and over | 69 (35.9%) | 101 (22.5%) |
Disability Class: Self-Care Difficulty
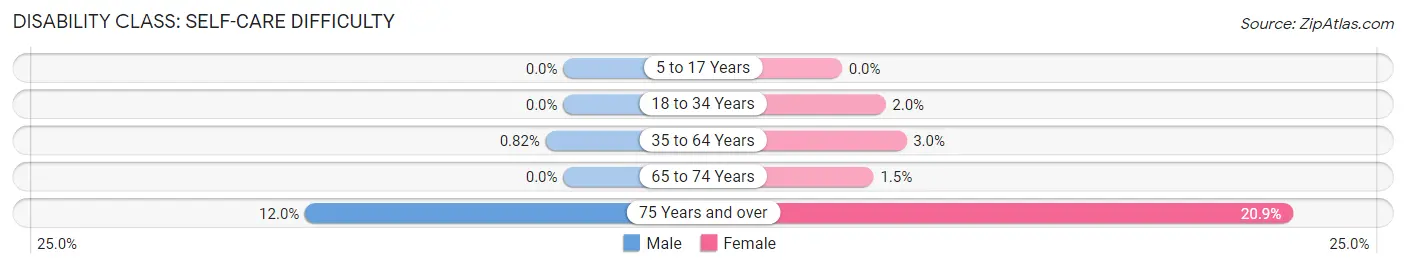
| Age Bracket | Male | Female |
| 5 to 17 Years | 0 (0.0%) | 0 (0.0%) |
| 18 to 34 Years | 0 (0.0%) | 5 (2.0%) |
| 35 to 64 Years | 7 (0.8%) | 28 (3.0%) |
| 65 to 74 Years | 0 (0.0%) | 8 (1.5%) |
| 75 Years and over | 23 (12.0%) | 94 (20.9%) |
Technology Access in Bisbee
Computing Device Access in Bisbee
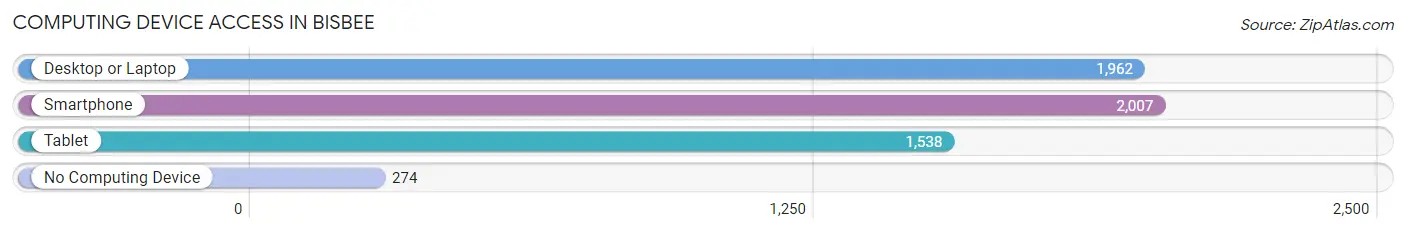
| Device Type | # Households | % Households |
| Desktop or Laptop | 1,962 | 75.4% |
| Smartphone | 2,007 | 77.1% |
| Tablet | 1,538 | 59.1% |
| No Computing Device | 274 | 10.5% |
| Total | 2,602 | 100.0% |
Internet Access in Bisbee
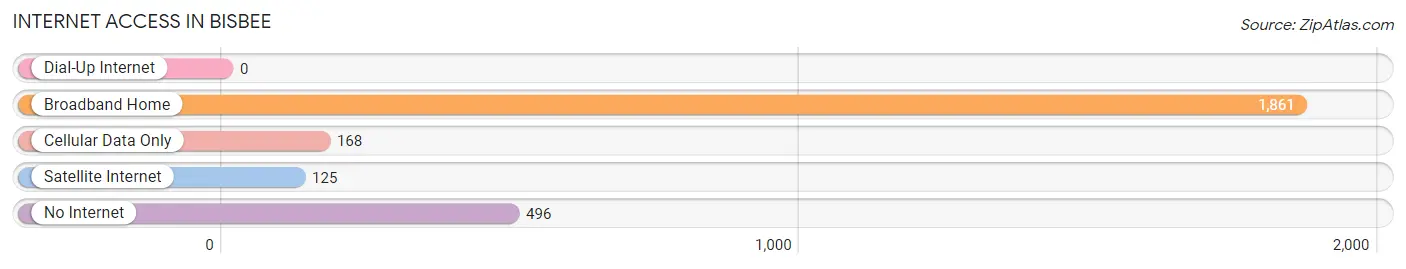
| Internet Type | # Households | % Households |
| Dial-Up Internet | 0 | 0.0% |
| Broadband Home | 1,861 | 71.5% |
| Cellular Data Only | 168 | 6.5% |
| Satellite Internet | 125 | 4.8% |
| No Internet | 496 | 19.1% |
| Total | 2,602 | 100.0% |
Bisbee Summary
Bisbee, Arizona is a small city located in the southeastern corner of the state, in Cochise County. It is situated in the Mule Mountains, and is surrounded by the Coronado National Forest. Bisbee is known for its rich history, unique geography, and vibrant economy.
History
Bisbee was founded in 1880 as a mining town, and was named after Judge DeWitt Bisbee, who was a financial backer of the Copper Queen Mine. The town quickly grew to become the largest city between St. Louis and San Francisco, and was the largest city in Arizona until the 1920s. Bisbee was known for its copper, gold, and silver mining, and was home to the largest open-pit copper mine in the world. The town was also home to a vibrant arts and culture scene, and was known for its saloons, gambling halls, and brothels.
In the 1950s, the copper industry began to decline, and the town’s population began to dwindle. In the 1970s, the town was revitalized by an influx of artists and hippies, and the town began to focus on tourism. Today, Bisbee is a popular tourist destination, and is known for its historic buildings, art galleries, and unique shops.
Geography
Bisbee is located in the Mule Mountains, which are part of the Coronado National Forest. The town is situated at an elevation of 5,000 feet, and is surrounded by mountains and canyons. The town is located in a semi-arid climate, and receives an average of 12 inches of precipitation per year. The town is located near the San Pedro River, which is a popular destination for fishing and camping.
Economy
Bisbee’s economy is largely based on tourism, and the town is home to a variety of shops, restaurants, and galleries. The town is also home to a number of historic buildings, including the Copper Queen Hotel, which is listed on the National Register of Historic Places. The town is also home to a number of festivals and events, including the Bisbee Blues Festival and the Bisbee 1000 Stair Climb.
Demographics
As of the 2010 census, Bisbee had a population of 5,575. The town is predominantly white, with a small Hispanic population. The median household income is $35,000, and the median home value is $150,000. The town has a high rate of poverty, with nearly 25% of the population living below the poverty line.
Bisbee is a unique and vibrant city, with a rich history, unique geography, and vibrant economy. The town is home to a variety of shops, restaurants, and galleries, and is a popular destination for tourists. The town is also home to a number of historic buildings, and is known for its festivals and events. Bisbee is a great place to visit, and is a great place to call home.
Common Questions
What is Per Capita Income in Bisbee?
Per Capita income in Bisbee is $31,643.
What is the Median Family Income in Bisbee?
Median Family Income in Bisbee is $70,357.
What is the Median Household income in Bisbee?
Median Household Income in Bisbee is $43,512.
What is Income or Wage Gap in Bisbee?
Income or Wage Gap in Bisbee is 29.4%.
Women in Bisbee earn 70.6 cents for every dollar earned by a man.
What is Inequality or Gini Index in Bisbee?
Inequality or Gini Index in Bisbee is 0.44.
What is the Total Population of Bisbee?
Total Population of Bisbee is 4,972.
What is the Total Male Population of Bisbee?
Total Male Population of Bisbee is 2,472.
What is the Total Female Population of Bisbee?
Total Female Population of Bisbee is 2,500.
What is the Ratio of Males per 100 Females in Bisbee?
There are 98.88 Males per 100 Females in Bisbee.
What is the Ratio of Females per 100 Males in Bisbee?
There are 101.13 Females per 100 Males in Bisbee.
What is the Median Population Age in Bisbee?
Median Population Age in Bisbee is 60.0 Years.
What is the Average Family Size in Bisbee
Average Family Size in Bisbee is 2.9 People.
What is the Average Household Size in Bisbee
Average Household Size in Bisbee is 1.8 People.
How Large is the Labor Force in Bisbee?
There are 1,735 People in the Labor Forcein in Bisbee.
What is the Percentage of People in the Labor Force in Bisbee?
38.7% of People are in the Labor Force in Bisbee.
What is the Unemployment Rate in Bisbee?
Unemployment Rate in Bisbee is 4.3%.