Bowie, AZ Map & Demographics
Bowie Map
Bowie Overview
$19,024
PER CAPITA INCOME
$48,750
AVG FAMILY INCOME
$47,778
AVG HOUSEHOLD INCOME
0.45
INEQUALITY / GINI INDEX
438
TOTAL POPULATION
210
MALE POPULATION
228
FEMALE POPULATION
92.11
MALES / 100 FEMALES
108.57
FEMALES / 100 MALES
43.5
MEDIAN AGE
3.5
AVG FAMILY SIZE
3.0
AVG HOUSEHOLD SIZE
128
LABOR FORCE [ PEOPLE ]
37.1%
PERCENT IN LABOR FORCE
3.9%
UNEMPLOYMENT RATE
Bowie Zip Codes
Bowie Area Codes
Income in Bowie
Income Overview in Bowie
Per Capita Income in Bowie is $19,024, while median incomes of families and households are $48,750 and $47,778 respectively.
| Characteristic | Number | Measure |
| Per Capita Income | 438 | $19,024 |
| Median Family Income | 108 | $48,750 |
| Mean Family Income | 108 | $49,235 |
| Median Household Income | 148 | $47,778 |
| Mean Household Income | 148 | $53,605 |
| Income Deficit | 108 | $0 |
| Wage / Income Gap (%) | 438 | 0.00% |
| Wage / Income Gap ($) | 438 | 100.00¢ per $1 |
| Gini / Inequality Index | 438 | 0.45 |
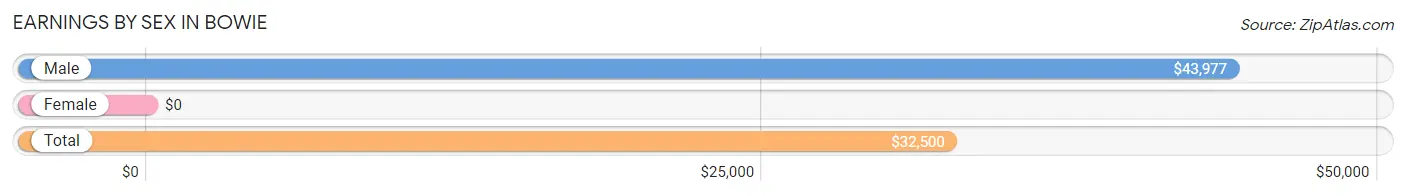
Earnings by Sex in Bowie
| Sex | Number | Average Earnings |
| Male | 83 (58.5%) | $43,977 |
| Female | 59 (41.5%) | $0 |
| Total | 142 (100.0%) | $32,500 |
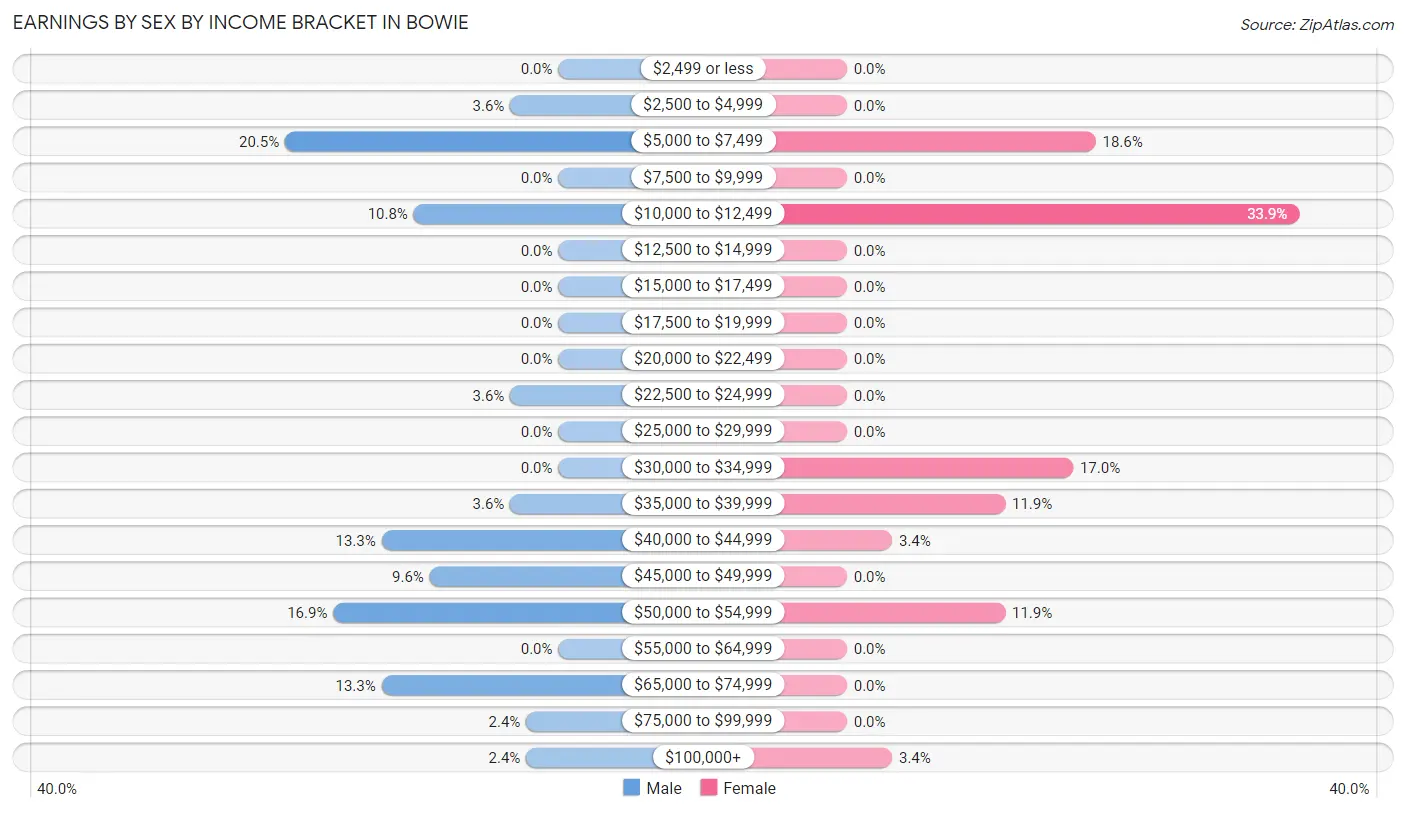
Earnings by Sex by Income Bracket in Bowie
The most common earnings brackets in Bowie are $5,000 to $7,499 for men (17 | 20.5%) and $10,000 to $12,499 for women (20 | 33.9%).
| Income | Male | Female |
| $2,499 or less | 0 (0.0%) | 0 (0.0%) |
| $2,500 to $4,999 | 3 (3.6%) | 0 (0.0%) |
| $5,000 to $7,499 | 17 (20.5%) | 11 (18.6%) |
| $7,500 to $9,999 | 0 (0.0%) | 0 (0.0%) |
| $10,000 to $12,499 | 9 (10.8%) | 20 (33.9%) |
| $12,500 to $14,999 | 0 (0.0%) | 0 (0.0%) |
| $15,000 to $17,499 | 0 (0.0%) | 0 (0.0%) |
| $17,500 to $19,999 | 0 (0.0%) | 0 (0.0%) |
| $20,000 to $22,499 | 0 (0.0%) | 0 (0.0%) |
| $22,500 to $24,999 | 3 (3.6%) | 0 (0.0%) |
| $25,000 to $29,999 | 0 (0.0%) | 0 (0.0%) |
| $30,000 to $34,999 | 0 (0.0%) | 10 (17.0%) |
| $35,000 to $39,999 | 3 (3.6%) | 7 (11.9%) |
| $40,000 to $44,999 | 11 (13.3%) | 2 (3.4%) |
| $45,000 to $49,999 | 8 (9.6%) | 0 (0.0%) |
| $50,000 to $54,999 | 14 (16.9%) | 7 (11.9%) |
| $55,000 to $64,999 | 0 (0.0%) | 0 (0.0%) |
| $65,000 to $74,999 | 11 (13.3%) | 0 (0.0%) |
| $75,000 to $99,999 | 2 (2.4%) | 0 (0.0%) |
| $100,000+ | 2 (2.4%) | 2 (3.4%) |
| Total | 83 (100.0%) | 59 (100.0%) |
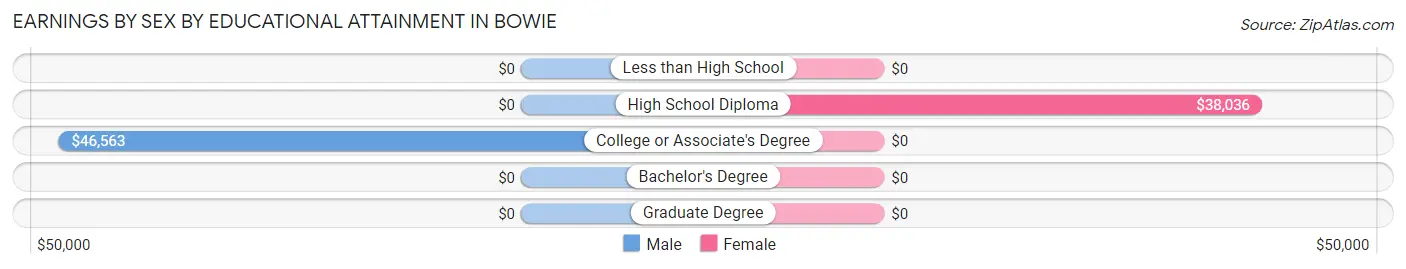
Earnings by Sex by Educational Attainment in Bowie
Average earnings in Bowie are $43,977 for men and $33,125 for women, a difference of 24.7%. Men with an educational attainment of college or associate's degree enjoy the highest average annual earnings of $46,563, while those with college or associate's degree education earn the least with $46,563. Women with an educational attainment of high school diploma earn the most with the average annual earnings of $38,036, while those with high school diploma education have the smallest earnings of $38,036.
| Educational Attainment | Male Income | Female Income |
| Less than High School | - | - |
| High School Diploma | - | - |
| College or Associate's Degree | $46,563 | $0 |
| Bachelor's Degree | - | - |
| Graduate Degree | - | - |
| Total | $43,977 | $33,125 |
Family Income in Bowie
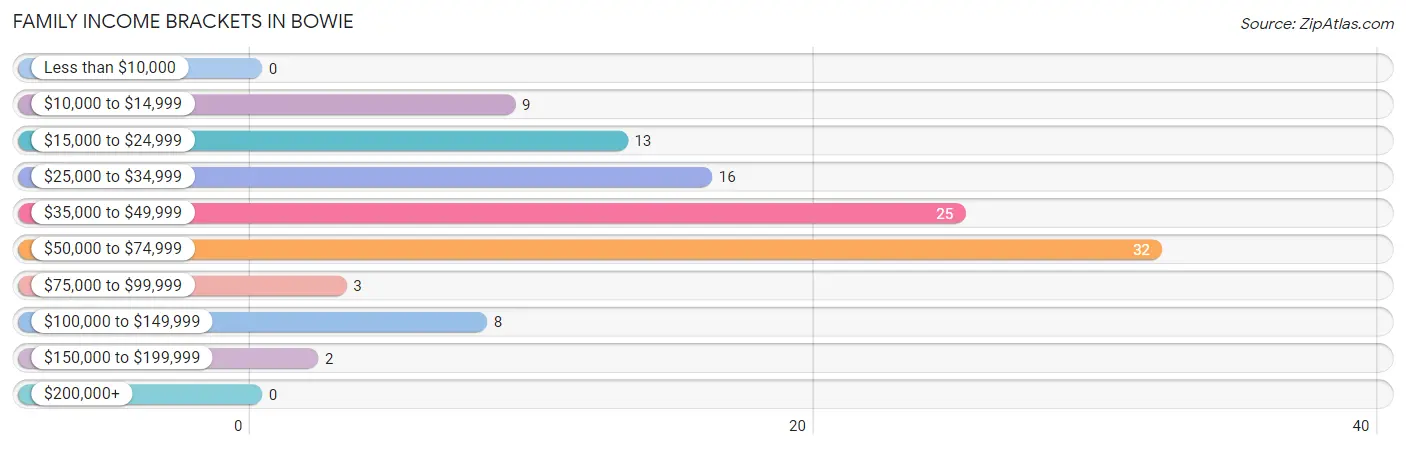
Family Income Brackets in Bowie
According to the Bowie family income data, there are 32 families falling into the $50,000 to $74,999 income range, which is the most common income bracket and makes up 29.6% of all families.
| Income Bracket | # Families | % Families |
| Less than $10,000 | 0 | 0.0% |
| $10,000 to $14,999 | 9 | 8.3% |
| $15,000 to $24,999 | 13 | 12.0% |
| $25,000 to $34,999 | 16 | 14.8% |
| $35,000 to $49,999 | 25 | 23.1% |
| $50,000 to $74,999 | 32 | 29.6% |
| $75,000 to $99,999 | 3 | 2.8% |
| $100,000 to $149,999 | 8 | 7.4% |
| $150,000 to $199,999 | 2 | 1.9% |
| $200,000+ | 0 | 0.0% |
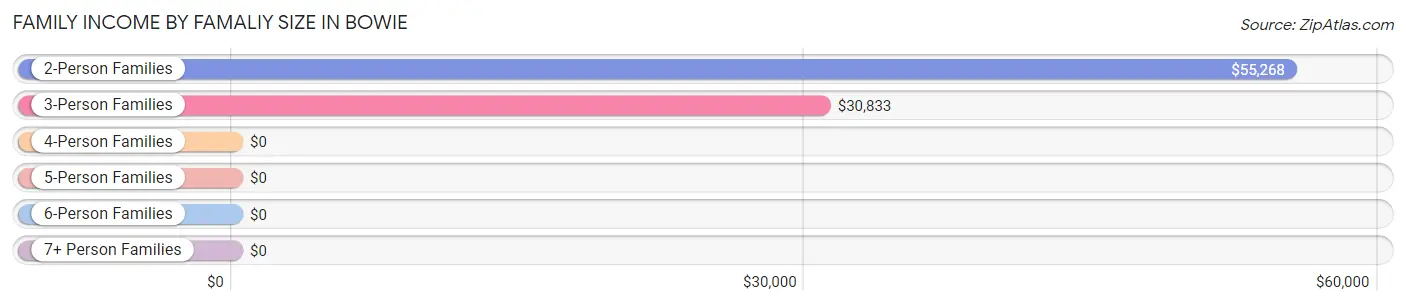
Family Income by Famaliy Size in Bowie
2-person families (55 | 50.9%) account for the highest median family income in Bowie with $55,268 per family, while 2-person families (55 | 50.9%) have the highest median income of $27,634 per family member.
| Income Bracket | # Families | Median Income |
| 2-Person Families | 55 (50.9%) | $55,268 |
| 3-Person Families | 26 (24.1%) | $30,833 |
| 4-Person Families | 12 (11.1%) | $0 |
| 5-Person Families | 4 (3.7%) | $0 |
| 6-Person Families | 0 (0.0%) | $0 |
| 7+ Person Families | 11 (10.2%) | $0 |
| Total | 108 (100.0%) | $48,750 |
Family Income by Number of Earners in Bowie
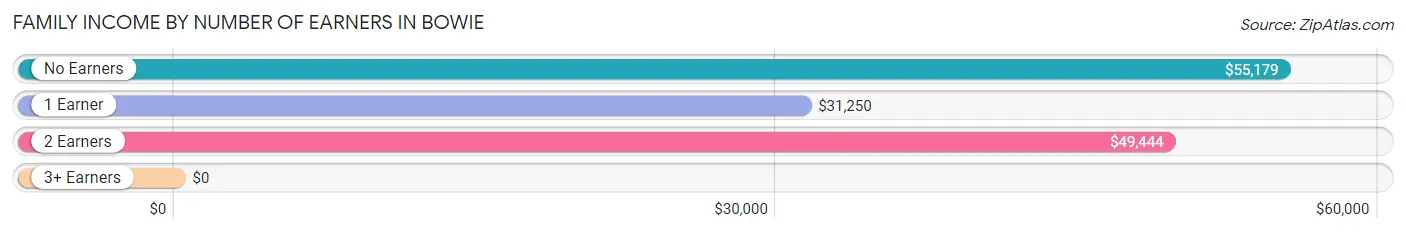
| Number of Earners | # Families | Median Income |
| No Earners | 26 (24.1%) | $55,179 |
| 1 Earner | 52 (48.1%) | $31,250 |
| 2 Earners | 28 (25.9%) | $49,444 |
| 3+ Earners | 2 (1.8%) | $0 |
| Total | 108 (100.0%) | $48,750 |
Household Income in Bowie
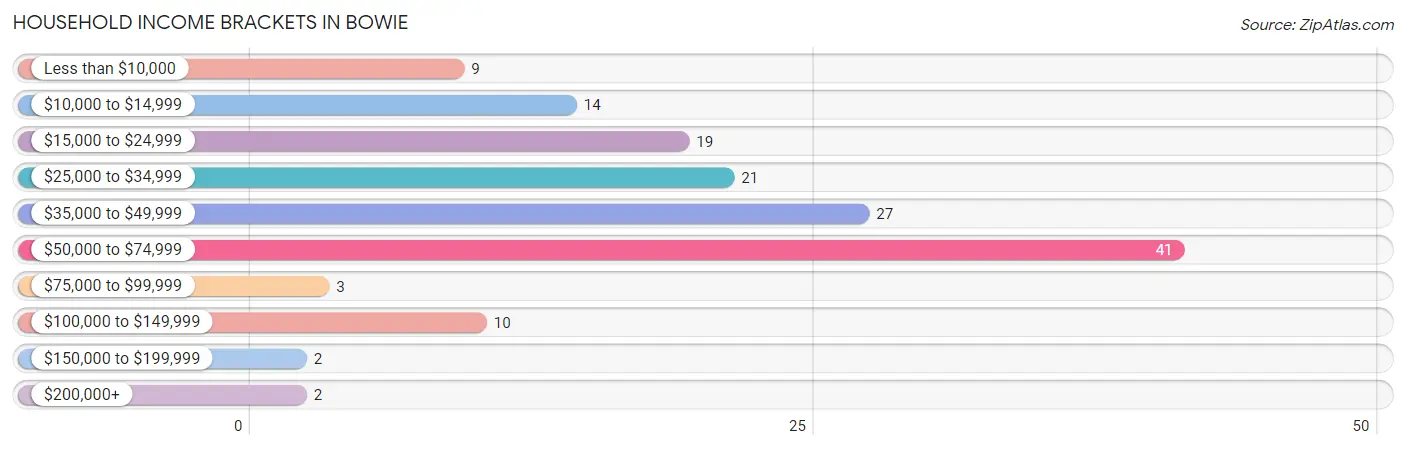
Household Income Brackets in Bowie
With 41 households falling in the category, the $50,000 to $74,999 income range is the most frequent in Bowie, accounting for 27.7% of all households. In contrast, only 2 households (1.3%) fall into the $150,000 to $199,999 income bracket, making it the least populous group.
| Income Bracket | # Households | % Households |
| Less than $10,000 | 9 | 6.1% |
| $10,000 to $14,999 | 14 | 9.5% |
| $15,000 to $24,999 | 19 | 12.8% |
| $25,000 to $34,999 | 21 | 14.2% |
| $35,000 to $49,999 | 27 | 18.2% |
| $50,000 to $74,999 | 41 | 27.7% |
| $75,000 to $99,999 | 3 | 2.0% |
| $100,000 to $149,999 | 10 | 6.8% |
| $150,000 to $199,999 | 2 | 1.4% |
| $200,000+ | 2 | 1.4% |
Household Income by Householder Age in Bowie
The median household income in Bowie is $47,778, with the highest median household income of $49,205 found in the 25 to 44 years age bracket for the primary householder. A total of 33 households (22.3%) fall into this category.
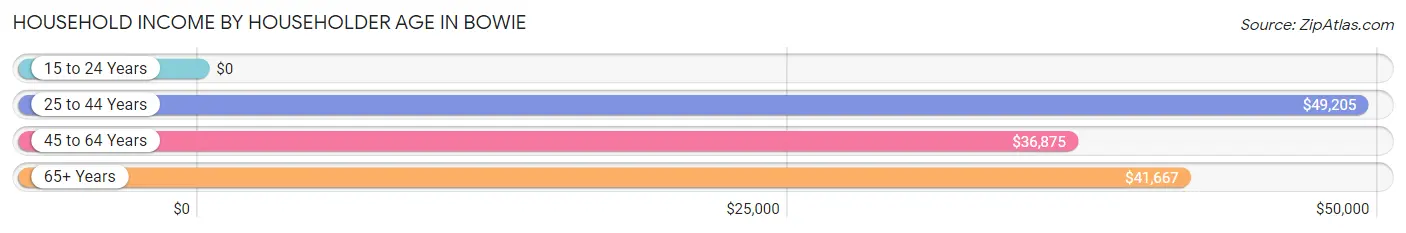
| Income Bracket | # Households | Median Income |
| 15 to 24 Years | 0 (0.0%) | $0 |
| 25 to 44 Years | 33 (22.3%) | $49,205 |
| 45 to 64 Years | 59 (39.9%) | $36,875 |
| 65+ Years | 56 (37.8%) | $41,667 |
| Total | 148 (100.0%) | $47,778 |
Poverty in Bowie
Income Below Poverty by Sex and Age in Bowie
With 47.6% poverty level for males and 43.0% for females among the residents of Bowie, under 5 year old males and 12 to 14 year old females are the most vulnerable to poverty, with 14 males (100.0%) and 11 females (100.0%) in their respective age groups living below the poverty level.
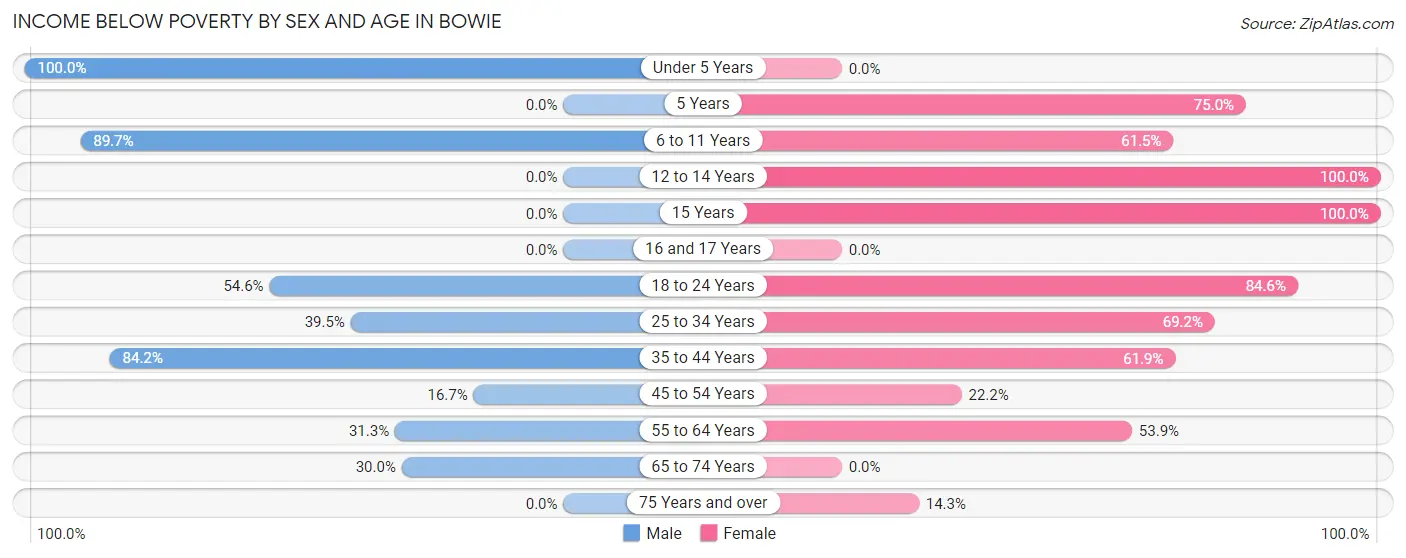
| Age Bracket | Male | Female |
| Under 5 Years | 14 (100.0%) | 0 (0.0%) |
| 5 Years | 0 (0.0%) | 9 (75.0%) |
| 6 to 11 Years | 26 (89.7%) | 8 (61.5%) |
| 12 to 14 Years | 0 (0.0%) | 11 (100.0%) |
| 15 Years | 0 (0.0%) | 7 (100.0%) |
| 16 and 17 Years | 0 (0.0%) | 0 (0.0%) |
| 18 to 24 Years | 12 (54.5%) | 11 (84.6%) |
| 25 to 34 Years | 15 (39.5%) | 9 (69.2%) |
| 35 to 44 Years | 16 (84.2%) | 13 (61.9%) |
| 45 to 54 Years | 3 (16.7%) | 6 (22.2%) |
| 55 to 64 Years | 5 (31.2%) | 21 (53.8%) |
| 65 to 74 Years | 9 (30.0%) | 0 (0.0%) |
| 75 Years and over | 0 (0.0%) | 3 (14.3%) |
| Total | 100 (47.6%) | 98 (43.0%) |
Income Above Poverty by Sex and Age in Bowie
According to the poverty statistics in Bowie, males aged 15 years and females aged under 5 years are the age groups that are most secure financially, with 100.0% of males and 100.0% of females in these age groups living above the poverty line.
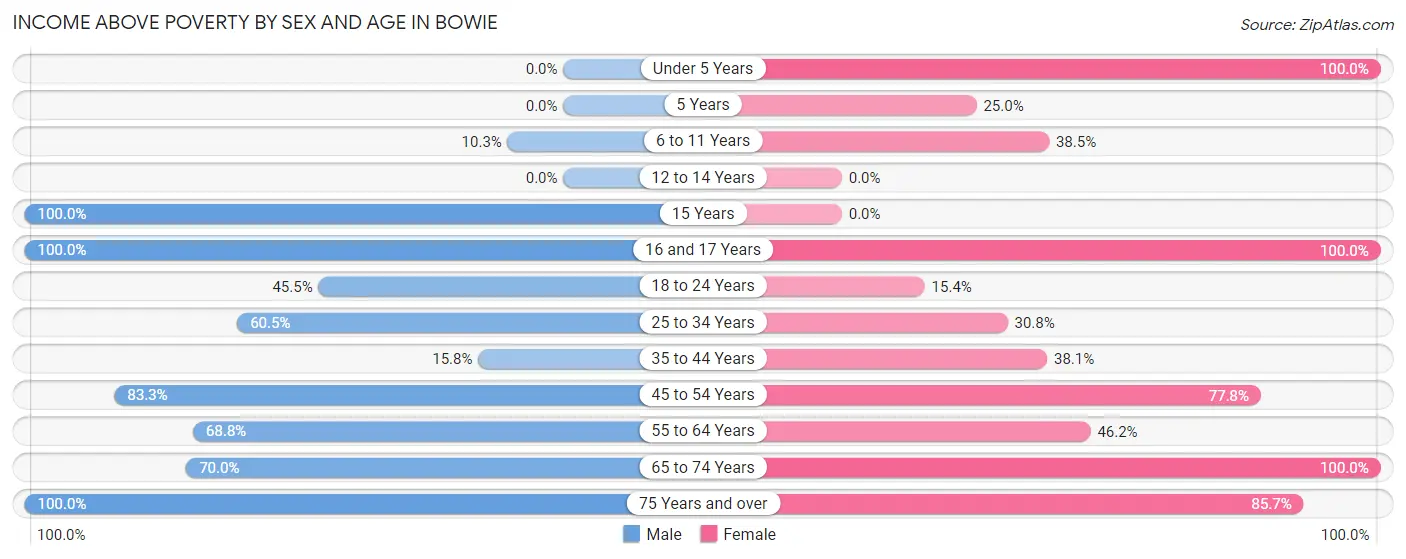
| Age Bracket | Male | Female |
| Under 5 Years | 0 (0.0%) | 4 (100.0%) |
| 5 Years | 0 (0.0%) | 3 (25.0%) |
| 6 to 11 Years | 3 (10.3%) | 5 (38.5%) |
| 12 to 14 Years | 0 (0.0%) | 0 (0.0%) |
| 15 Years | 3 (100.0%) | 0 (0.0%) |
| 16 and 17 Years | 3 (100.0%) | 7 (100.0%) |
| 18 to 24 Years | 10 (45.5%) | 2 (15.4%) |
| 25 to 34 Years | 23 (60.5%) | 4 (30.8%) |
| 35 to 44 Years | 3 (15.8%) | 8 (38.1%) |
| 45 to 54 Years | 15 (83.3%) | 21 (77.8%) |
| 55 to 64 Years | 11 (68.8%) | 18 (46.2%) |
| 65 to 74 Years | 21 (70.0%) | 40 (100.0%) |
| 75 Years and over | 18 (100.0%) | 18 (85.7%) |
| Total | 110 (52.4%) | 130 (57.0%) |
Income Below Poverty Among Married-Couple Families in Bowie
The poverty statistics for married-couple families in Bowie show that 25.0% or 20 of the total 80 families live below the poverty line. Families with 3 or 4 children have the highest poverty rate of 73.3%, comprising of 11 families. On the other hand, families with no children have the lowest poverty rate of 0.0%, which includes 0 families.
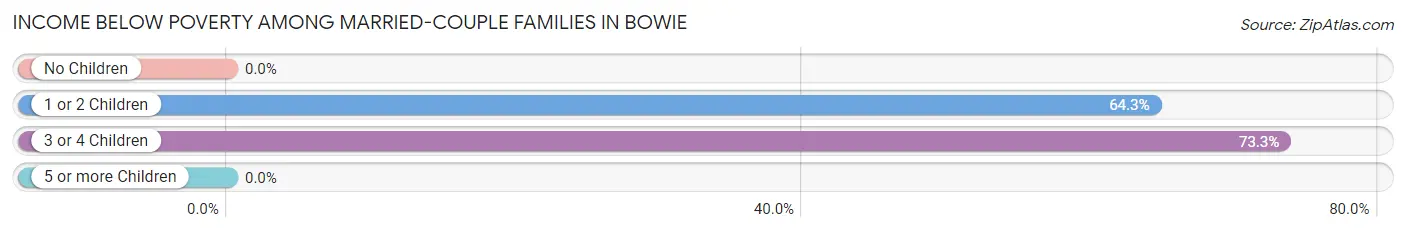
| Children | Above Poverty | Below Poverty |
| No Children | 51 (100.0%) | 0 (0.0%) |
| 1 or 2 Children | 5 (35.7%) | 9 (64.3%) |
| 3 or 4 Children | 4 (26.7%) | 11 (73.3%) |
| 5 or more Children | 0 (0.0%) | 0 (0.0%) |
| Total | 60 (75.0%) | 20 (25.0%) |
Income Below Poverty Among Single-Parent Households in Bowie
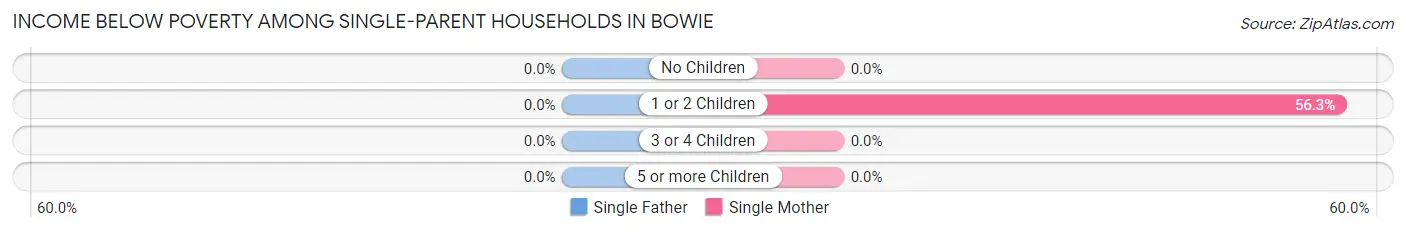
| Children | Single Father | Single Mother |
| No Children | 0 (0.0%) | 0 (0.0%) |
| 1 or 2 Children | 0 (0.0%) | 9 (56.2%) |
| 3 or 4 Children | 0 (0.0%) | 0 (0.0%) |
| 5 or more Children | 0 (0.0%) | 0 (0.0%) |
| Total | 0 (0.0%) | 9 (37.5%) |
Income Below Poverty Among Married-Couple vs Single-Parent Households in Bowie
The poverty data for Bowie shows that 20 of the married-couple family households (25.0%) and 9 of the single-parent households (32.1%) are living below the poverty level. Within the married-couple family households, those with 3 or 4 children have the highest poverty rate, with 11 households (73.3%) falling below the poverty line. Among the single-parent households, those with 1 or 2 children have the highest poverty rate, with 9 household (50.0%) living below poverty.
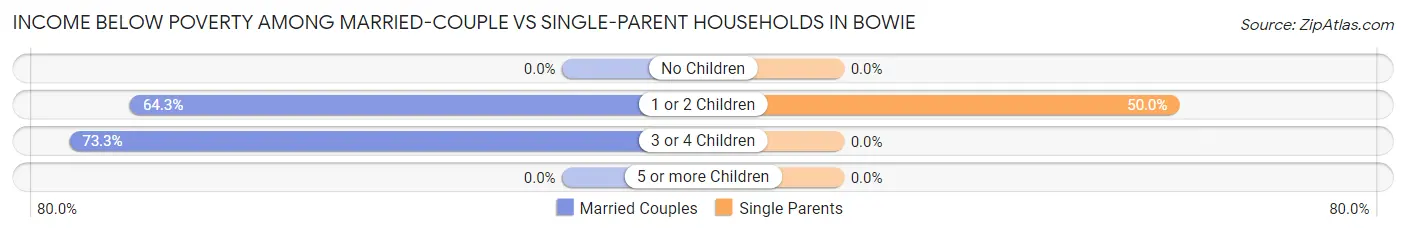
| Children | Married-Couple Families | Single-Parent Households |
| No Children | 0 (0.0%) | 0 (0.0%) |
| 1 or 2 Children | 9 (64.3%) | 9 (50.0%) |
| 3 or 4 Children | 11 (73.3%) | 0 (0.0%) |
| 5 or more Children | 0 (0.0%) | 0 (0.0%) |
| Total | 20 (25.0%) | 9 (32.1%) |
Race in Bowie
The most populous races in Bowie are Hispanic or Latino (341 | 77.8%), White / Caucasian (163 | 37.2%), and Some other Race (151 | 34.5%).
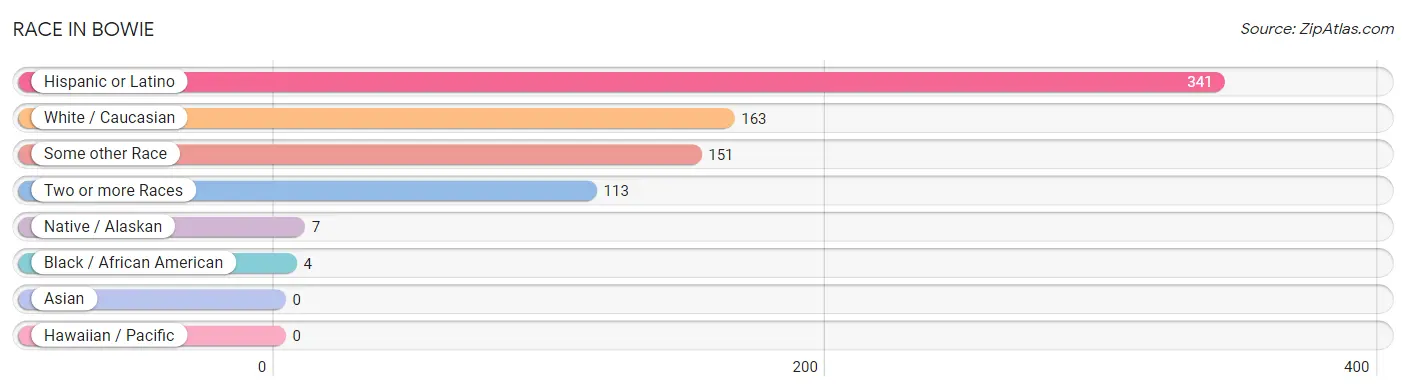
| Race | # Population | % Population |
| Asian | 0 | 0.0% |
| Black / African American | 4 | 0.9% |
| Hawaiian / Pacific | 0 | 0.0% |
| Hispanic or Latino | 341 | 77.8% |
| Native / Alaskan | 7 | 1.6% |
| White / Caucasian | 163 | 37.2% |
| Two or more Races | 113 | 25.8% |
| Some other Race | 151 | 34.5% |
| Total | 438 | 100.0% |
Ancestry in Bowie
The most populous ancestries reported in Bowie are Mexican (339 | 77.4%), English (13 | 3.0%), German (10 | 2.3%), Central American Indian (8 | 1.8%), and Apache (7 | 1.6%), together accounting for 86.1% of all Bowie residents.
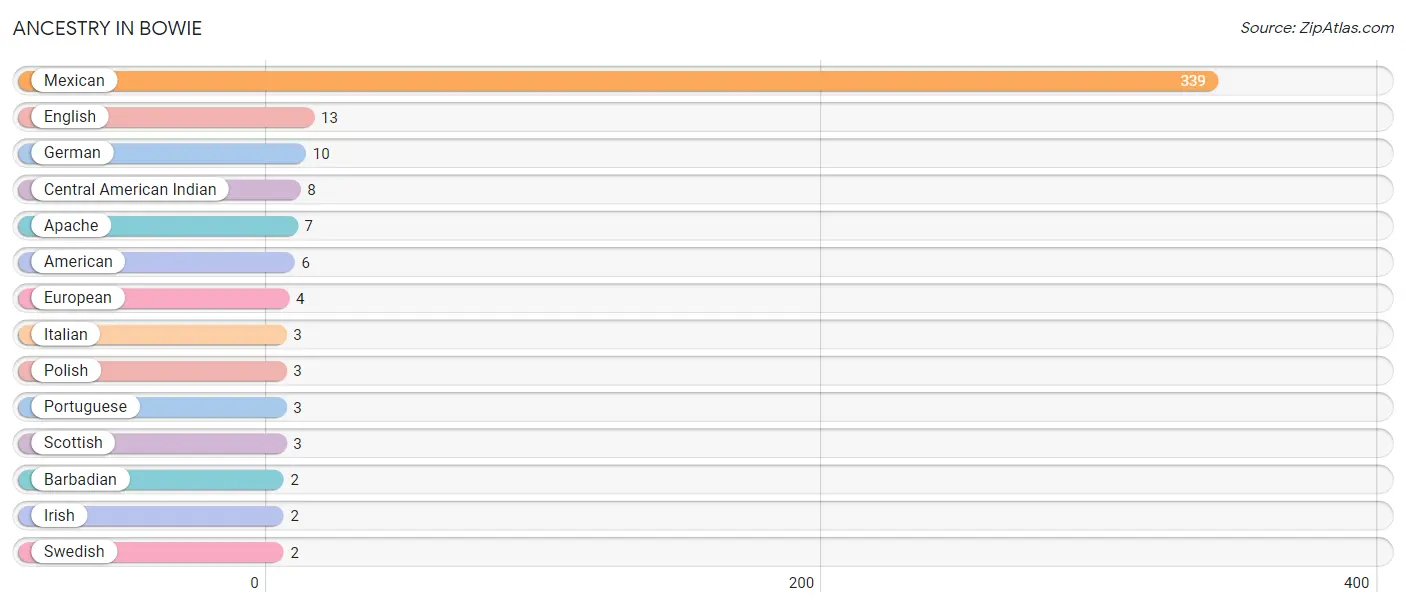
| Ancestry | # Population | % Population |
| American | 6 | 1.4% |
| Apache | 7 | 1.6% |
| Barbadian | 2 | 0.5% |
| Central American Indian | 8 | 1.8% |
| English | 13 | 3.0% |
| European | 4 | 0.9% |
| German | 10 | 2.3% |
| Irish | 2 | 0.5% |
| Italian | 3 | 0.7% |
| Mexican | 339 | 77.4% |
| Polish | 3 | 0.7% |
| Portuguese | 3 | 0.7% |
| Scottish | 3 | 0.7% |
| Swedish | 2 | 0.5% | View All 14 Rows |
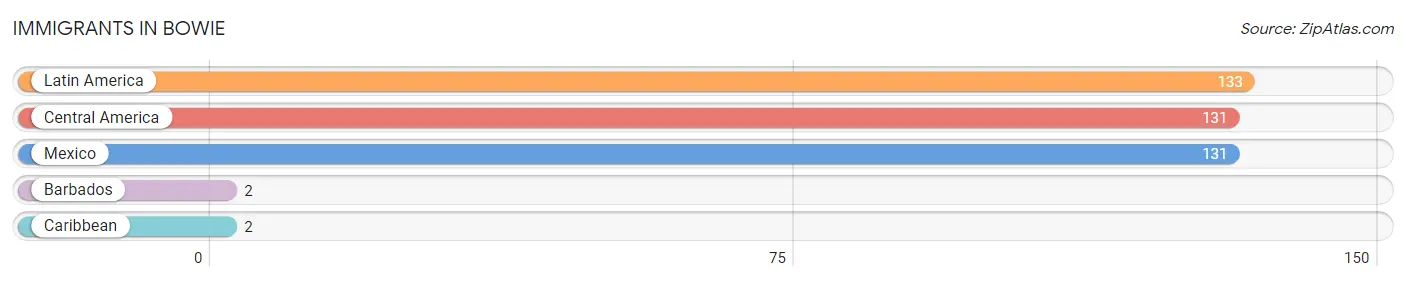
Immigrants in Bowie
The most numerous immigrant groups reported in Bowie came from Latin America (133 | 30.4%), Central America (131 | 29.9%), Mexico (131 | 29.9%), Barbados (2 | 0.5%), and Caribbean (2 | 0.5%), together accounting for 91.1% of all Bowie residents.
| Immigration Origin | # Population | % Population |
| Barbados | 2 | 0.5% |
| Caribbean | 2 | 0.5% |
| Central America | 131 | 29.9% |
| Latin America | 133 | 30.4% |
| Mexico | 131 | 29.9% | View All 5 Rows |
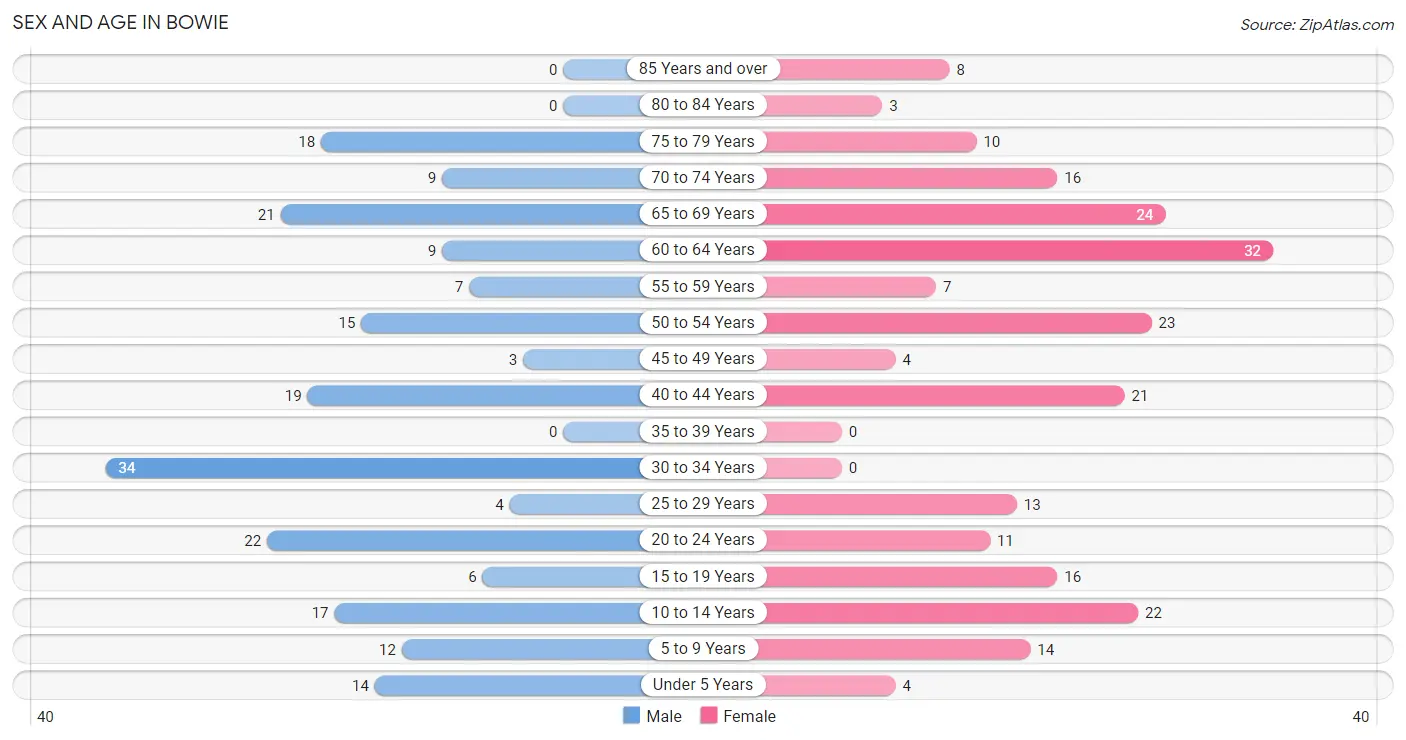
Sex and Age in Bowie
Sex and Age in Bowie
The most populous age groups in Bowie are 30 to 34 Years (34 | 16.2%) for men and 60 to 64 Years (32 | 14.0%) for women.
| Age Bracket | Male | Female |
| Under 5 Years | 14 (6.7%) | 4 (1.8%) |
| 5 to 9 Years | 12 (5.7%) | 14 (6.1%) |
| 10 to 14 Years | 17 (8.1%) | 22 (9.7%) |
| 15 to 19 Years | 6 (2.9%) | 16 (7.0%) |
| 20 to 24 Years | 22 (10.5%) | 11 (4.8%) |
| 25 to 29 Years | 4 (1.9%) | 13 (5.7%) |
| 30 to 34 Years | 34 (16.2%) | 0 (0.0%) |
| 35 to 39 Years | 0 (0.0%) | 0 (0.0%) |
| 40 to 44 Years | 19 (9.0%) | 21 (9.2%) |
| 45 to 49 Years | 3 (1.4%) | 4 (1.8%) |
| 50 to 54 Years | 15 (7.1%) | 23 (10.1%) |
| 55 to 59 Years | 7 (3.3%) | 7 (3.1%) |
| 60 to 64 Years | 9 (4.3%) | 32 (14.0%) |
| 65 to 69 Years | 21 (10.0%) | 24 (10.5%) |
| 70 to 74 Years | 9 (4.3%) | 16 (7.0%) |
| 75 to 79 Years | 18 (8.6%) | 10 (4.4%) |
| 80 to 84 Years | 0 (0.0%) | 3 (1.3%) |
| 85 Years and over | 0 (0.0%) | 8 (3.5%) |
| Total | 210 (100.0%) | 228 (100.0%) |
Families and Households in Bowie
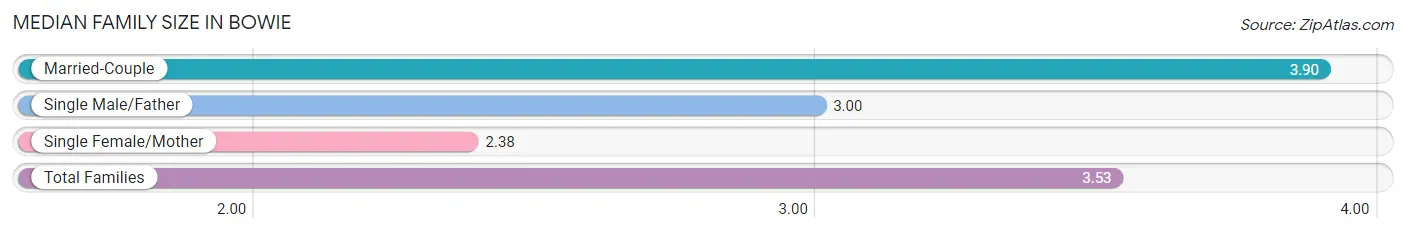
Median Family Size in Bowie
The median family size in Bowie is 3.53 persons per family, with married-couple families (80 | 74.1%) accounting for the largest median family size of 3.9 persons per family. On the other hand, single female/mother families (24 | 22.2%) represent the smallest median family size with 2.38 persons per family.
| Family Type | # Families | Family Size |
| Married-Couple | 80 (74.1%) | 3.90 |
| Single Male/Father | 4 (3.7%) | 3.00 |
| Single Female/Mother | 24 (22.2%) | 2.38 |
| Total Families | 108 (100.0%) | 3.53 |
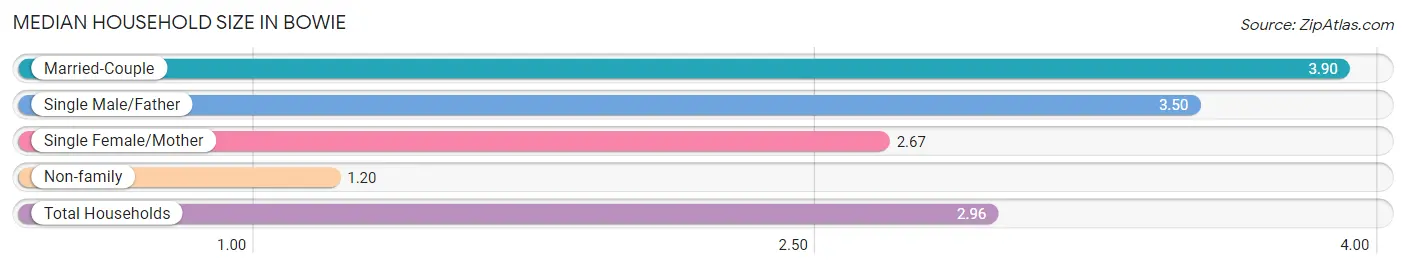
Median Household Size in Bowie
The median household size in Bowie is 2.96 persons per household, with married-couple households (80 | 54.0%) accounting for the largest median household size of 3.9 persons per household. non-family households (40 | 27.0%) represent the smallest median household size with 1.20 persons per household.
| Household Type | # Households | Household Size |
| Married-Couple | 80 (54.0%) | 3.90 |
| Single Male/Father | 4 (2.7%) | 3.50 |
| Single Female/Mother | 24 (16.2%) | 2.67 |
| Non-family | 40 (27.0%) | 1.20 |
| Total Households | 148 (100.0%) | 2.96 |
Household Size by Marriage Status in Bowie
Out of a total of 148 households in Bowie, 108 (73.0%) are family households, while 40 (27.0%) are nonfamily households. The most numerous type of family households are 2-person households, comprising 48, and the most common type of nonfamily households are 1-person households, comprising 38.
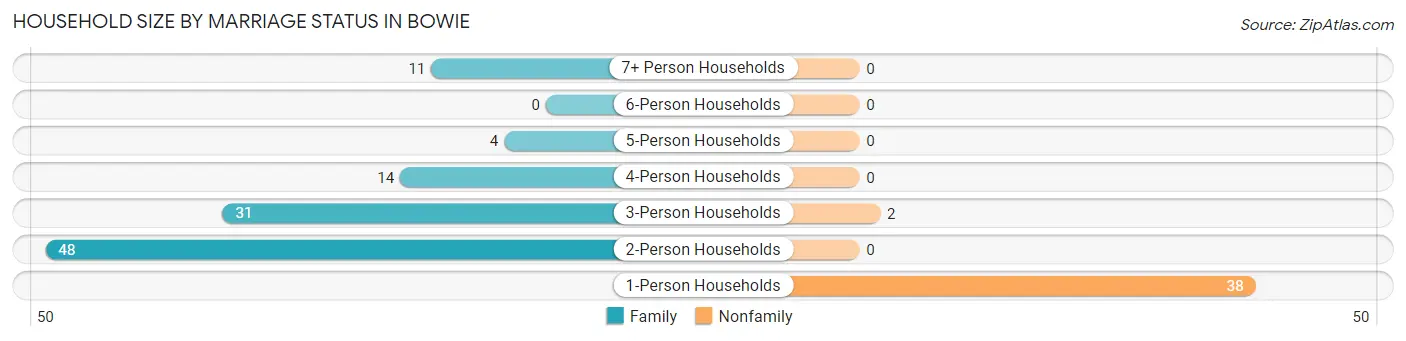
| Household Size | Family Households | Nonfamily Households |
| 1-Person Households | - | 38 (25.7%) |
| 2-Person Households | 48 (32.4%) | 0 (0.0%) |
| 3-Person Households | 31 (20.9%) | 2 (1.3%) |
| 4-Person Households | 14 (9.5%) | 0 (0.0%) |
| 5-Person Households | 4 (2.7%) | 0 (0.0%) |
| 6-Person Households | 0 (0.0%) | 0 (0.0%) |
| 7+ Person Households | 11 (7.4%) | 0 (0.0%) |
| Total | 108 (73.0%) | 40 (27.0%) |
Female Fertility in Bowie
Fertility by Age in Bowie
Average fertility rate in Bowie is 54.0 births per 1,000 women. Women in the age bracket of 20 to 34 years have the highest fertility rate with 167.0 births per 1,000 women. Women in the age bracket of 20 to 34 years acount for 100.0% of all women with births.
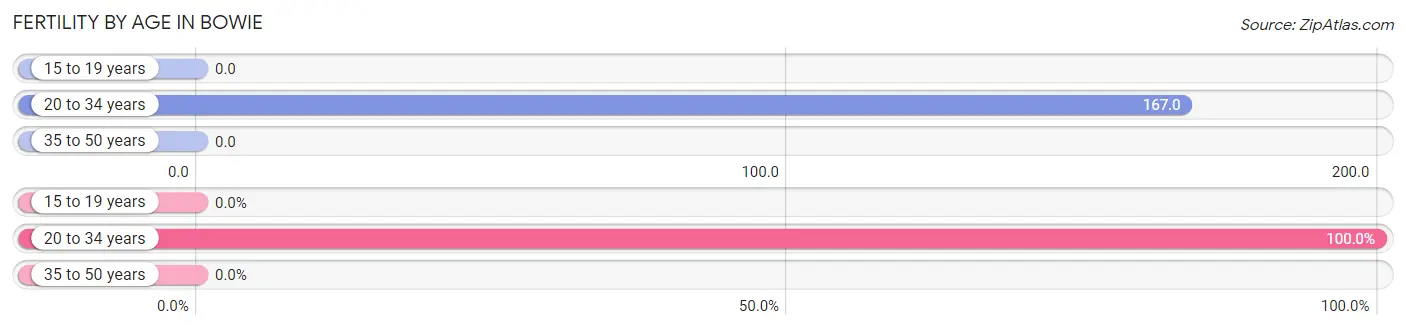
| Age Bracket | Women with Births | Births / 1,000 Women |
| 15 to 19 years | 0 (0.0%) | 0.0 |
| 20 to 34 years | 4 (100.0%) | 167.0 |
| 35 to 50 years | 0 (0.0%) | 0.0 |
| Total | 4 (100.0%) | 54.0 |
Fertility by Age by Marriage Status in Bowie
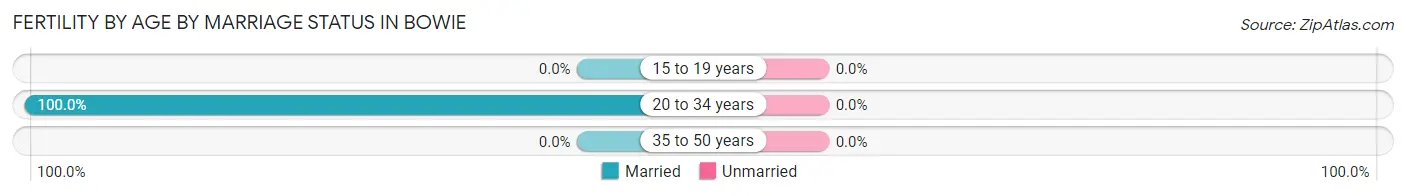
| Age Bracket | Married | Unmarried |
| 15 to 19 years | 0 (0.0%) | 0 (0.0%) |
| 20 to 34 years | 4 (100.0%) | 0 (0.0%) |
| 35 to 50 years | 0 (0.0%) | 0 (0.0%) |
| Total | 4 (100.0%) | 0 (0.0%) |
Fertility by Education in Bowie
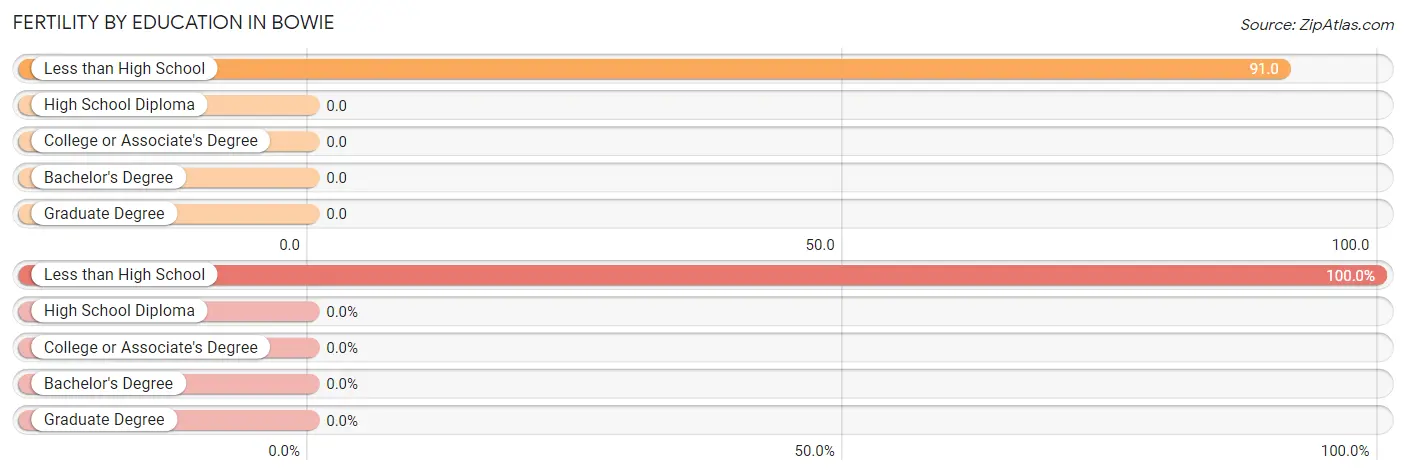
| Educational Attainment | Women with Births | Births / 1,000 Women |
| Less than High School | 4 (100.0%) | 91.0 |
| High School Diploma | 0 (0.0%) | 0.0 |
| College or Associate's Degree | 0 (0.0%) | 0.0 |
| Bachelor's Degree | 0 (0.0%) | 0.0 |
| Graduate Degree | 0 (0.0%) | 0.0 |
| Total | 4 (100.0%) | 54.0 |
Fertility by Education by Marriage Status in Bowie
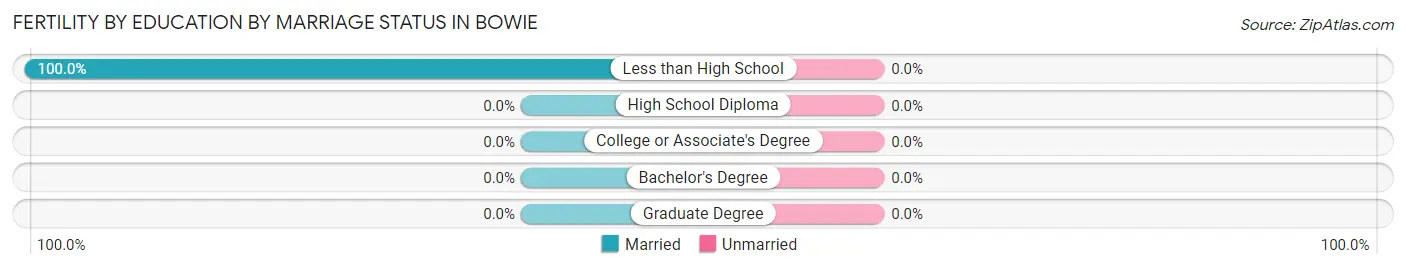
| Educational Attainment | Married | Unmarried |
| Less than High School | 4 (100.0%) | 0 (0.0%) |
| High School Diploma | 0 (0.0%) | 0 (0.0%) |
| College or Associate's Degree | 0 (0.0%) | 0 (0.0%) |
| Bachelor's Degree | 0 (0.0%) | 0 (0.0%) |
| Graduate Degree | 0 (0.0%) | 0 (0.0%) |
| Total | 4 (100.0%) | 0 (0.0%) |
Employment Characteristics in Bowie
Employment by Class of Employer in Bowie
Among the 123 employed individuals in Bowie, private company employees (86 | 69.9%), federal government employees (14 | 11.4%), and not-for-profit organizations (8 | 6.5%) make up the most common classes of employment.
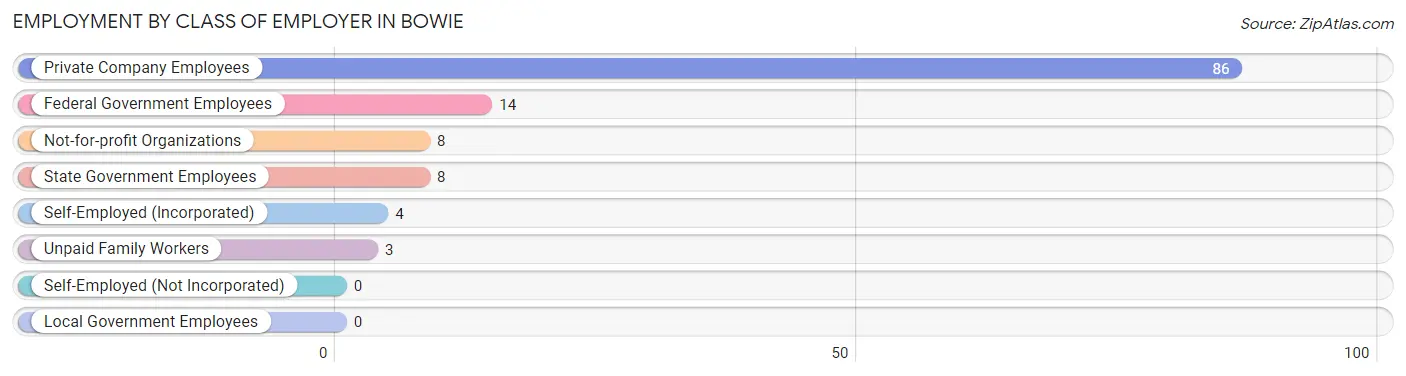
| Employer Class | # Employees | % Employees |
| Private Company Employees | 86 | 69.9% |
| Self-Employed (Incorporated) | 4 | 3.3% |
| Self-Employed (Not Incorporated) | 0 | 0.0% |
| Not-for-profit Organizations | 8 | 6.5% |
| Local Government Employees | 0 | 0.0% |
| State Government Employees | 8 | 6.5% |
| Federal Government Employees | 14 | 11.4% |
| Unpaid Family Workers | 3 | 2.4% |
| Total | 123 | 100.0% |
Employment Status by Age in Bowie
According to the labor force statistics for Bowie, out of the total population over 16 years of age (345), 37.1% or 128 individuals are in the labor force, with 3.9% or 5 of them unemployed. The age group with the highest labor force participation rate is 25 to 29 years, with 76.5% or 13 individuals in the labor force. Within the labor force, the 35 to 44 years age range has the highest percentage of unemployed individuals, with 23.8% or 5 of them being unemployed.
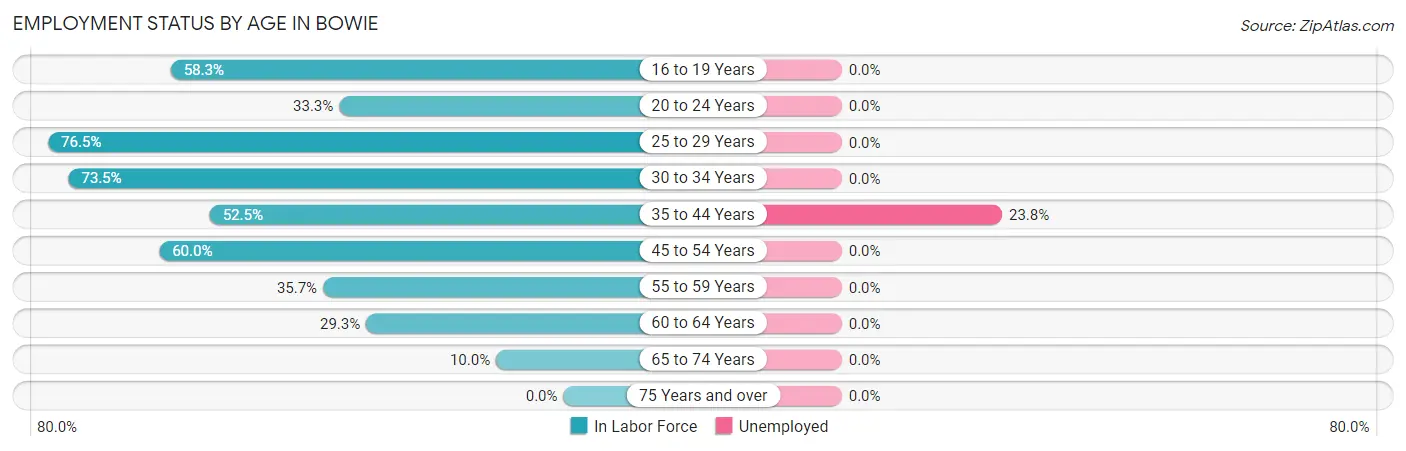
| Age Bracket | In Labor Force | Unemployed |
| 16 to 19 Years | 7 (58.3%) | 0 (0.0%) |
| 20 to 24 Years | 11 (33.3%) | 0 (0.0%) |
| 25 to 29 Years | 13 (76.5%) | 0 (0.0%) |
| 30 to 34 Years | 25 (73.5%) | 0 (0.0%) |
| 35 to 44 Years | 21 (52.5%) | 5 (23.8%) |
| 45 to 54 Years | 27 (60.0%) | 0 (0.0%) |
| 55 to 59 Years | 5 (35.7%) | 0 (0.0%) |
| 60 to 64 Years | 12 (29.3%) | 0 (0.0%) |
| 65 to 74 Years | 7 (10.0%) | 0 (0.0%) |
| 75 Years and over | 0 (0.0%) | 0 (0.0%) |
| Total | 128 (37.1%) | 5 (3.9%) |
Employment Status by Educational Attainment in Bowie
According to labor force statistics for Bowie, 53.9% of individuals (103) out of the total population between 25 and 64 years of age (191) are in the labor force, with 4.9% or 5 of them being unemployed. The group with the highest labor force participation rate are those with the educational attainment of bachelor's degree or higher, with 100.0% or 11 individuals in the labor force. Within the labor force, individuals with less than high school education have the highest percentage of unemployment, with 12.2% or 5 of them being unemployed.
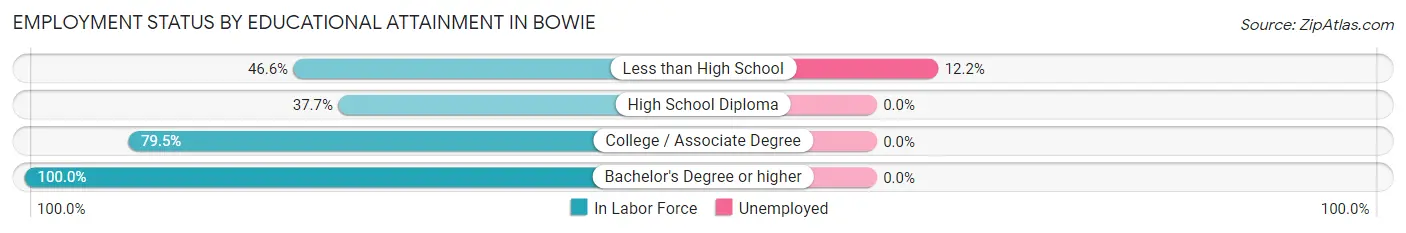
| Educational Attainment | In Labor Force | Unemployed |
| Less than High School | 41 (46.6%) | 11 (12.2%) |
| High School Diploma | 20 (37.7%) | 0 (0.0%) |
| College / Associate Degree | 31 (79.5%) | 0 (0.0%) |
| Bachelor's Degree or higher | 11 (100.0%) | 0 (0.0%) |
| Total | 103 (53.9%) | 9 (4.9%) |
Employment Occupations by Sex in Bowie
Management, Business, Science and Arts Occupations
The most common Management, Business, Science and Arts occupations in Bowie are Community & Social Service (8 | 6.5%), Education Instruction & Library (8 | 6.5%), and Management (7 | 5.7%).
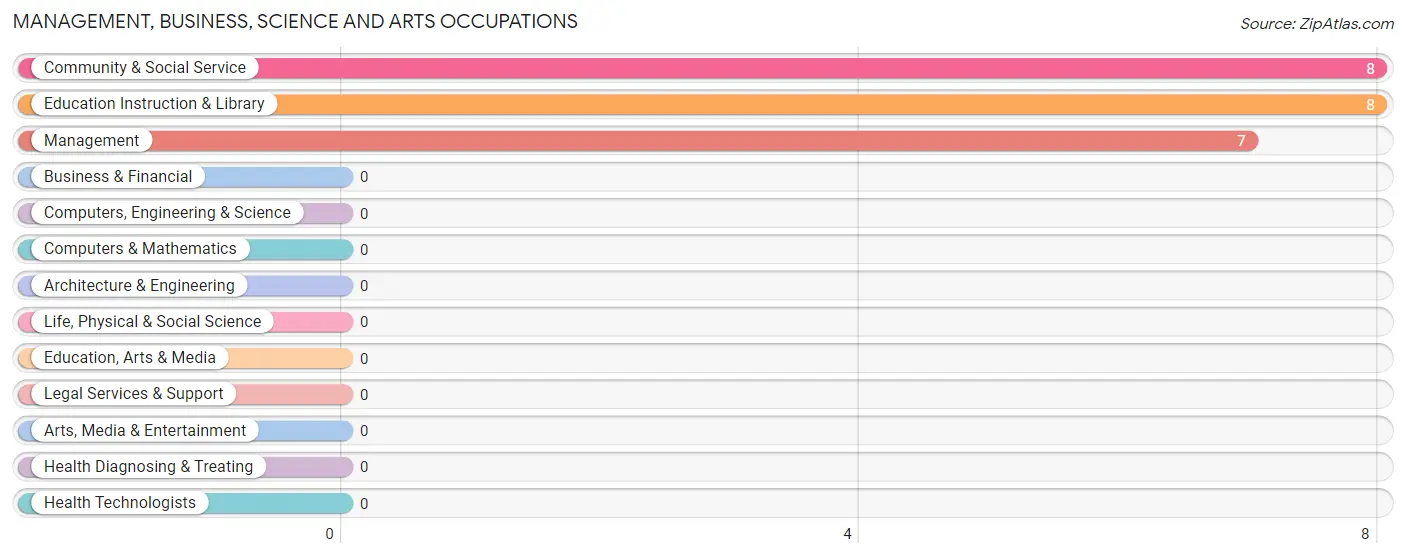
Management, Business, Science and Arts Occupations by Sex
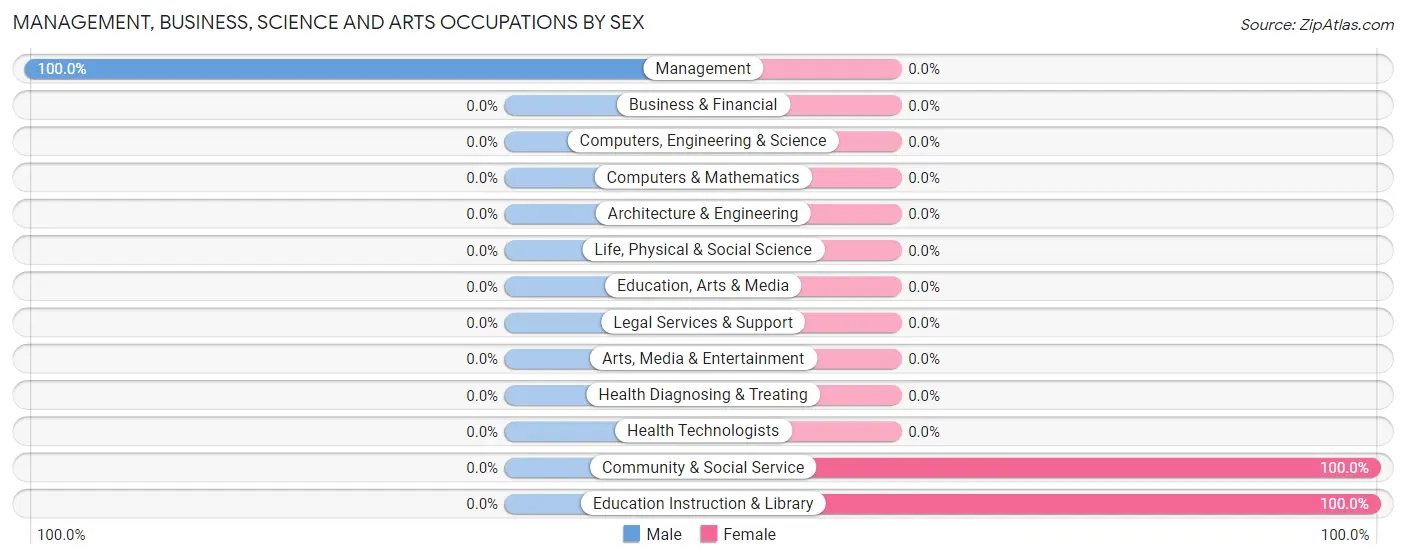
| Occupation | Male | Female |
| Management | 7 (100.0%) | 0 (0.0%) |
| Business & Financial | 0 (0.0%) | 0 (0.0%) |
| Computers, Engineering & Science | 0 (0.0%) | 0 (0.0%) |
| Computers & Mathematics | 0 (0.0%) | 0 (0.0%) |
| Architecture & Engineering | 0 (0.0%) | 0 (0.0%) |
| Life, Physical & Social Science | 0 (0.0%) | 0 (0.0%) |
| Community & Social Service | 0 (0.0%) | 8 (100.0%) |
| Education, Arts & Media | 0 (0.0%) | 0 (0.0%) |
| Legal Services & Support | 0 (0.0%) | 0 (0.0%) |
| Education Instruction & Library | 0 (0.0%) | 8 (100.0%) |
| Arts, Media & Entertainment | 0 (0.0%) | 0 (0.0%) |
| Health Diagnosing & Treating | 0 (0.0%) | 0 (0.0%) |
| Health Technologists | 0 (0.0%) | 0 (0.0%) |
| Total (Category) | 7 (46.7%) | 8 (53.3%) |
| Total (Overall) | 68 (55.3%) | 55 (44.7%) |
Services Occupations
Services Occupations by Sex
| Occupation | Male | Female |
| Healthcare Support | 0 (0.0%) | 0 (0.0%) |
| Security & Protection | 0 (0.0%) | 0 (0.0%) |
| Firefighting & Prevention | 0 (0.0%) | 0 (0.0%) |
| Law Enforcement | 0 (0.0%) | 0 (0.0%) |
| Food Preparation & Serving | 0 (0.0%) | 0 (0.0%) |
| Cleaning & Maintenance | 0 (0.0%) | 0 (0.0%) |
| Personal Care & Service | 0 (0.0%) | 0 (0.0%) |
| Total (Category) | 0 (0.0%) | 0 (0.0%) |
| Total (Overall) | 68 (55.3%) | 55 (44.7%) |
Sales and Office Occupations
The most common Sales and Office occupations in Bowie are Office & Administration (22 | 17.9%), and Sales & Related (14 | 11.4%).
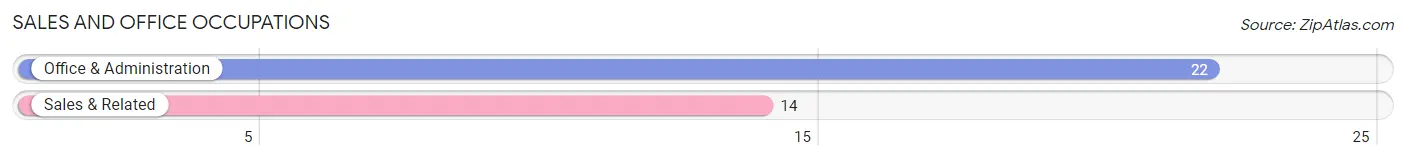
Sales and Office Occupations by Sex
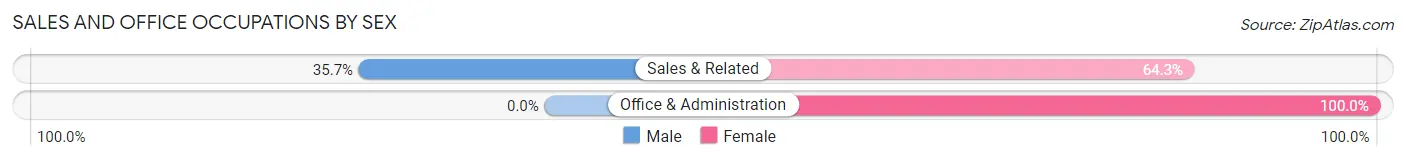
| Occupation | Male | Female |
| Sales & Related | 5 (35.7%) | 9 (64.3%) |
| Office & Administration | 0 (0.0%) | 22 (100.0%) |
| Total (Category) | 5 (13.9%) | 31 (86.1%) |
| Total (Overall) | 68 (55.3%) | 55 (44.7%) |
Natural Resources, Construction and Maintenance Occupations
The most common Natural Resources, Construction and Maintenance occupations in Bowie are Farming, Fishing & Forestry (35 | 28.5%), Construction & Extraction (17 | 13.8%), and Installation, Maintenance & Repair (2 | 1.6%).
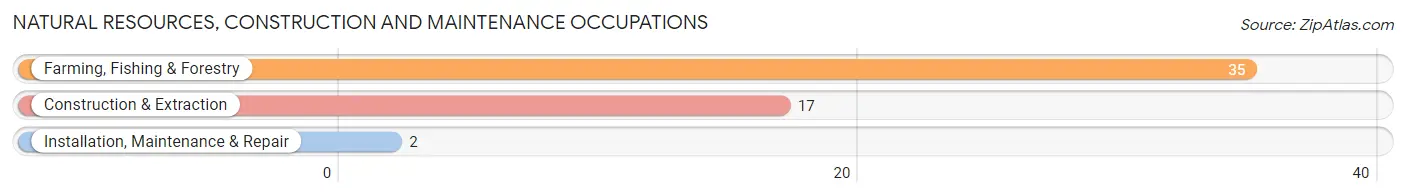
Natural Resources, Construction and Maintenance Occupations by Sex
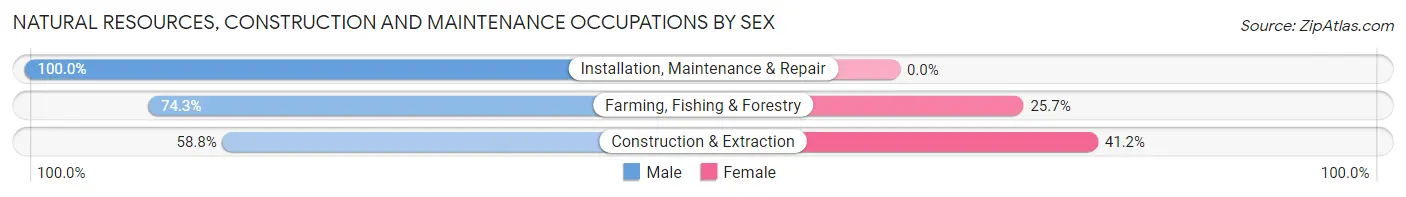
| Occupation | Male | Female |
| Farming, Fishing & Forestry | 26 (74.3%) | 9 (25.7%) |
| Construction & Extraction | 10 (58.8%) | 7 (41.2%) |
| Installation, Maintenance & Repair | 2 (100.0%) | 0 (0.0%) |
| Total (Category) | 38 (70.4%) | 16 (29.6%) |
| Total (Overall) | 68 (55.3%) | 55 (44.7%) |
Production, Transportation and Moving Occupations
The most common Production, Transportation and Moving occupations in Bowie are Material Moving (15 | 12.2%), Production (2 | 1.6%), and Transportation (1 | 0.8%).
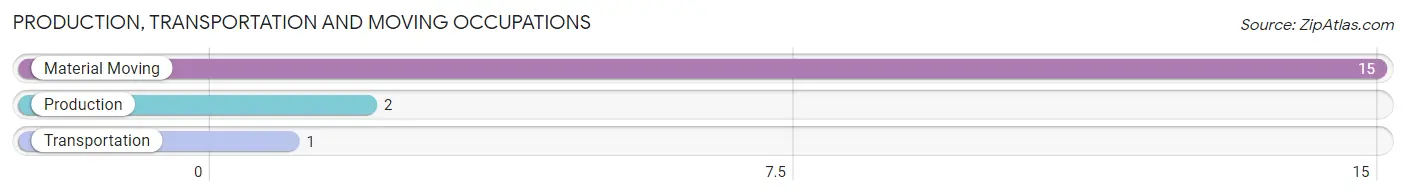
Production, Transportation and Moving Occupations by Sex
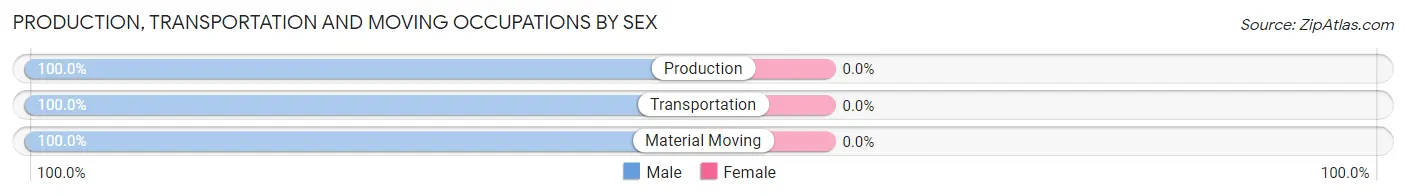
| Occupation | Male | Female |
| Production | 2 (100.0%) | 0 (0.0%) |
| Transportation | 1 (100.0%) | 0 (0.0%) |
| Material Moving | 15 (100.0%) | 0 (0.0%) |
| Total (Category) | 18 (100.0%) | 0 (0.0%) |
| Total (Overall) | 68 (55.3%) | 55 (44.7%) |
Employment Industries by Sex in Bowie
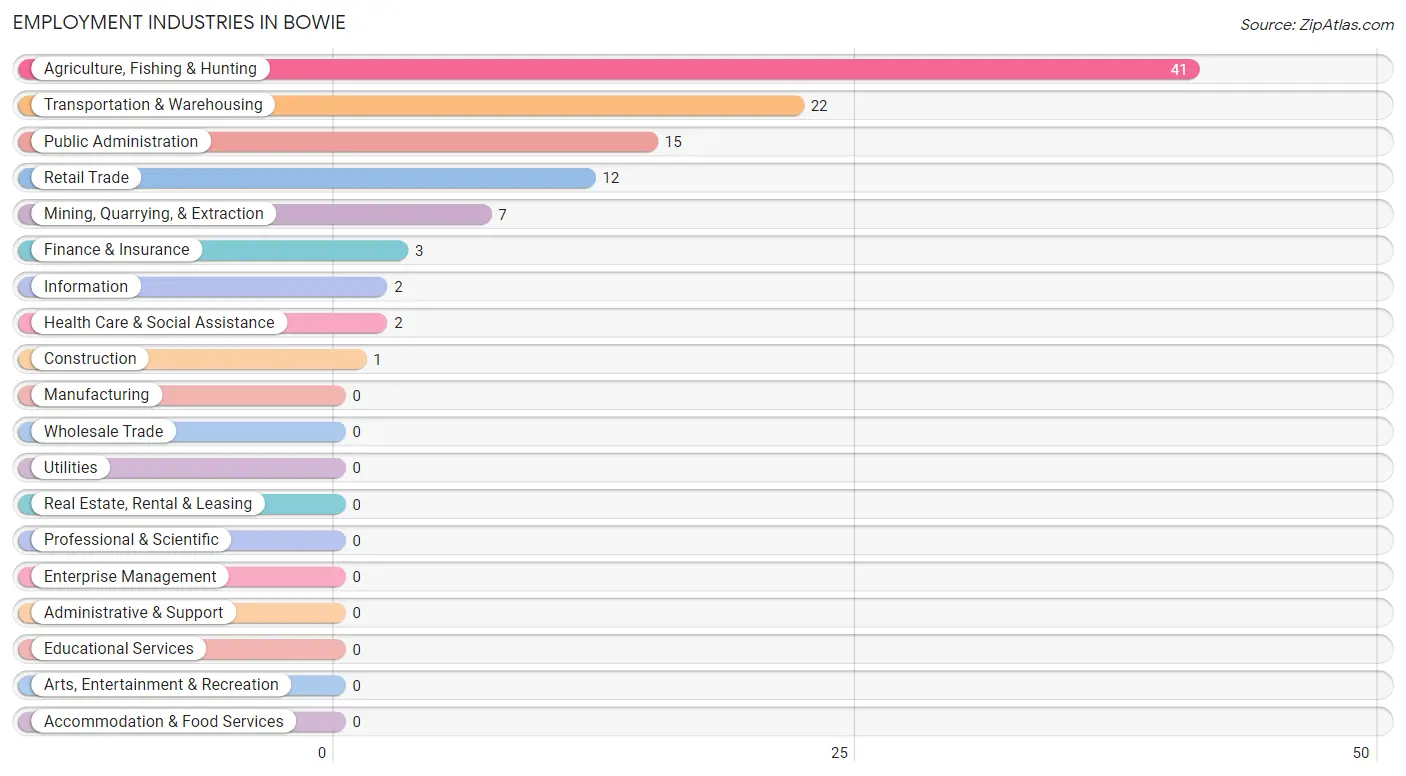
Employment Industries in Bowie
The major employment industries in Bowie include Agriculture, Fishing & Hunting (41 | 33.3%), Transportation & Warehousing (22 | 17.9%), Public Administration (15 | 12.2%), Retail Trade (12 | 9.8%), and Mining, Quarrying, & Extraction (7 | 5.7%).
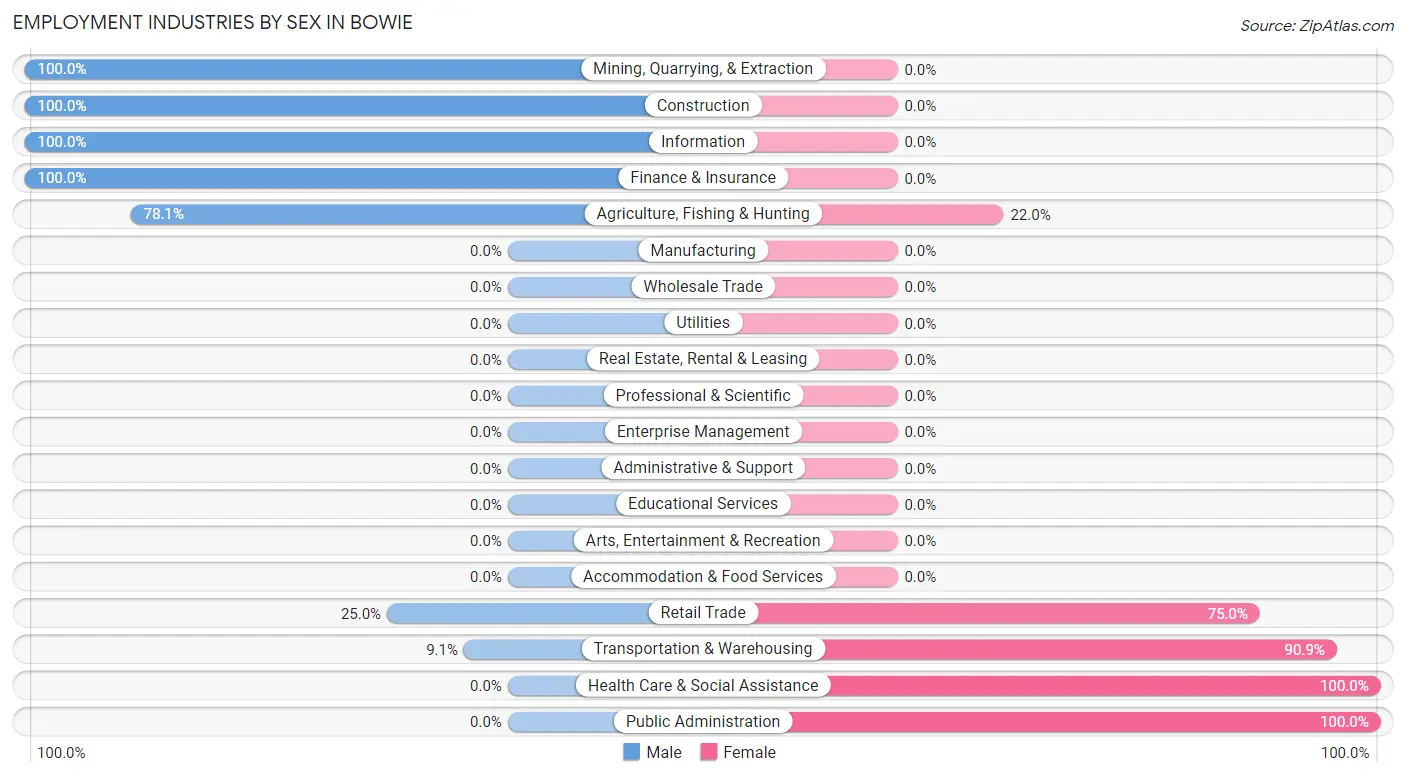
Employment Industries by Sex in Bowie
The Bowie industries that see more men than women are Mining, Quarrying, & Extraction (100.0%), Construction (100.0%), and Information (100.0%), whereas the industries that tend to have a higher number of women are Health Care & Social Assistance (100.0%), Public Administration (100.0%), and Transportation & Warehousing (90.9%).
| Industry | Male | Female |
| Agriculture, Fishing & Hunting | 32 (78.0%) | 9 (22.0%) |
| Mining, Quarrying, & Extraction | 7 (100.0%) | 0 (0.0%) |
| Construction | 1 (100.0%) | 0 (0.0%) |
| Manufacturing | 0 (0.0%) | 0 (0.0%) |
| Wholesale Trade | 0 (0.0%) | 0 (0.0%) |
| Retail Trade | 3 (25.0%) | 9 (75.0%) |
| Transportation & Warehousing | 2 (9.1%) | 20 (90.9%) |
| Utilities | 0 (0.0%) | 0 (0.0%) |
| Information | 2 (100.0%) | 0 (0.0%) |
| Finance & Insurance | 3 (100.0%) | 0 (0.0%) |
| Real Estate, Rental & Leasing | 0 (0.0%) | 0 (0.0%) |
| Professional & Scientific | 0 (0.0%) | 0 (0.0%) |
| Enterprise Management | 0 (0.0%) | 0 (0.0%) |
| Administrative & Support | 0 (0.0%) | 0 (0.0%) |
| Educational Services | 0 (0.0%) | 0 (0.0%) |
| Health Care & Social Assistance | 0 (0.0%) | 2 (100.0%) |
| Arts, Entertainment & Recreation | 0 (0.0%) | 0 (0.0%) |
| Accommodation & Food Services | 0 (0.0%) | 0 (0.0%) |
| Public Administration | 0 (0.0%) | 15 (100.0%) |
| Total | 68 (55.3%) | 55 (44.7%) |
Education in Bowie
School Enrollment in Bowie
The most common levels of schooling among the 103 students in Bowie are high school (30 | 29.1%), middle school (28 | 27.2%), and college / undergraduate (19 | 18.4%).
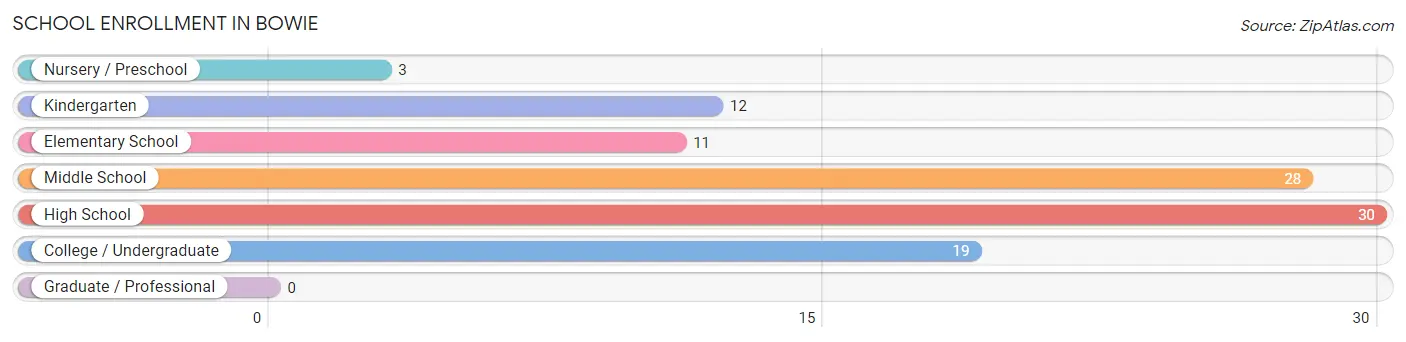
| School Level | # Students | % Students |
| Nursery / Preschool | 3 | 2.9% |
| Kindergarten | 12 | 11.7% |
| Elementary School | 11 | 10.7% |
| Middle School | 28 | 27.2% |
| High School | 30 | 29.1% |
| College / Undergraduate | 19 | 18.4% |
| Graduate / Professional | 0 | 0.0% |
| Total | 103 | 100.0% |
School Enrollment by Age by Funding Source in Bowie
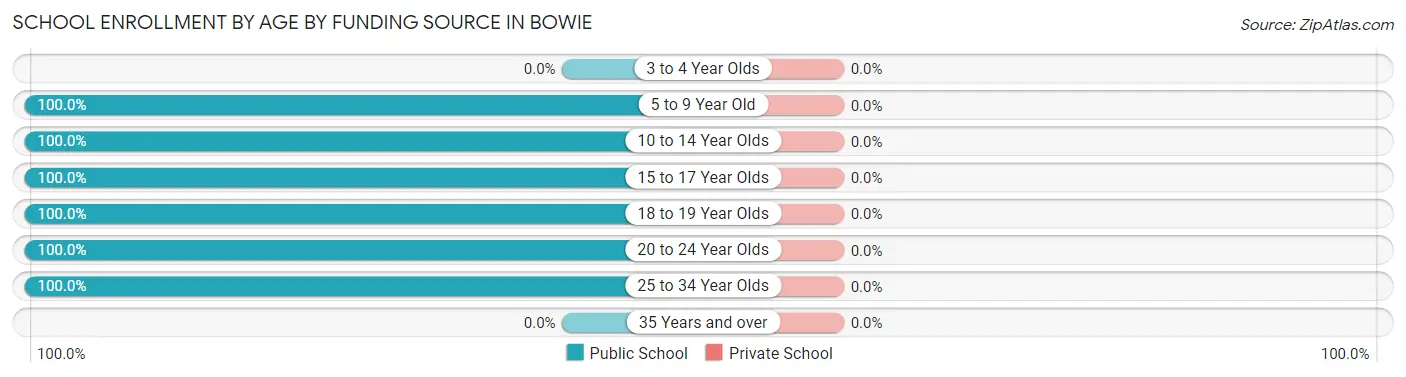
| Age Bracket | Public School | Private School |
| 3 to 4 Year Olds | 0 (0.0%) | 0 (0.0%) |
| 5 to 9 Year Old | 26 (100.0%) | 0 (0.0%) |
| 10 to 14 Year Olds | 39 (100.0%) | 0 (0.0%) |
| 15 to 17 Year Olds | 17 (100.0%) | 0 (0.0%) |
| 18 to 19 Year Olds | 2 (100.0%) | 0 (0.0%) |
| 20 to 24 Year Olds | 10 (100.0%) | 0 (0.0%) |
| 25 to 34 Year Olds | 9 (100.0%) | 0 (0.0%) |
| 35 Years and over | 0 (0.0%) | 0 (0.0%) |
| Total | 103 (100.0%) | 0 (0.0%) |
Educational Attainment by Field of Study in Bowie
Education (8 | 42.1%), arts & humanities (6 | 31.6%), communications (3 | 15.8%), and science & technology (2 | 10.5%) are the most common fields of study among 19 individuals in Bowie who have obtained a bachelor's degree or higher.
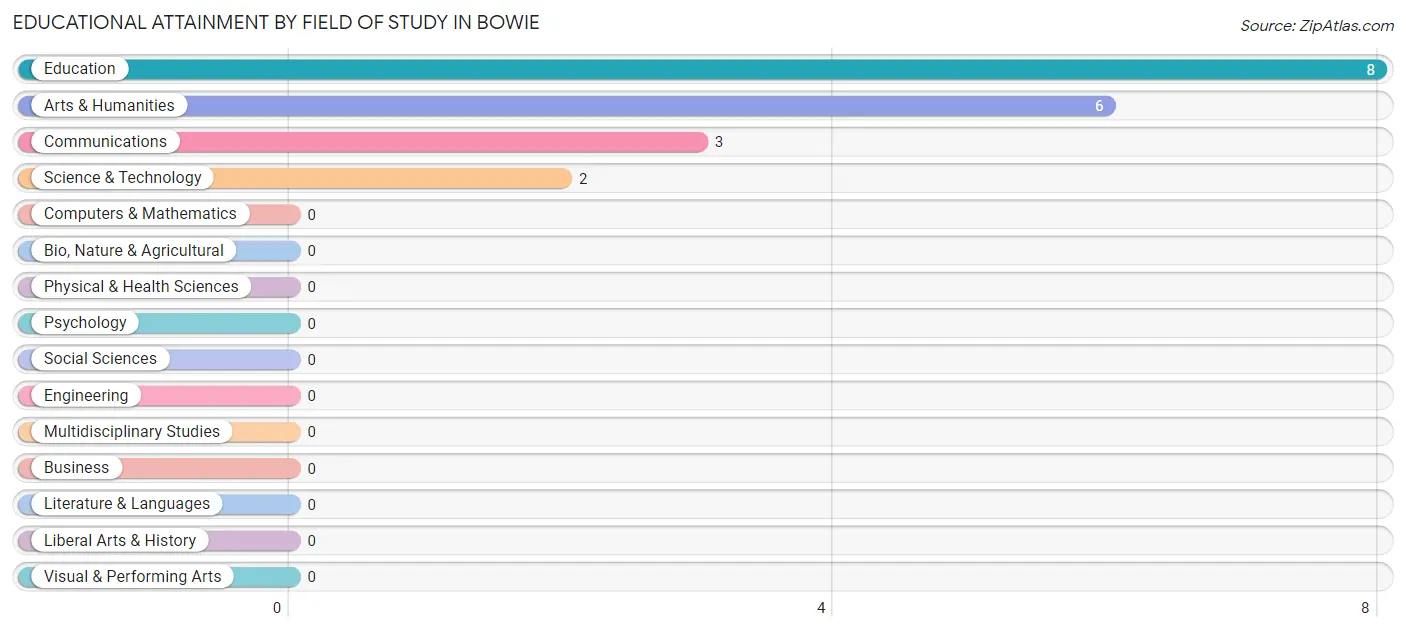
| Field of Study | # Graduates | % Graduates |
| Computers & Mathematics | 0 | 0.0% |
| Bio, Nature & Agricultural | 0 | 0.0% |
| Physical & Health Sciences | 0 | 0.0% |
| Psychology | 0 | 0.0% |
| Social Sciences | 0 | 0.0% |
| Engineering | 0 | 0.0% |
| Multidisciplinary Studies | 0 | 0.0% |
| Science & Technology | 2 | 10.5% |
| Business | 0 | 0.0% |
| Education | 8 | 42.1% |
| Literature & Languages | 0 | 0.0% |
| Liberal Arts & History | 0 | 0.0% |
| Visual & Performing Arts | 0 | 0.0% |
| Communications | 3 | 15.8% |
| Arts & Humanities | 6 | 31.6% |
| Total | 19 | 100.0% |
Transportation & Commute in Bowie
Vehicle Availability by Sex in Bowie
The most prevalent vehicle ownership categories in Bowie are males with 4 vehicles (23, accounting for 33.8%) and females with 4 vehicles (11, making up 41.8%).
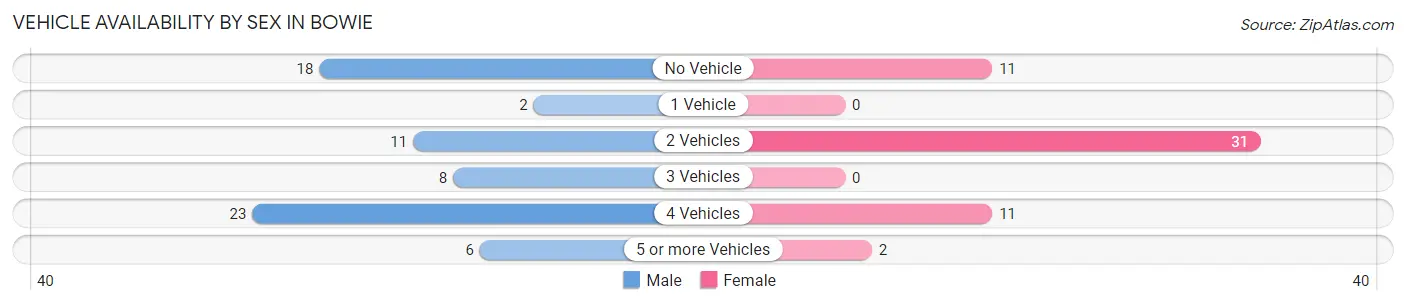
| Vehicles Available | Male | Female |
| No Vehicle | 18 (26.5%) | 11 (20.0%) |
| 1 Vehicle | 2 (2.9%) | 0 (0.0%) |
| 2 Vehicles | 11 (16.2%) | 31 (56.4%) |
| 3 Vehicles | 8 (11.8%) | 0 (0.0%) |
| 4 Vehicles | 23 (33.8%) | 11 (20.0%) |
| 5 or more Vehicles | 6 (8.8%) | 2 (3.6%) |
| Total | 68 (100.0%) | 55 (100.0%) |
Commute Time in Bowie
The most frequently occuring commute durations in Bowie are 5 to 9 minutes (27 commuters, 25.5%), 30 to 34 minutes (23 commuters, 21.7%), and 20 to 24 minutes (19 commuters, 17.9%).
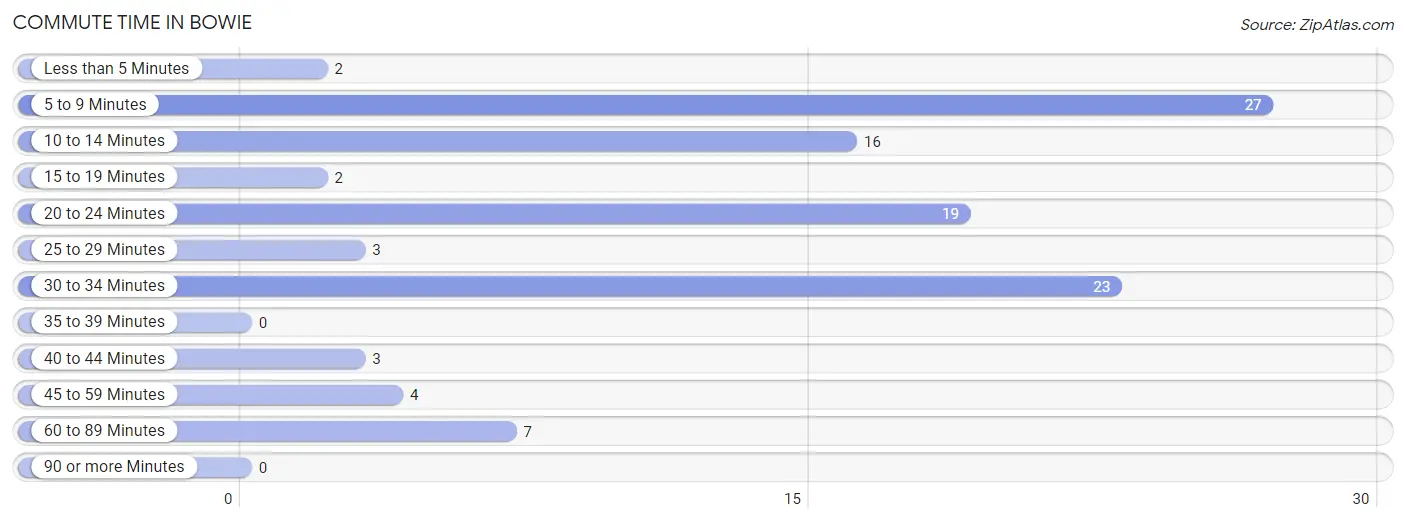
| Commute Time | # Commuters | % Commuters |
| Less than 5 Minutes | 2 | 1.9% |
| 5 to 9 Minutes | 27 | 25.5% |
| 10 to 14 Minutes | 16 | 15.1% |
| 15 to 19 Minutes | 2 | 1.9% |
| 20 to 24 Minutes | 19 | 17.9% |
| 25 to 29 Minutes | 3 | 2.8% |
| 30 to 34 Minutes | 23 | 21.7% |
| 35 to 39 Minutes | 0 | 0.0% |
| 40 to 44 Minutes | 3 | 2.8% |
| 45 to 59 Minutes | 4 | 3.8% |
| 60 to 89 Minutes | 7 | 6.6% |
| 90 or more Minutes | 0 | 0.0% |
Commute Time by Sex in Bowie
The most common commute times in Bowie are 5 to 9 minutes (18 commuters, 34.0%) for males and 30 to 34 minutes (21 commuters, 39.6%) for females.
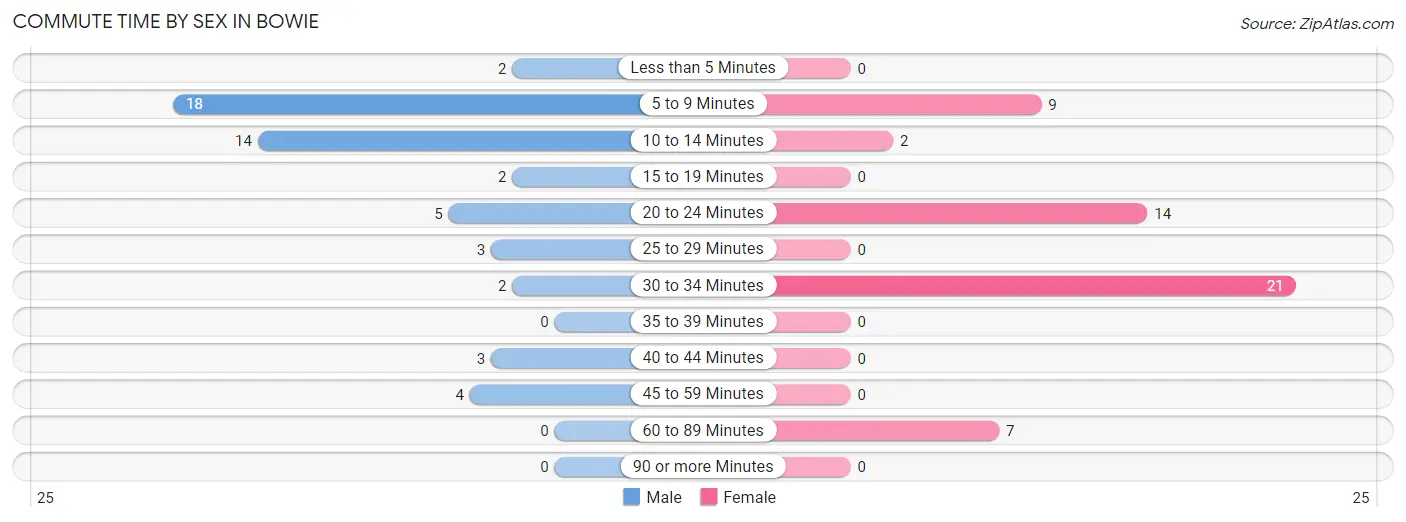
| Commute Time | Male | Female |
| Less than 5 Minutes | 2 (3.8%) | 0 (0.0%) |
| 5 to 9 Minutes | 18 (34.0%) | 9 (17.0%) |
| 10 to 14 Minutes | 14 (26.4%) | 2 (3.8%) |
| 15 to 19 Minutes | 2 (3.8%) | 0 (0.0%) |
| 20 to 24 Minutes | 5 (9.4%) | 14 (26.4%) |
| 25 to 29 Minutes | 3 (5.7%) | 0 (0.0%) |
| 30 to 34 Minutes | 2 (3.8%) | 21 (39.6%) |
| 35 to 39 Minutes | 0 (0.0%) | 0 (0.0%) |
| 40 to 44 Minutes | 3 (5.7%) | 0 (0.0%) |
| 45 to 59 Minutes | 4 (7.5%) | 0 (0.0%) |
| 60 to 89 Minutes | 0 (0.0%) | 7 (13.2%) |
| 90 or more Minutes | 0 (0.0%) | 0 (0.0%) |
Time of Departure to Work by Sex in Bowie
The most frequent times of departure to work in Bowie are 5:00 AM to 5:29 AM (25, 47.2%) for males and 8:00 AM to 8:29 AM (26, 49.1%) for females.
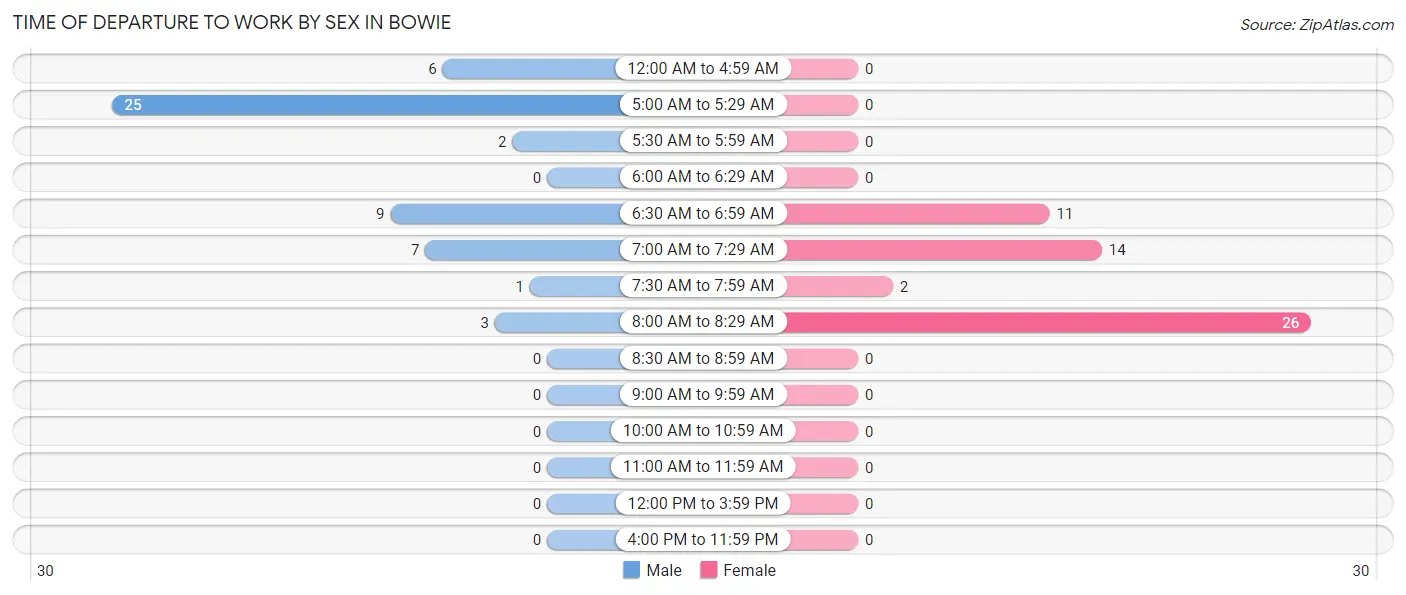
| Time of Departure | Male | Female |
| 12:00 AM to 4:59 AM | 6 (11.3%) | 0 (0.0%) |
| 5:00 AM to 5:29 AM | 25 (47.2%) | 0 (0.0%) |
| 5:30 AM to 5:59 AM | 2 (3.8%) | 0 (0.0%) |
| 6:00 AM to 6:29 AM | 0 (0.0%) | 0 (0.0%) |
| 6:30 AM to 6:59 AM | 9 (17.0%) | 11 (20.7%) |
| 7:00 AM to 7:29 AM | 7 (13.2%) | 14 (26.4%) |
| 7:30 AM to 7:59 AM | 1 (1.9%) | 2 (3.8%) |
| 8:00 AM to 8:29 AM | 3 (5.7%) | 26 (49.1%) |
| 8:30 AM to 8:59 AM | 0 (0.0%) | 0 (0.0%) |
| 9:00 AM to 9:59 AM | 0 (0.0%) | 0 (0.0%) |
| 10:00 AM to 10:59 AM | 0 (0.0%) | 0 (0.0%) |
| 11:00 AM to 11:59 AM | 0 (0.0%) | 0 (0.0%) |
| 12:00 PM to 3:59 PM | 0 (0.0%) | 0 (0.0%) |
| 4:00 PM to 11:59 PM | 0 (0.0%) | 0 (0.0%) |
| Total | 53 (100.0%) | 53 (100.0%) |
Housing Occupancy in Bowie
Occupancy by Ownership in Bowie
Of the total 148 dwellings in Bowie, owner-occupied units account for 123 (83.1%), while renter-occupied units make up 25 (16.9%).
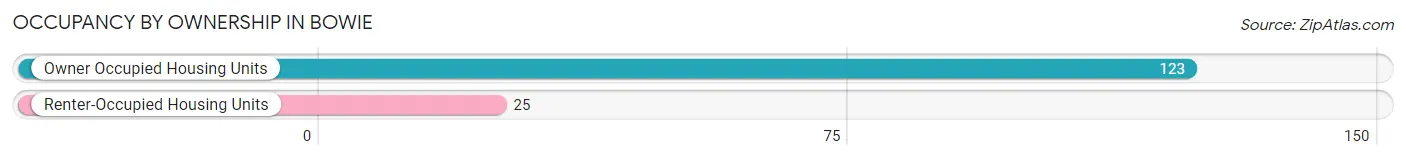
| Occupancy | # Housing Units | % Housing Units |
| Owner Occupied Housing Units | 123 | 83.1% |
| Renter-Occupied Housing Units | 25 | 16.9% |
| Total Occupied Housing Units | 148 | 100.0% |
Occupancy by Household Size in Bowie
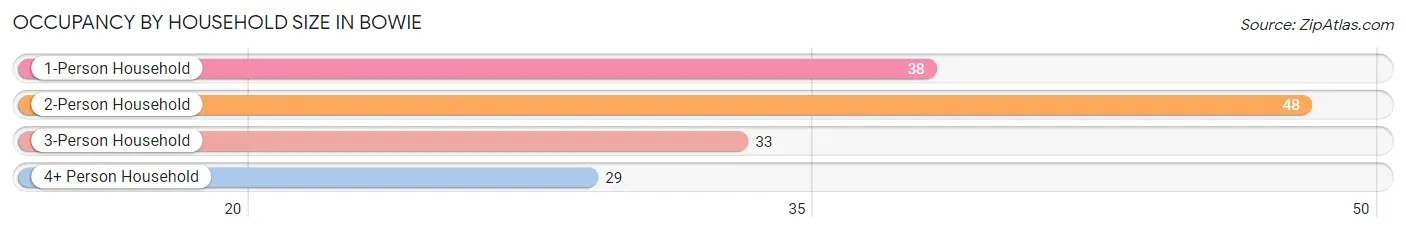
| Household Size | # Housing Units | % Housing Units |
| 1-Person Household | 38 | 25.7% |
| 2-Person Household | 48 | 32.4% |
| 3-Person Household | 33 | 22.3% |
| 4+ Person Household | 29 | 19.6% |
| Total Housing Units | 148 | 100.0% |
Occupancy by Ownership by Household Size in Bowie
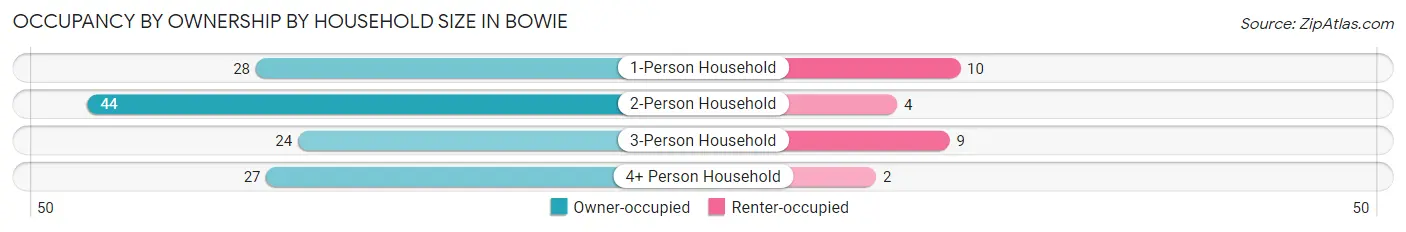
| Household Size | Owner-occupied | Renter-occupied |
| 1-Person Household | 28 (73.7%) | 10 (26.3%) |
| 2-Person Household | 44 (91.7%) | 4 (8.3%) |
| 3-Person Household | 24 (72.7%) | 9 (27.3%) |
| 4+ Person Household | 27 (93.1%) | 2 (6.9%) |
| Total Housing Units | 123 (83.1%) | 25 (16.9%) |
Occupancy by Educational Attainment in Bowie
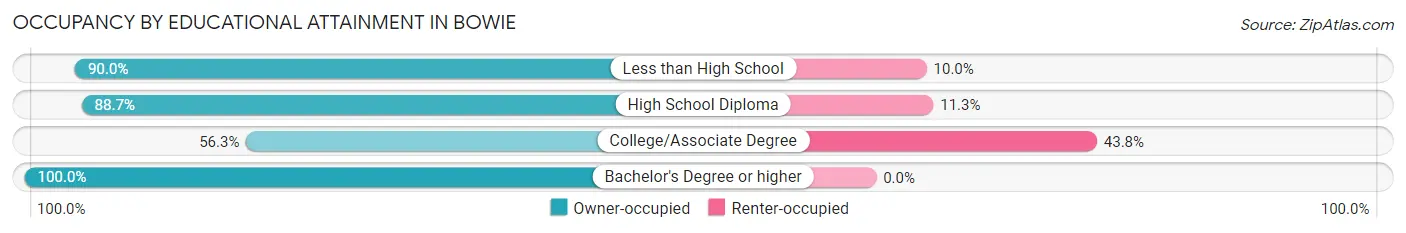
| Household Size | Owner-occupied | Renter-occupied |
| Less than High School | 45 (90.0%) | 5 (10.0%) |
| High School Diploma | 47 (88.7%) | 6 (11.3%) |
| College/Associate Degree | 18 (56.2%) | 14 (43.8%) |
| Bachelor's Degree or higher | 13 (100.0%) | 0 (0.0%) |
Occupancy by Age of Householder in Bowie
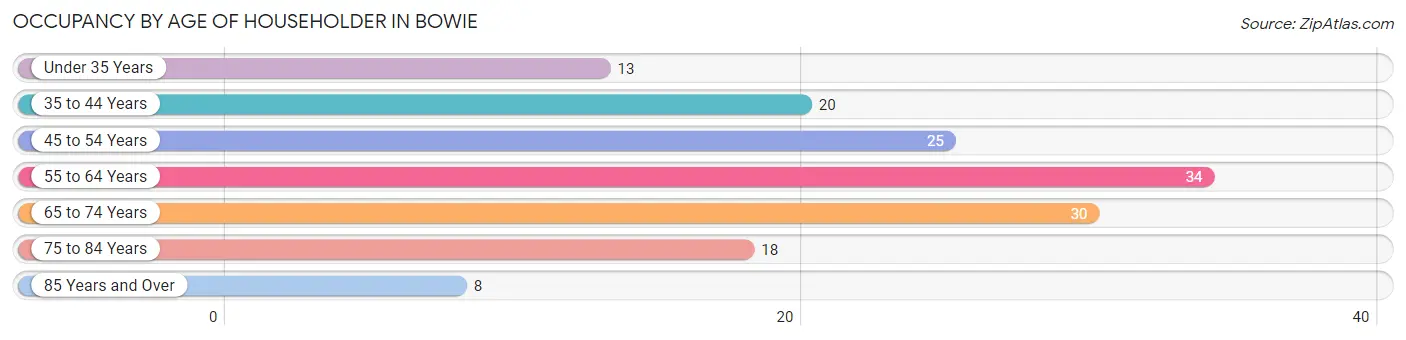
| Age Bracket | # Households | % Households |
| Under 35 Years | 13 | 8.8% |
| 35 to 44 Years | 20 | 13.5% |
| 45 to 54 Years | 25 | 16.9% |
| 55 to 64 Years | 34 | 23.0% |
| 65 to 74 Years | 30 | 20.3% |
| 75 to 84 Years | 18 | 12.2% |
| 85 Years and Over | 8 | 5.4% |
| Total | 148 | 100.0% |
Housing Finances in Bowie
Median Income by Occupancy in Bowie
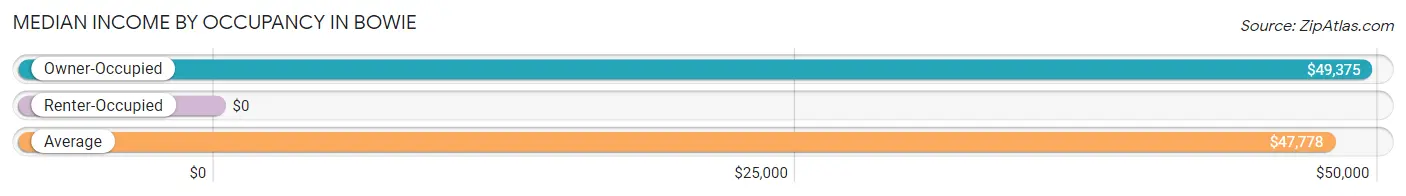
| Occupancy Type | # Households | Median Income |
| Owner-Occupied | 123 (83.1%) | $49,375 |
| Renter-Occupied | 25 (16.9%) | $0 |
| Average | 148 (100.0%) | $47,778 |
Occupancy by Householder Income Bracket in Bowie
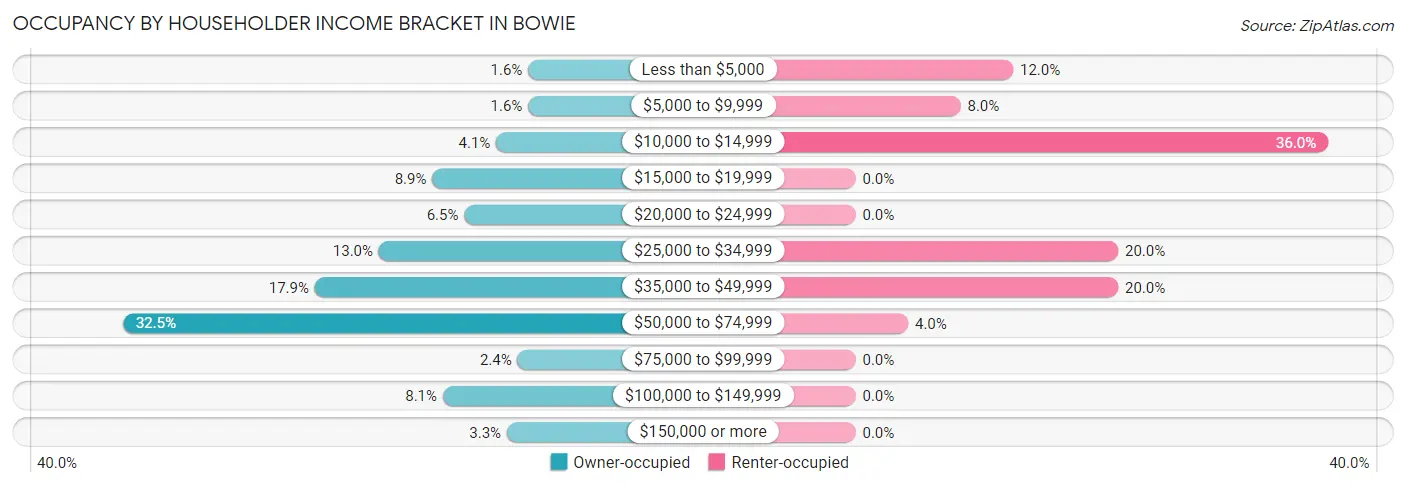
| Income Bracket | Owner-occupied | Renter-occupied |
| Less than $5,000 | 2 (1.6%) | 3 (12.0%) |
| $5,000 to $9,999 | 2 (1.6%) | 2 (8.0%) |
| $10,000 to $14,999 | 5 (4.1%) | 9 (36.0%) |
| $15,000 to $19,999 | 11 (8.9%) | 0 (0.0%) |
| $20,000 to $24,999 | 8 (6.5%) | 0 (0.0%) |
| $25,000 to $34,999 | 16 (13.0%) | 5 (20.0%) |
| $35,000 to $49,999 | 22 (17.9%) | 5 (20.0%) |
| $50,000 to $74,999 | 40 (32.5%) | 1 (4.0%) |
| $75,000 to $99,999 | 3 (2.4%) | 0 (0.0%) |
| $100,000 to $149,999 | 10 (8.1%) | 0 (0.0%) |
| $150,000 or more | 4 (3.3%) | 0 (0.0%) |
| Total | 123 (100.0%) | 25 (100.0%) |
Monthly Housing Cost Tiers in Bowie
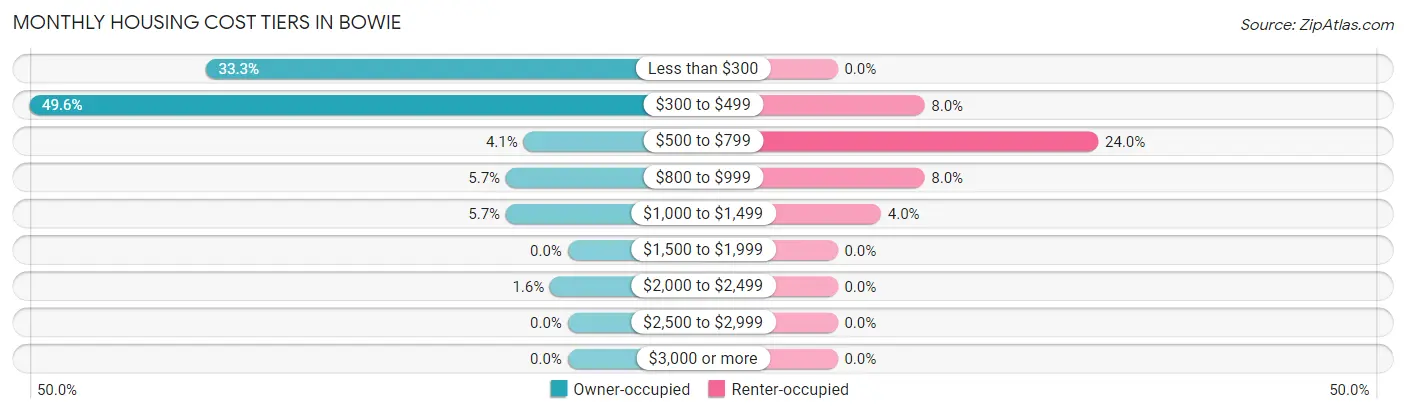
| Monthly Cost | Owner-occupied | Renter-occupied |
| Less than $300 | 41 (33.3%) | 0 (0.0%) |
| $300 to $499 | 61 (49.6%) | 2 (8.0%) |
| $500 to $799 | 5 (4.1%) | 6 (24.0%) |
| $800 to $999 | 7 (5.7%) | 2 (8.0%) |
| $1,000 to $1,499 | 7 (5.7%) | 1 (4.0%) |
| $1,500 to $1,999 | 0 (0.0%) | 0 (0.0%) |
| $2,000 to $2,499 | 2 (1.6%) | 0 (0.0%) |
| $2,500 to $2,999 | 0 (0.0%) | 0 (0.0%) |
| $3,000 or more | 0 (0.0%) | 0 (0.0%) |
| Total | 123 (100.0%) | 25 (100.0%) |
Physical Housing Characteristics in Bowie
Housing Structures in Bowie
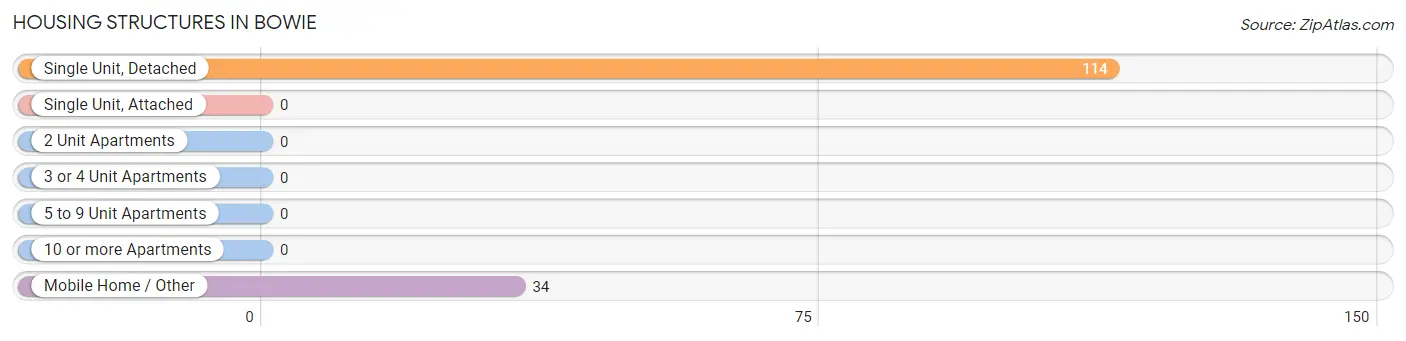
| Structure Type | # Housing Units | % Housing Units |
| Single Unit, Detached | 114 | 77.0% |
| Single Unit, Attached | 0 | 0.0% |
| 2 Unit Apartments | 0 | 0.0% |
| 3 or 4 Unit Apartments | 0 | 0.0% |
| 5 to 9 Unit Apartments | 0 | 0.0% |
| 10 or more Apartments | 0 | 0.0% |
| Mobile Home / Other | 34 | 23.0% |
| Total | 148 | 100.0% |
Housing Structures by Occupancy in Bowie
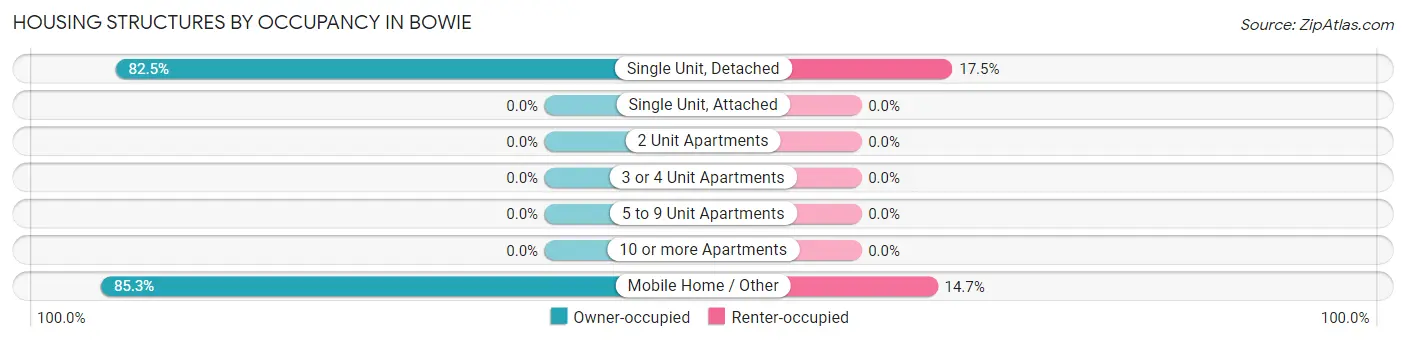
| Structure Type | Owner-occupied | Renter-occupied |
| Single Unit, Detached | 94 (82.5%) | 20 (17.5%) |
| Single Unit, Attached | 0 (0.0%) | 0 (0.0%) |
| 2 Unit Apartments | 0 (0.0%) | 0 (0.0%) |
| 3 or 4 Unit Apartments | 0 (0.0%) | 0 (0.0%) |
| 5 to 9 Unit Apartments | 0 (0.0%) | 0 (0.0%) |
| 10 or more Apartments | 0 (0.0%) | 0 (0.0%) |
| Mobile Home / Other | 29 (85.3%) | 5 (14.7%) |
| Total | 123 (83.1%) | 25 (16.9%) |
Housing Structures by Number of Rooms in Bowie
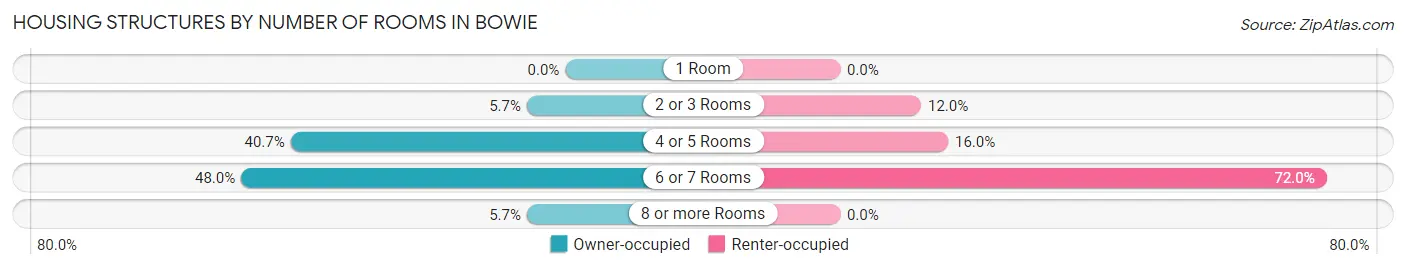
| Number of Rooms | Owner-occupied | Renter-occupied |
| 1 Room | 0 (0.0%) | 0 (0.0%) |
| 2 or 3 Rooms | 7 (5.7%) | 3 (12.0%) |
| 4 or 5 Rooms | 50 (40.6%) | 4 (16.0%) |
| 6 or 7 Rooms | 59 (48.0%) | 18 (72.0%) |
| 8 or more Rooms | 7 (5.7%) | 0 (0.0%) |
| Total | 123 (100.0%) | 25 (100.0%) |
Housing Structure by Heating Type in Bowie
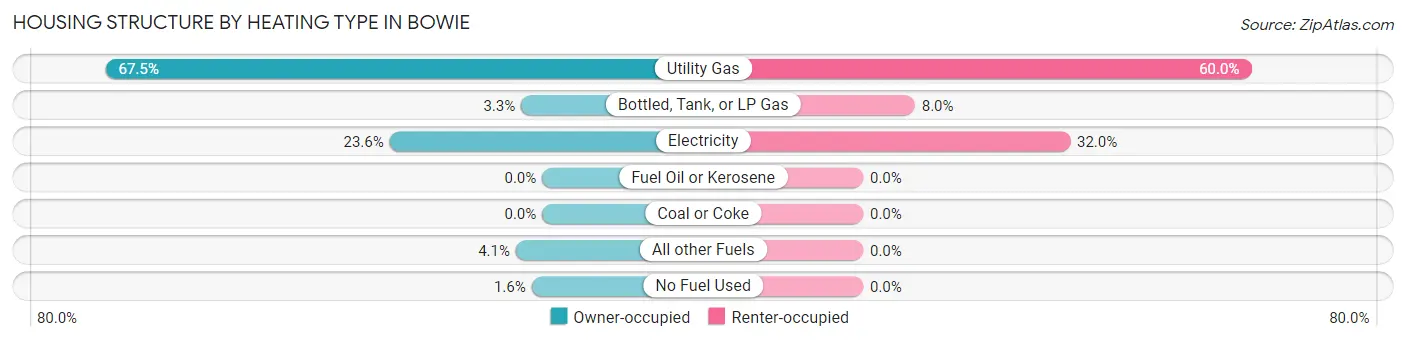
| Heating Type | Owner-occupied | Renter-occupied |
| Utility Gas | 83 (67.5%) | 15 (60.0%) |
| Bottled, Tank, or LP Gas | 4 (3.3%) | 2 (8.0%) |
| Electricity | 29 (23.6%) | 8 (32.0%) |
| Fuel Oil or Kerosene | 0 (0.0%) | 0 (0.0%) |
| Coal or Coke | 0 (0.0%) | 0 (0.0%) |
| All other Fuels | 5 (4.1%) | 0 (0.0%) |
| No Fuel Used | 2 (1.6%) | 0 (0.0%) |
| Total | 123 (100.0%) | 25 (100.0%) |
Household Vehicle Usage in Bowie
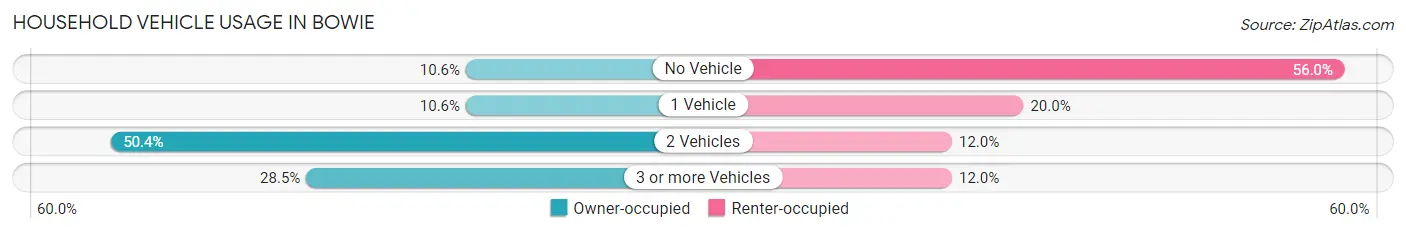
| Vehicles per Household | Owner-occupied | Renter-occupied |
| No Vehicle | 13 (10.6%) | 14 (56.0%) |
| 1 Vehicle | 13 (10.6%) | 5 (20.0%) |
| 2 Vehicles | 62 (50.4%) | 3 (12.0%) |
| 3 or more Vehicles | 35 (28.5%) | 3 (12.0%) |
| Total | 123 (100.0%) | 25 (100.0%) |
Real Estate & Mortgages in Bowie
Real Estate and Mortgage Overview in Bowie
| Characteristic | Without Mortgage | With Mortgage |
| Housing Units | 95 | 28 |
| Median Property Value | $48,300 | $74,500 |
| Median Household Income | $48,977 | $2 |
| Monthly Housing Costs | $317 | $0 |
| Real Estate Taxes | $667 | $0 |
Property Value by Mortgage Status in Bowie
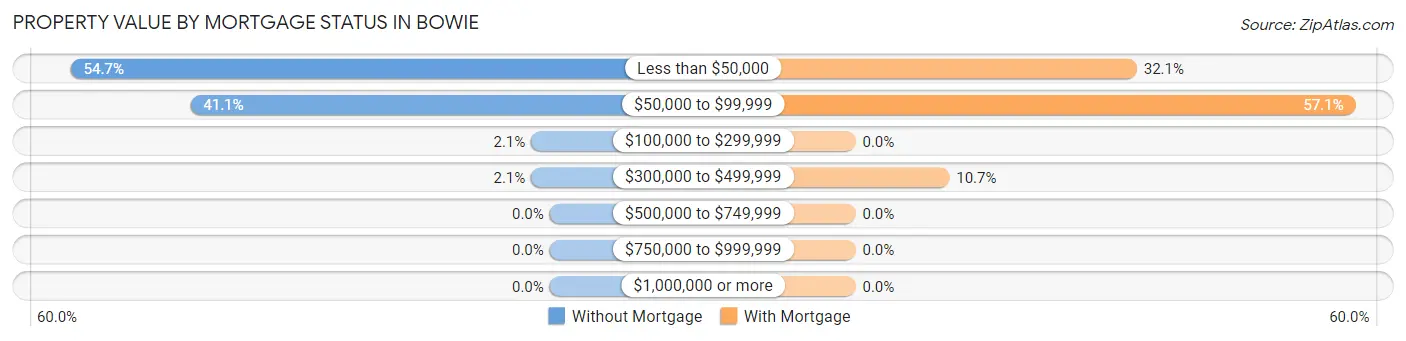
| Property Value | Without Mortgage | With Mortgage |
| Less than $50,000 | 52 (54.7%) | 9 (32.1%) |
| $50,000 to $99,999 | 39 (41.0%) | 16 (57.1%) |
| $100,000 to $299,999 | 2 (2.1%) | 0 (0.0%) |
| $300,000 to $499,999 | 2 (2.1%) | 3 (10.7%) |
| $500,000 to $749,999 | 0 (0.0%) | 0 (0.0%) |
| $750,000 to $999,999 | 0 (0.0%) | 0 (0.0%) |
| $1,000,000 or more | 0 (0.0%) | 0 (0.0%) |
| Total | 95 (100.0%) | 28 (100.0%) |
Household Income by Mortgage Status in Bowie
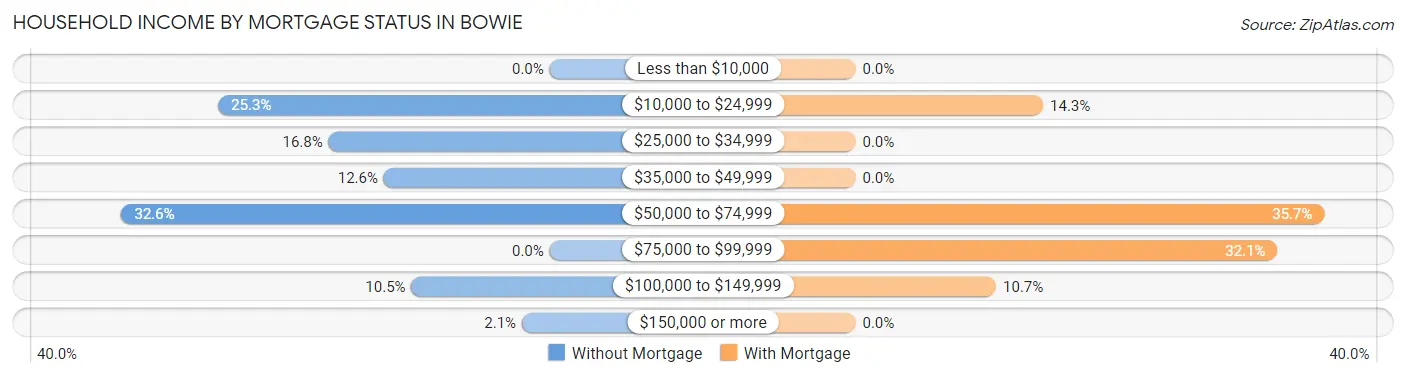
| Household Income | Without Mortgage | With Mortgage |
| Less than $10,000 | 0 (0.0%) | 0 (0.0%) |
| $10,000 to $24,999 | 24 (25.3%) | 4 (14.3%) |
| $25,000 to $34,999 | 16 (16.8%) | 0 (0.0%) |
| $35,000 to $49,999 | 12 (12.6%) | 0 (0.0%) |
| $50,000 to $74,999 | 31 (32.6%) | 10 (35.7%) |
| $75,000 to $99,999 | 0 (0.0%) | 9 (32.1%) |
| $100,000 to $149,999 | 10 (10.5%) | 3 (10.7%) |
| $150,000 or more | 2 (2.1%) | 0 (0.0%) |
| Total | 95 (100.0%) | 28 (100.0%) |
Property Value to Household Income Ratio in Bowie
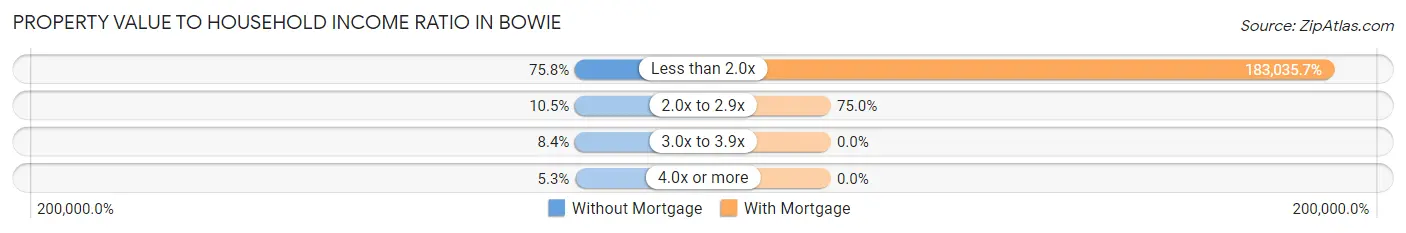
| Value-to-Income Ratio | Without Mortgage | With Mortgage |
| Less than 2.0x | 72 (75.8%) | 51,250 (183,035.7%) |
| 2.0x to 2.9x | 10 (10.5%) | 21 (75.0%) |
| 3.0x to 3.9x | 8 (8.4%) | 0 (0.0%) |
| 4.0x or more | 5 (5.3%) | 0 (0.0%) |
| Total | 95 (100.0%) | 28 (100.0%) |
Real Estate Taxes by Mortgage Status in Bowie
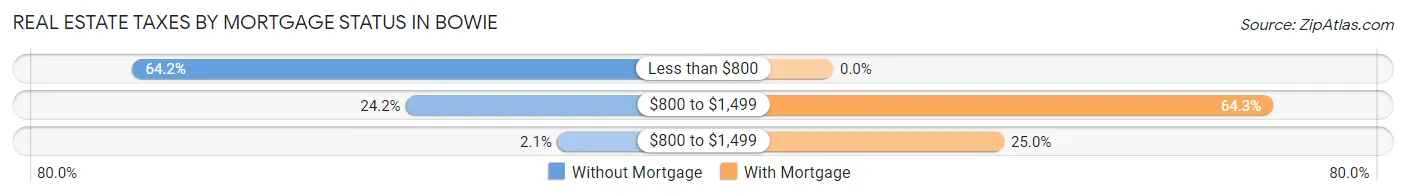
| Property Taxes | Without Mortgage | With Mortgage |
| Less than $800 | 61 (64.2%) | 0 (0.0%) |
| $800 to $1,499 | 23 (24.2%) | 18 (64.3%) |
| $800 to $1,499 | 2 (2.1%) | 7 (25.0%) |
| Total | 95 (100.0%) | 28 (100.0%) |
Health & Disability in Bowie
Health Insurance Coverage by Age in Bowie
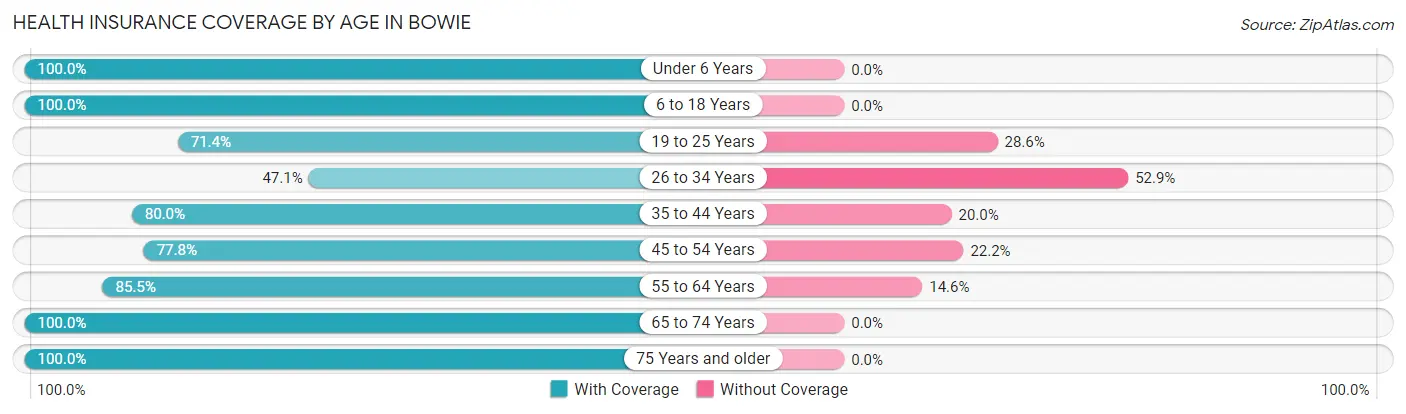
| Age Bracket | With Coverage | Without Coverage |
| Under 6 Years | 30 (100.0%) | 0 (0.0%) |
| 6 to 18 Years | 73 (100.0%) | 0 (0.0%) |
| 19 to 25 Years | 25 (71.4%) | 10 (28.6%) |
| 26 to 34 Years | 24 (47.1%) | 27 (52.9%) |
| 35 to 44 Years | 32 (80.0%) | 8 (20.0%) |
| 45 to 54 Years | 35 (77.8%) | 10 (22.2%) |
| 55 to 64 Years | 47 (85.5%) | 8 (14.5%) |
| 65 to 74 Years | 70 (100.0%) | 0 (0.0%) |
| 75 Years and older | 39 (100.0%) | 0 (0.0%) |
| Total | 375 (85.6%) | 63 (14.4%) |
Health Insurance Coverage by Citizenship Status in Bowie
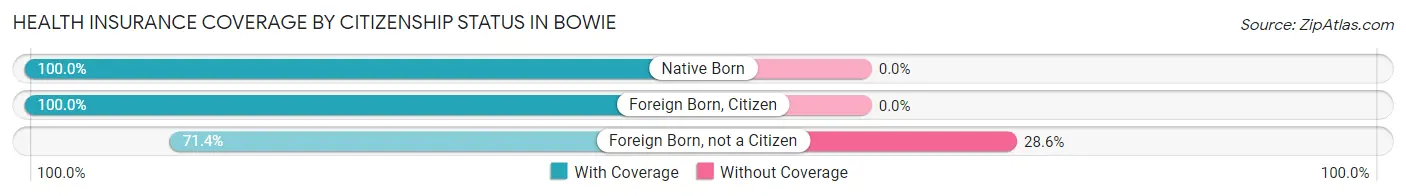
| Citizenship Status | With Coverage | Without Coverage |
| Native Born | 30 (100.0%) | 0 (0.0%) |
| Foreign Born, Citizen | 73 (100.0%) | 0 (0.0%) |
| Foreign Born, not a Citizen | 25 (71.4%) | 10 (28.6%) |
Health Insurance Coverage by Household Income in Bowie
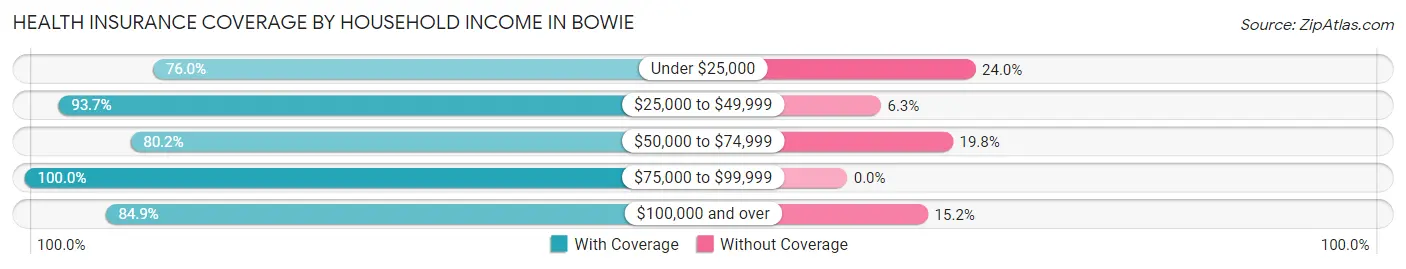
| Household Income | With Coverage | Without Coverage |
| Under $25,000 | 79 (76.0%) | 25 (24.0%) |
| $25,000 to $49,999 | 178 (93.7%) | 12 (6.3%) |
| $50,000 to $74,999 | 85 (80.2%) | 21 (19.8%) |
| $75,000 to $99,999 | 5 (100.0%) | 0 (0.0%) |
| $100,000 and over | 28 (84.9%) | 5 (15.1%) |
Public vs Private Health Insurance Coverage by Age in Bowie
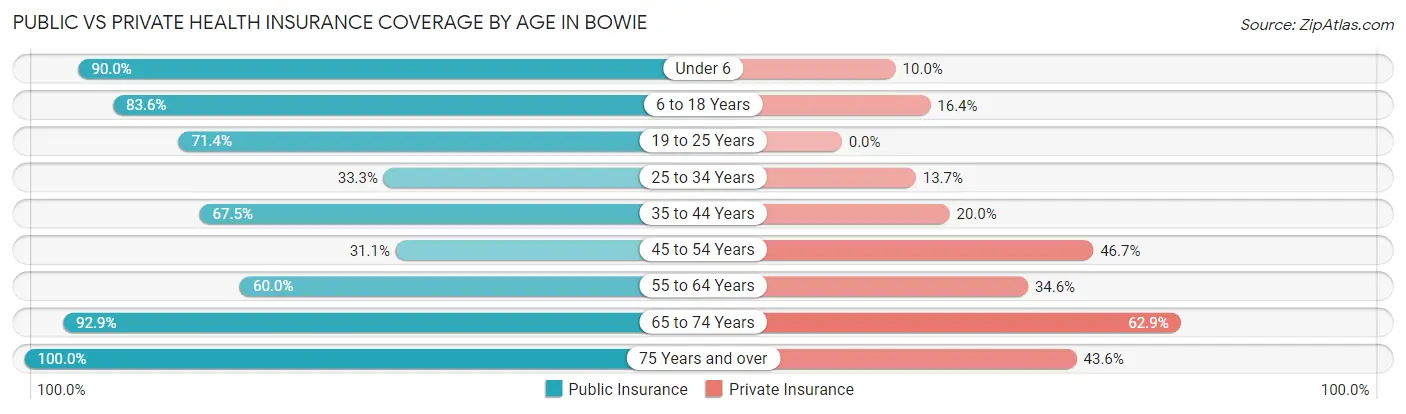
| Age Bracket | Public Insurance | Private Insurance |
| Under 6 | 27 (90.0%) | 3 (10.0%) |
| 6 to 18 Years | 61 (83.6%) | 12 (16.4%) |
| 19 to 25 Years | 25 (71.4%) | 0 (0.0%) |
| 25 to 34 Years | 17 (33.3%) | 7 (13.7%) |
| 35 to 44 Years | 27 (67.5%) | 8 (20.0%) |
| 45 to 54 Years | 14 (31.1%) | 21 (46.7%) |
| 55 to 64 Years | 33 (60.0%) | 19 (34.5%) |
| 65 to 74 Years | 65 (92.9%) | 44 (62.9%) |
| 75 Years and over | 39 (100.0%) | 17 (43.6%) |
| Total | 308 (70.3%) | 131 (29.9%) |
Disability Status by Sex by Age in Bowie
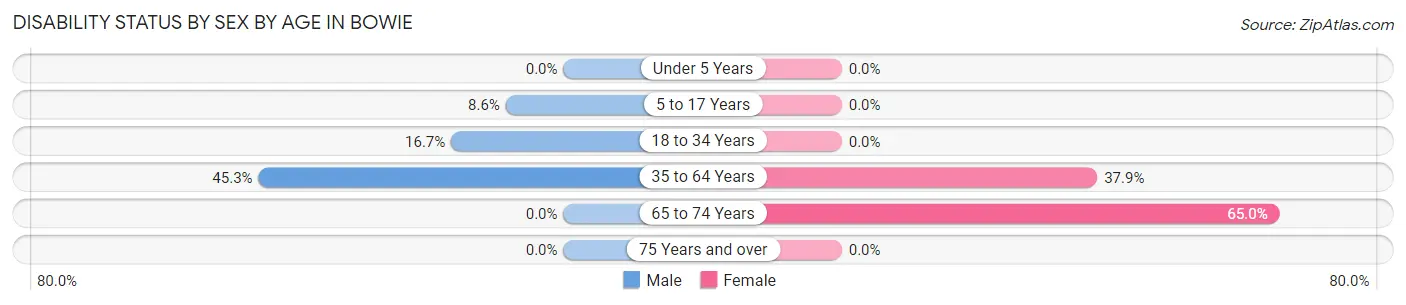
| Age Bracket | Male | Female |
| Under 5 Years | 0 (0.0%) | 0 (0.0%) |
| 5 to 17 Years | 3 (8.6%) | 0 (0.0%) |
| 18 to 34 Years | 10 (16.7%) | 0 (0.0%) |
| 35 to 64 Years | 24 (45.3%) | 33 (37.9%) |
| 65 to 74 Years | 0 (0.0%) | 26 (65.0%) |
| 75 Years and over | 0 (0.0%) | 0 (0.0%) |
Disability Class by Sex by Age in Bowie
Disability Class: Hearing Difficulty
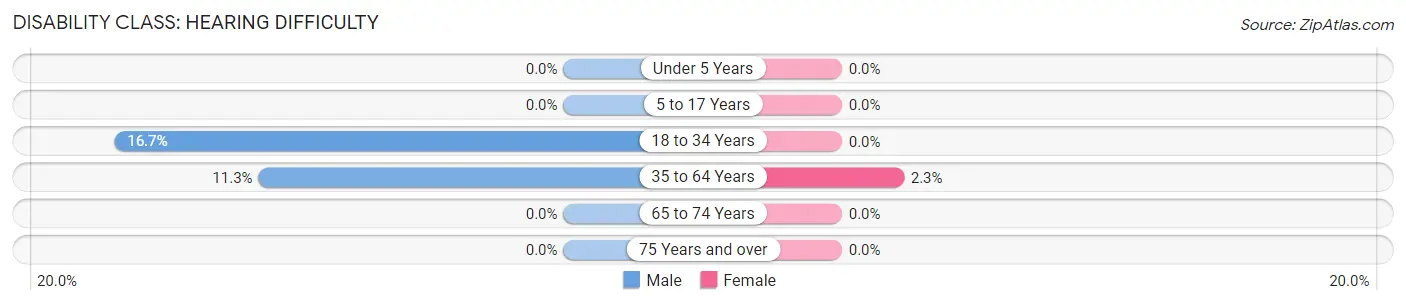
| Age Bracket | Male | Female |
| Under 5 Years | 0 (0.0%) | 0 (0.0%) |
| 5 to 17 Years | 0 (0.0%) | 0 (0.0%) |
| 18 to 34 Years | 10 (16.7%) | 0 (0.0%) |
| 35 to 64 Years | 6 (11.3%) | 2 (2.3%) |
| 65 to 74 Years | 0 (0.0%) | 0 (0.0%) |
| 75 Years and over | 0 (0.0%) | 0 (0.0%) |
Disability Class: Vision Difficulty
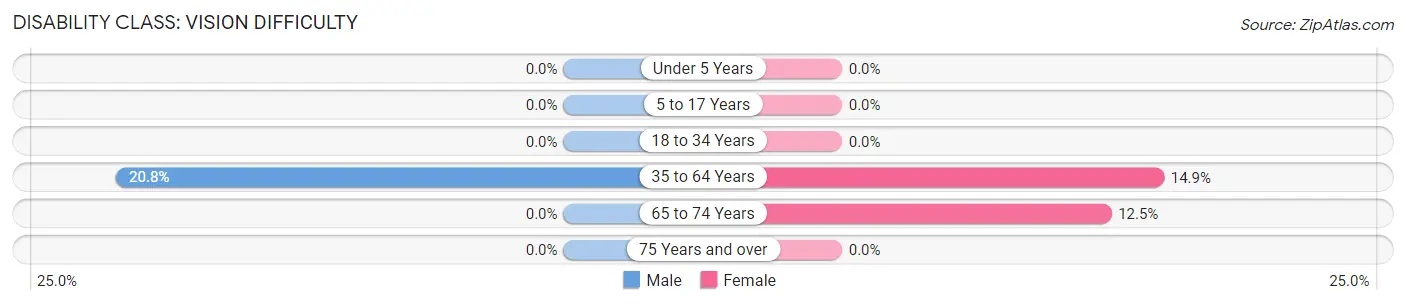
| Age Bracket | Male | Female |
| Under 5 Years | 0 (0.0%) | 0 (0.0%) |
| 5 to 17 Years | 0 (0.0%) | 0 (0.0%) |
| 18 to 34 Years | 0 (0.0%) | 0 (0.0%) |
| 35 to 64 Years | 11 (20.7%) | 13 (14.9%) |
| 65 to 74 Years | 0 (0.0%) | 5 (12.5%) |
| 75 Years and over | 0 (0.0%) | 0 (0.0%) |
Disability Class: Cognitive Difficulty
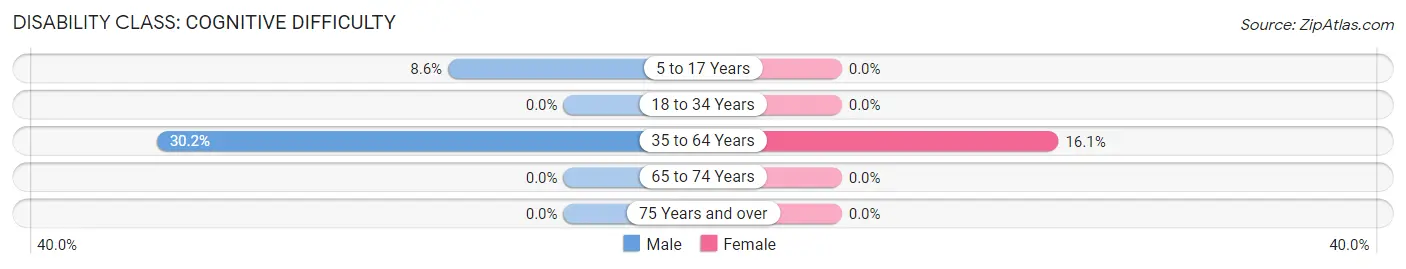
| Age Bracket | Male | Female |
| 5 to 17 Years | 3 (8.6%) | 0 (0.0%) |
| 18 to 34 Years | 0 (0.0%) | 0 (0.0%) |
| 35 to 64 Years | 16 (30.2%) | 14 (16.1%) |
| 65 to 74 Years | 0 (0.0%) | 0 (0.0%) |
| 75 Years and over | 0 (0.0%) | 0 (0.0%) |
Disability Class: Ambulatory Difficulty
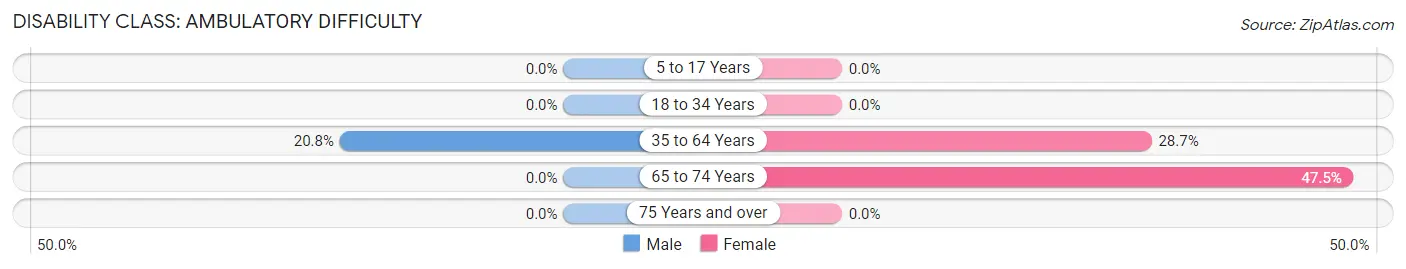
| Age Bracket | Male | Female |
| 5 to 17 Years | 0 (0.0%) | 0 (0.0%) |
| 18 to 34 Years | 0 (0.0%) | 0 (0.0%) |
| 35 to 64 Years | 11 (20.7%) | 25 (28.7%) |
| 65 to 74 Years | 0 (0.0%) | 19 (47.5%) |
| 75 Years and over | 0 (0.0%) | 0 (0.0%) |
Disability Class: Self-Care Difficulty
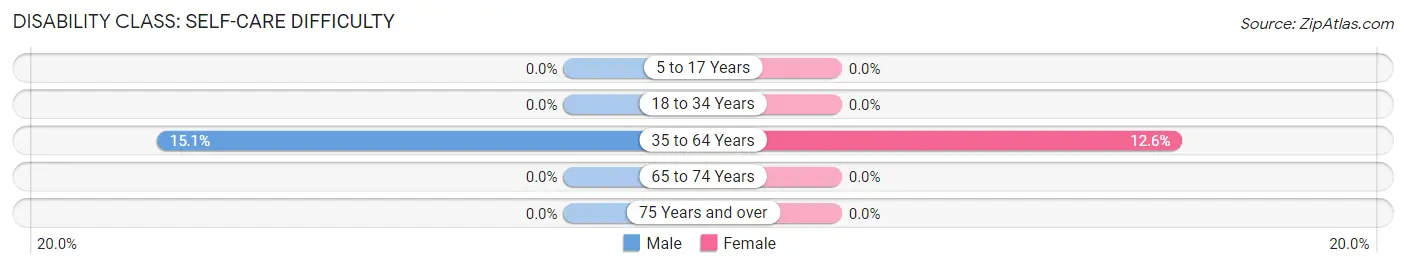
| Age Bracket | Male | Female |
| 5 to 17 Years | 0 (0.0%) | 0 (0.0%) |
| 18 to 34 Years | 0 (0.0%) | 0 (0.0%) |
| 35 to 64 Years | 8 (15.1%) | 11 (12.6%) |
| 65 to 74 Years | 0 (0.0%) | 0 (0.0%) |
| 75 Years and over | 0 (0.0%) | 0 (0.0%) |
Technology Access in Bowie
Computing Device Access in Bowie
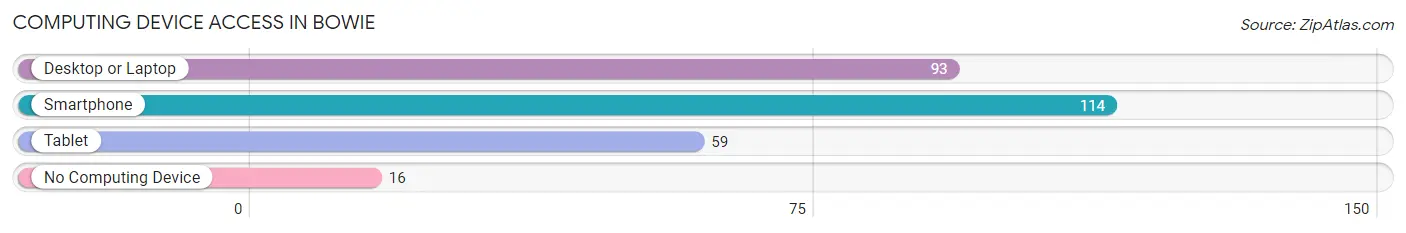
| Device Type | # Households | % Households |
| Desktop or Laptop | 93 | 62.8% |
| Smartphone | 114 | 77.0% |
| Tablet | 59 | 39.9% |
| No Computing Device | 16 | 10.8% |
| Total | 148 | 100.0% |
Internet Access in Bowie
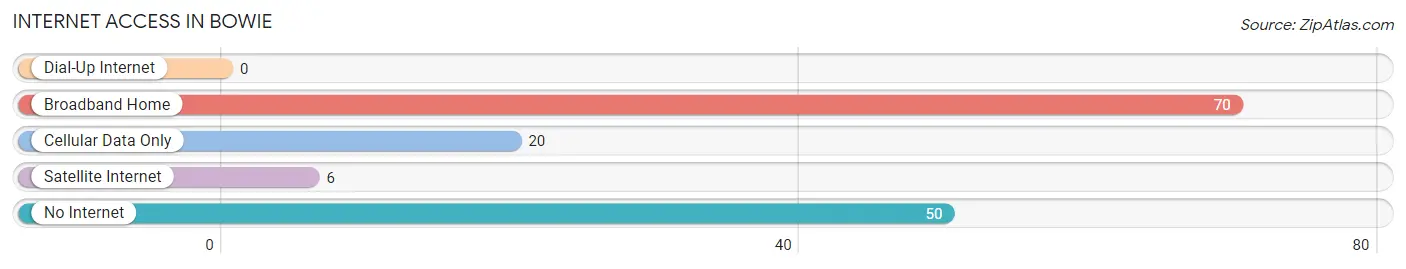
| Internet Type | # Households | % Households |
| Dial-Up Internet | 0 | 0.0% |
| Broadband Home | 70 | 47.3% |
| Cellular Data Only | 20 | 13.5% |
| Satellite Internet | 6 | 4.1% |
| No Internet | 50 | 33.8% |
| Total | 148 | 100.0% |
Bowie Summary
Bowie, Arizona is a small town located in Cochise County in the southeastern corner of the state. It is situated on the banks of the San Simon River, approximately 30 miles east of the New Mexico border. The town was founded in 1881 and named after the famous frontiersman Jim Bowie. It is the county seat of Cochise County and has a population of approximately 5,000 people.
Geography
Bowie is located in the Chihuahuan Desert, which is characterized by hot, dry summers and mild winters. The town is situated at an elevation of 4,000 feet and is surrounded by rolling hills and mountains. The San Simon River runs through the town and provides a source of water for the area. The town is located in the Sulphur Springs Valley, which is known for its agricultural production.
Economy
The economy of Bowie is largely based on agriculture. The town is home to a number of farms and ranches that produce a variety of crops, including cotton, alfalfa, and wheat. The town is also home to a number of businesses, including a lumber yard, a feed store, and a hardware store.
Demographics
As of the 2010 census, the population of Bowie was 5,053. The racial makeup of the town was 81.3% White, 0.7% African American, 0.7% Native American, 0.3% Asian, 0.1% Pacific Islander, 15.2% from other races, and 1.9% from two or more races. Hispanic or Latino of any race were 33.2% of the population.
The median income for a household in Bowie was $30,938, and the median income for a family was $35,938. The per capita income for the town was $14,938. About 18.2% of families and 22.2% of the population were below the poverty line, including 28.2% of those under age 18 and 11.2% of those age 65 or over.
Conclusion
Bowie, Arizona is a small town located in Cochise County in the southeastern corner of the state. It is situated on the banks of the San Simon River and is the county seat of Cochise County. The town was founded in 1881 and has a population of approximately 5,000 people. The economy of Bowie is largely based on agriculture, and the town is home to a number of businesses. The racial makeup of the town is predominantly White, with a significant Hispanic or Latino population. The median income for a household in Bowie is lower than the national average, and a significant portion of the population is below the poverty line.
Common Questions
What is Per Capita Income in Bowie?
Per Capita income in Bowie is $19,024.
What is the Median Family Income in Bowie?
Median Family Income in Bowie is $48,750.
What is the Median Household income in Bowie?
Median Household Income in Bowie is $47,778.
What is Inequality or Gini Index in Bowie?
Inequality or Gini Index in Bowie is 0.45.
What is the Total Population of Bowie?
Total Population of Bowie is 438.
What is the Total Male Population of Bowie?
Total Male Population of Bowie is 210.
What is the Total Female Population of Bowie?
Total Female Population of Bowie is 228.
What is the Ratio of Males per 100 Females in Bowie?
There are 92.11 Males per 100 Females in Bowie.
What is the Ratio of Females per 100 Males in Bowie?
There are 108.57 Females per 100 Males in Bowie.
What is the Median Population Age in Bowie?
Median Population Age in Bowie is 43.5 Years.
What is the Average Family Size in Bowie
Average Family Size in Bowie is 3.5 People.
What is the Average Household Size in Bowie
Average Household Size in Bowie is 3.0 People.
How Large is the Labor Force in Bowie?
There are 128 People in the Labor Forcein in Bowie.
What is the Percentage of People in the Labor Force in Bowie?
37.1% of People are in the Labor Force in Bowie.
What is the Unemployment Rate in Bowie?
Unemployment Rate in Bowie is 3.9%.