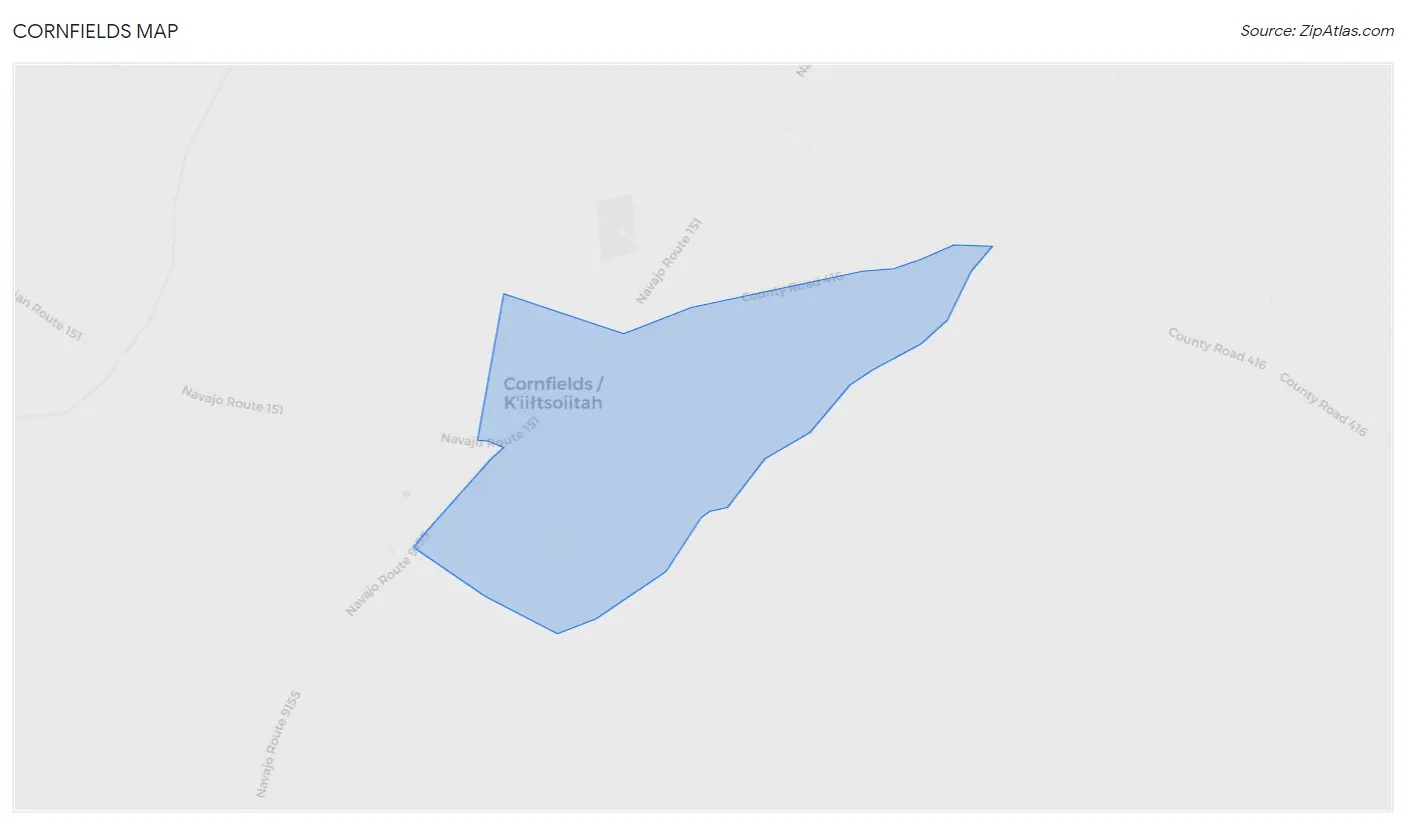
Cornfields, AZ Map & Demographics
Cornfields Map
Cornfields Overview
$10,974
PER CAPITA INCOME
$12,125
AVG FAMILY INCOME
$21,343
AVG HOUSEHOLD INCOME
20.0%
WAGE / INCOME GAP [ % ]
80.0¢/ $1
WAGE / INCOME GAP [ $ ]
0.55
INEQUALITY / GINI INDEX
281
TOTAL POPULATION
126
MALE POPULATION
155
FEMALE POPULATION
81.29
MALES / 100 FEMALES
123.02
FEMALES / 100 MALES
28.2
MEDIAN AGE
4.8
AVG FAMILY SIZE
4.7
AVG HOUSEHOLD SIZE
51
LABOR FORCE [ PEOPLE ]
25.8%
PERCENT IN LABOR FORCE
9.8%
UNEMPLOYMENT RATE
Income in Cornfields
Income Overview in Cornfields
Per Capita Income in Cornfields is $10,974, while median incomes of families and households are $12,125 and $21,343 respectively.
| Characteristic | Number | Measure |
| Per Capita Income | 281 | $10,974 |
| Median Family Income | 52 | $12,125 |
| Mean Family Income | 52 | $35,000 |
| Median Household Income | 57 | $21,343 |
| Mean Household Income | 57 | $37,393 |
| Income Deficit | 52 | $0 |
| Wage / Income Gap (%) | 281 | 20.00% |
| Wage / Income Gap ($) | 281 | 80.00¢ per $1 |
| Gini / Inequality Index | 281 | 0.55 |
Earnings by Sex in Cornfields
Average Earnings in Cornfields are $45,486, $45,982 for men and $36,786 for women, a difference of 20.0%.
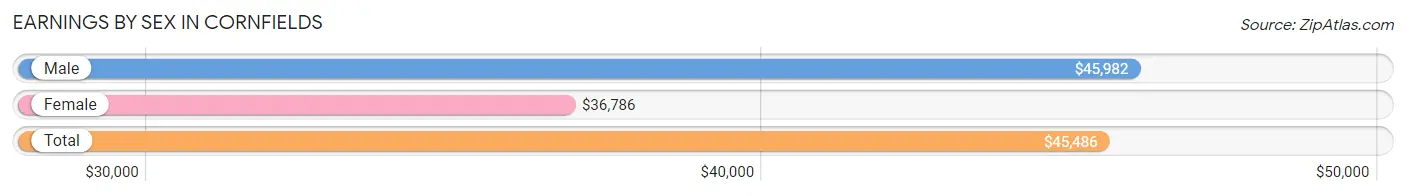
| Sex | Number | Average Earnings |
| Male | 29 (54.7%) | $45,982 |
| Female | 24 (45.3%) | $36,786 |
| Total | 53 (100.0%) | $45,486 |
Earnings by Sex by Income Bracket in Cornfields
The most common earnings brackets in Cornfields are $45,000 to $49,999 for men (14 | 48.3%) and $7,500 to $9,999 for women (7 | 29.2%).
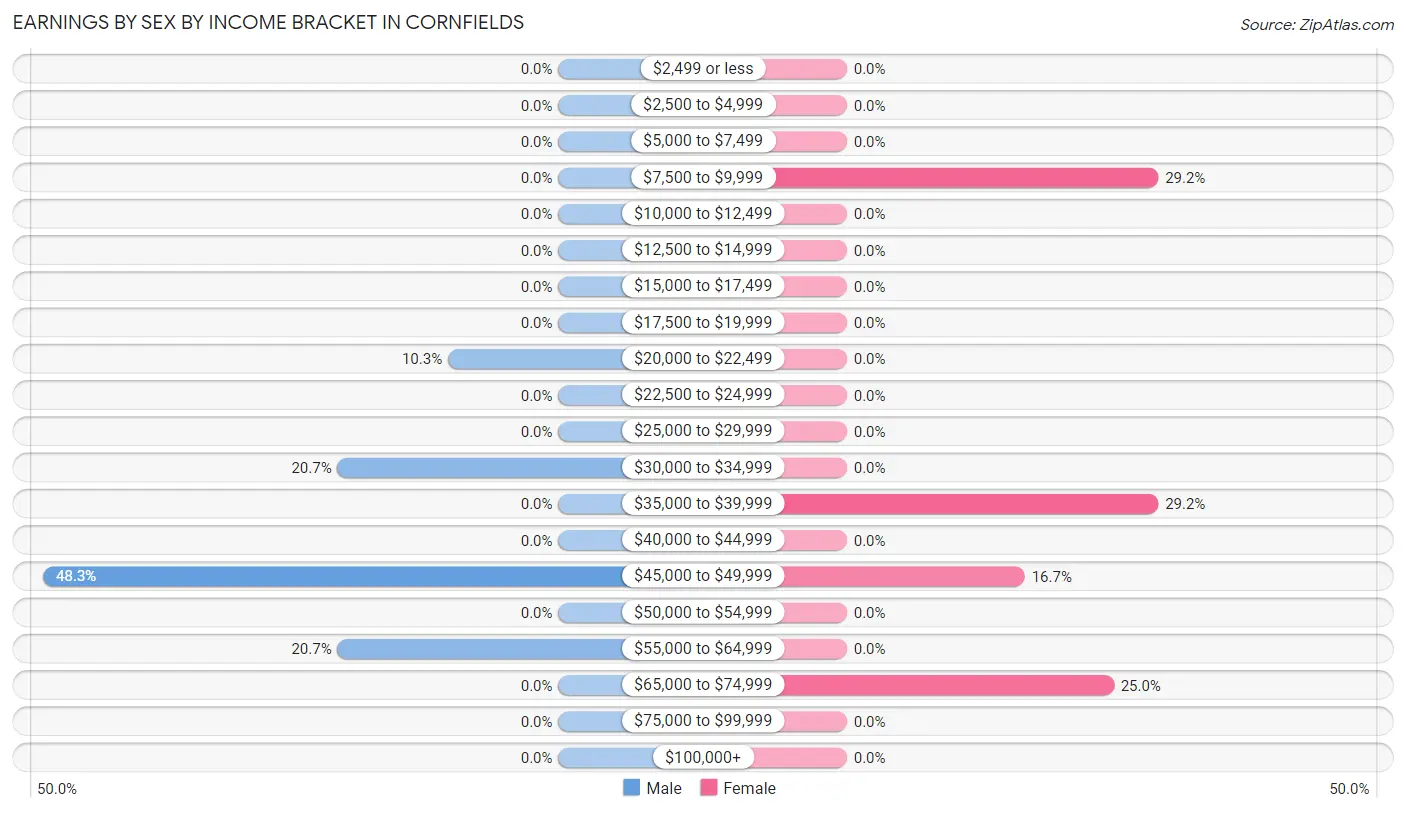
| Income | Male | Female |
| $2,499 or less | 0 (0.0%) | 0 (0.0%) |
| $2,500 to $4,999 | 0 (0.0%) | 0 (0.0%) |
| $5,000 to $7,499 | 0 (0.0%) | 0 (0.0%) |
| $7,500 to $9,999 | 0 (0.0%) | 7 (29.2%) |
| $10,000 to $12,499 | 0 (0.0%) | 0 (0.0%) |
| $12,500 to $14,999 | 0 (0.0%) | 0 (0.0%) |
| $15,000 to $17,499 | 0 (0.0%) | 0 (0.0%) |
| $17,500 to $19,999 | 0 (0.0%) | 0 (0.0%) |
| $20,000 to $22,499 | 3 (10.3%) | 0 (0.0%) |
| $22,500 to $24,999 | 0 (0.0%) | 0 (0.0%) |
| $25,000 to $29,999 | 0 (0.0%) | 0 (0.0%) |
| $30,000 to $34,999 | 6 (20.7%) | 0 (0.0%) |
| $35,000 to $39,999 | 0 (0.0%) | 7 (29.2%) |
| $40,000 to $44,999 | 0 (0.0%) | 0 (0.0%) |
| $45,000 to $49,999 | 14 (48.3%) | 4 (16.7%) |
| $50,000 to $54,999 | 0 (0.0%) | 0 (0.0%) |
| $55,000 to $64,999 | 6 (20.7%) | 0 (0.0%) |
| $65,000 to $74,999 | 0 (0.0%) | 6 (25.0%) |
| $75,000 to $99,999 | 0 (0.0%) | 0 (0.0%) |
| $100,000+ | 0 (0.0%) | 0 (0.0%) |
| Total | 29 (100.0%) | 24 (100.0%) |
Earnings by Sex by Educational Attainment in Cornfields
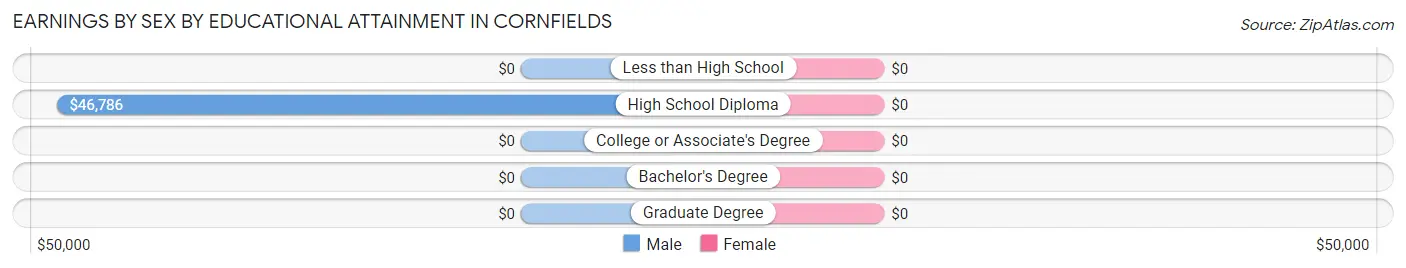
| Educational Attainment | Male Income | Female Income |
| Less than High School | - | - |
| High School Diploma | $46,786 | $0 |
| College or Associate's Degree | - | - |
| Bachelor's Degree | - | - |
| Graduate Degree | - | - |
| Total | $46,339 | $36,786 |
Family Income in Cornfields
Family Income Brackets in Cornfields
According to the Cornfields family income data, there are 20 families falling into the $10,000 to $14,999 income range, which is the most common income bracket and makes up 38.5% of all families.
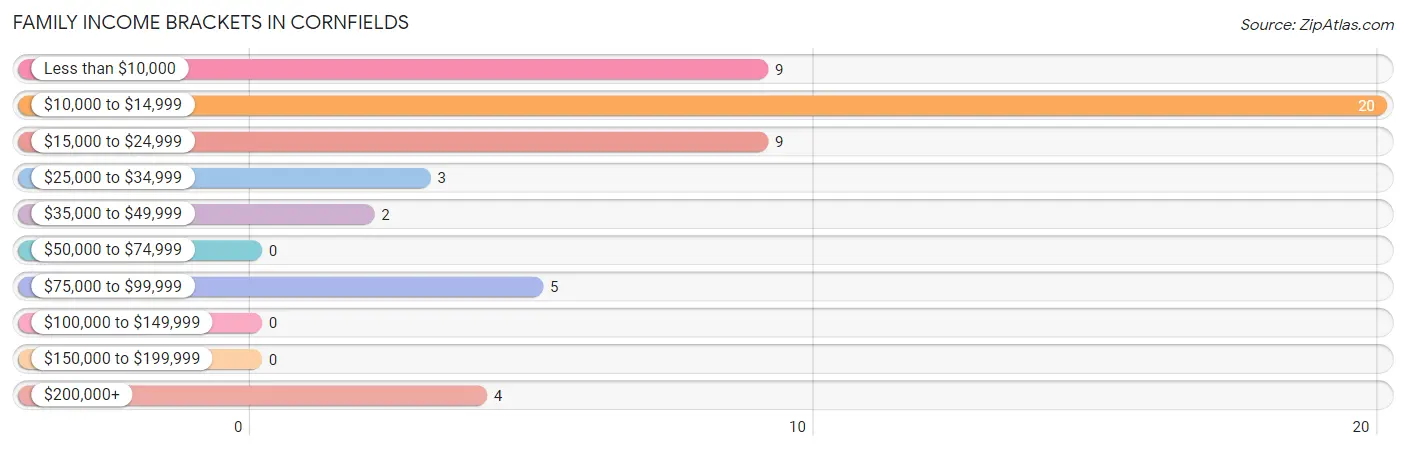
| Income Bracket | # Families | % Families |
| Less than $10,000 | 9 | 17.3% |
| $10,000 to $14,999 | 20 | 38.5% |
| $15,000 to $24,999 | 9 | 17.3% |
| $25,000 to $34,999 | 3 | 5.8% |
| $35,000 to $49,999 | 2 | 3.8% |
| $50,000 to $74,999 | 0 | 0.0% |
| $75,000 to $99,999 | 5 | 9.6% |
| $100,000 to $149,999 | 0 | 0.0% |
| $150,000 to $199,999 | 0 | 0.0% |
| $200,000+ | 4 | 7.7% |
Family Income by Famaliy Size in Cornfields
| Income Bracket | # Families | Median Income |
| 2-Person Families | 5 (9.6%) | $0 |
| 3-Person Families | 4 (7.7%) | $0 |
| 4-Person Families | 16 (30.8%) | $0 |
| 5-Person Families | 0 (0.0%) | $0 |
| 6-Person Families | 4 (7.7%) | $0 |
| 7+ Person Families | 23 (44.2%) | $0 |
| Total | 52 (100.0%) | $12,125 |
Family Income by Number of Earners in Cornfields
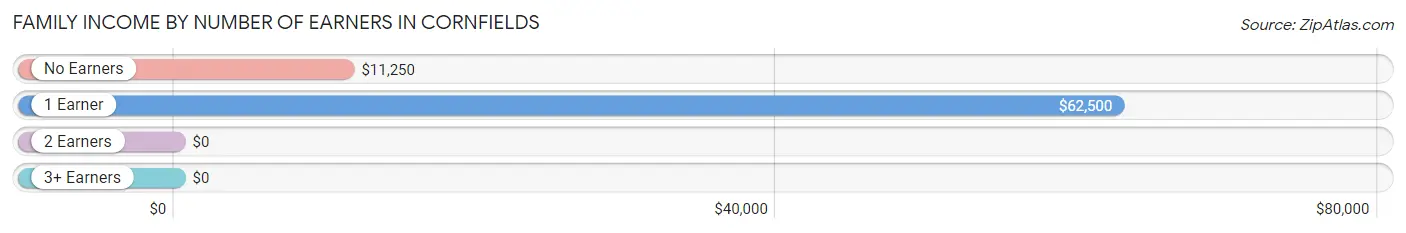
| Number of Earners | # Families | Median Income |
| No Earners | 38 (73.1%) | $11,250 |
| 1 Earner | 10 (19.2%) | $62,500 |
| 2 Earners | 0 (0.0%) | $0 |
| 3+ Earners | 4 (7.7%) | $0 |
| Total | 52 (100.0%) | $12,125 |
Household Income in Cornfields
Household Income Brackets in Cornfields
With 29 households falling in the category, the $15,000 to $24,999 income range is the most frequent in Cornfields, accounting for 50.9% of all households.
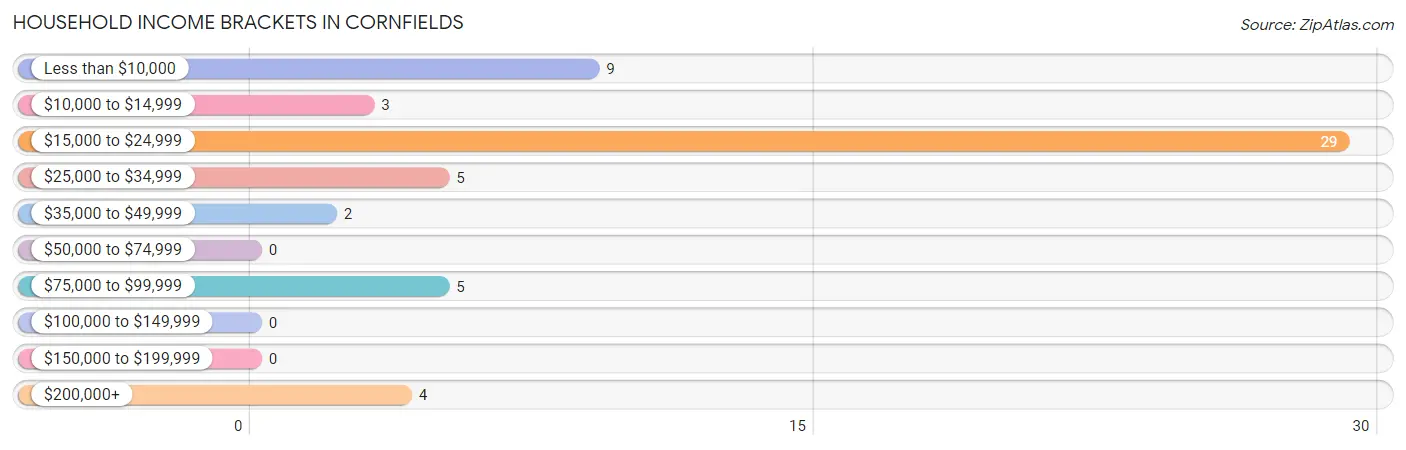
| Income Bracket | # Households | % Households |
| Less than $10,000 | 9 | 15.8% |
| $10,000 to $14,999 | 3 | 5.3% |
| $15,000 to $24,999 | 29 | 50.9% |
| $25,000 to $34,999 | 5 | 8.8% |
| $35,000 to $49,999 | 2 | 3.5% |
| $50,000 to $74,999 | 0 | 0.0% |
| $75,000 to $99,999 | 5 | 8.8% |
| $100,000 to $149,999 | 0 | 0.0% |
| $150,000 to $199,999 | 0 | 0.0% |
| $200,000+ | 4 | 7.0% |
Household Income by Householder Age in Cornfields
The median household income in Cornfields is $21,343, with the highest median household income of $21,563 found in the 65+ years age bracket for the primary householder. A total of 39 households (68.4%) fall into this category.
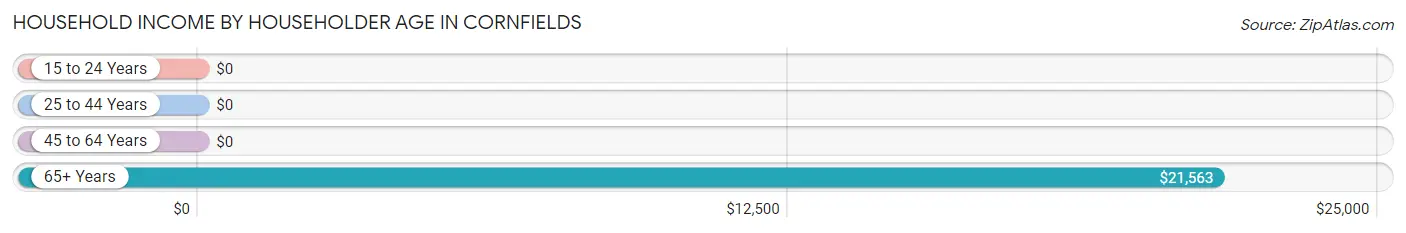
| Income Bracket | # Households | Median Income |
| 15 to 24 Years | 0 (0.0%) | $0 |
| 25 to 44 Years | 14 (24.6%) | $0 |
| 45 to 64 Years | 4 (7.0%) | $0 |
| 65+ Years | 39 (68.4%) | $21,563 |
| Total | 57 (100.0%) | $21,343 |
Poverty in Cornfields
Income Below Poverty by Sex and Age in Cornfields
With 63.5% poverty level for males and 64.5% for females among the residents of Cornfields, under 5 year old males and under 5 year old females are the most vulnerable to poverty, with 4 males (100.0%) and 4 females (100.0%) in their respective age groups living below the poverty level.
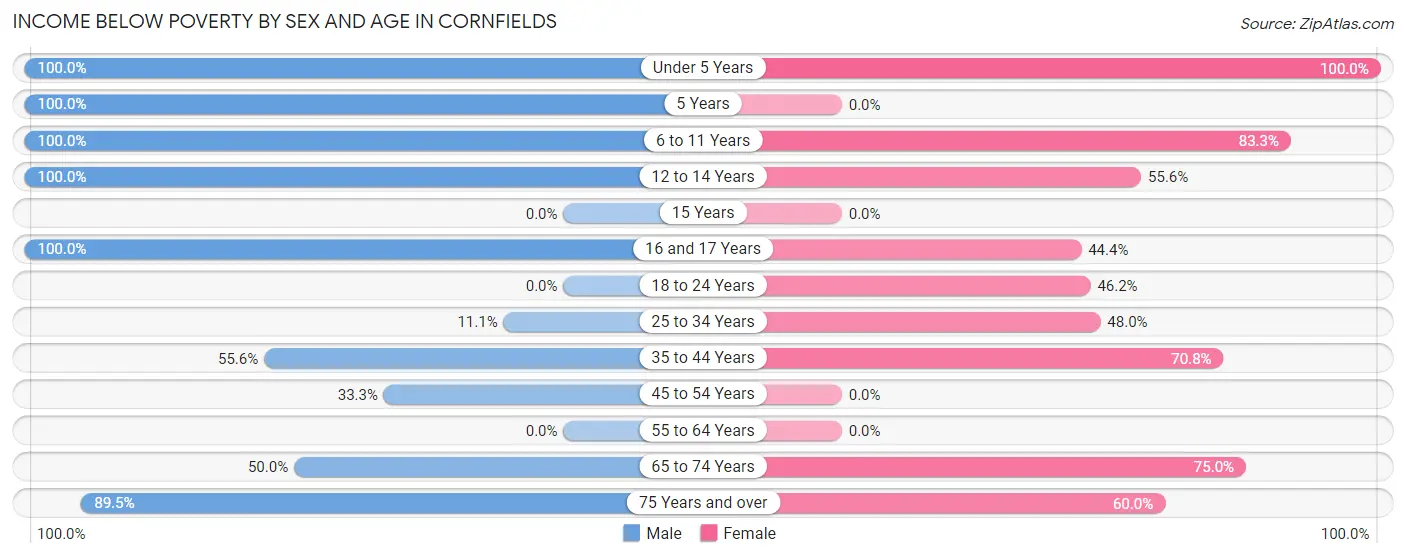
| Age Bracket | Male | Female |
| Under 5 Years | 4 (100.0%) | 4 (100.0%) |
| 5 Years | 5 (100.0%) | 0 (0.0%) |
| 6 to 11 Years | 26 (100.0%) | 25 (83.3%) |
| 12 to 14 Years | 5 (100.0%) | 5 (55.6%) |
| 15 Years | 0 (0.0%) | 0 (0.0%) |
| 16 and 17 Years | 5 (100.0%) | 4 (44.4%) |
| 18 to 24 Years | 0 (0.0%) | 6 (46.2%) |
| 25 to 34 Years | 3 (11.1%) | 12 (48.0%) |
| 35 to 44 Years | 10 (55.6%) | 17 (70.8%) |
| 45 to 54 Years | 3 (33.3%) | 0 (0.0%) |
| 55 to 64 Years | 0 (0.0%) | 0 (0.0%) |
| 65 to 74 Years | 2 (50.0%) | 24 (75.0%) |
| 75 Years and over | 17 (89.5%) | 3 (60.0%) |
| Total | 80 (63.5%) | 100 (64.5%) |
Income Above Poverty by Sex and Age in Cornfields
According to the poverty statistics in Cornfields, males aged 18 to 24 years and females aged 55 to 64 years are the age groups that are most secure financially, with 100.0% of males and 100.0% of females in these age groups living above the poverty line.
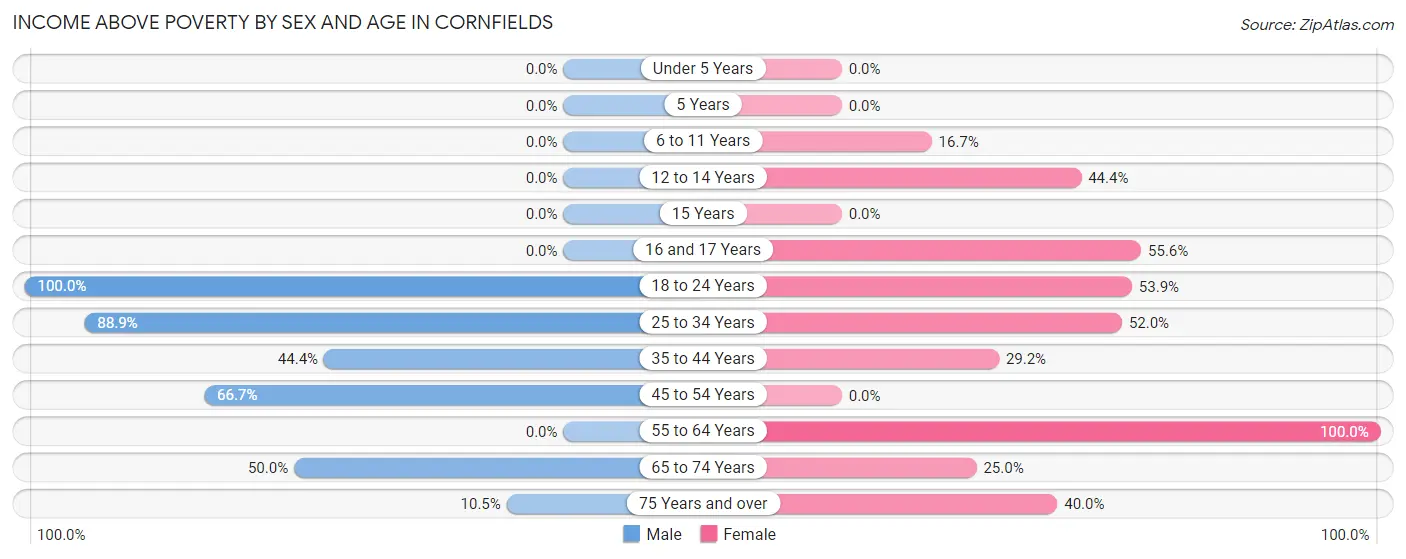
| Age Bracket | Male | Female |
| Under 5 Years | 0 (0.0%) | 0 (0.0%) |
| 5 Years | 0 (0.0%) | 0 (0.0%) |
| 6 to 11 Years | 0 (0.0%) | 5 (16.7%) |
| 12 to 14 Years | 0 (0.0%) | 4 (44.4%) |
| 15 Years | 0 (0.0%) | 0 (0.0%) |
| 16 and 17 Years | 0 (0.0%) | 5 (55.6%) |
| 18 to 24 Years | 4 (100.0%) | 7 (53.8%) |
| 25 to 34 Years | 24 (88.9%) | 13 (52.0%) |
| 35 to 44 Years | 8 (44.4%) | 7 (29.2%) |
| 45 to 54 Years | 6 (66.7%) | 0 (0.0%) |
| 55 to 64 Years | 0 (0.0%) | 4 (100.0%) |
| 65 to 74 Years | 2 (50.0%) | 8 (25.0%) |
| 75 Years and over | 2 (10.5%) | 2 (40.0%) |
| Total | 46 (36.5%) | 55 (35.5%) |
Income Below Poverty Among Married-Couple Families in Cornfields
The poverty statistics for married-couple families in Cornfields show that 71.4% or 5 of the total 7 families live below the poverty line. Families with 5 or more children have the highest poverty rate of 100.0%, comprising of 3 families. On the other hand, families with no children have the lowest poverty rate of 50.0%, which includes 2 families.
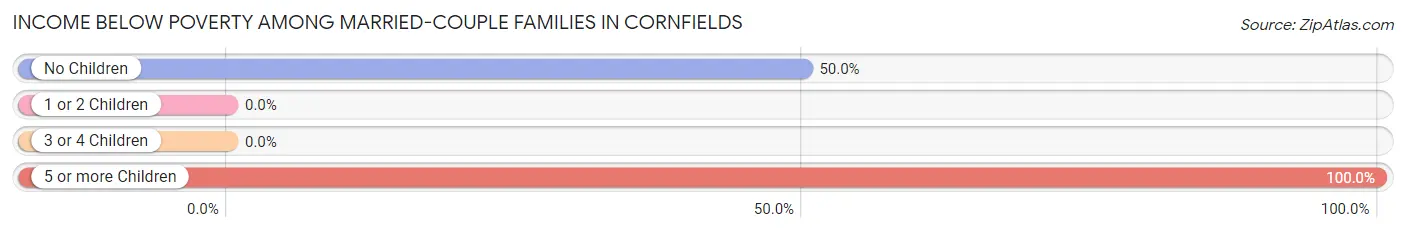
| Children | Above Poverty | Below Poverty |
| No Children | 2 (50.0%) | 2 (50.0%) |
| 1 or 2 Children | 0 (0.0%) | 0 (0.0%) |
| 3 or 4 Children | 0 (0.0%) | 0 (0.0%) |
| 5 or more Children | 0 (0.0%) | 3 (100.0%) |
| Total | 2 (28.6%) | 5 (71.4%) |
Income Below Poverty Among Single-Parent Households in Cornfields
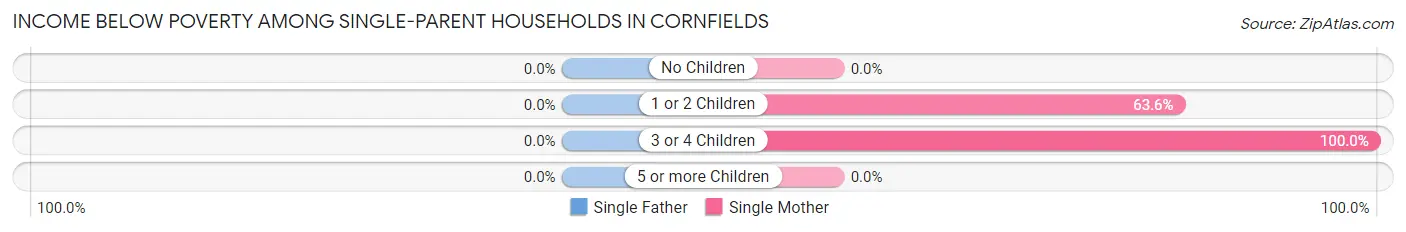
| Children | Single Father | Single Mother |
| No Children | 0 (0.0%) | 0 (0.0%) |
| 1 or 2 Children | 0 (0.0%) | 7 (63.6%) |
| 3 or 4 Children | 0 (0.0%) | 26 (100.0%) |
| 5 or more Children | 0 (0.0%) | 0 (0.0%) |
| Total | 0 (0.0%) | 33 (76.7%) |
Income Below Poverty Among Married-Couple vs Single-Parent Households in Cornfields
The poverty data for Cornfields shows that 5 of the married-couple family households (71.4%) and 33 of the single-parent households (73.3%) are living below the poverty level. Within the married-couple family households, those with 5 or more children have the highest poverty rate, with 3 households (100.0%) falling below the poverty line. Among the single-parent households, those with 3 or 4 children have the highest poverty rate, with 26 household (100.0%) living below poverty.
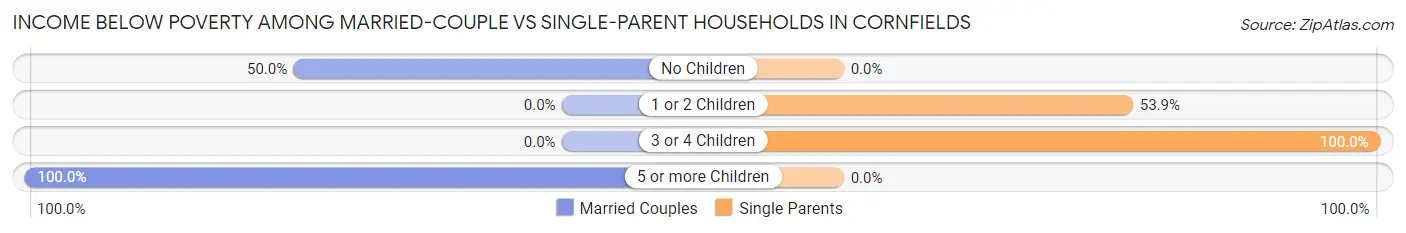
| Children | Married-Couple Families | Single-Parent Households |
| No Children | 2 (50.0%) | 0 (0.0%) |
| 1 or 2 Children | 0 (0.0%) | 7 (53.8%) |
| 3 or 4 Children | 0 (0.0%) | 26 (100.0%) |
| 5 or more Children | 3 (100.0%) | 0 (0.0%) |
| Total | 5 (71.4%) | 33 (73.3%) |
Race in Cornfields
The most populous races in Cornfields are Native / Alaskan (255 | 90.7%), Hawaiian / Pacific (19 | 6.8%), and Hispanic or Latino (9 | 3.2%).
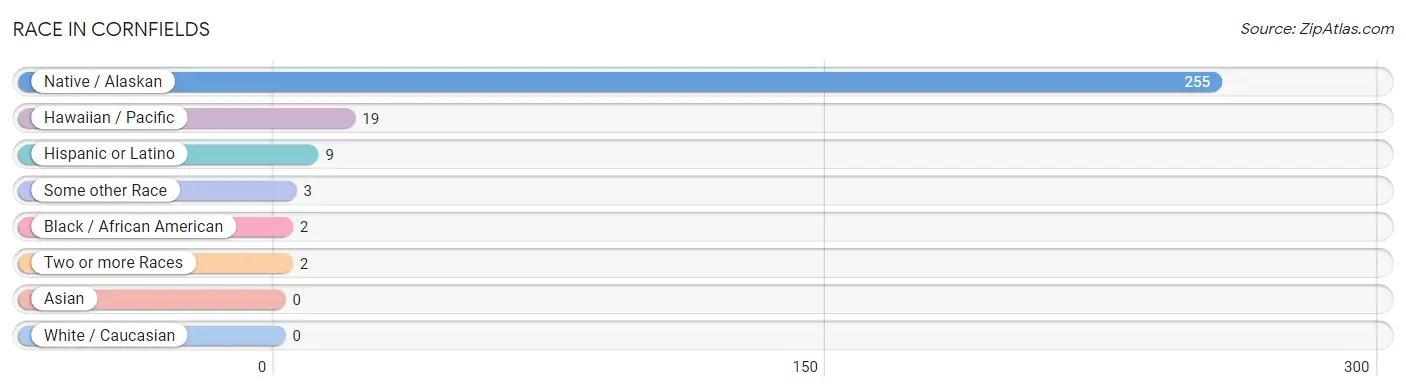
| Race | # Population | % Population |
| Asian | 0 | 0.0% |
| Black / African American | 2 | 0.7% |
| Hawaiian / Pacific | 19 | 6.8% |
| Hispanic or Latino | 9 | 3.2% |
| Native / Alaskan | 255 | 90.7% |
| White / Caucasian | 0 | 0.0% |
| Two or more Races | 2 | 0.7% |
| Some other Race | 3 | 1.1% |
| Total | 281 | 100.0% |
Ancestry in Cornfields
The most populous ancestries reported in Cornfields are Navajo (255 | 90.7%), Native Hawaiian (19 | 6.8%), Samoan (19 | 6.8%), Pueblo (4 | 1.4%), and Spaniard (4 | 1.4%), together accounting for 107.1% of all Cornfields residents.
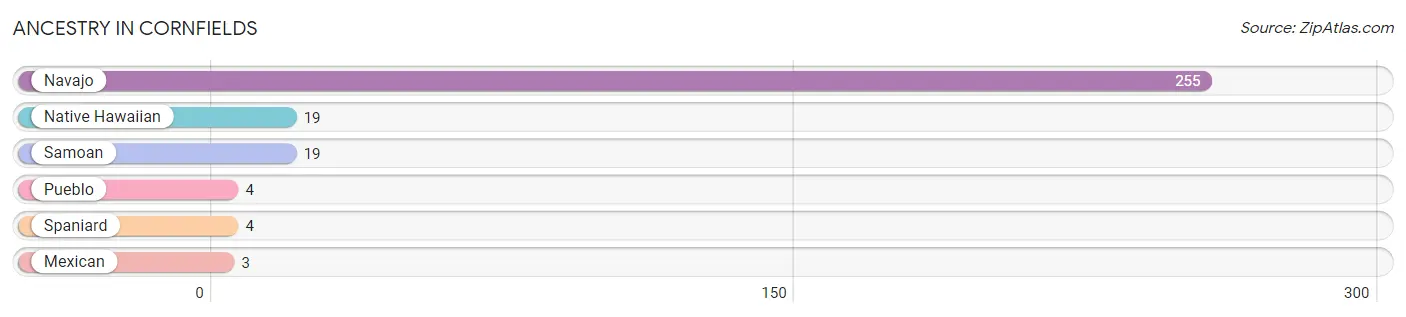
| Ancestry | # Population | % Population |
| Mexican | 3 | 1.1% |
| Native Hawaiian | 19 | 6.8% |
| Navajo | 255 | 90.7% |
| Pueblo | 4 | 1.4% |
| Samoan | 19 | 6.8% |
| Spaniard | 4 | 1.4% | View All 6 Rows |
Immigrants in Cornfields

| Immigration Origin | # Population | % Population | View All 0 Rows |
Sex and Age in Cornfields
Sex and Age in Cornfields
The most populous age groups in Cornfields are 25 to 29 Years (27 | 21.4%) for men and 65 to 69 Years (25 | 16.1%) for women.
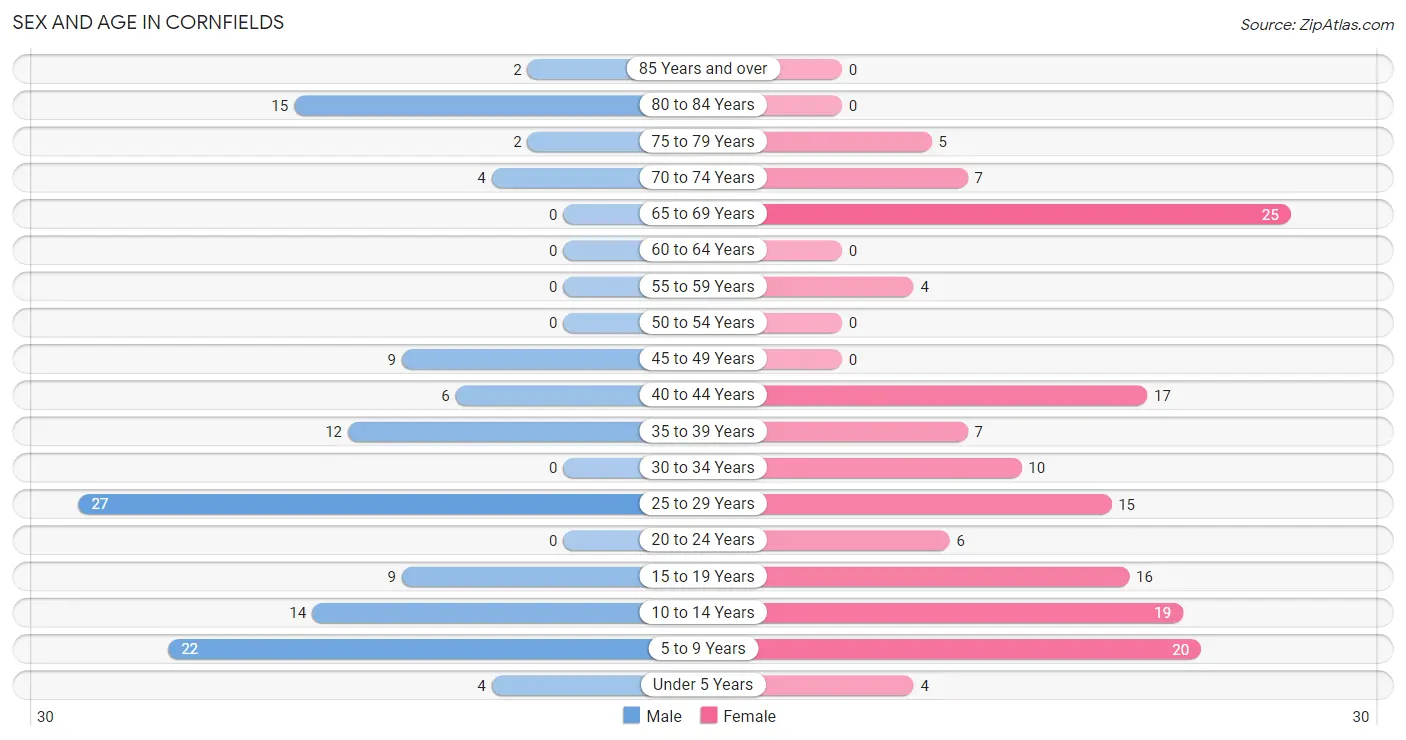
| Age Bracket | Male | Female |
| Under 5 Years | 4 (3.2%) | 4 (2.6%) |
| 5 to 9 Years | 22 (17.5%) | 20 (12.9%) |
| 10 to 14 Years | 14 (11.1%) | 19 (12.3%) |
| 15 to 19 Years | 9 (7.1%) | 16 (10.3%) |
| 20 to 24 Years | 0 (0.0%) | 6 (3.9%) |
| 25 to 29 Years | 27 (21.4%) | 15 (9.7%) |
| 30 to 34 Years | 0 (0.0%) | 10 (6.5%) |
| 35 to 39 Years | 12 (9.5%) | 7 (4.5%) |
| 40 to 44 Years | 6 (4.8%) | 17 (11.0%) |
| 45 to 49 Years | 9 (7.1%) | 0 (0.0%) |
| 50 to 54 Years | 0 (0.0%) | 0 (0.0%) |
| 55 to 59 Years | 0 (0.0%) | 4 (2.6%) |
| 60 to 64 Years | 0 (0.0%) | 0 (0.0%) |
| 65 to 69 Years | 0 (0.0%) | 25 (16.1%) |
| 70 to 74 Years | 4 (3.2%) | 7 (4.5%) |
| 75 to 79 Years | 2 (1.6%) | 5 (3.2%) |
| 80 to 84 Years | 15 (11.9%) | 0 (0.0%) |
| 85 Years and over | 2 (1.6%) | 0 (0.0%) |
| Total | 126 (100.0%) | 155 (100.0%) |
Families and Households in Cornfields
Median Family Size in Cornfields
The median family size in Cornfields is 4.75 persons per family, with single male/father families (2 | 3.8%) accounting for the largest median family size of 10 persons per family. On the other hand, single female/mother families (43 | 82.7%) represent the smallest median family size with 4.14 persons per family.
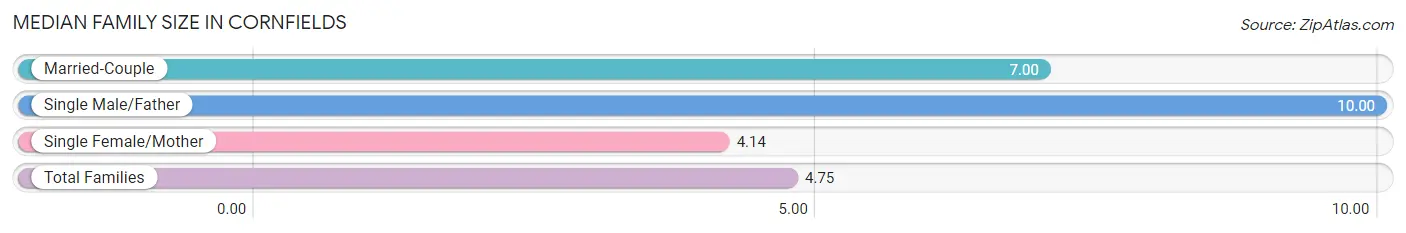
| Family Type | # Families | Family Size |
| Married-Couple | 7 (13.5%) | 7.00 |
| Single Male/Father | 2 (3.8%) | 10.00 |
| Single Female/Mother | 43 (82.7%) | 4.14 |
| Total Families | 52 (100.0%) | 4.75 |
Median Household Size in Cornfields
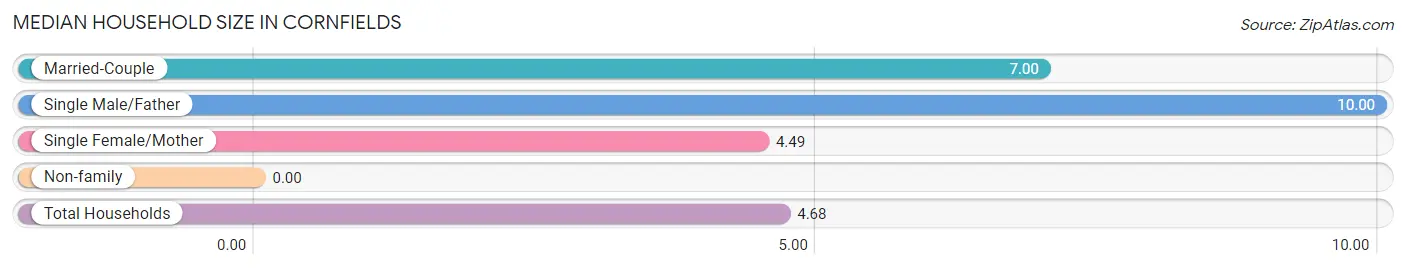
| Household Type | # Households | Household Size |
| Married-Couple | 7 (12.3%) | 7.00 |
| Single Male/Father | 2 (3.5%) | 10.00 |
| Single Female/Mother | 43 (75.4%) | 4.49 |
| Non-family | 5 (8.8%) | - |
| Total Households | 57 (100.0%) | 4.68 |
Household Size by Marriage Status in Cornfields
Out of a total of 57 households in Cornfields, 52 (91.2%) are family households, while 5 (8.8%) are nonfamily households. The most numerous type of family households are 7+ person households, comprising 23, and the most common type of nonfamily households are 1-person households, comprising 5.
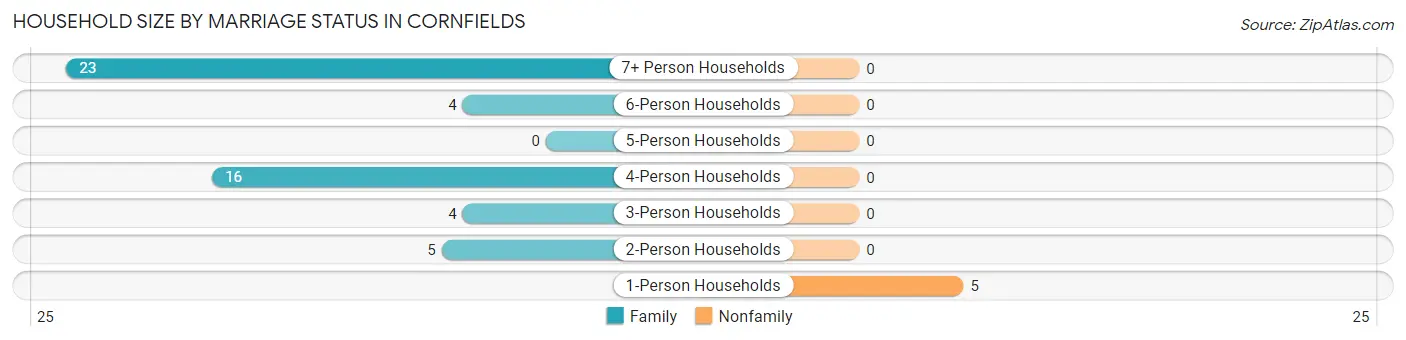
| Household Size | Family Households | Nonfamily Households |
| 1-Person Households | - | 5 (8.8%) |
| 2-Person Households | 5 (8.8%) | 0 (0.0%) |
| 3-Person Households | 4 (7.0%) | 0 (0.0%) |
| 4-Person Households | 16 (28.1%) | 0 (0.0%) |
| 5-Person Households | 0 (0.0%) | 0 (0.0%) |
| 6-Person Households | 4 (7.0%) | 0 (0.0%) |
| 7+ Person Households | 23 (40.4%) | 0 (0.0%) |
| Total | 52 (91.2%) | 5 (8.8%) |
Female Fertility in Cornfields
Fertility by Age in Cornfields
Average fertility rate in Cornfields is 99.0 births per 1,000 women. Women in the age bracket of 35 to 50 years have the highest fertility rate with 292.0 births per 1,000 women. Women in the age bracket of 35 to 50 years acount for 100.0% of all women with births.
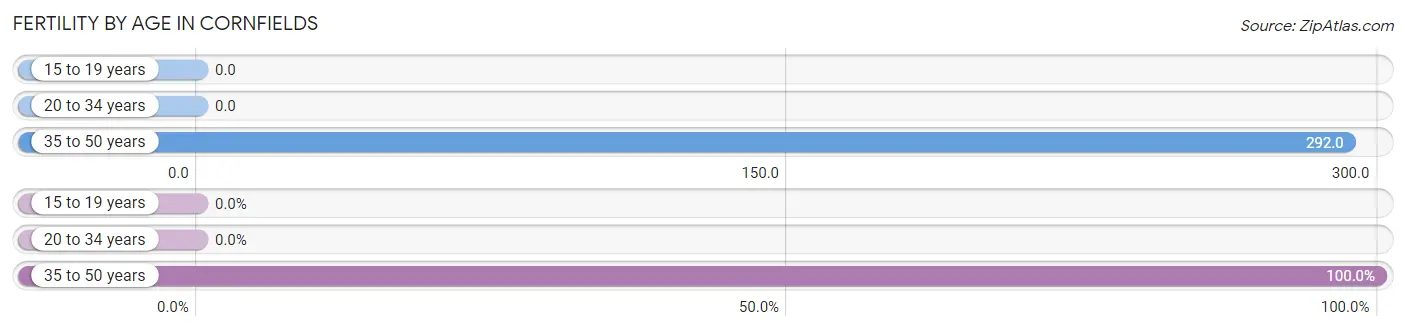
| Age Bracket | Women with Births | Births / 1,000 Women |
| 15 to 19 years | 0 (0.0%) | 0.0 |
| 20 to 34 years | 0 (0.0%) | 0.0 |
| 35 to 50 years | 7 (100.0%) | 292.0 |
| Total | 7 (100.0%) | 99.0 |
Fertility by Age by Marriage Status in Cornfields
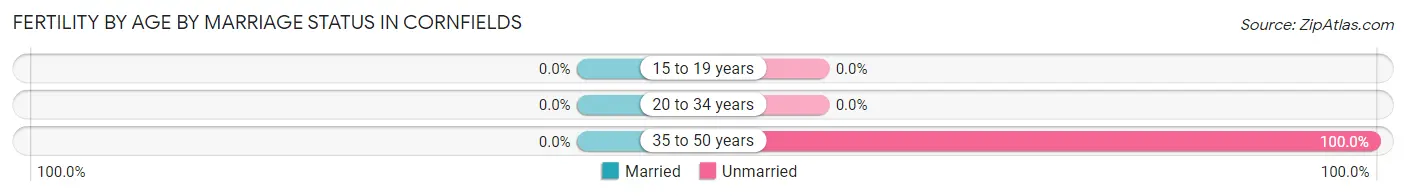
| Age Bracket | Married | Unmarried |
| 15 to 19 years | 0 (0.0%) | 0 (0.0%) |
| 20 to 34 years | 0 (0.0%) | 0 (0.0%) |
| 35 to 50 years | 0 (0.0%) | 7 (100.0%) |
| Total | 0 (0.0%) | 7 (100.0%) |
Fertility by Education in Cornfields
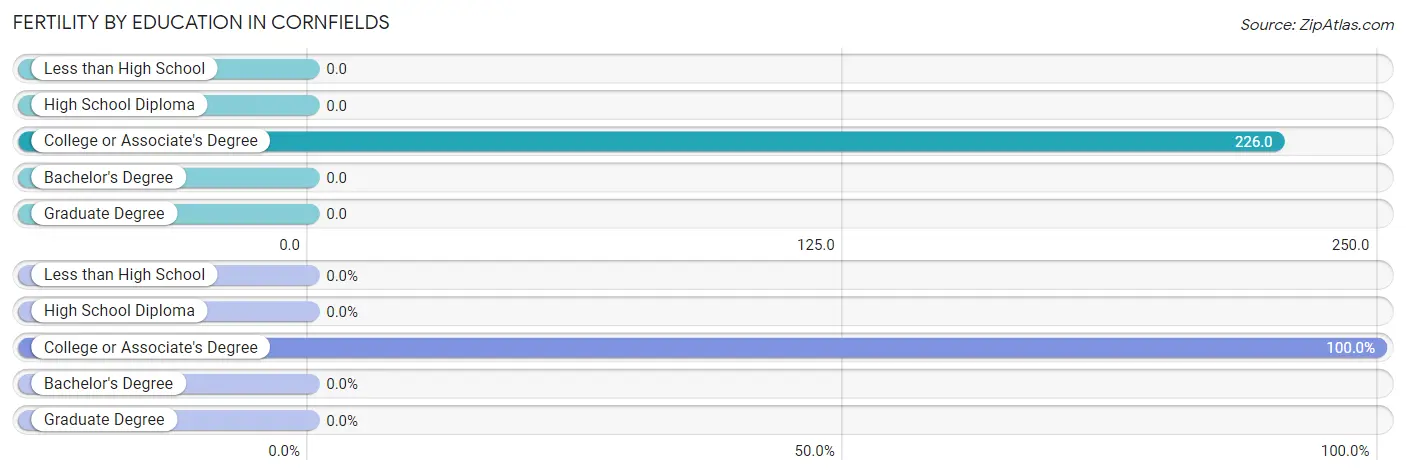
| Educational Attainment | Women with Births | Births / 1,000 Women |
| Less than High School | 0 (0.0%) | 0.0 |
| High School Diploma | 0 (0.0%) | 0.0 |
| College or Associate's Degree | 7 (100.0%) | 226.0 |
| Bachelor's Degree | 0 (0.0%) | 0.0 |
| Graduate Degree | 0 (0.0%) | 0.0 |
| Total | 7 (100.0%) | 99.0 |
Fertility by Education by Marriage Status in Cornfields
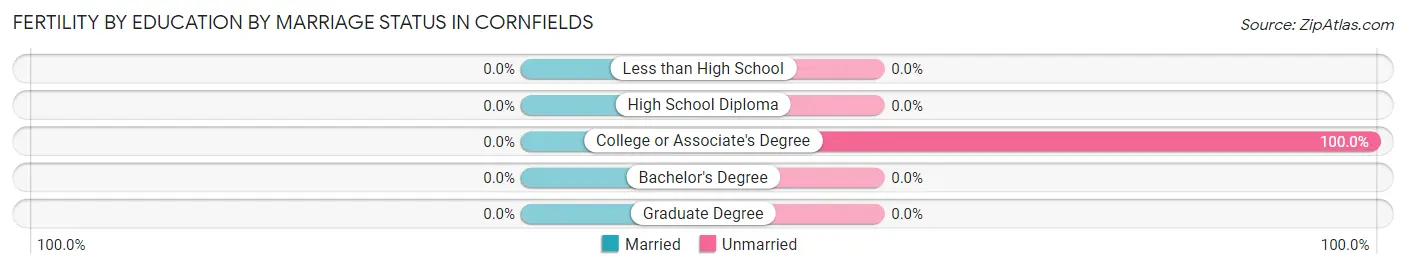
| Educational Attainment | Married | Unmarried |
| Less than High School | 0 (0.0%) | 0 (0.0%) |
| High School Diploma | 0 (0.0%) | 0 (0.0%) |
| College or Associate's Degree | 0 (0.0%) | 7 (100.0%) |
| Bachelor's Degree | 0 (0.0%) | 0 (0.0%) |
| Graduate Degree | 0 (0.0%) | 0 (0.0%) |
| Total | 0 (0.0%) | 7 (100.0%) |
Employment Characteristics in Cornfields
Employment by Class of Employer in Cornfields
Among the 46 employed individuals in Cornfields, private company employees (23 | 50.0%), state government employees (16 | 34.8%), and local government employees (7 | 15.2%) make up the most common classes of employment.
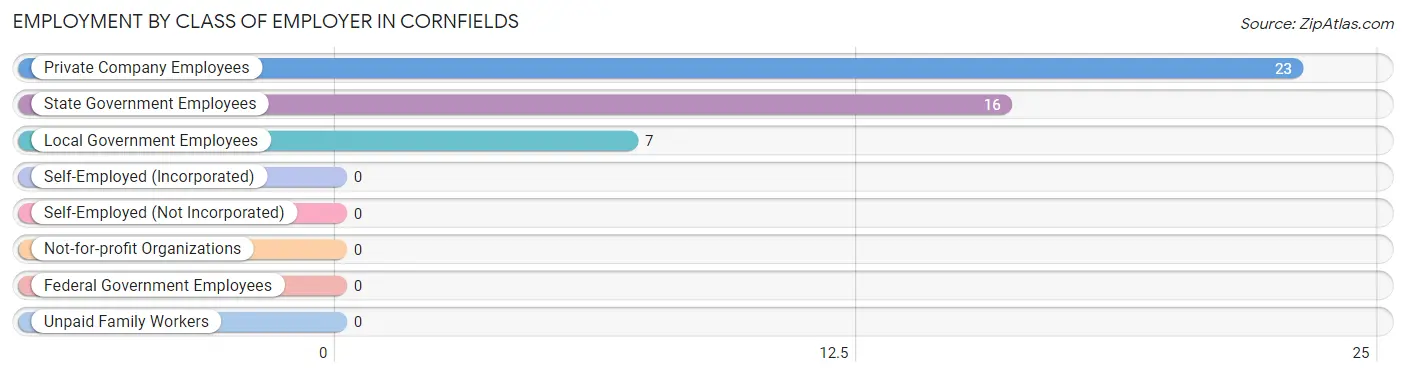
| Employer Class | # Employees | % Employees |
| Private Company Employees | 23 | 50.0% |
| Self-Employed (Incorporated) | 0 | 0.0% |
| Self-Employed (Not Incorporated) | 0 | 0.0% |
| Not-for-profit Organizations | 0 | 0.0% |
| Local Government Employees | 7 | 15.2% |
| State Government Employees | 16 | 34.8% |
| Federal Government Employees | 0 | 0.0% |
| Unpaid Family Workers | 0 | 0.0% |
| Total | 46 | 100.0% |
Employment Status by Age in Cornfields
According to the labor force statistics for Cornfields, out of the total population over 16 years of age (198), 25.8% or 51 individuals are in the labor force, with 9.8% or 5 of them unemployed. The age group with the highest labor force participation rate is 55 to 59 years, with 100.0% or 4 individuals in the labor force. Within the labor force, the 35 to 44 years age range has the highest percentage of unemployed individuals, with 35.7% or 5 of them being unemployed.
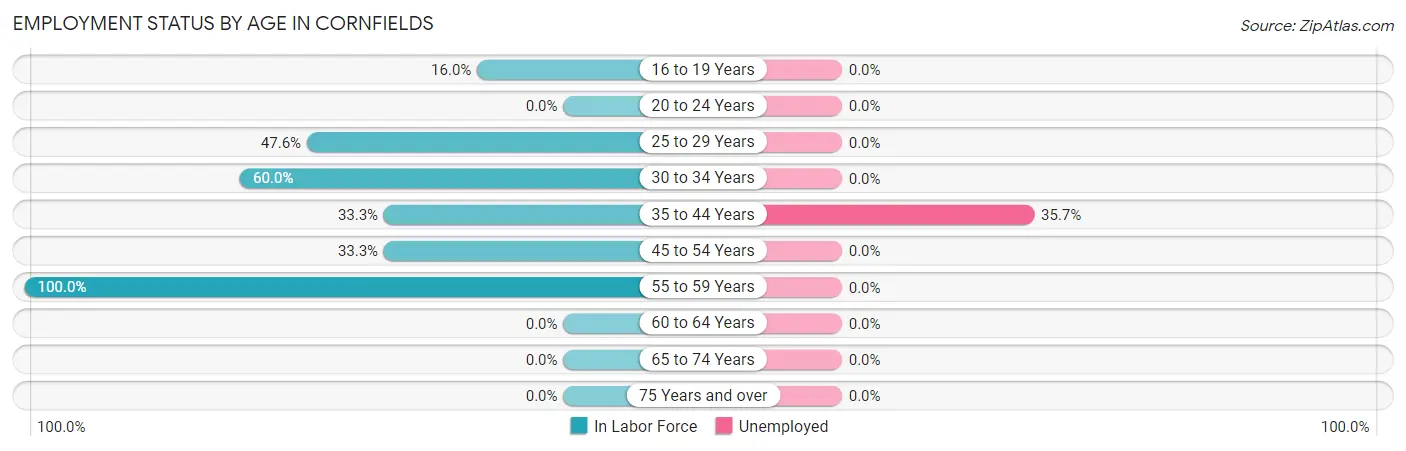
| Age Bracket | In Labor Force | Unemployed |
| 16 to 19 Years | 4 (16.0%) | 0 (0.0%) |
| 20 to 24 Years | 0 (0.0%) | 0 (0.0%) |
| 25 to 29 Years | 20 (47.6%) | 0 (0.0%) |
| 30 to 34 Years | 6 (60.0%) | 0 (0.0%) |
| 35 to 44 Years | 14 (33.3%) | 5 (35.7%) |
| 45 to 54 Years | 3 (33.3%) | 0 (0.0%) |
| 55 to 59 Years | 4 (100.0%) | 0 (0.0%) |
| 60 to 64 Years | 0 (0.0%) | 0 (0.0%) |
| 65 to 74 Years | 0 (0.0%) | 0 (0.0%) |
| 75 Years and over | 0 (0.0%) | 0 (0.0%) |
| Total | 51 (25.8%) | 5 (9.8%) |
Employment Status by Educational Attainment in Cornfields
According to labor force statistics for Cornfields, 43.9% of individuals (47) out of the total population between 25 and 64 years of age (107) are in the labor force, with 10.6% or 5 of them being unemployed. The group with the highest labor force participation rate are those with the educational attainment of bachelor's degree or higher, with 100.0% or 7 individuals in the labor force. Within the labor force, individuals with college / associate degree education have the highest percentage of unemployment, with 45.5% or 5 of them being unemployed.
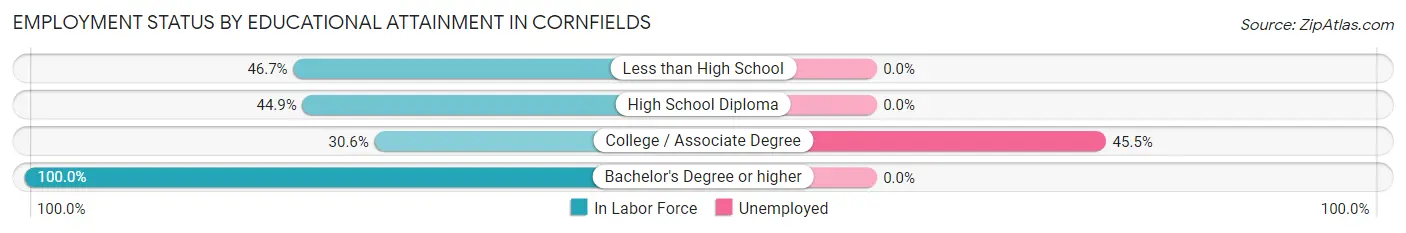
| Educational Attainment | In Labor Force | Unemployed |
| Less than High School | 7 (46.7%) | 0 (0.0%) |
| High School Diploma | 22 (44.9%) | 0 (0.0%) |
| College / Associate Degree | 11 (30.6%) | 16 (45.5%) |
| Bachelor's Degree or higher | 7 (100.0%) | 0 (0.0%) |
| Total | 47 (43.9%) | 11 (10.6%) |
Employment Occupations by Sex in Cornfields
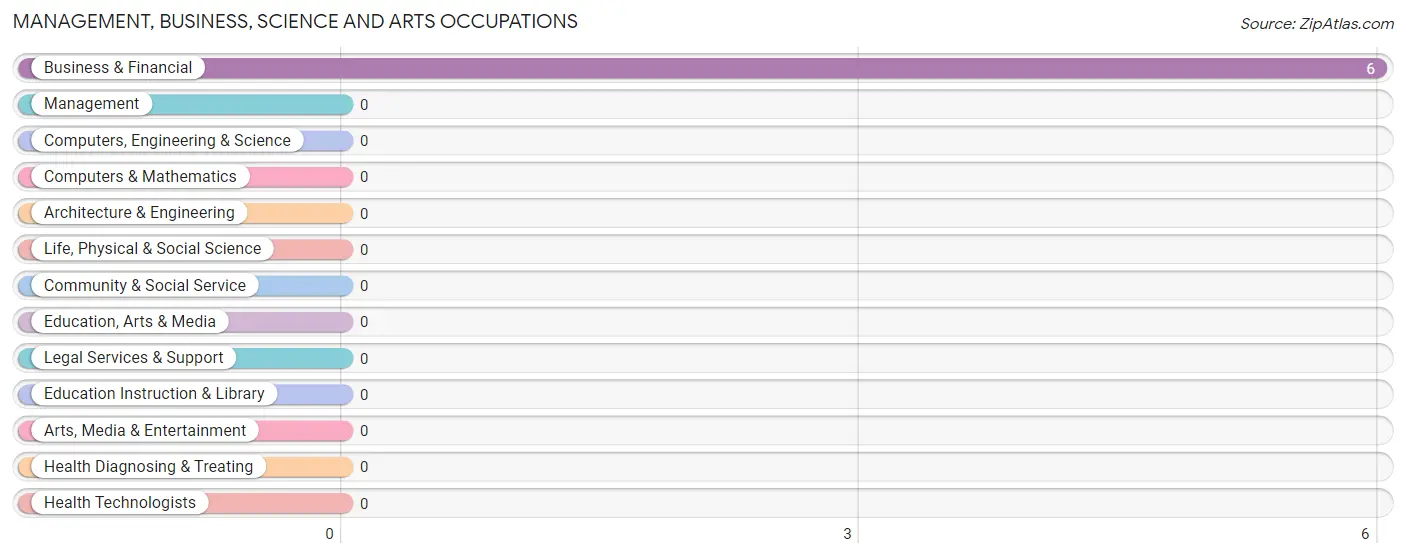
Management, Business, Science and Arts Occupations
The most common Management, Business, Science and Arts occupations in Cornfields are , and Business & Financial (6 | 13.0%).
Management, Business, Science and Arts Occupations by Sex
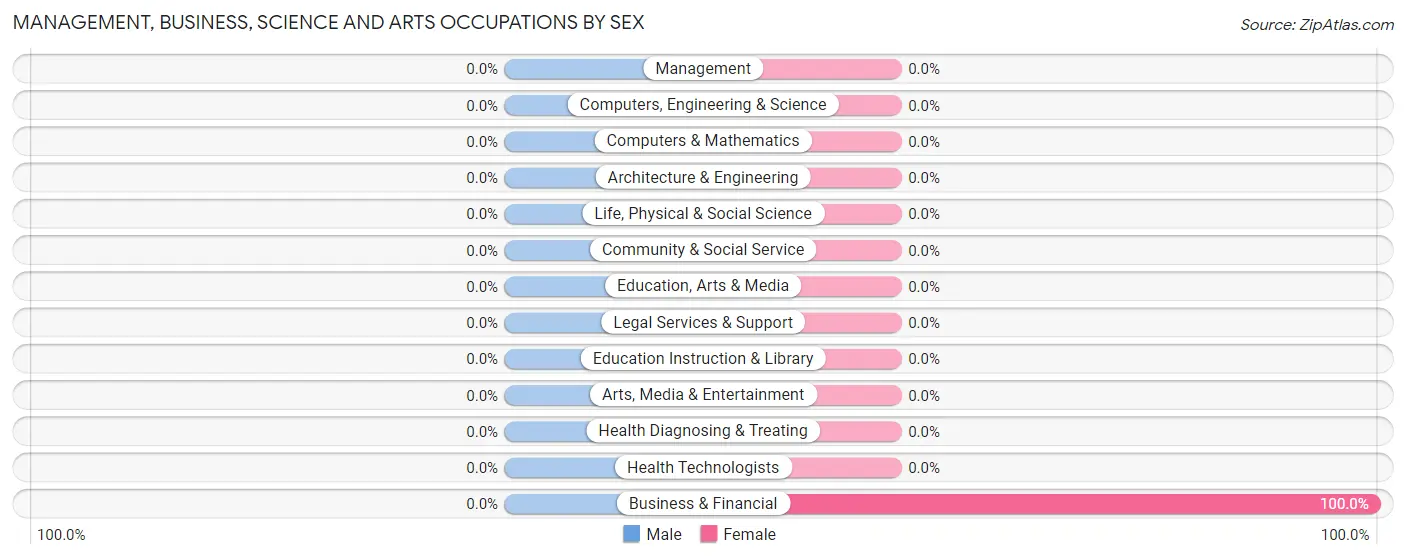
| Occupation | Male | Female |
| Management | 0 (0.0%) | 0 (0.0%) |
| Business & Financial | 0 (0.0%) | 6 (100.0%) |
| Computers, Engineering & Science | 0 (0.0%) | 0 (0.0%) |
| Computers & Mathematics | 0 (0.0%) | 0 (0.0%) |
| Architecture & Engineering | 0 (0.0%) | 0 (0.0%) |
| Life, Physical & Social Science | 0 (0.0%) | 0 (0.0%) |
| Community & Social Service | 0 (0.0%) | 0 (0.0%) |
| Education, Arts & Media | 0 (0.0%) | 0 (0.0%) |
| Legal Services & Support | 0 (0.0%) | 0 (0.0%) |
| Education Instruction & Library | 0 (0.0%) | 0 (0.0%) |
| Arts, Media & Entertainment | 0 (0.0%) | 0 (0.0%) |
| Health Diagnosing & Treating | 0 (0.0%) | 0 (0.0%) |
| Health Technologists | 0 (0.0%) | 0 (0.0%) |
| Total (Category) | 0 (0.0%) | 6 (100.0%) |
| Total (Overall) | 29 (63.0%) | 17 (37.0%) |
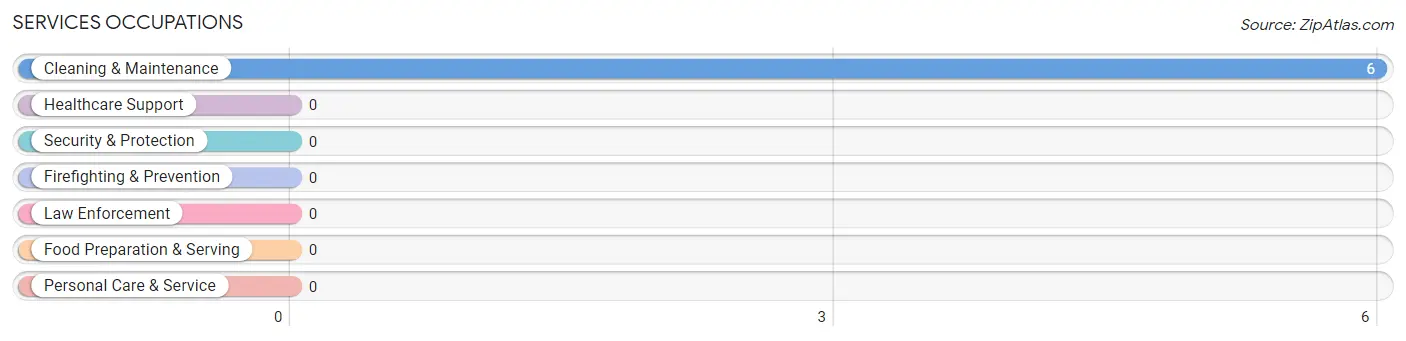
Services Occupations
The most common Services occupations in Cornfields are , and Cleaning & Maintenance (6 | 13.0%).
Services Occupations by Sex
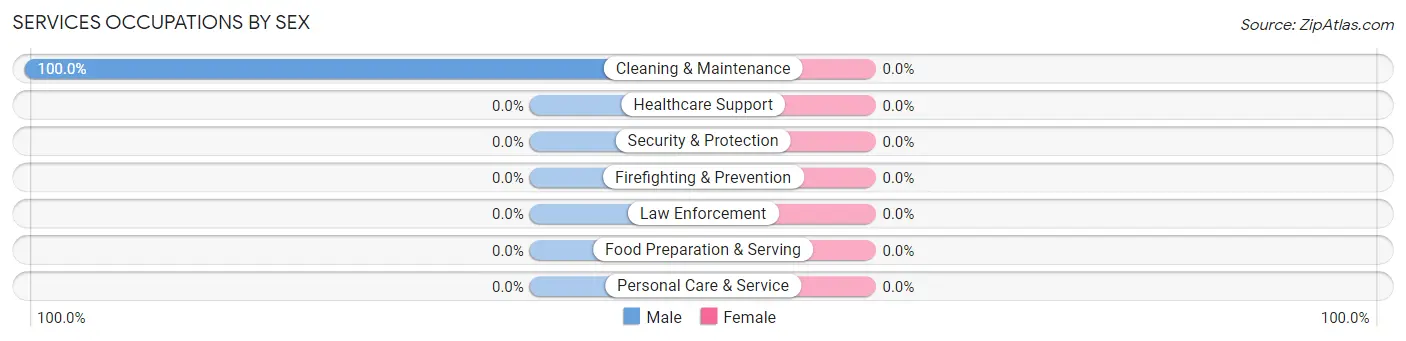
| Occupation | Male | Female |
| Healthcare Support | 0 (0.0%) | 0 (0.0%) |
| Security & Protection | 0 (0.0%) | 0 (0.0%) |
| Firefighting & Prevention | 0 (0.0%) | 0 (0.0%) |
| Law Enforcement | 0 (0.0%) | 0 (0.0%) |
| Food Preparation & Serving | 0 (0.0%) | 0 (0.0%) |
| Cleaning & Maintenance | 6 (100.0%) | 0 (0.0%) |
| Personal Care & Service | 0 (0.0%) | 0 (0.0%) |
| Total (Category) | 6 (100.0%) | 0 (0.0%) |
| Total (Overall) | 29 (63.0%) | 17 (37.0%) |
Sales and Office Occupations
The most common Sales and Office occupations in Cornfields are Sales & Related (14 | 30.4%), and Office & Administration (11 | 23.9%).
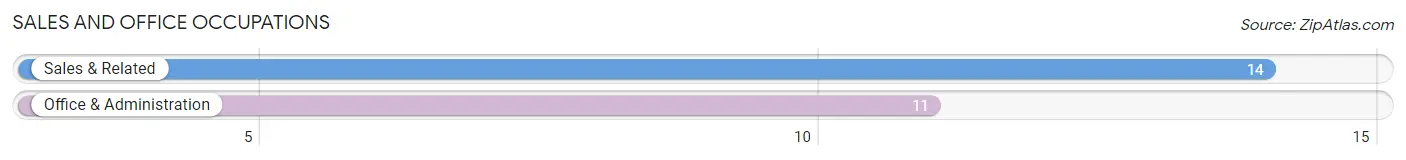
Sales and Office Occupations by Sex
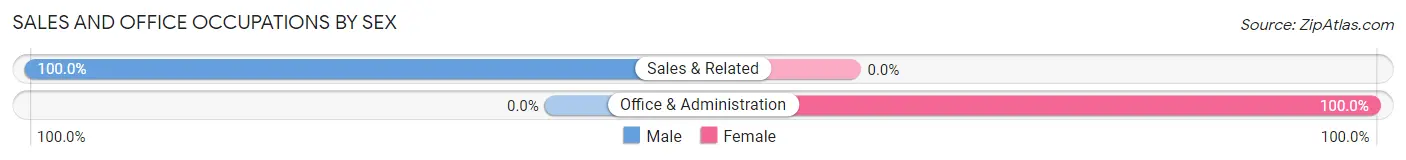
| Occupation | Male | Female |
| Sales & Related | 14 (100.0%) | 0 (0.0%) |
| Office & Administration | 0 (0.0%) | 11 (100.0%) |
| Total (Category) | 14 (56.0%) | 11 (44.0%) |
| Total (Overall) | 29 (63.0%) | 17 (37.0%) |
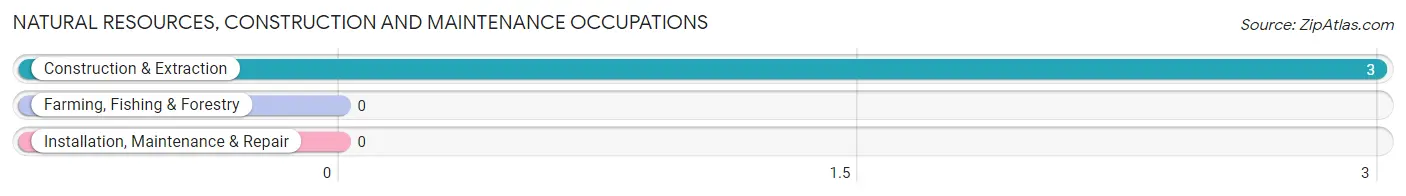
Natural Resources, Construction and Maintenance Occupations
The most common Natural Resources, Construction and Maintenance occupations in Cornfields are , and Construction & Extraction (3 | 6.5%).
Natural Resources, Construction and Maintenance Occupations by Sex
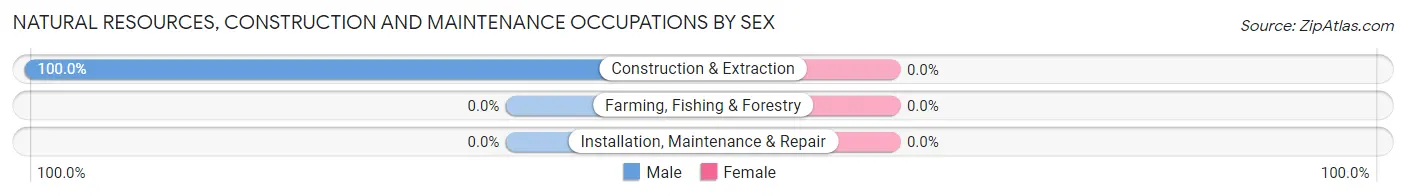
| Occupation | Male | Female |
| Farming, Fishing & Forestry | 0 (0.0%) | 0 (0.0%) |
| Construction & Extraction | 3 (100.0%) | 0 (0.0%) |
| Installation, Maintenance & Repair | 0 (0.0%) | 0 (0.0%) |
| Total (Category) | 3 (100.0%) | 0 (0.0%) |
| Total (Overall) | 29 (63.0%) | 17 (37.0%) |
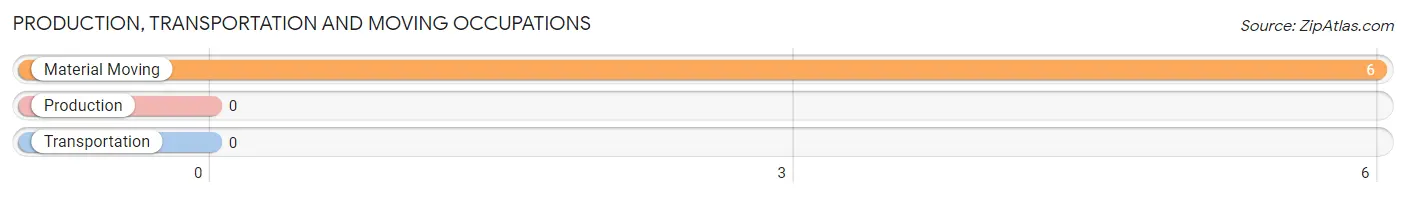
Production, Transportation and Moving Occupations
The most common Production, Transportation and Moving occupations in Cornfields are , and Material Moving (6 | 13.0%).
Production, Transportation and Moving Occupations by Sex
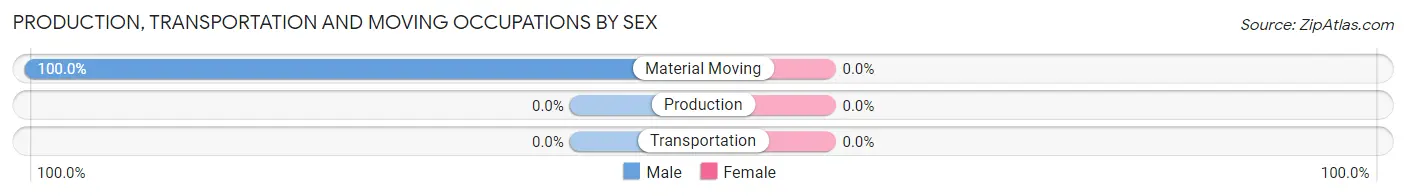
| Occupation | Male | Female |
| Production | 0 (0.0%) | 0 (0.0%) |
| Transportation | 0 (0.0%) | 0 (0.0%) |
| Material Moving | 6 (100.0%) | 0 (0.0%) |
| Total (Category) | 6 (100.0%) | 0 (0.0%) |
| Total (Overall) | 29 (63.0%) | 17 (37.0%) |
Employment Industries by Sex in Cornfields
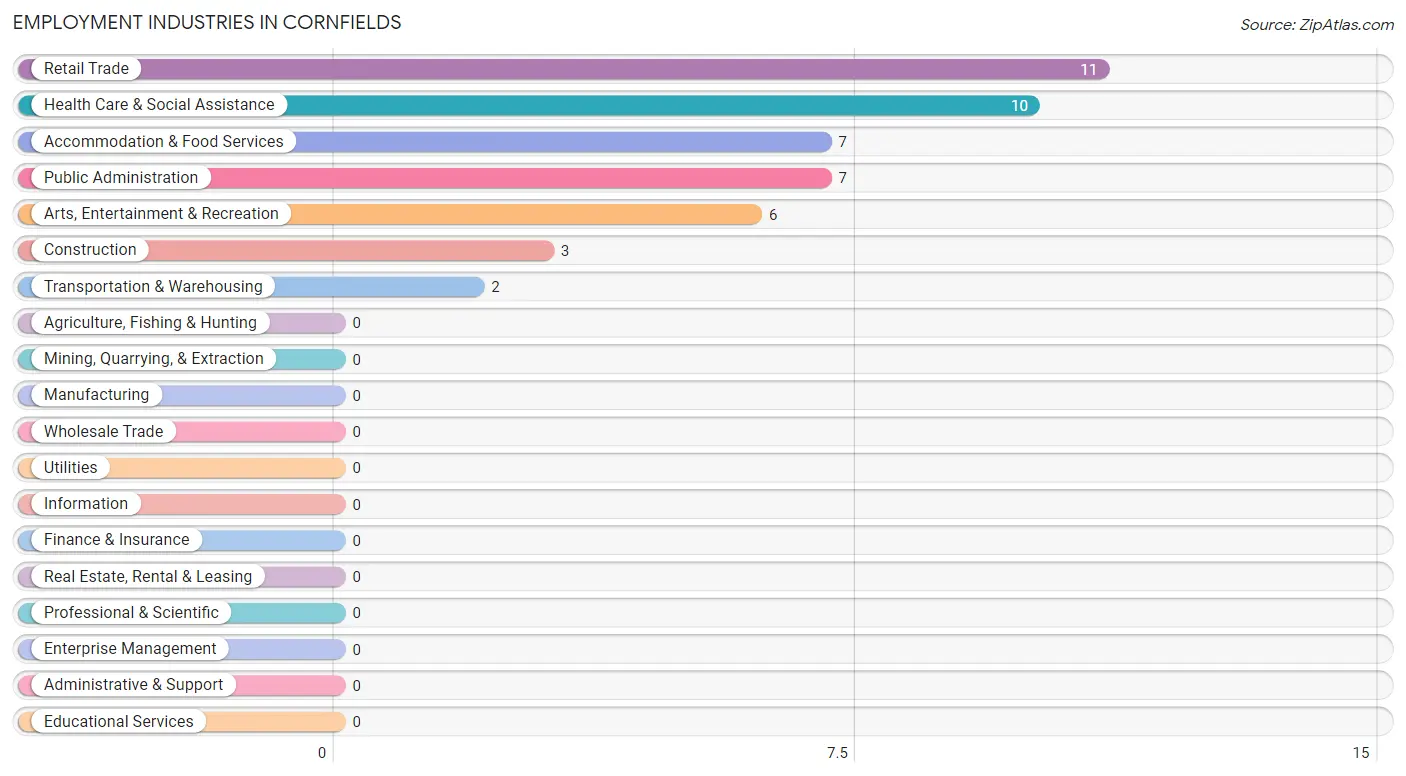
Employment Industries in Cornfields
The major employment industries in Cornfields include Retail Trade (11 | 23.9%), Health Care & Social Assistance (10 | 21.7%), Accommodation & Food Services (7 | 15.2%), Public Administration (7 | 15.2%), and Arts, Entertainment & Recreation (6 | 13.0%).
Employment Industries by Sex in Cornfields
The Cornfields industries that see more men than women are Construction (100.0%), Retail Trade (100.0%), and Transportation & Warehousing (100.0%), whereas the industries that tend to have a higher number of women are Health Care & Social Assistance (100.0%), and Public Administration (100.0%).
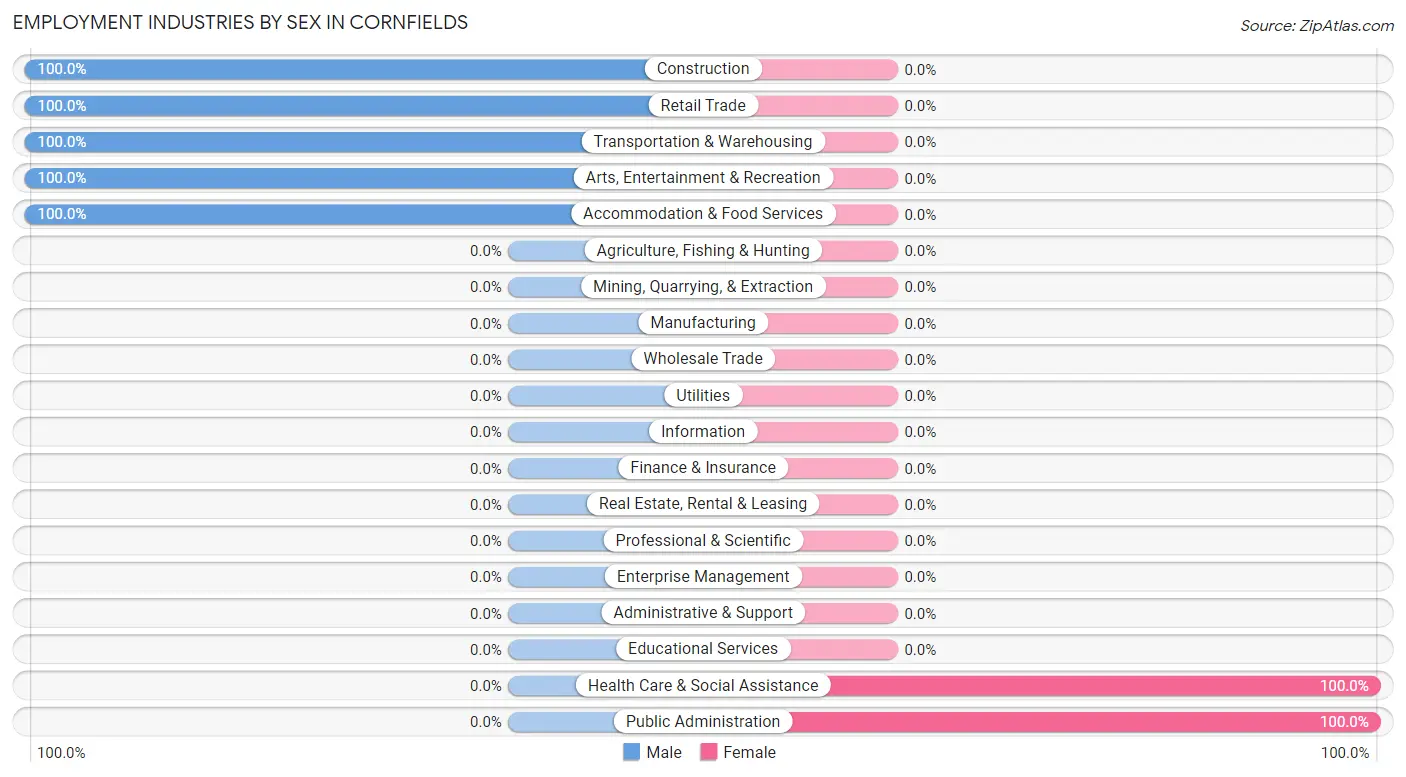
| Industry | Male | Female |
| Agriculture, Fishing & Hunting | 0 (0.0%) | 0 (0.0%) |
| Mining, Quarrying, & Extraction | 0 (0.0%) | 0 (0.0%) |
| Construction | 3 (100.0%) | 0 (0.0%) |
| Manufacturing | 0 (0.0%) | 0 (0.0%) |
| Wholesale Trade | 0 (0.0%) | 0 (0.0%) |
| Retail Trade | 11 (100.0%) | 0 (0.0%) |
| Transportation & Warehousing | 2 (100.0%) | 0 (0.0%) |
| Utilities | 0 (0.0%) | 0 (0.0%) |
| Information | 0 (0.0%) | 0 (0.0%) |
| Finance & Insurance | 0 (0.0%) | 0 (0.0%) |
| Real Estate, Rental & Leasing | 0 (0.0%) | 0 (0.0%) |
| Professional & Scientific | 0 (0.0%) | 0 (0.0%) |
| Enterprise Management | 0 (0.0%) | 0 (0.0%) |
| Administrative & Support | 0 (0.0%) | 0 (0.0%) |
| Educational Services | 0 (0.0%) | 0 (0.0%) |
| Health Care & Social Assistance | 0 (0.0%) | 10 (100.0%) |
| Arts, Entertainment & Recreation | 6 (100.0%) | 0 (0.0%) |
| Accommodation & Food Services | 7 (100.0%) | 0 (0.0%) |
| Public Administration | 0 (0.0%) | 7 (100.0%) |
| Total | 29 (63.0%) | 17 (37.0%) |
Education in Cornfields
School Enrollment in Cornfields
The most common levels of schooling among the 103 students in Cornfields are elementary school (42 | 40.8%), middle school (23 | 22.3%), and high school (19 | 18.4%).
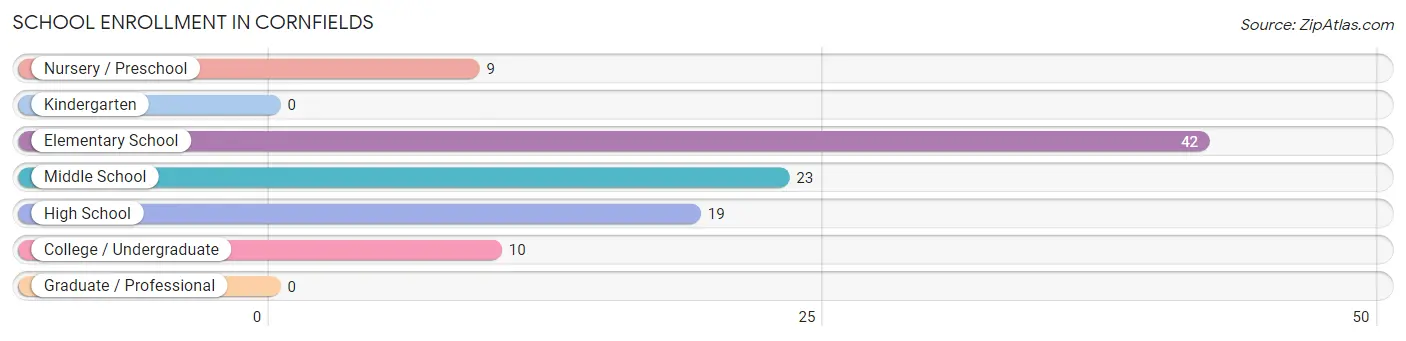
| School Level | # Students | % Students |
| Nursery / Preschool | 9 | 8.7% |
| Kindergarten | 0 | 0.0% |
| Elementary School | 42 | 40.8% |
| Middle School | 23 | 22.3% |
| High School | 19 | 18.4% |
| College / Undergraduate | 10 | 9.7% |
| Graduate / Professional | 0 | 0.0% |
| Total | 103 | 100.0% |
School Enrollment by Age by Funding Source in Cornfields
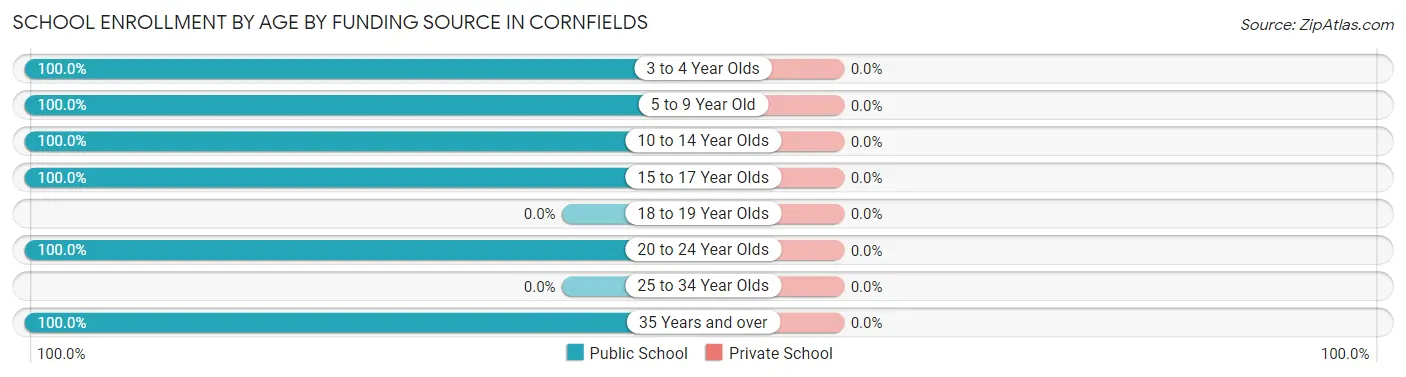
| Age Bracket | Public School | Private School |
| 3 to 4 Year Olds | 4 (100.0%) | 0 (0.0%) |
| 5 to 9 Year Old | 42 (100.0%) | 0 (0.0%) |
| 10 to 14 Year Olds | 33 (100.0%) | 0 (0.0%) |
| 15 to 17 Year Olds | 14 (100.0%) | 0 (0.0%) |
| 18 to 19 Year Olds | 0 (0.0%) | 0 (0.0%) |
| 20 to 24 Year Olds | 6 (100.0%) | 0 (0.0%) |
| 25 to 34 Year Olds | 0 (0.0%) | 0 (0.0%) |
| 35 Years and over | 4 (100.0%) | 0 (0.0%) |
| Total | 103 (100.0%) | 0 (0.0%) |
Educational Attainment by Field of Study in Cornfields
, and arts & humanities (7 | 100.0%) are the most common fields of study among 7 individuals in Cornfields who have obtained a bachelor's degree or higher.
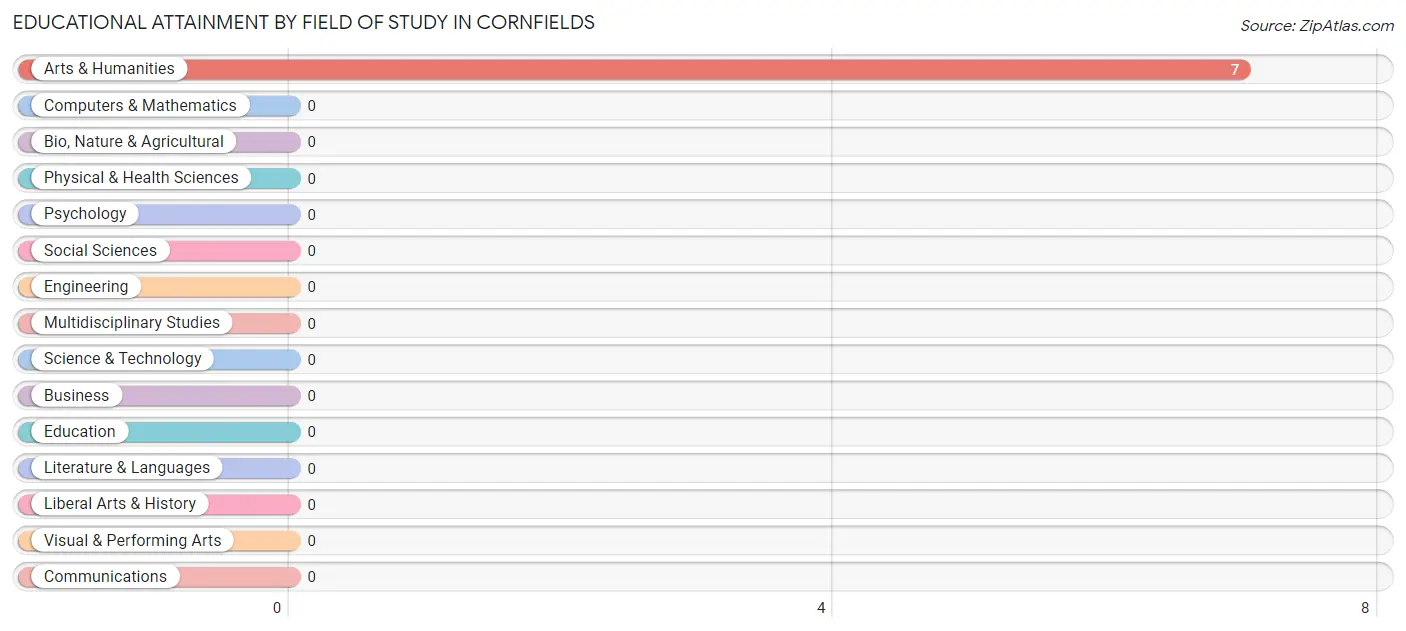
| Field of Study | # Graduates | % Graduates |
| Computers & Mathematics | 0 | 0.0% |
| Bio, Nature & Agricultural | 0 | 0.0% |
| Physical & Health Sciences | 0 | 0.0% |
| Psychology | 0 | 0.0% |
| Social Sciences | 0 | 0.0% |
| Engineering | 0 | 0.0% |
| Multidisciplinary Studies | 0 | 0.0% |
| Science & Technology | 0 | 0.0% |
| Business | 0 | 0.0% |
| Education | 0 | 0.0% |
| Literature & Languages | 0 | 0.0% |
| Liberal Arts & History | 0 | 0.0% |
| Visual & Performing Arts | 0 | 0.0% |
| Communications | 0 | 0.0% |
| Arts & Humanities | 7 | 100.0% |
| Total | 7 | 100.0% |
Transportation & Commute in Cornfields
Vehicle Availability by Sex in Cornfields
The most prevalent vehicle ownership categories in Cornfields are males with 2 vehicles (14, accounting for 51.8%) and females with 2 vehicles (17, making up 82.4%).
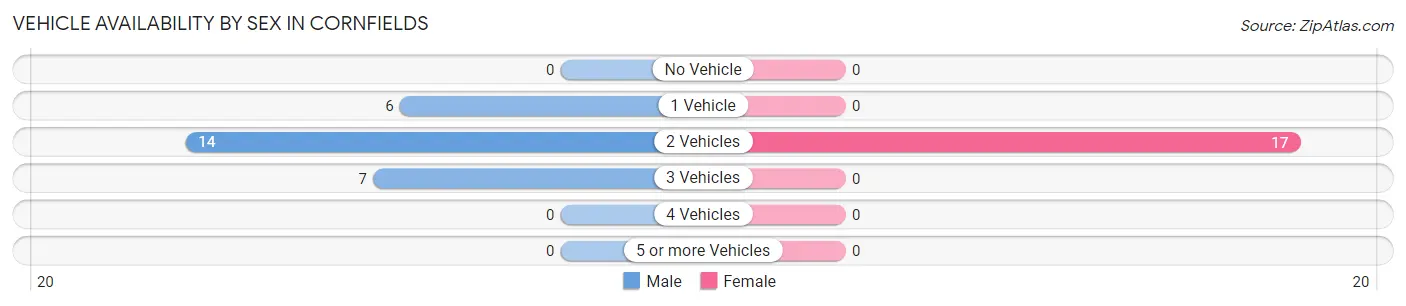
| Vehicles Available | Male | Female |
| No Vehicle | 0 (0.0%) | 0 (0.0%) |
| 1 Vehicle | 6 (22.2%) | 0 (0.0%) |
| 2 Vehicles | 14 (51.8%) | 17 (100.0%) |
| 3 Vehicles | 7 (25.9%) | 0 (0.0%) |
| 4 Vehicles | 0 (0.0%) | 0 (0.0%) |
| 5 or more Vehicles | 0 (0.0%) | 0 (0.0%) |
| Total | 27 (100.0%) | 17 (100.0%) |
Commute Time in Cornfields
The most frequently occuring commute durations in Cornfields are 10 to 14 minutes (14 commuters, 30.4%), 30 to 34 minutes (13 commuters, 28.3%), and 15 to 19 minutes (10 commuters, 21.7%).
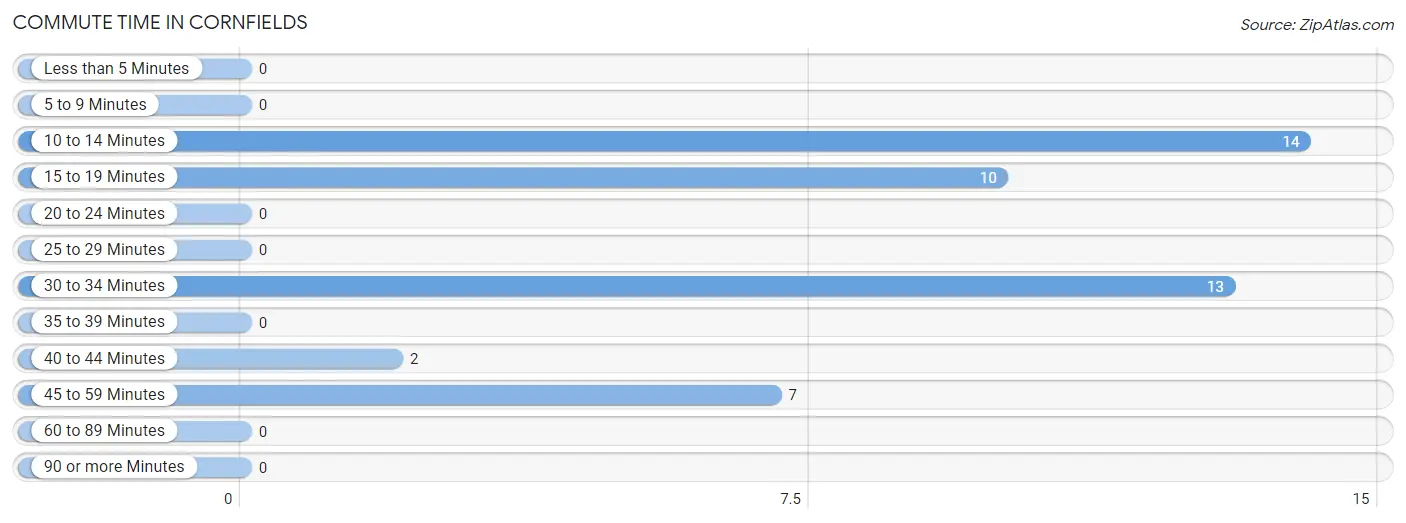
| Commute Time | # Commuters | % Commuters |
| Less than 5 Minutes | 0 | 0.0% |
| 5 to 9 Minutes | 0 | 0.0% |
| 10 to 14 Minutes | 14 | 30.4% |
| 15 to 19 Minutes | 10 | 21.7% |
| 20 to 24 Minutes | 0 | 0.0% |
| 25 to 29 Minutes | 0 | 0.0% |
| 30 to 34 Minutes | 13 | 28.3% |
| 35 to 39 Minutes | 0 | 0.0% |
| 40 to 44 Minutes | 2 | 4.3% |
| 45 to 59 Minutes | 7 | 15.2% |
| 60 to 89 Minutes | 0 | 0.0% |
| 90 or more Minutes | 0 | 0.0% |
Commute Time by Sex in Cornfields
The most common commute times in Cornfields are 10 to 14 minutes (14 commuters, 48.3%) for males and 30 to 34 minutes (10 commuters, 58.8%) for females.
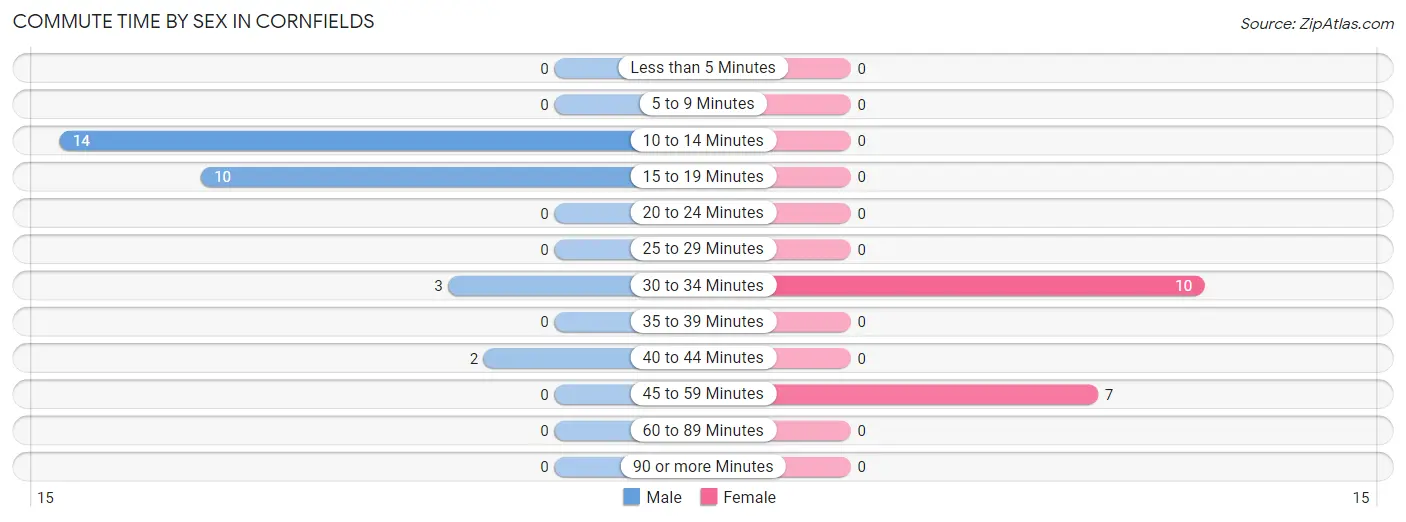
| Commute Time | Male | Female |
| Less than 5 Minutes | 0 (0.0%) | 0 (0.0%) |
| 5 to 9 Minutes | 0 (0.0%) | 0 (0.0%) |
| 10 to 14 Minutes | 14 (48.3%) | 0 (0.0%) |
| 15 to 19 Minutes | 10 (34.5%) | 0 (0.0%) |
| 20 to 24 Minutes | 0 (0.0%) | 0 (0.0%) |
| 25 to 29 Minutes | 0 (0.0%) | 0 (0.0%) |
| 30 to 34 Minutes | 3 (10.3%) | 10 (58.8%) |
| 35 to 39 Minutes | 0 (0.0%) | 0 (0.0%) |
| 40 to 44 Minutes | 2 (6.9%) | 0 (0.0%) |
| 45 to 59 Minutes | 0 (0.0%) | 7 (41.2%) |
| 60 to 89 Minutes | 0 (0.0%) | 0 (0.0%) |
| 90 or more Minutes | 0 (0.0%) | 0 (0.0%) |
Time of Departure to Work by Sex in Cornfields
The most frequent times of departure to work in Cornfields are 7:00 AM to 7:29 AM (17, 58.6%) for males and 6:30 AM to 6:59 AM (13, 76.5%) for females.
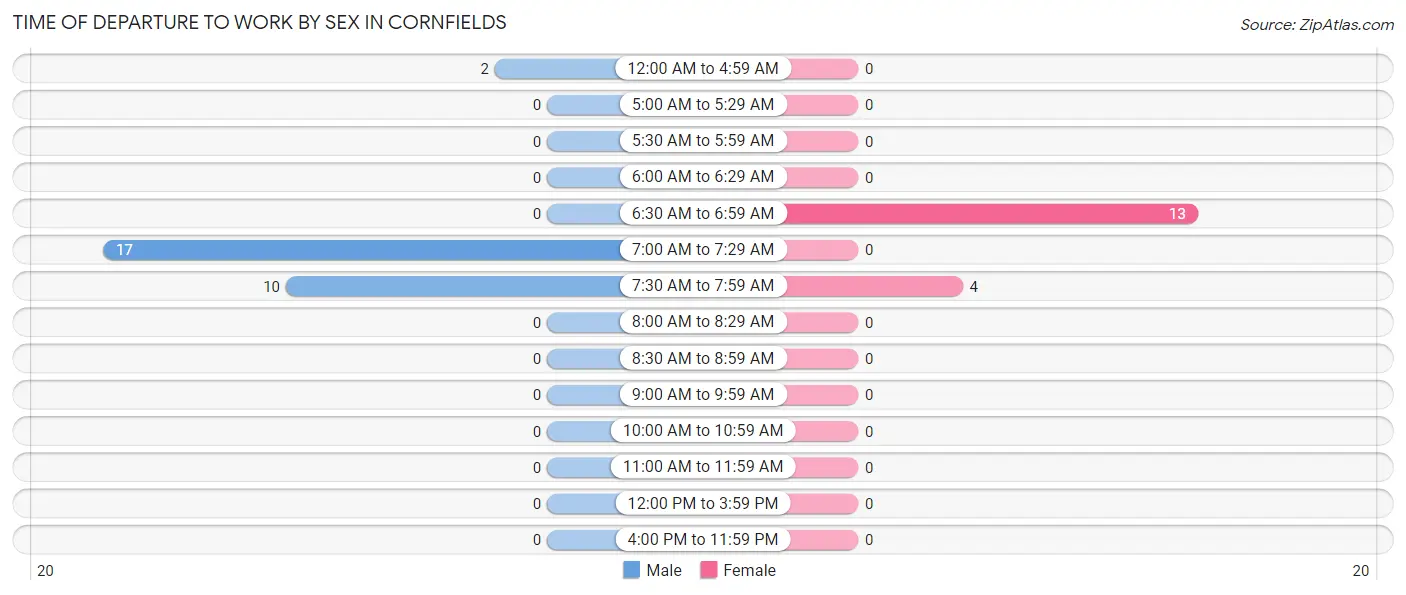
| Time of Departure | Male | Female |
| 12:00 AM to 4:59 AM | 2 (6.9%) | 0 (0.0%) |
| 5:00 AM to 5:29 AM | 0 (0.0%) | 0 (0.0%) |
| 5:30 AM to 5:59 AM | 0 (0.0%) | 0 (0.0%) |
| 6:00 AM to 6:29 AM | 0 (0.0%) | 0 (0.0%) |
| 6:30 AM to 6:59 AM | 0 (0.0%) | 13 (76.5%) |
| 7:00 AM to 7:29 AM | 17 (58.6%) | 0 (0.0%) |
| 7:30 AM to 7:59 AM | 10 (34.5%) | 4 (23.5%) |
| 8:00 AM to 8:29 AM | 0 (0.0%) | 0 (0.0%) |
| 8:30 AM to 8:59 AM | 0 (0.0%) | 0 (0.0%) |
| 9:00 AM to 9:59 AM | 0 (0.0%) | 0 (0.0%) |
| 10:00 AM to 10:59 AM | 0 (0.0%) | 0 (0.0%) |
| 11:00 AM to 11:59 AM | 0 (0.0%) | 0 (0.0%) |
| 12:00 PM to 3:59 PM | 0 (0.0%) | 0 (0.0%) |
| 4:00 PM to 11:59 PM | 0 (0.0%) | 0 (0.0%) |
| Total | 29 (100.0%) | 17 (100.0%) |
Housing Occupancy in Cornfields
Occupancy by Ownership in Cornfields
Of the total 57 dwellings in Cornfields, owner-occupied units account for 44 (77.2%), while renter-occupied units make up 13 (22.8%).
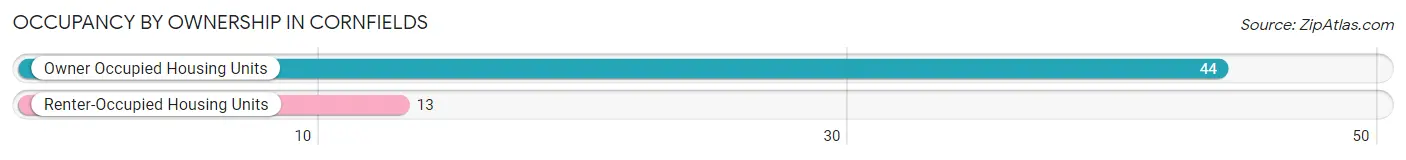
| Occupancy | # Housing Units | % Housing Units |
| Owner Occupied Housing Units | 44 | 77.2% |
| Renter-Occupied Housing Units | 13 | 22.8% |
| Total Occupied Housing Units | 57 | 100.0% |
Occupancy by Household Size in Cornfields
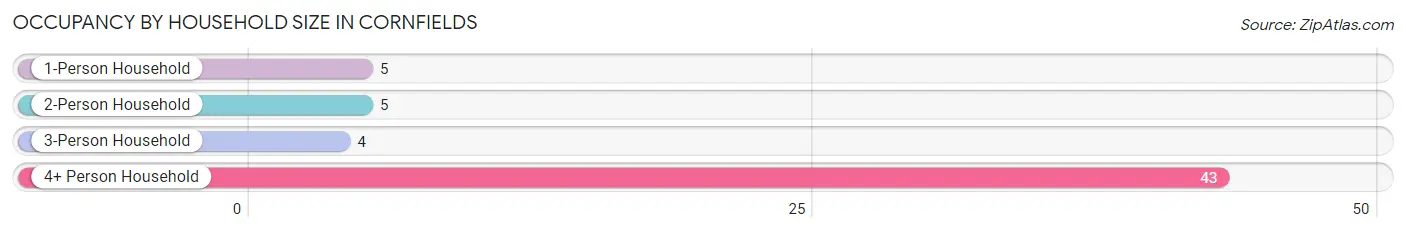
| Household Size | # Housing Units | % Housing Units |
| 1-Person Household | 5 | 8.8% |
| 2-Person Household | 5 | 8.8% |
| 3-Person Household | 4 | 7.0% |
| 4+ Person Household | 43 | 75.4% |
| Total Housing Units | 57 | 100.0% |
Occupancy by Ownership by Household Size in Cornfields
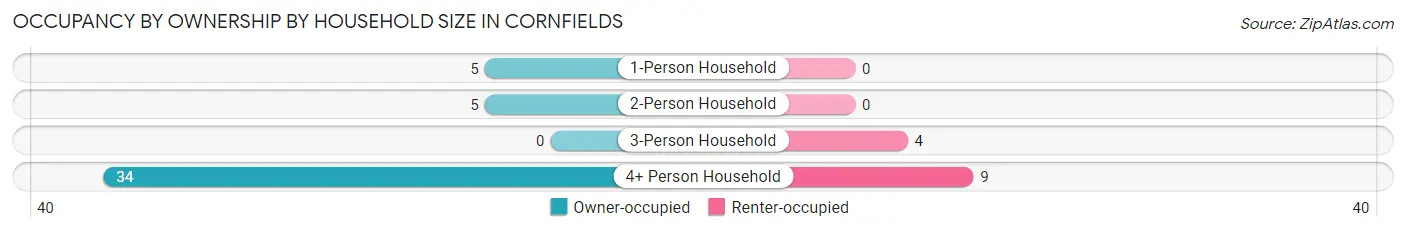
| Household Size | Owner-occupied | Renter-occupied |
| 1-Person Household | 5 (100.0%) | 0 (0.0%) |
| 2-Person Household | 5 (100.0%) | 0 (0.0%) |
| 3-Person Household | 0 (0.0%) | 4 (100.0%) |
| 4+ Person Household | 34 (79.1%) | 9 (20.9%) |
| Total Housing Units | 44 (77.2%) | 13 (22.8%) |
Occupancy by Educational Attainment in Cornfields
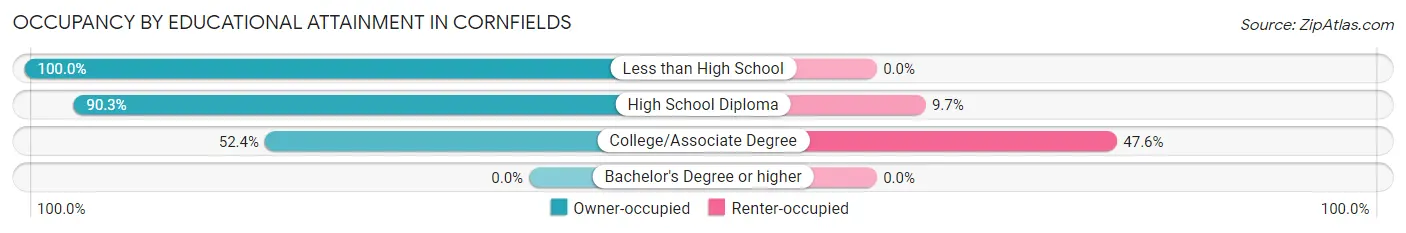
| Household Size | Owner-occupied | Renter-occupied |
| Less than High School | 5 (100.0%) | 0 (0.0%) |
| High School Diploma | 28 (90.3%) | 3 (9.7%) |
| College/Associate Degree | 11 (52.4%) | 10 (47.6%) |
| Bachelor's Degree or higher | 0 (0.0%) | 0 (0.0%) |
Occupancy by Age of Householder in Cornfields
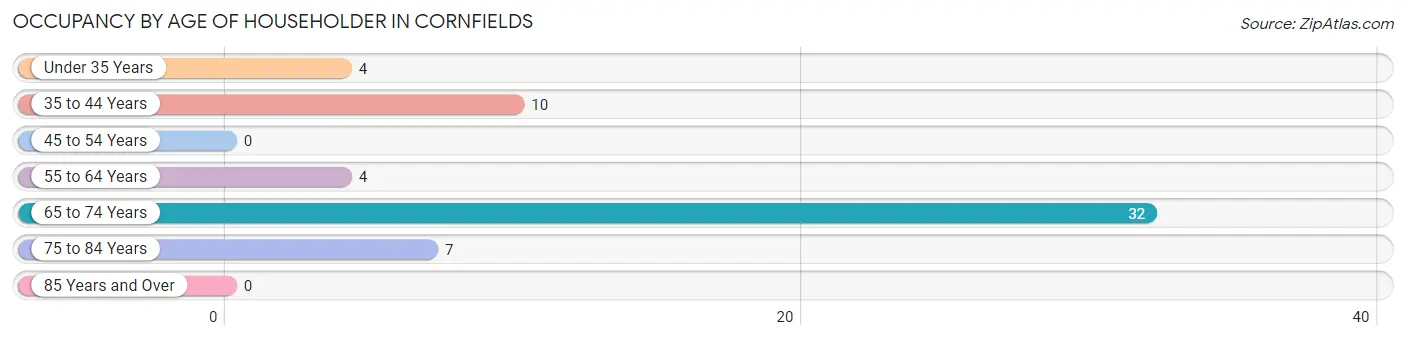
| Age Bracket | # Households | % Households |
| Under 35 Years | 4 | 7.0% |
| 35 to 44 Years | 10 | 17.5% |
| 45 to 54 Years | 0 | 0.0% |
| 55 to 64 Years | 4 | 7.0% |
| 65 to 74 Years | 32 | 56.1% |
| 75 to 84 Years | 7 | 12.3% |
| 85 Years and Over | 0 | 0.0% |
| Total | 57 | 100.0% |
Housing Finances in Cornfields
Median Income by Occupancy in Cornfields
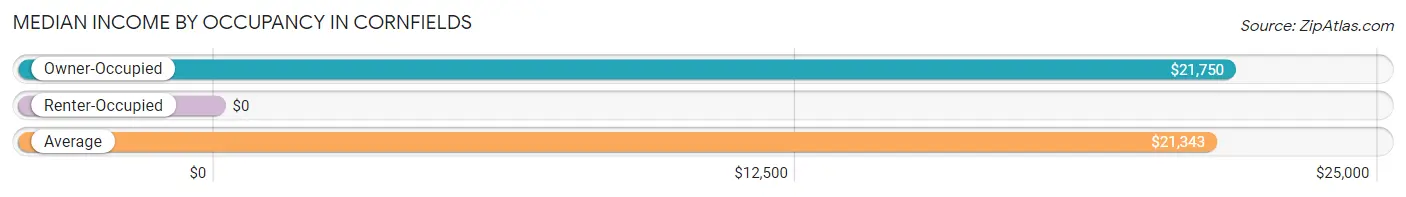
| Occupancy Type | # Households | Median Income |
| Owner-Occupied | 44 (77.2%) | $21,750 |
| Renter-Occupied | 13 (22.8%) | $0 |
| Average | 57 (100.0%) | $21,343 |
Occupancy by Householder Income Bracket in Cornfields
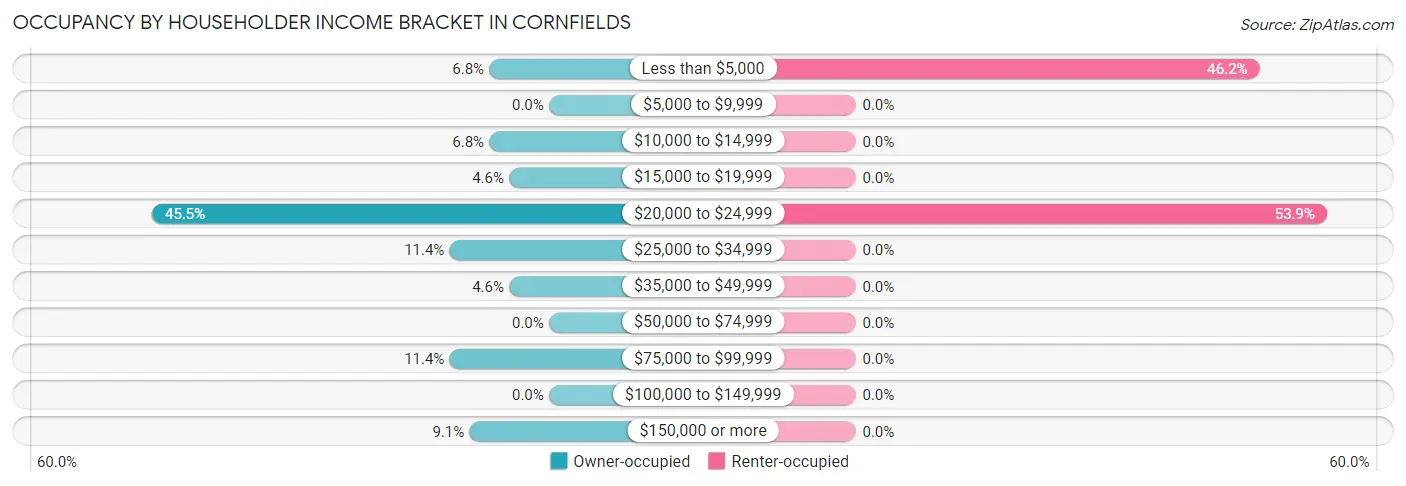
| Income Bracket | Owner-occupied | Renter-occupied |
| Less than $5,000 | 3 (6.8%) | 6 (46.2%) |
| $5,000 to $9,999 | 0 (0.0%) | 0 (0.0%) |
| $10,000 to $14,999 | 3 (6.8%) | 0 (0.0%) |
| $15,000 to $19,999 | 2 (4.5%) | 0 (0.0%) |
| $20,000 to $24,999 | 20 (45.5%) | 7 (53.8%) |
| $25,000 to $34,999 | 5 (11.4%) | 0 (0.0%) |
| $35,000 to $49,999 | 2 (4.5%) | 0 (0.0%) |
| $50,000 to $74,999 | 0 (0.0%) | 0 (0.0%) |
| $75,000 to $99,999 | 5 (11.4%) | 0 (0.0%) |
| $100,000 to $149,999 | 0 (0.0%) | 0 (0.0%) |
| $150,000 or more | 4 (9.1%) | 0 (0.0%) |
| Total | 44 (100.0%) | 13 (100.0%) |
Monthly Housing Cost Tiers in Cornfields
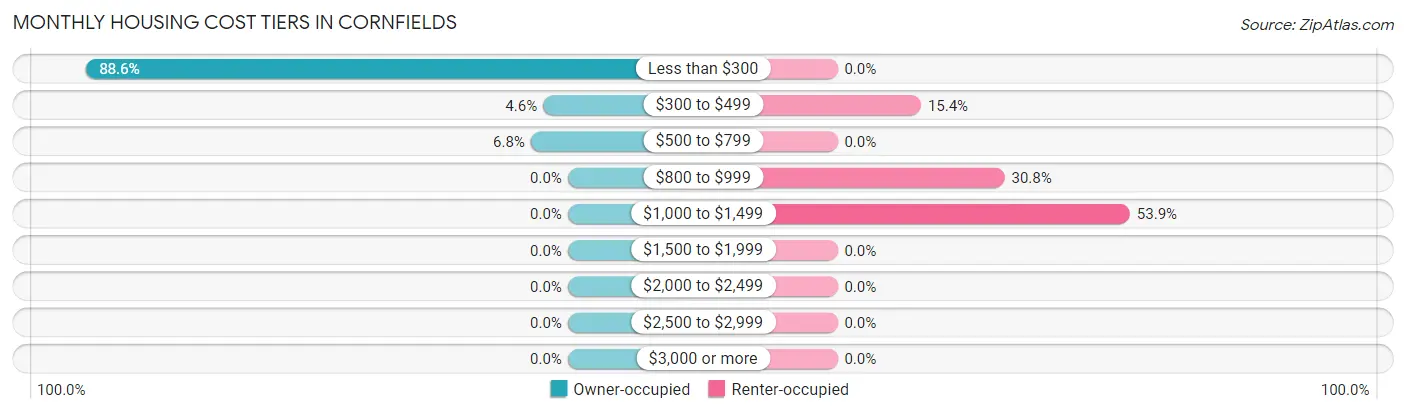
| Monthly Cost | Owner-occupied | Renter-occupied |
| Less than $300 | 39 (88.6%) | 0 (0.0%) |
| $300 to $499 | 2 (4.5%) | 2 (15.4%) |
| $500 to $799 | 3 (6.8%) | 0 (0.0%) |
| $800 to $999 | 0 (0.0%) | 4 (30.8%) |
| $1,000 to $1,499 | 0 (0.0%) | 7 (53.8%) |
| $1,500 to $1,999 | 0 (0.0%) | 0 (0.0%) |
| $2,000 to $2,499 | 0 (0.0%) | 0 (0.0%) |
| $2,500 to $2,999 | 0 (0.0%) | 0 (0.0%) |
| $3,000 or more | 0 (0.0%) | 0 (0.0%) |
| Total | 44 (100.0%) | 13 (100.0%) |
Physical Housing Characteristics in Cornfields
Housing Structures in Cornfields
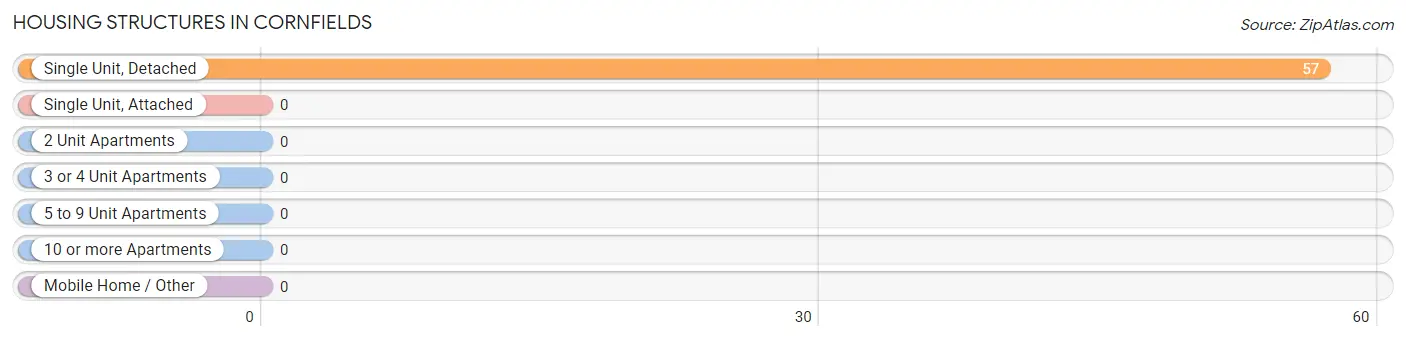
| Structure Type | # Housing Units | % Housing Units |
| Single Unit, Detached | 57 | 100.0% |
| Single Unit, Attached | 0 | 0.0% |
| 2 Unit Apartments | 0 | 0.0% |
| 3 or 4 Unit Apartments | 0 | 0.0% |
| 5 to 9 Unit Apartments | 0 | 0.0% |
| 10 or more Apartments | 0 | 0.0% |
| Mobile Home / Other | 0 | 0.0% |
| Total | 57 | 100.0% |
Housing Structures by Occupancy in Cornfields
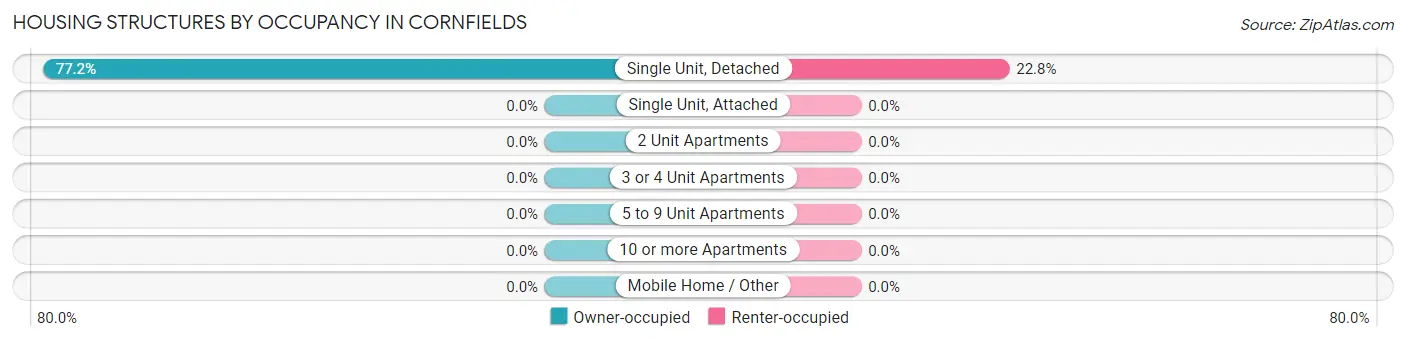
| Structure Type | Owner-occupied | Renter-occupied |
| Single Unit, Detached | 44 (77.2%) | 13 (22.8%) |
| Single Unit, Attached | 0 (0.0%) | 0 (0.0%) |
| 2 Unit Apartments | 0 (0.0%) | 0 (0.0%) |
| 3 or 4 Unit Apartments | 0 (0.0%) | 0 (0.0%) |
| 5 to 9 Unit Apartments | 0 (0.0%) | 0 (0.0%) |
| 10 or more Apartments | 0 (0.0%) | 0 (0.0%) |
| Mobile Home / Other | 0 (0.0%) | 0 (0.0%) |
| Total | 44 (77.2%) | 13 (22.8%) |
Housing Structures by Number of Rooms in Cornfields
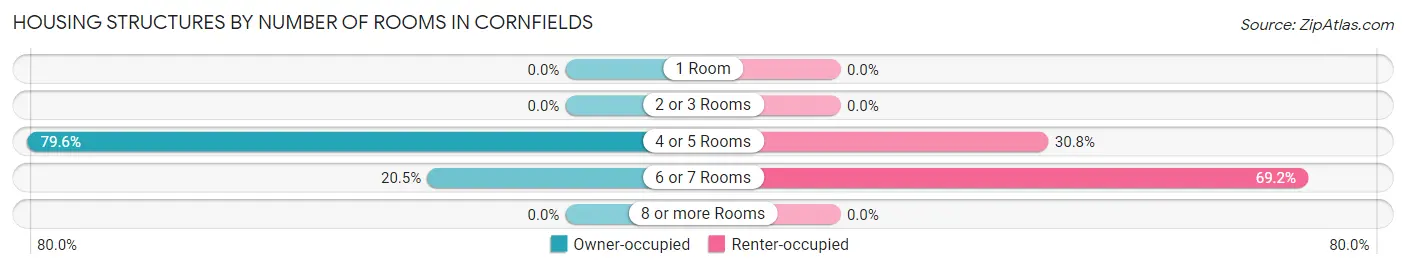
| Number of Rooms | Owner-occupied | Renter-occupied |
| 1 Room | 0 (0.0%) | 0 (0.0%) |
| 2 or 3 Rooms | 0 (0.0%) | 0 (0.0%) |
| 4 or 5 Rooms | 35 (79.5%) | 4 (30.8%) |
| 6 or 7 Rooms | 9 (20.4%) | 9 (69.2%) |
| 8 or more Rooms | 0 (0.0%) | 0 (0.0%) |
| Total | 44 (100.0%) | 13 (100.0%) |
Housing Structure by Heating Type in Cornfields

| Heating Type | Owner-occupied | Renter-occupied |
| Utility Gas | 0 (0.0%) | 0 (0.0%) |
| Bottled, Tank, or LP Gas | 0 (0.0%) | 9 (69.2%) |
| Electricity | 4 (9.1%) | 4 (30.8%) |
| Fuel Oil or Kerosene | 0 (0.0%) | 0 (0.0%) |
| Coal or Coke | 0 (0.0%) | 0 (0.0%) |
| All other Fuels | 40 (90.9%) | 0 (0.0%) |
| No Fuel Used | 0 (0.0%) | 0 (0.0%) |
| Total | 44 (100.0%) | 13 (100.0%) |
Household Vehicle Usage in Cornfields
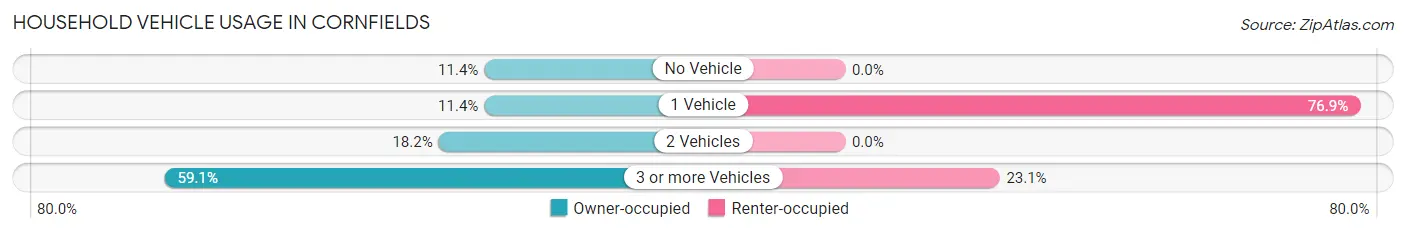
| Vehicles per Household | Owner-occupied | Renter-occupied |
| No Vehicle | 5 (11.4%) | 0 (0.0%) |
| 1 Vehicle | 5 (11.4%) | 10 (76.9%) |
| 2 Vehicles | 8 (18.2%) | 0 (0.0%) |
| 3 or more Vehicles | 26 (59.1%) | 3 (23.1%) |
| Total | 44 (100.0%) | 13 (100.0%) |
Real Estate & Mortgages in Cornfields
Real Estate and Mortgage Overview in Cornfields
| Characteristic | Without Mortgage | With Mortgage |
| Housing Units | 44 | 0 |
| Median Property Value | $32,800 | $0 |
| Median Household Income | $21,750 | $0 |
| Monthly Housing Costs | $258 | $0 |
| Real Estate Taxes | - | - |
Property Value by Mortgage Status in Cornfields
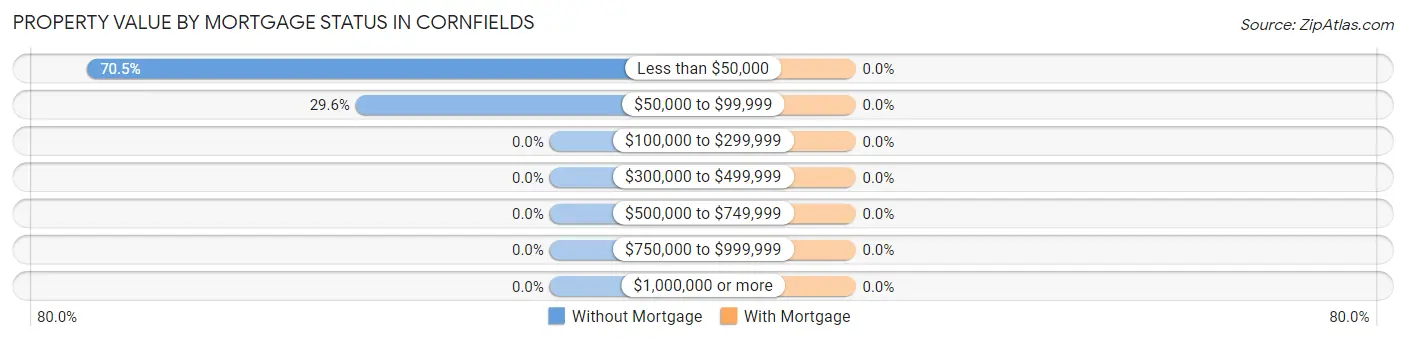
| Property Value | Without Mortgage | With Mortgage |
| Less than $50,000 | 31 (70.5%) | 0 (0.0%) |
| $50,000 to $99,999 | 13 (29.5%) | 0 (0.0%) |
| $100,000 to $299,999 | 0 (0.0%) | 0 (0.0%) |
| $300,000 to $499,999 | 0 (0.0%) | 0 (0.0%) |
| $500,000 to $749,999 | 0 (0.0%) | 0 (0.0%) |
| $750,000 to $999,999 | 0 (0.0%) | 0 (0.0%) |
| $1,000,000 or more | 0 (0.0%) | 0 (0.0%) |
| Total | 44 (100.0%) | 0 (0.0%) |
Household Income by Mortgage Status in Cornfields
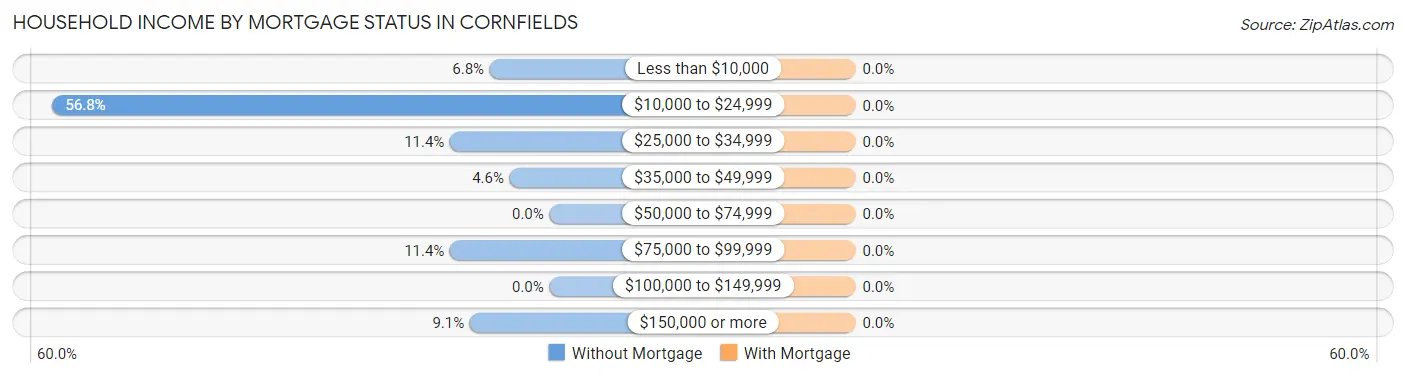
| Household Income | Without Mortgage | With Mortgage |
| Less than $10,000 | 3 (6.8%) | 0 (0.0%) |
| $10,000 to $24,999 | 25 (56.8%) | 0 (0.0%) |
| $25,000 to $34,999 | 5 (11.4%) | 0 (0.0%) |
| $35,000 to $49,999 | 2 (4.5%) | 0 (0.0%) |
| $50,000 to $74,999 | 0 (0.0%) | 0 (0.0%) |
| $75,000 to $99,999 | 5 (11.4%) | 0 (0.0%) |
| $100,000 to $149,999 | 0 (0.0%) | 0 (0.0%) |
| $150,000 or more | 4 (9.1%) | 0 (0.0%) |
| Total | 44 (100.0%) | 0 (0.0%) |
Property Value to Household Income Ratio in Cornfields
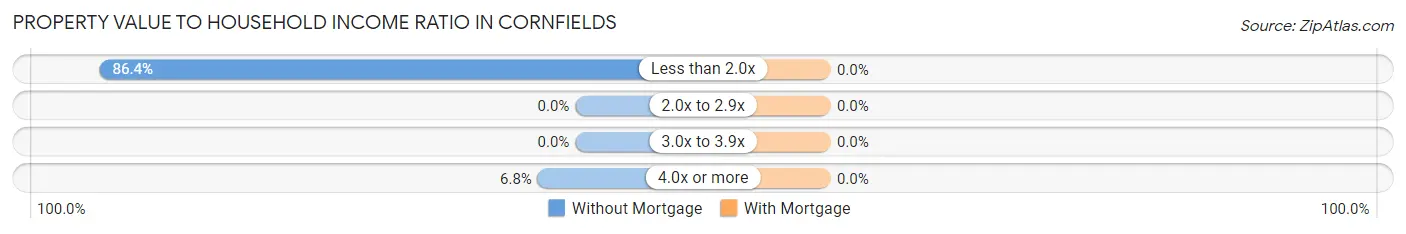
| Value-to-Income Ratio | Without Mortgage | With Mortgage |
| Less than 2.0x | 38 (86.4%) | 0 (0.0%) |
| 2.0x to 2.9x | 0 (0.0%) | 0 (0.0%) |
| 3.0x to 3.9x | 0 (0.0%) | 0 (0.0%) |
| 4.0x or more | 3 (6.8%) | 0 (0.0%) |
| Total | 44 (100.0%) | 0 (0.0%) |
Real Estate Taxes by Mortgage Status in Cornfields
| Property Taxes | Without Mortgage | With Mortgage |
| Less than $800 | 0 (0.0%) | 0 (0.0%) |
| $800 to $1,499 | 0 (0.0%) | 0 (0.0%) |
| $800 to $1,499 | 0 (0.0%) | 0 (0.0%) |
| Total | 44 (100.0%) | 0 (0.0%) |
Health & Disability in Cornfields
Health Insurance Coverage by Age in Cornfields
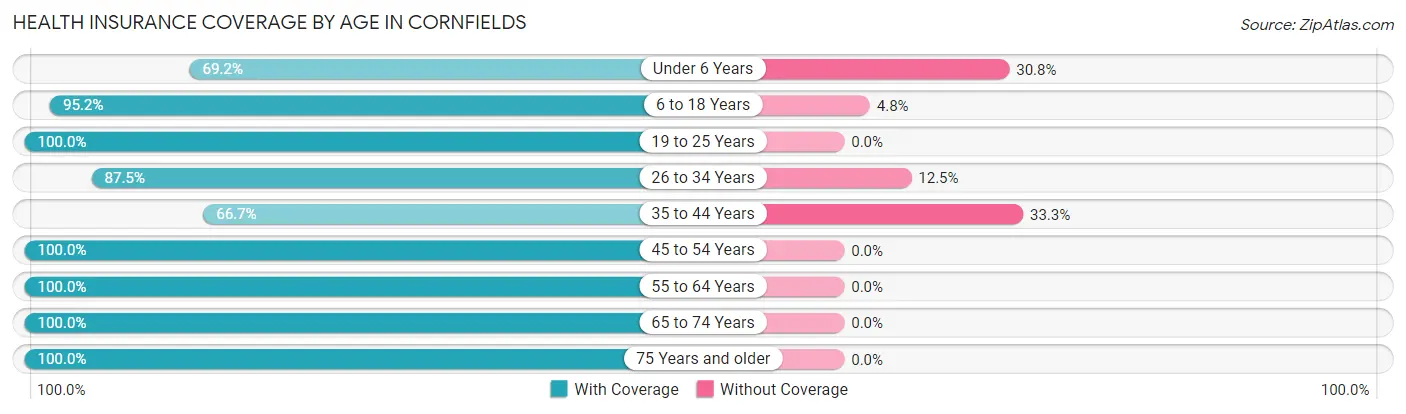
| Age Bracket | With Coverage | Without Coverage |
| Under 6 Years | 9 (69.2%) | 4 (30.8%) |
| 6 to 18 Years | 80 (95.2%) | 4 (4.8%) |
| 19 to 25 Years | 37 (100.0%) | 0 (0.0%) |
| 26 to 34 Years | 28 (87.5%) | 4 (12.5%) |
| 35 to 44 Years | 28 (66.7%) | 14 (33.3%) |
| 45 to 54 Years | 9 (100.0%) | 0 (0.0%) |
| 55 to 64 Years | 4 (100.0%) | 0 (0.0%) |
| 65 to 74 Years | 36 (100.0%) | 0 (0.0%) |
| 75 Years and older | 24 (100.0%) | 0 (0.0%) |
| Total | 255 (90.7%) | 26 (9.2%) |
Health Insurance Coverage by Citizenship Status in Cornfields
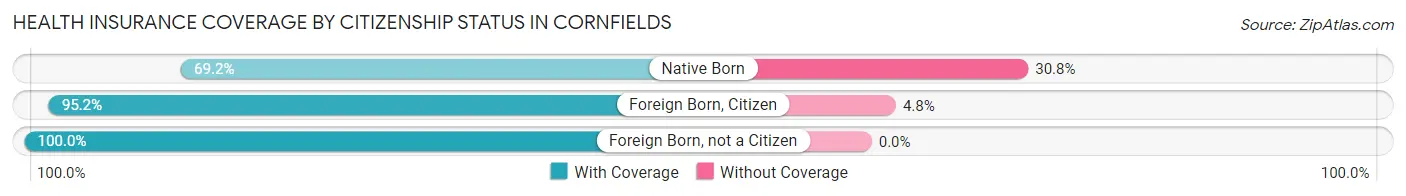
| Citizenship Status | With Coverage | Without Coverage |
| Native Born | 9 (69.2%) | 4 (30.8%) |
| Foreign Born, Citizen | 80 (95.2%) | 4 (4.8%) |
| Foreign Born, not a Citizen | 37 (100.0%) | 0 (0.0%) |
Health Insurance Coverage by Household Income in Cornfields
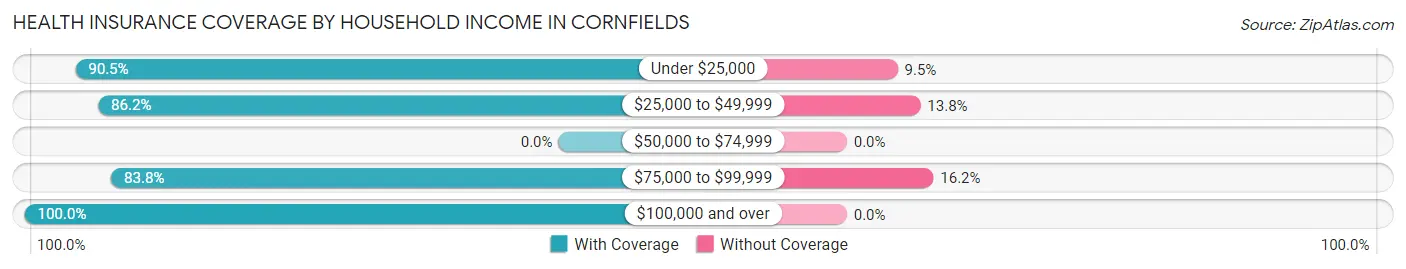
| Household Income | With Coverage | Without Coverage |
| Under $25,000 | 152 (90.5%) | 16 (9.5%) |
| $25,000 to $49,999 | 25 (86.2%) | 4 (13.8%) |
| $50,000 to $74,999 | 0 (0.0%) | 0 (0.0%) |
| $75,000 to $99,999 | 31 (83.8%) | 6 (16.2%) |
| $100,000 and over | 33 (100.0%) | 0 (0.0%) |
Public vs Private Health Insurance Coverage by Age in Cornfields
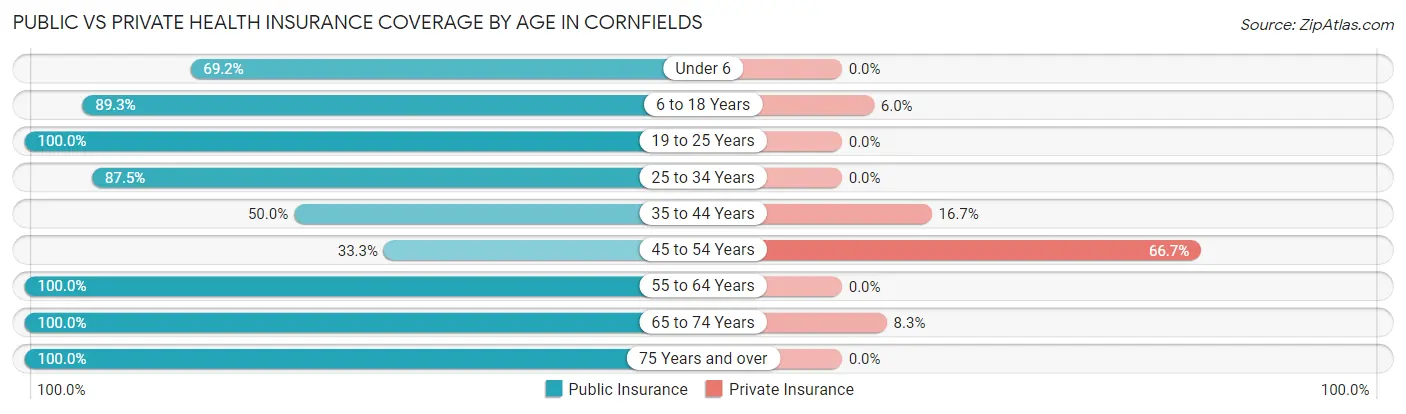
| Age Bracket | Public Insurance | Private Insurance |
| Under 6 | 9 (69.2%) | 0 (0.0%) |
| 6 to 18 Years | 75 (89.3%) | 5 (5.9%) |
| 19 to 25 Years | 37 (100.0%) | 0 (0.0%) |
| 25 to 34 Years | 28 (87.5%) | 0 (0.0%) |
| 35 to 44 Years | 21 (50.0%) | 7 (16.7%) |
| 45 to 54 Years | 3 (33.3%) | 6 (66.7%) |
| 55 to 64 Years | 4 (100.0%) | 0 (0.0%) |
| 65 to 74 Years | 36 (100.0%) | 3 (8.3%) |
| 75 Years and over | 24 (100.0%) | 0 (0.0%) |
| Total | 237 (84.3%) | 21 (7.5%) |
Disability Status by Sex by Age in Cornfields
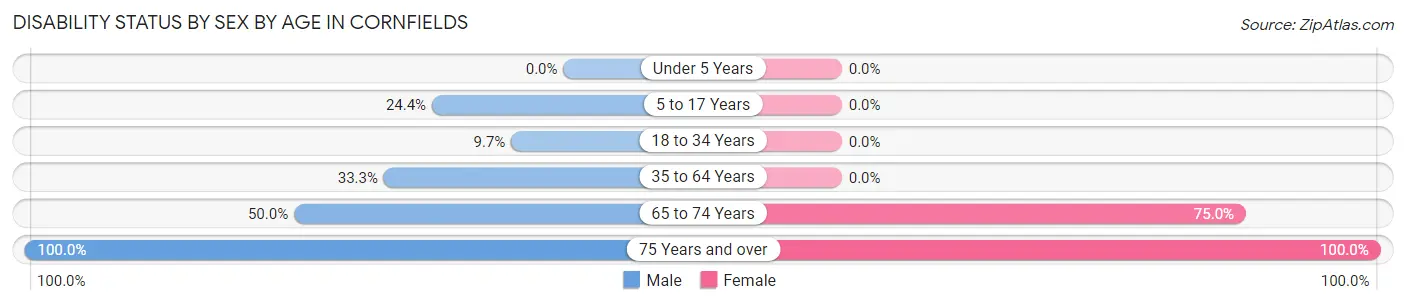
| Age Bracket | Male | Female |
| Under 5 Years | 0 (0.0%) | 0 (0.0%) |
| 5 to 17 Years | 10 (24.4%) | 0 (0.0%) |
| 18 to 34 Years | 3 (9.7%) | 0 (0.0%) |
| 35 to 64 Years | 9 (33.3%) | 0 (0.0%) |
| 65 to 74 Years | 2 (50.0%) | 24 (75.0%) |
| 75 Years and over | 19 (100.0%) | 5 (100.0%) |
Disability Class by Sex by Age in Cornfields
Disability Class: Hearing Difficulty
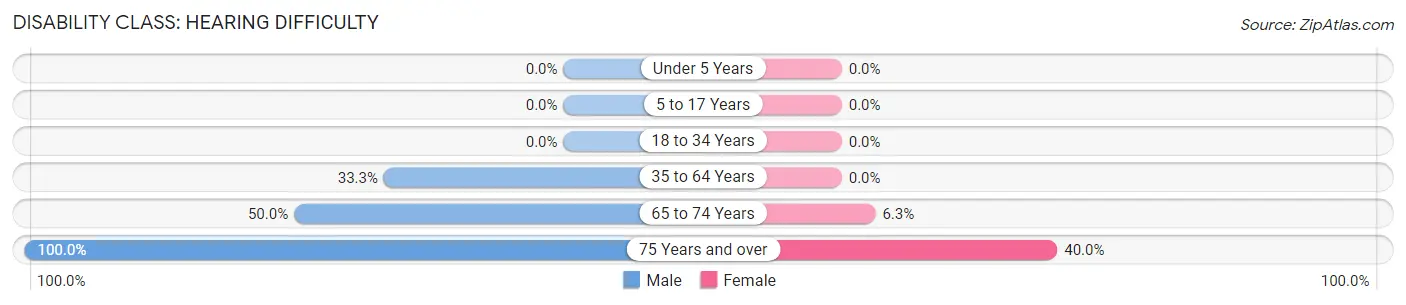
| Age Bracket | Male | Female |
| Under 5 Years | 0 (0.0%) | 0 (0.0%) |
| 5 to 17 Years | 0 (0.0%) | 0 (0.0%) |
| 18 to 34 Years | 0 (0.0%) | 0 (0.0%) |
| 35 to 64 Years | 9 (33.3%) | 0 (0.0%) |
| 65 to 74 Years | 2 (50.0%) | 2 (6.2%) |
| 75 Years and over | 19 (100.0%) | 2 (40.0%) |
Disability Class: Vision Difficulty
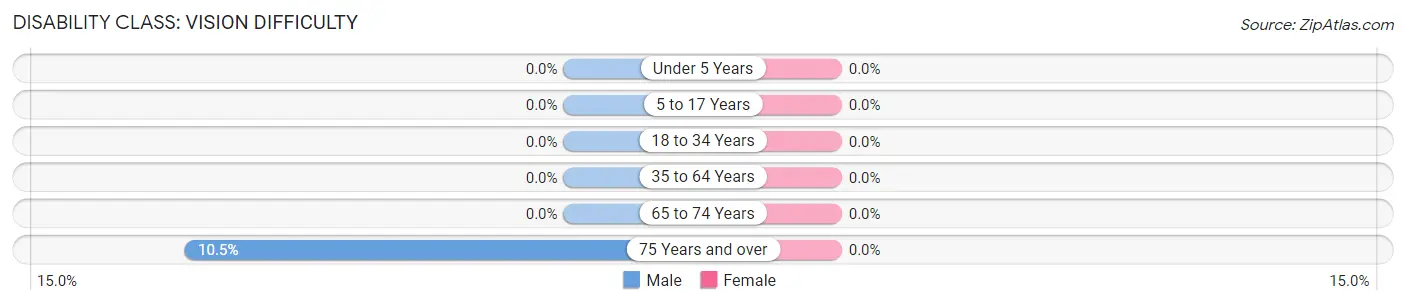
| Age Bracket | Male | Female |
| Under 5 Years | 0 (0.0%) | 0 (0.0%) |
| 5 to 17 Years | 0 (0.0%) | 0 (0.0%) |
| 18 to 34 Years | 0 (0.0%) | 0 (0.0%) |
| 35 to 64 Years | 0 (0.0%) | 0 (0.0%) |
| 65 to 74 Years | 0 (0.0%) | 0 (0.0%) |
| 75 Years and over | 2 (10.5%) | 0 (0.0%) |
Disability Class: Cognitive Difficulty
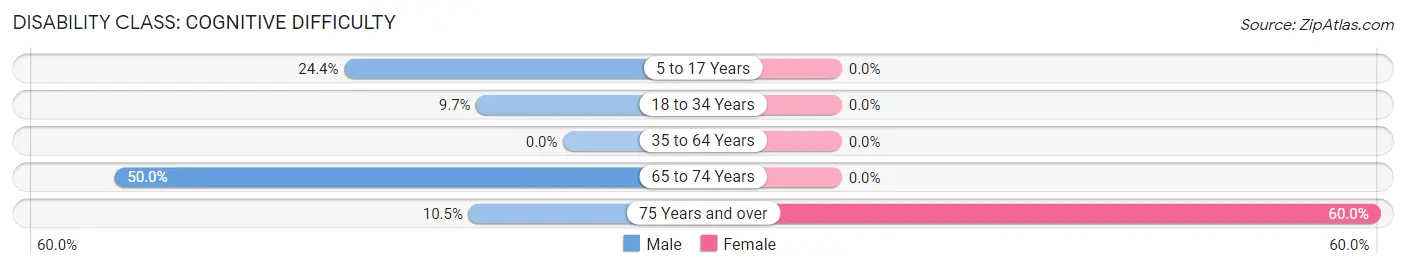
| Age Bracket | Male | Female |
| 5 to 17 Years | 10 (24.4%) | 0 (0.0%) |
| 18 to 34 Years | 3 (9.7%) | 0 (0.0%) |
| 35 to 64 Years | 0 (0.0%) | 0 (0.0%) |
| 65 to 74 Years | 2 (50.0%) | 0 (0.0%) |
| 75 Years and over | 2 (10.5%) | 3 (60.0%) |
Disability Class: Ambulatory Difficulty
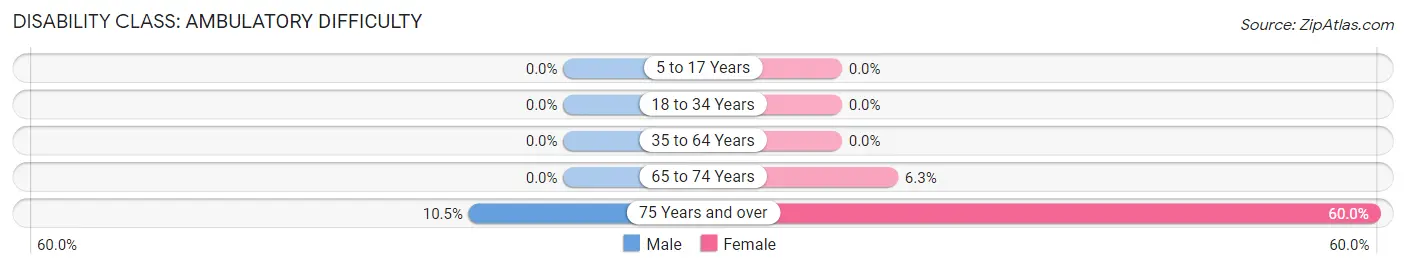
| Age Bracket | Male | Female |
| 5 to 17 Years | 0 (0.0%) | 0 (0.0%) |
| 18 to 34 Years | 0 (0.0%) | 0 (0.0%) |
| 35 to 64 Years | 0 (0.0%) | 0 (0.0%) |
| 65 to 74 Years | 0 (0.0%) | 2 (6.2%) |
| 75 Years and over | 2 (10.5%) | 3 (60.0%) |
Disability Class: Self-Care Difficulty
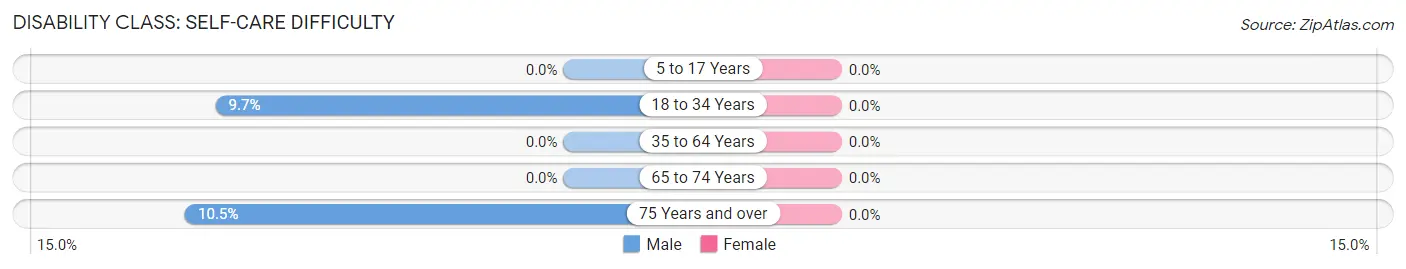
| Age Bracket | Male | Female |
| 5 to 17 Years | 0 (0.0%) | 0 (0.0%) |
| 18 to 34 Years | 3 (9.7%) | 0 (0.0%) |
| 35 to 64 Years | 0 (0.0%) | 0 (0.0%) |
| 65 to 74 Years | 0 (0.0%) | 0 (0.0%) |
| 75 Years and over | 2 (10.5%) | 0 (0.0%) |
Technology Access in Cornfields
Computing Device Access in Cornfields
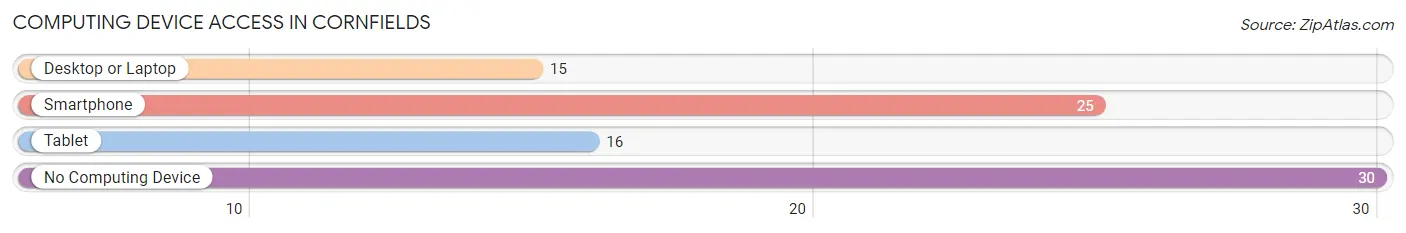
| Device Type | # Households | % Households |
| Desktop or Laptop | 15 | 26.3% |
| Smartphone | 25 | 43.9% |
| Tablet | 16 | 28.1% |
| No Computing Device | 30 | 52.6% |
| Total | 57 | 100.0% |
Internet Access in Cornfields
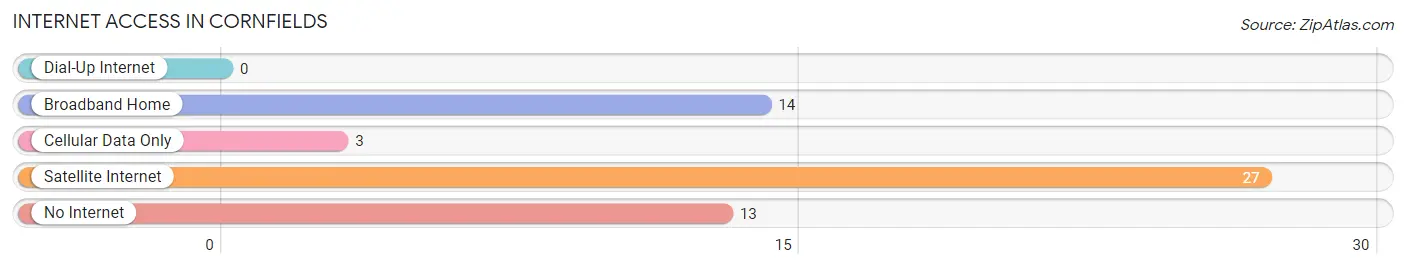
| Internet Type | # Households | % Households |
| Dial-Up Internet | 0 | 0.0% |
| Broadband Home | 14 | 24.6% |
| Cellular Data Only | 3 | 5.3% |
| Satellite Internet | 27 | 47.4% |
| No Internet | 13 | 22.8% |
| Total | 57 | 100.0% |
Cornfields Summary
Cornfields, Arizona is a small town located in the southeastern corner of the state, near the border with New Mexico. It is part of the Navajo Nation and is home to a population of approximately 1,000 people. The town is known for its agricultural production, particularly corn, and is a popular tourist destination due to its proximity to the Grand Canyon.
Geography
Cornfields is located in the southeastern corner of Arizona, near the border with New Mexico. It is situated in the Navajo Nation, which is the largest Native American reservation in the United States. The town is located in the high desert, at an elevation of 4,500 feet. The climate is arid, with hot summers and cold winters. The area receives an average of 8 inches of precipitation per year.
The town is surrounded by the Navajo Nation Reservation, which covers more than 27,000 square miles. The reservation is home to a variety of wildlife, including deer, elk, antelope, and bighorn sheep. The area is also home to a variety of plant life, including cacti, yucca, and sagebrush.
Economy
The economy of Cornfields is largely based on agriculture. The town is known for its production of corn, which is used for both human and animal consumption. Other crops grown in the area include alfalfa, wheat, and hay. The town is also home to a number of small businesses, including restaurants, convenience stores, and gas stations.
Tourism is also an important part of the local economy. The town is located near the Grand Canyon, which is one of the most popular tourist destinations in the United States. The town also has a number of attractions, including a museum, a golf course, and a rodeo.
Demographics
As of the 2010 census, the population of Cornfields was 1,000. The town is predominantly Native American, with the majority of the population belonging to the Navajo Nation. The median age of the population is 33. The median household income is $25,000, and the median home value is $90,000.
Conclusion
Cornfields, Arizona is a small town located in the southeastern corner of the state, near the border with New Mexico. It is part of the Navajo Nation and is home to a population of approximately 1,000 people. The town is known for its agricultural production, particularly corn, and is a popular tourist destination due to its proximity to the Grand Canyon. The economy of Cornfields is largely based on agriculture, with corn being the primary crop. Tourism is also an important part of the local economy. The town is predominantly Native American, with the majority of the population belonging to the Navajo Nation.
Common Questions
What is Per Capita Income in Cornfields?
Per Capita income in Cornfields is $10,974.
What is the Median Family Income in Cornfields?
Median Family Income in Cornfields is $12,125.
What is the Median Household income in Cornfields?
Median Household Income in Cornfields is $21,343.
What is Income or Wage Gap in Cornfields?
Income or Wage Gap in Cornfields is 20.0%.
Women in Cornfields earn 80.0 cents for every dollar earned by a man.
What is Inequality or Gini Index in Cornfields?
Inequality or Gini Index in Cornfields is 0.55.
What is the Total Population of Cornfields?
Total Population of Cornfields is 281.
What is the Total Male Population of Cornfields?
Total Male Population of Cornfields is 126.
What is the Total Female Population of Cornfields?
Total Female Population of Cornfields is 155.
What is the Ratio of Males per 100 Females in Cornfields?
There are 81.29 Males per 100 Females in Cornfields.
What is the Ratio of Females per 100 Males in Cornfields?
There are 123.02 Females per 100 Males in Cornfields.
What is the Median Population Age in Cornfields?
Median Population Age in Cornfields is 28.2 Years.
What is the Average Family Size in Cornfields
Average Family Size in Cornfields is 4.8 People.
What is the Average Household Size in Cornfields
Average Household Size in Cornfields is 4.7 People.
How Large is the Labor Force in Cornfields?
There are 51 People in the Labor Forcein in Cornfields.
What is the Percentage of People in the Labor Force in Cornfields?
25.8% of People are in the Labor Force in Cornfields.
What is the Unemployment Rate in Cornfields?
Unemployment Rate in Cornfields is 9.8%.